
Abstract
To deeply study the variation characteristics of the gas content in the process of gas adsorption for coal samples under different gas pressures and confining pressures, low-field nuclear magnetic resonance technology was used to carry out experimental research on the gas adsorption of coal. The relationship between the T2 spectrum amplitude integral and the gas quantity was analyzed. The results show the following: (1) When the samples were inflated for 11 h at each gas pressure point (0.31, 0.74, 1.11, and 1.46 MPa), after ∼5 h of adsorption, the amount of adsorbed gas exceeded 85.0% of the total adsorption capacity; additionally, as the adsorption time increased, the amount of adsorbed gas gradually tended to stabilize. When the gas pressure was >1 MPa, the amount of adsorbed gas exceeded 90.0% of the total adsorption capacity; Higher the pressure of aerated gas, greater the gas pressure gradient or concentration gradient on the surface of the coal sample and the greater the driving force for gas molecules to seep or diffuse into the coal sample. (2) When the samples were inflated for 11 h at each confining pressure point (3, 4, 5, and 7 MPa), the adsorbed gas increased by ∼85.0% of the total adsorbed gas in the first 5 h. When the pressure was <5 MPa, the amount of adsorbed gas exceeded 85.0% of the total amount of adsorption; that is, the increase in adsorbed gas was the largest at ∼5 h in the adsorption process for the columnar coal sample under different confining pressures, and the increase was ∼5.0% from 7–11 h. When the large pores in the coal sample closed, the amount of gas that seeped into the deep part of the coal sample within the same aeration time was reduced.
Keywords
Introduction
The exploration and development of China's coalbed methane (mainly gas) are gradually proceeding to coal mines in the western regions of the country. This region is rich in coal resources, and the degree of coal metamorphism is low. In addition, coal is rich in coalbed methane as an energy resource. The successful exploration and development of foreign low-rank coalbed methane have inspired the coalbed methane industry. Low-rank coalbed methane resources are available for mining development and have commercial value. Coalbeds have attracted great attention from many countries because of their great significance for greenhouse gas reduction, mining safety promotion, and solving the supply–demand contradiction for natural gases (Ma et al., 2020). Currently, the extraction of mine gas remains one of the main measures for mine gas utilization and gas management. Deeper coal mine depths and increases in ground stress and gas pressure have an impact on the characteristics of coal pores. The pore structure, size, and size distribution in coal are related to the adsorption and permeability of coal. In the coal body, the adsorbed methane and free methane are in dynamic equilibrium under the condition of unchanged external conditions. During the coal mining process, the movement balance will be destroyed due to mining disturbances.
Scholars have conducted series of studies on the adsorption capacity of coal and the corresponding influential factors. Some scholars have found that the coal pore structure has an impact on gas adsorption (Li et al., 2013; Wang and Li, 2015; Yan et al., 2018), while others have studied the effects of gas pressure, moisture, and fixed carbon on gas adsorption (He et al., 2010; Levy et al., 1997; Li and Nie 2006; Zhong et al., 2002; Zhou et al., 2019). He et al. (2010) confirmed through test results that temperature increase is not conducive to gas adsorption, but is one of the factors that induce a large amount of desorption of adsorbed gas in coal samples. (Alexeev et al., 2004) used nuclear magnetic resonance (NMR) technology to discover solid solution methane for the first time and studied its influence on the amount of gas adsorption. Li (2017) used NMR technology to study the influence of gas pressure and moisture on adsorption by anthracite coal and found that the increase in gas pressure had the greatest impact on coal sample adsorption during the first 3 h. Xu and Wu 2019 studied the influence of gas pressure on coal adsorption and found that coal porosity increases with increasing gas pressure. For methane pressures of 1.04–6.09 MPa, almost all adsorption equilibria are found to occur within one hour (Yao et al., 2014). Research by (Zhou and Lin1999) showed that at a given temperature, the amount of gas adsorbed by a coal sample changes with gas pressure. When the latter is >3.0 MPa, the amount of gas adsorbed tends to be constant. In terms of the influence of temperature on coal adsorption, when the gas pressure is constant, its capacity will decrease by 1.2 cm3 g−1 when the temperature increases by 1 °C (Zhang et al., 2005). The gas production of coal and the specific surface area of coal are related to the degree of coal metamorphism. From medium metamorphic bituminous coal to anthracite, the corresponding adsorption capacity increases rapidly (Cui et al., 2005; Lu et al., 2014). The amount of gas adsorbed on the coal surface is closely related to the surface area of the coal, which is in turn related to the characteristics of the coal pores. The characteristics of the coal pores play an important role in the adsorption of gas by coal. Liu et al. (2019) have used atomic force microscopy equipment to quantitatively and intuitively analyze the characteristics of coal nanopores, while Liao et al. (2021) have studied the damage characteristics of the microstructure of coal by phase change fracturing with liquid CO2. On the other hand, Liu et al. (2016) adopt image analysis and gas adsorption to analyze the fractal characteristics of coal samples. The gas adsorption kinetics in a coal reservoir is a comprehensive dynamic process involving the gas seepage stage, bulk diffusion stage, surface diffusion stage, and gas adsorption stage (Pillalamarry et al., 2011).
The above-stated research mainly concentrates on the factors that influence coal gas adsorption from a macroperspective and little attention is given to the effects of gas pressure and confining pressure on the process of methane adsorption by coal samples. Most scholars use pulverized coal as experimental samples; however, this approach destroys the original physical parameters of coal to a certain extent, such as the adsorption pore volume, specific surface area of pores, pore fissure structure, and gas migration channels. In this study, the author used low-field NMR technology, which is a nondestructive method and can also quantitatively characterize the changes in adsorbed and free methane with adsorption conditions during the adsorption process. Much useful information about the behavior of coal during the adsorption process can be obtained from NMR measurements. An important extension of this work is to explore the mechanism of methane adsorption for different coals by using the NMR method provided.
Experimental process
Basic principles of NMR
NMR technology is based on a hydrogen nucleus under the action of an external superimposed magnetic field. The resonance relaxation phenomenon between the hydrogen nucleus and the external magnetic field is used to study the relaxation characteristics of hydrogen-containing fluids such as H2O and CH4 in the pores of coal and rock. The pore distribution characteristics in coal and rock masses are studied by obtaining the nuclear magnetic signal intensity and T2 spectrum. The principle of NMR T2 (Tang and Pan 2011) is expressed as:

Formula (1) shows that the transverse relaxation time (T2) is proportional to the size of the pore radius. As different pore sizes correspond to different relaxation times, the size of the aperture can be distinguished according to the different relaxation times (Shi and Pan 2006).
When the adsorbate is methane, that is, if the coal adsorbs methane and exhibits a T2 spectrum, each T2 time corresponds to a gas signal amplitude on the vertical axis, and this amplitude is proportional to the number of methane molecules (Deng and Xie, 2010). Therefore, each T2 value corresponding to a methane signal amplitude can be superimposed, that is, the T2 spectrum amplitude integral can be used to characterize the methane quality in the pore.
Experimental coal samples and experimental equipment
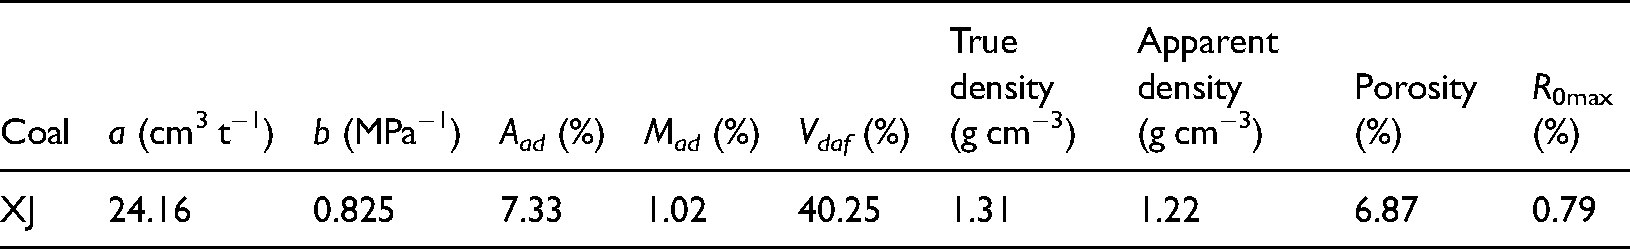
The test coal sample was collected from the Aiweiergou Mine in Xinjiang. In 2013, the mine was identified as a high-gas mine with a high coal-seam gas content. The industrial analysis and physical properties of the test coal samples are shown in Table 1.
Industrial analysis and pore structure for coal samples.
The NMR measurement apparatus was a MesoMR23-060H-I spectrometer manufactured by Niumag Corporation Ltd, China. The instrument uses a frequency of 21.67568 MHz, a magnetic strength of 0.5 T, and a magnet coil diameter of 60 mm. The temperature of the spectrometer and the analyzed samples were held constant at 32 ± 0.1 °C. A physical image and system diagram of the low-field NMR experimental system are shown in Figure 1(a) and (b).
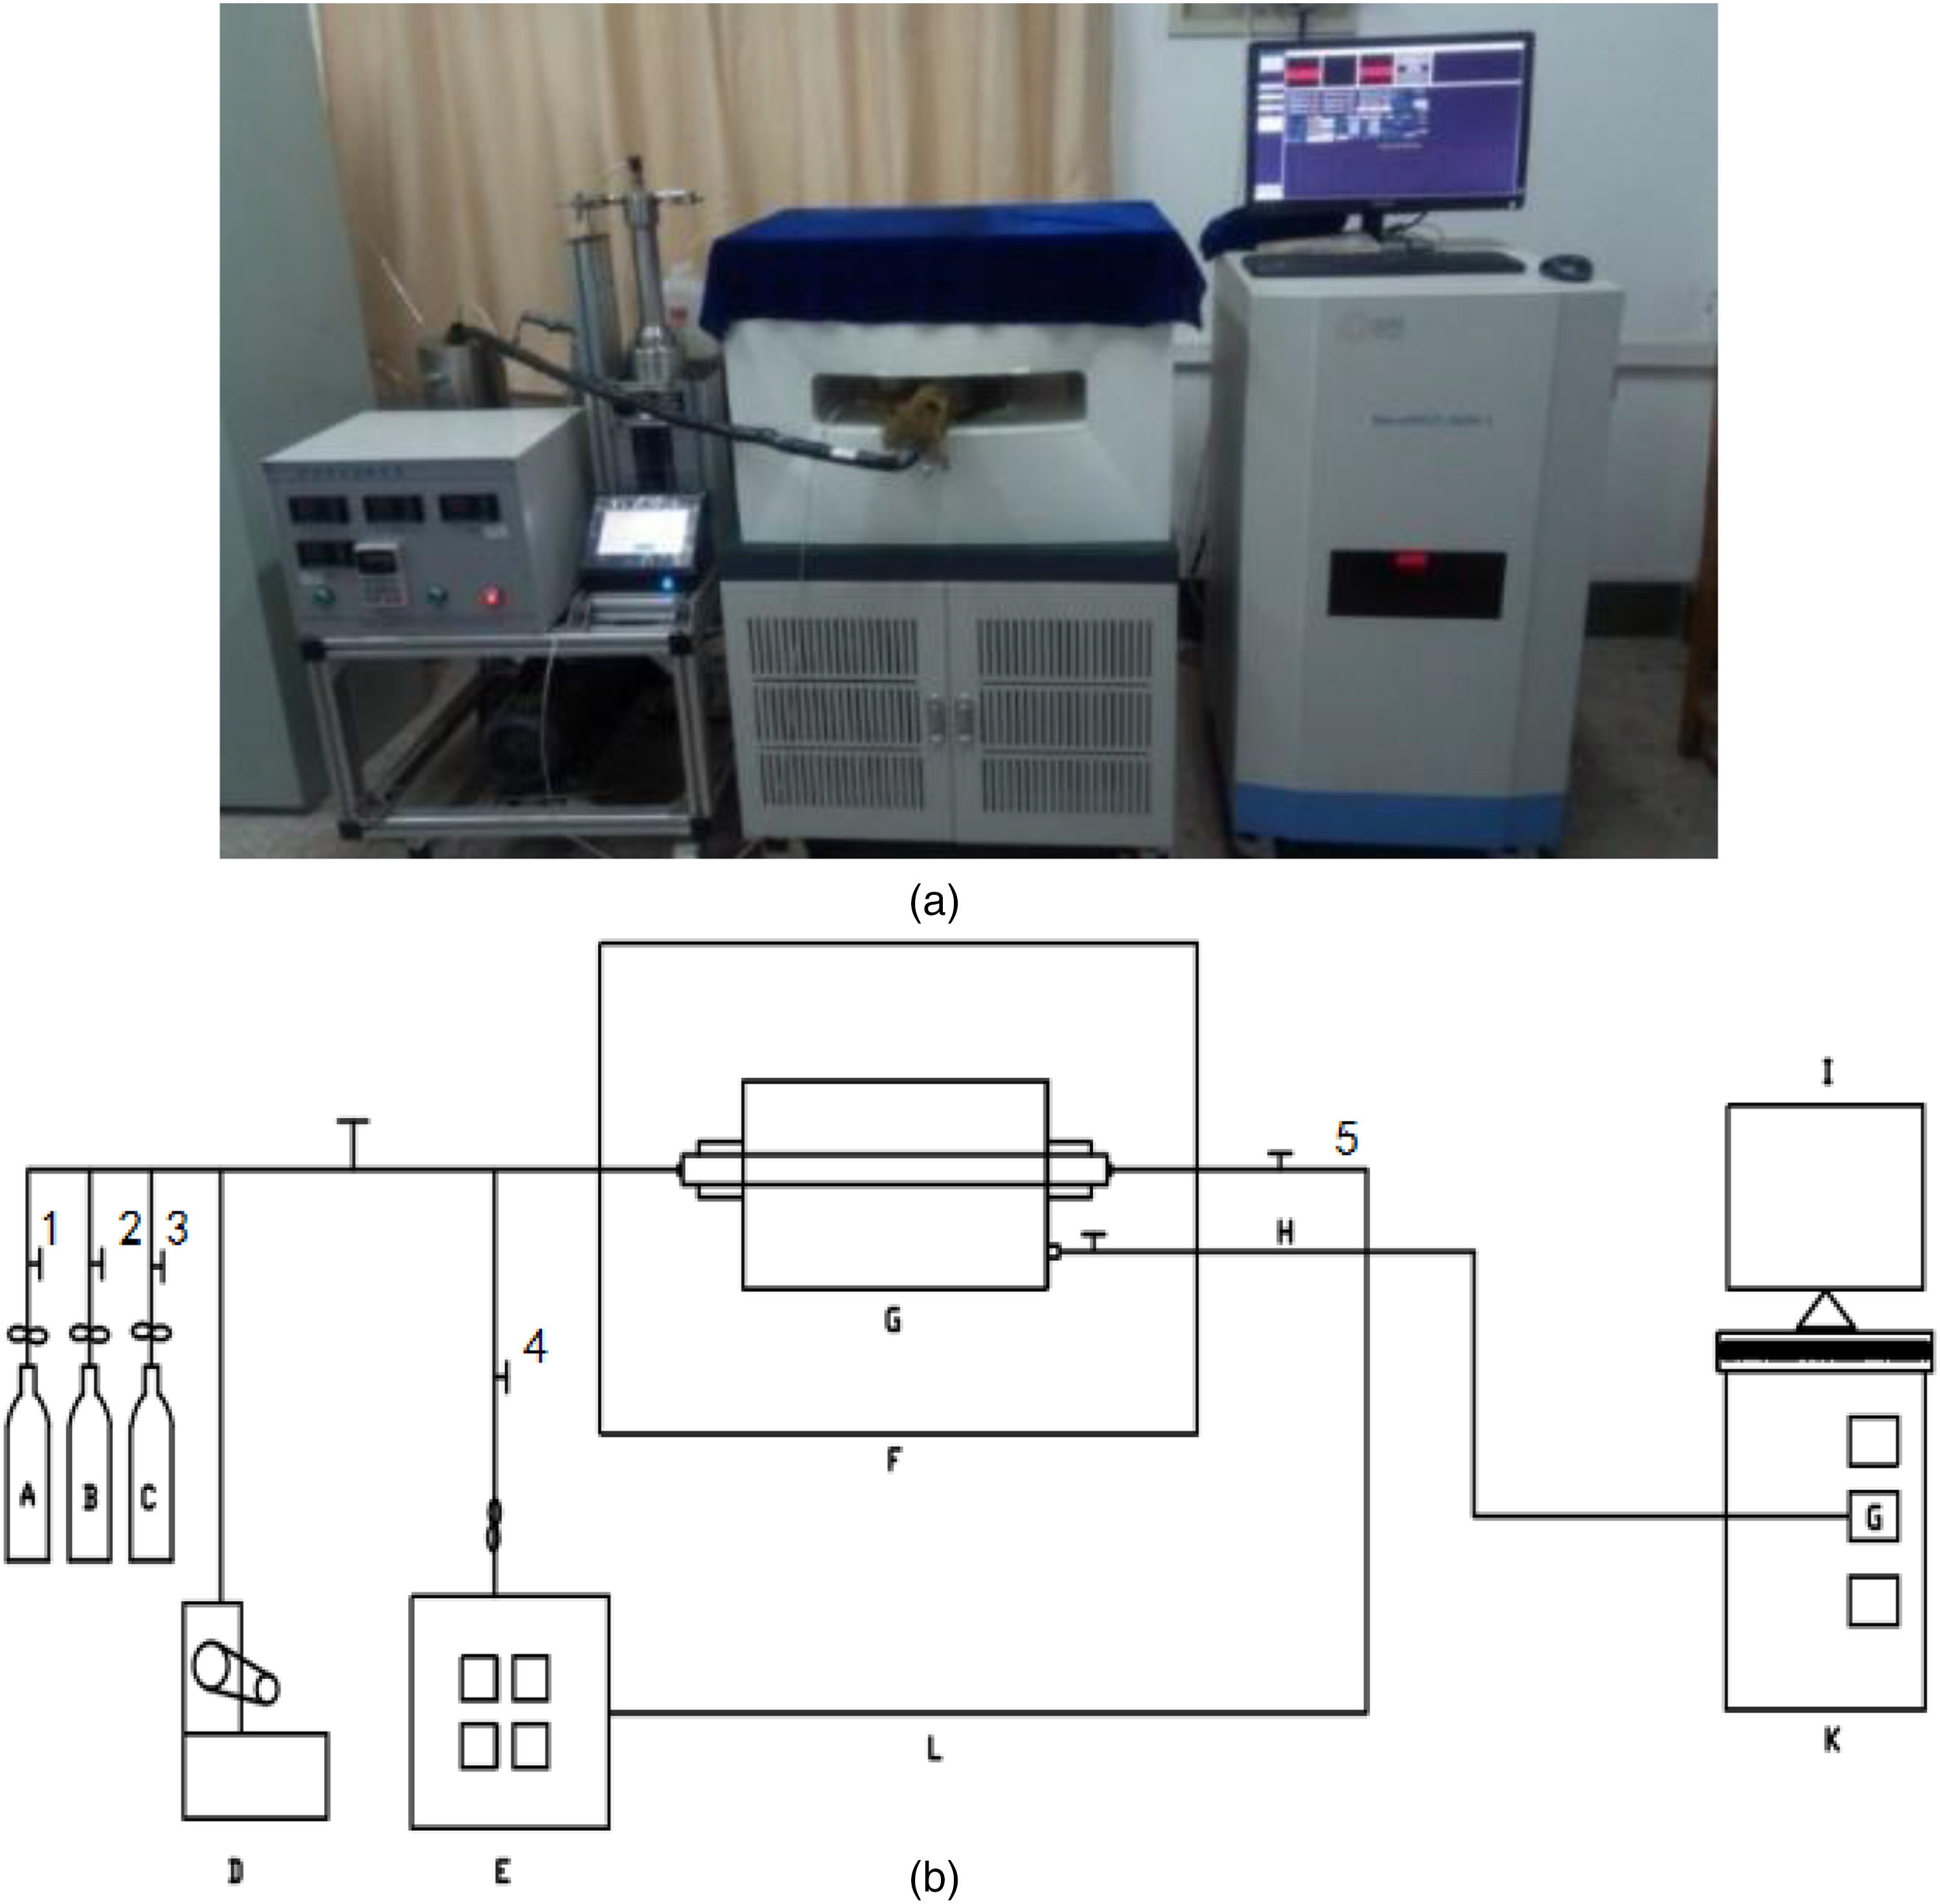
(a) Physical image of low-field nuclear magnetic resonance (NMR) experimental device. (b) System diagram of low-field NMR experimental device.
In Figure 1 (A) is the gas cylinder, (B) is the helium cylinder, (C) is the reference cell, (D) is the vacuum pump, (E) is the confining pressure loading system, (F) is the magnet coil, (G) is the gripper, (H) is the RF magnetic field circuit, (I) is the NMR signal collector, (K) is the main console, (L) is the fluorine oil pipeline, (1) is the gas cylinder outlet valve, (2) is the helium outlet valve, (3) is the reference cell valve, (4) is the fluorine oil inlet valve, and (5) is the fluorine oil outlet valve.
The completely dried test coal sample was placed into the holder. The plugs were screwed on at both sides of the holder and connected to the inlet and outlet valves between the confining pressure pump and the holder. The confining pressure loading system was turned on, the fluorine oil inlet pipe valve of the holder was opened, and the fluorine oil outlet pipe valve of the holder was closed. The system uses fluorine oil to pressurize the outer wall of the holder, and the inner wall of the holder is wrapped with a test column. The coal sample can realize the overall process of loading the confining pressure on the coal body. During the confining pressure loading process, the confining pressure working pressure is set through the display. When the loading confining pressure reaches the set pressure, the confining pressure loading system automatically stops pressurizing.
Experimental process
The coal sample drilling machine was used to form the fresh large coal samples into cylindrical shapes with a diameter of 25 mm and a height of 50 mm. The samples were numbered XJ-1, XJ-2, XJ-3, and XJ-4, and the mass of each coal sample was ∼30 g. Figure 2 is the experimental flow chart. First, the pore development of cylindrical and granular coal samples is observed by NMR and scanning electron microscopy, respectively. Second, according to the methane calibration experiment, the integrated area of the T2 spectrum curve amplitude and the methane quality are studied. Finally, experiments on the adsorption process of the columnar coal samples under different aerated methane pressures and confining pressures are performed using a low-field NMR instrument.
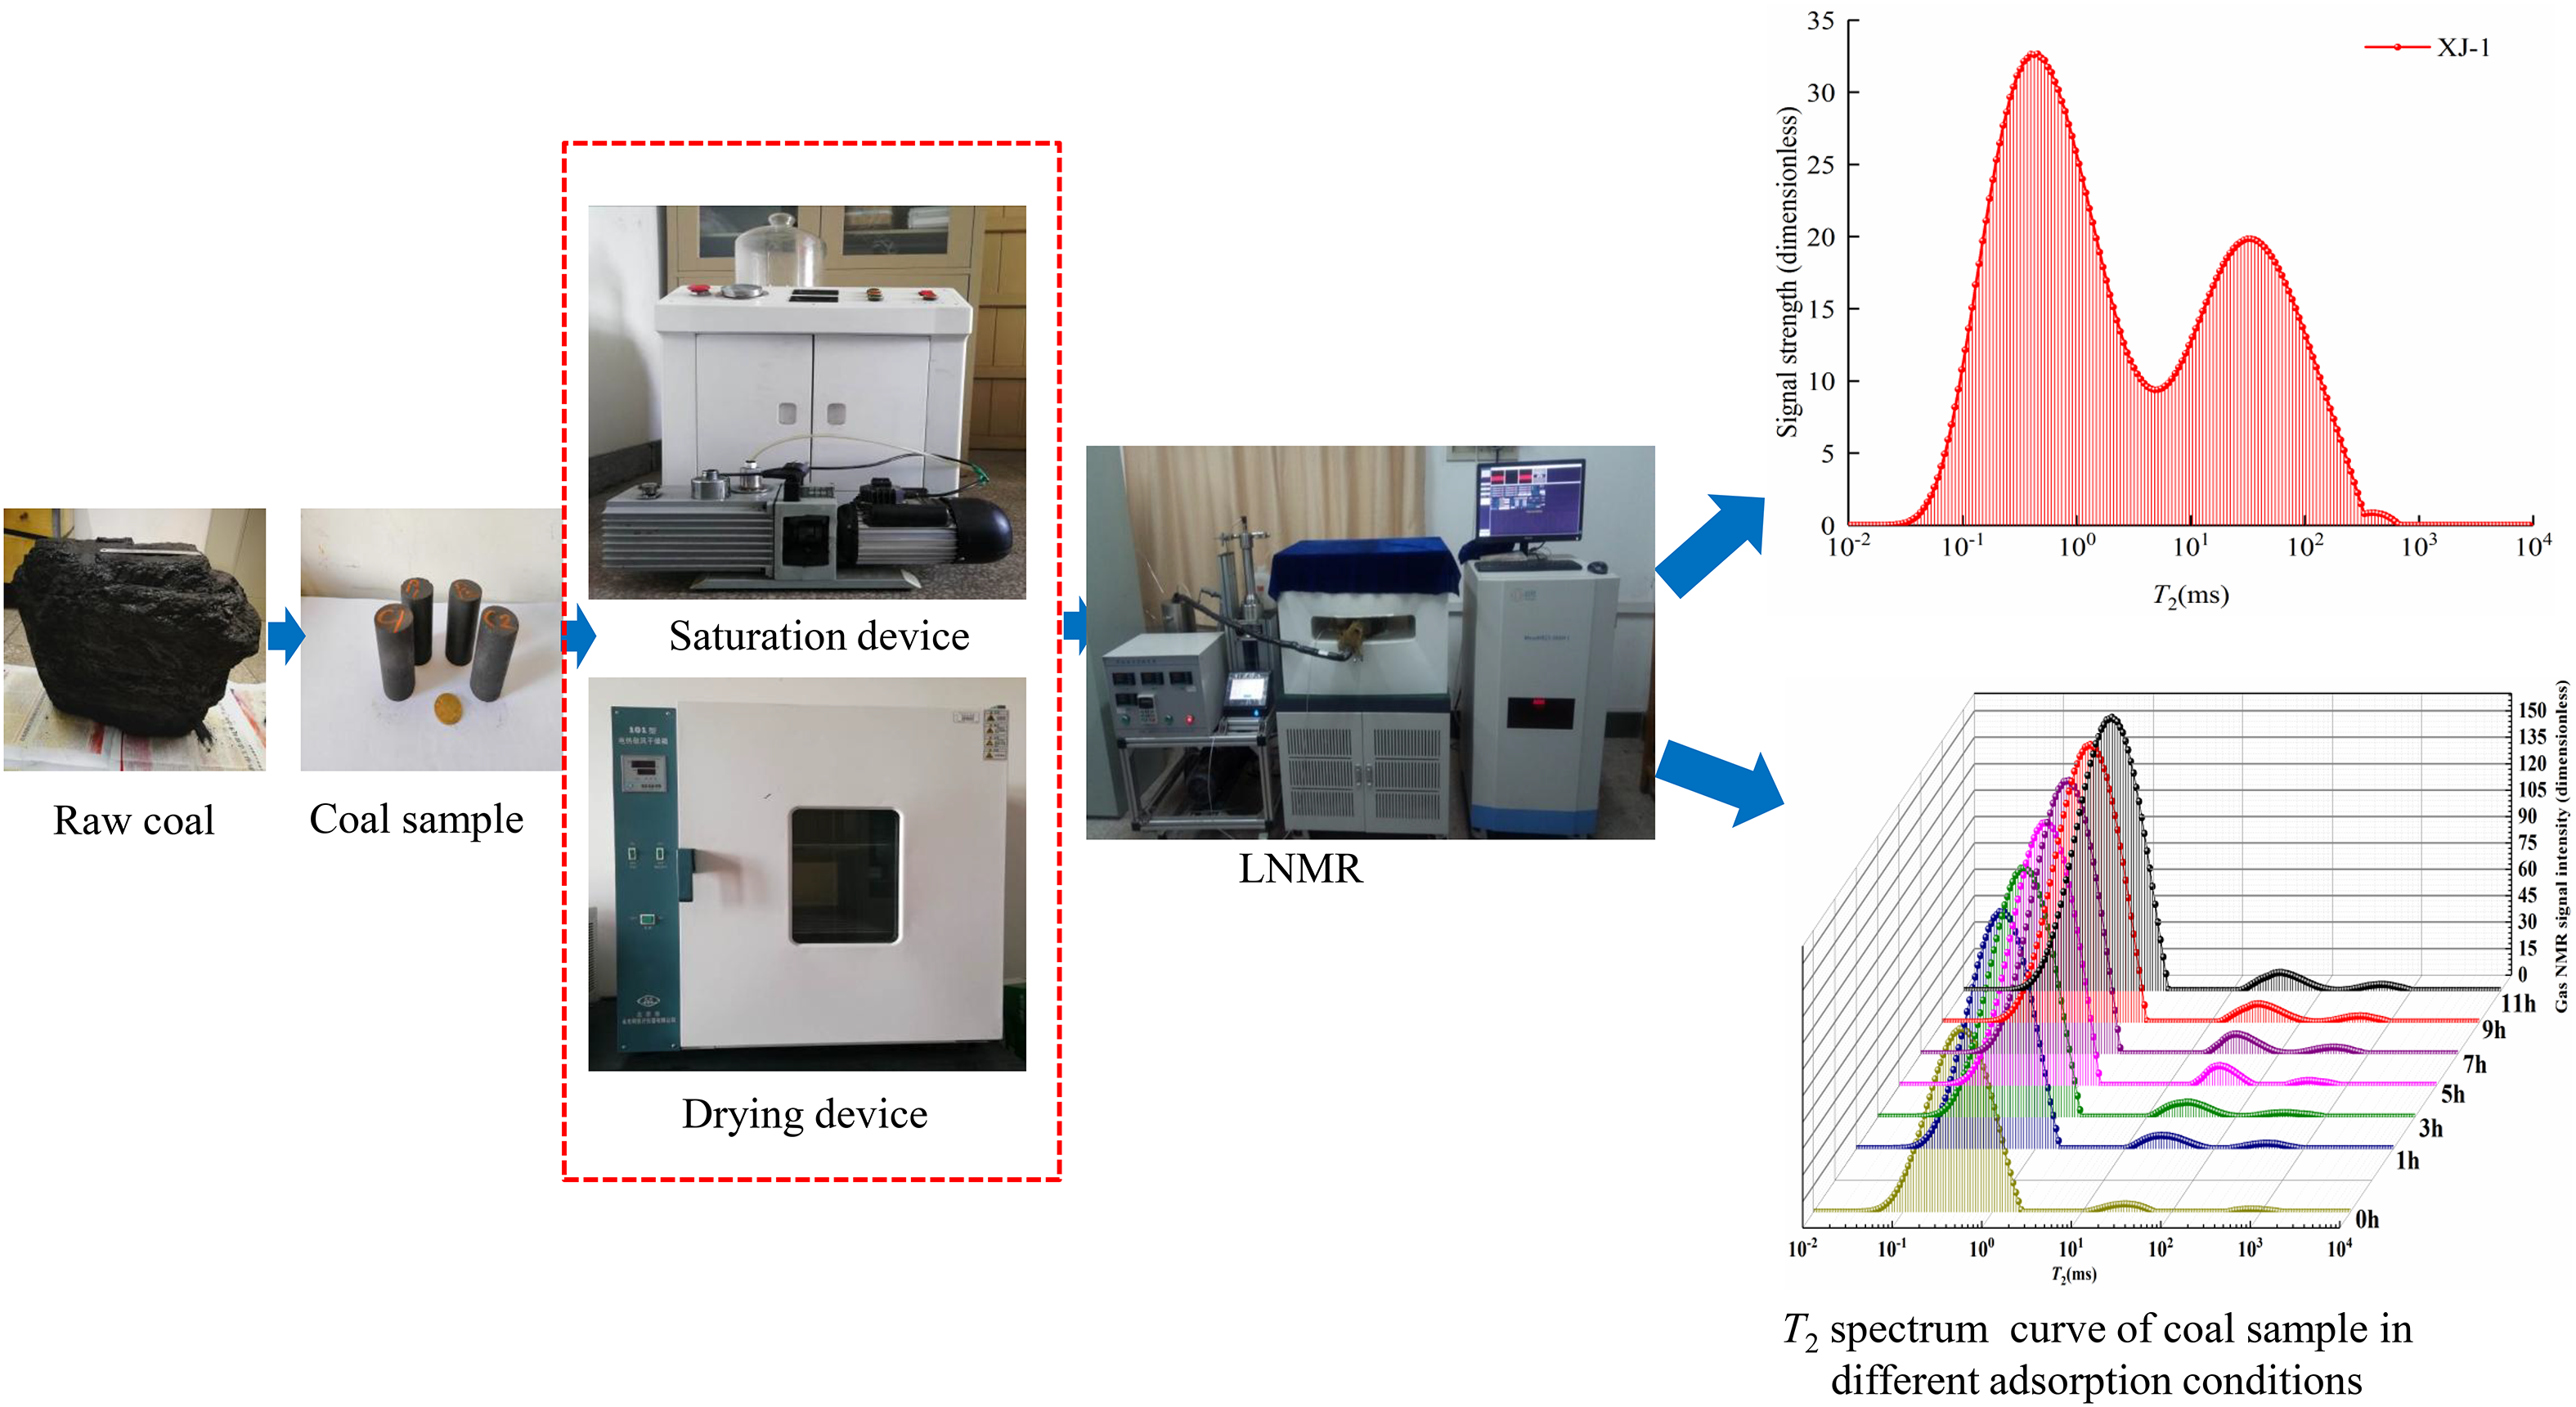
Experimental flowchart.
Free-state gas NMR spectrum calibration experiment
To distinguish between the masses of adsorbed and free methane, the characteristics of the free-gas NMR spectrum are first determined (the detailed steps of the process can be found in the literature (Liu et al., 2019a)). This is because there is a gap between the experimental coal sample and the holder cavity. This gap will be filled at high pressure during the coal adsorption gas experiment. The experiment includes free gas flowing into the gas cylinder (the characteristics of the free-gas NMR spectrum are related to the experimental conditions and are not affected by the crack structure of the coal sample hole, and should not be included in the total gas content during the coal gas adsorption process). The experimental device in Figure 1(b) is connected, and the free-state gas NMR spectrum calibration experiment and the coal gas adsorption NMR spectrum experiment are carried out. According to the experimental results and NMR test theory, the lateral relaxation time of coal gas is proportional to the pore radius of coal measure shale. Referring to the results of previous scholars (Guo et al., 2007; Tang et al., 2017; Yao et al., 2014), the different states of methane can be further distinguished. From the T2 spectrum curve of coal gas adsorption, each T2 time corresponds to a gas signal amplitude on the vertical axis, and this amplitude is proportional to the number of gas molecules (Deng and Xie, 2010). Thus, the free gas amount and the NMR are obtained. The relationship between the spectral area is also determined to obtain the quality of methane in different states.
Figure 3 shows the T2 spectrum curve of free methane under different methane pressures. Table 2 shows the methane mass under different methane pressures. Figure 4 shows the relationship between the T2 spectrum area and methane mass under different gas pressures.
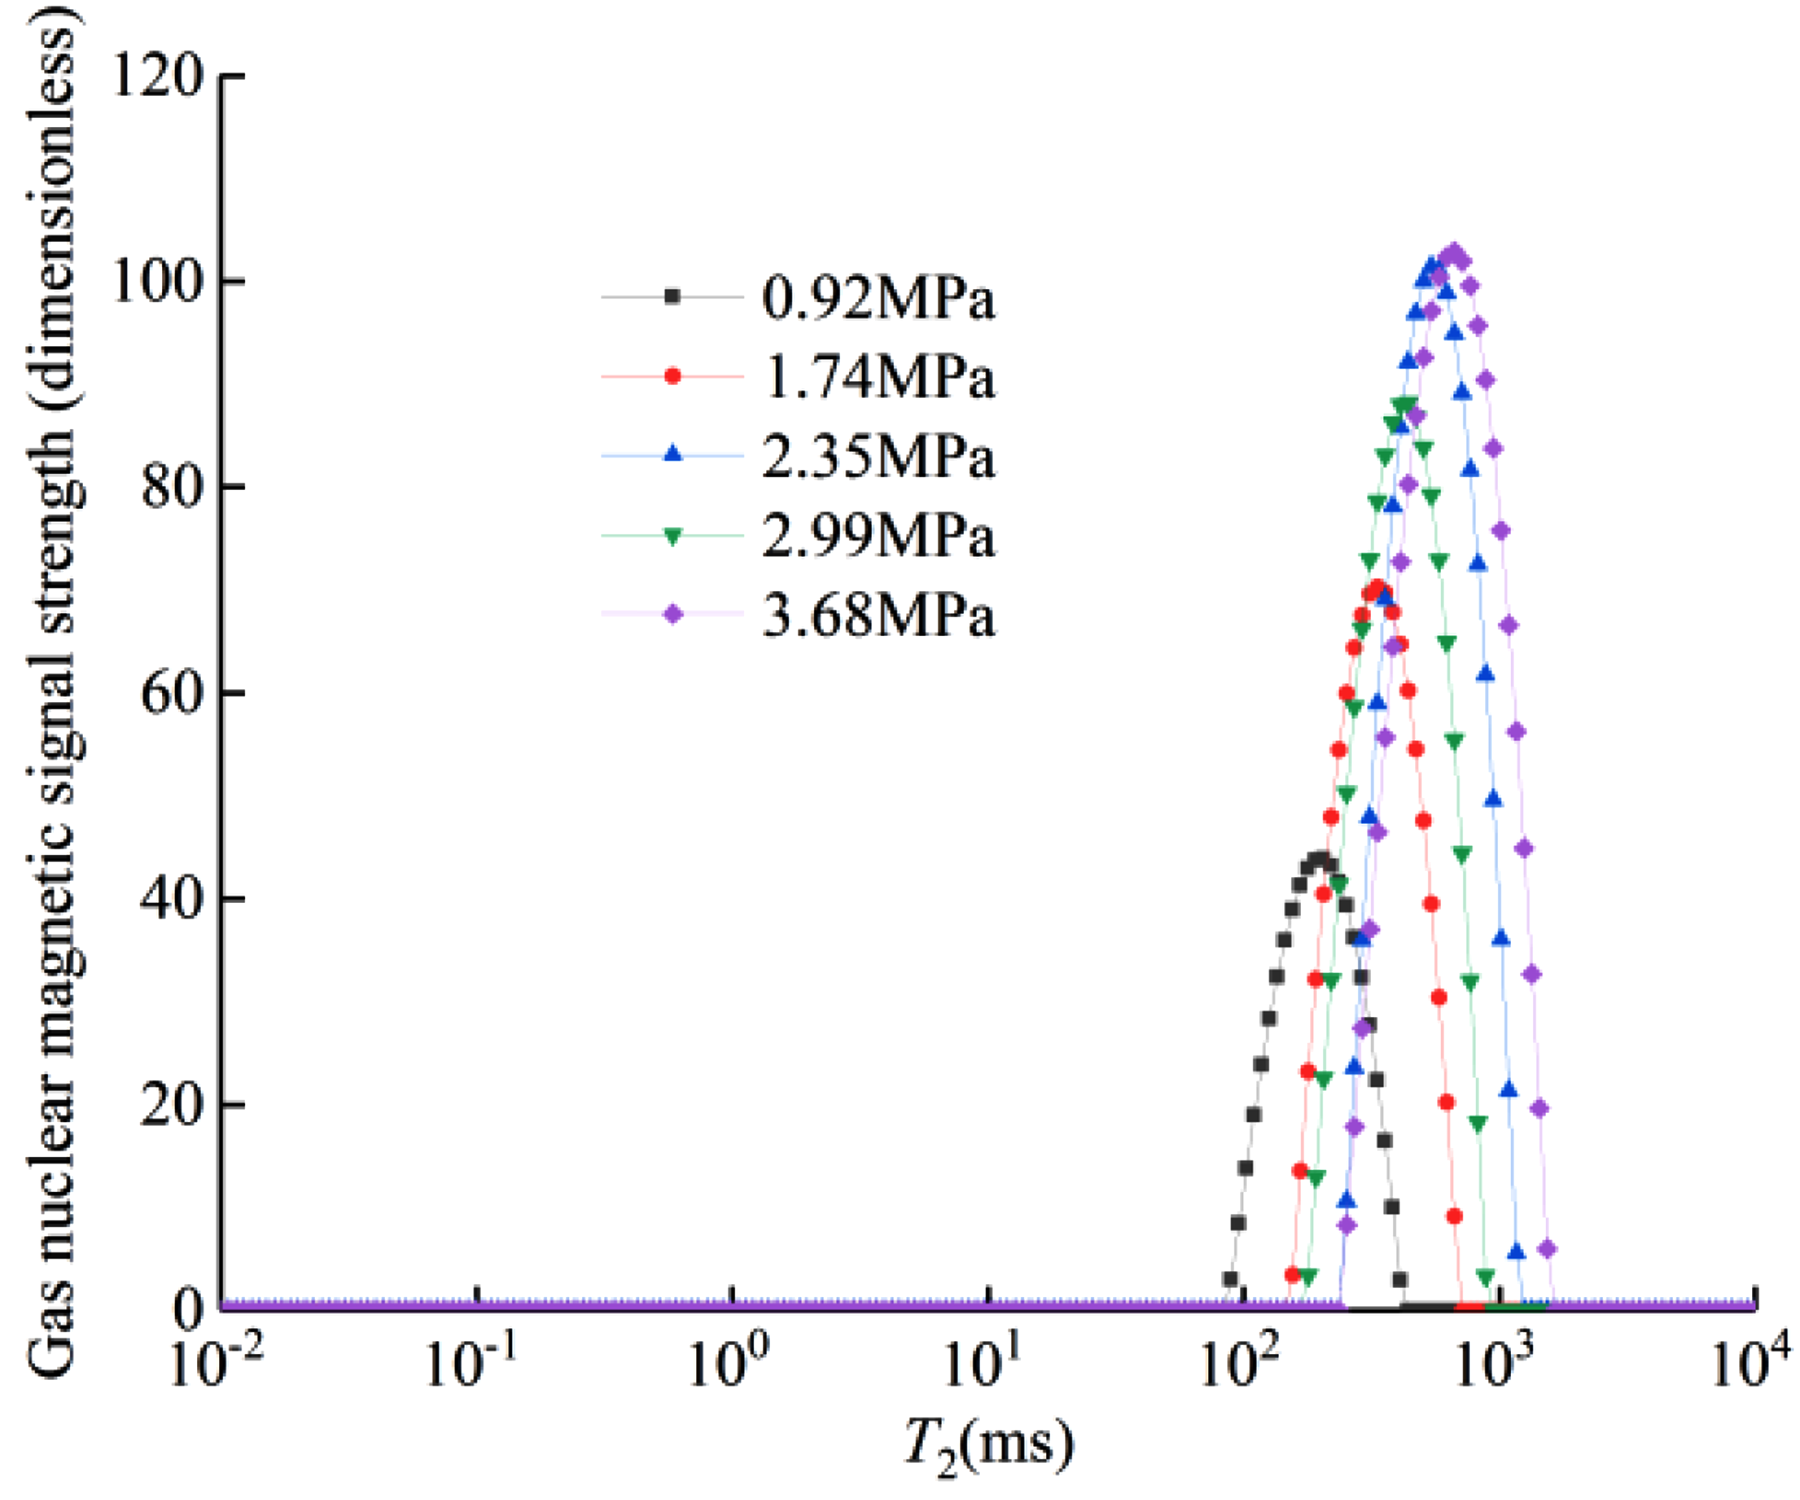
T2 spectra for bulk gas at different gas pressures.
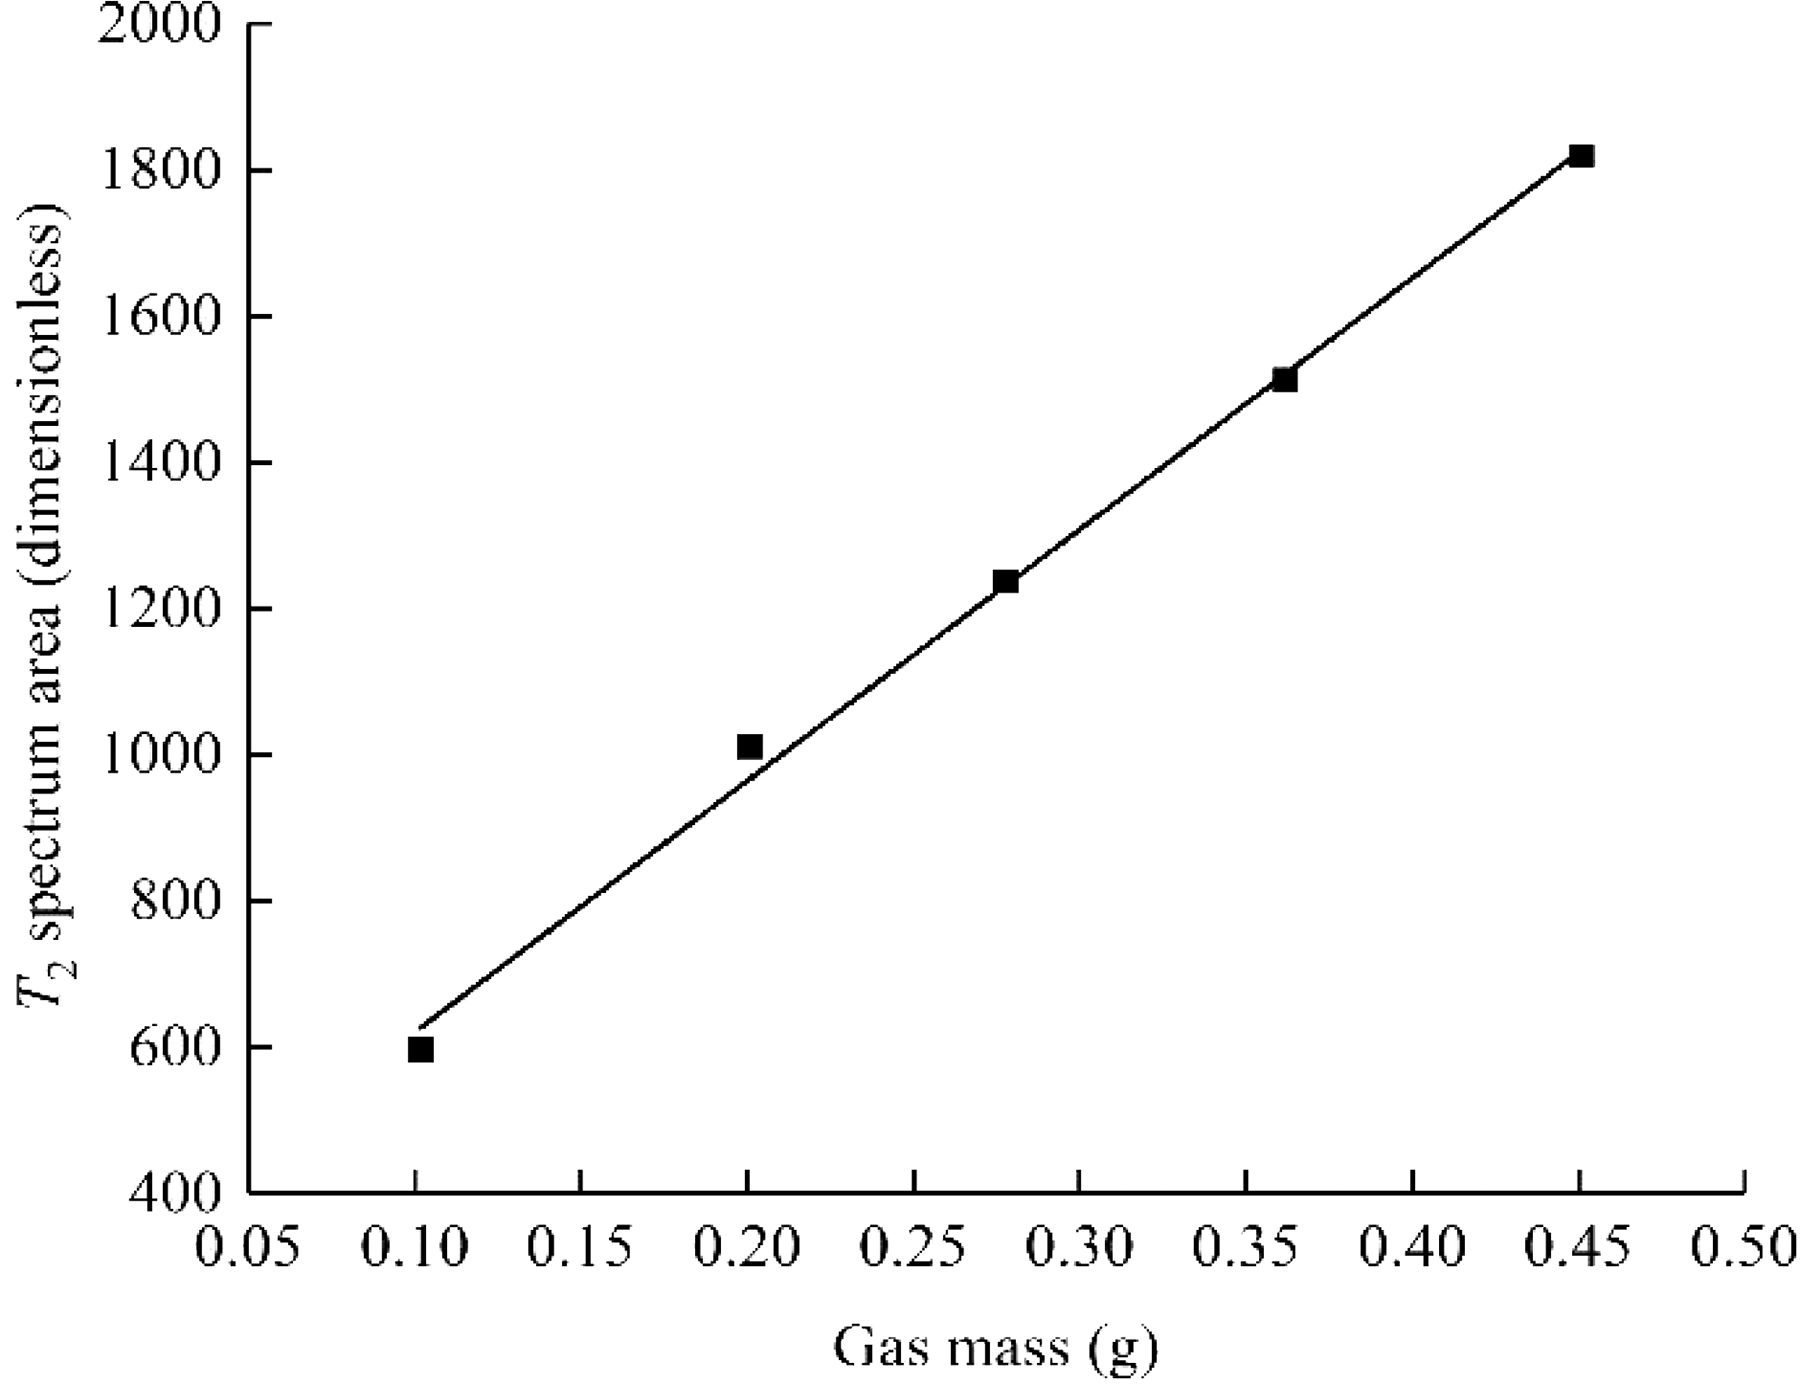
The relationship between T2 spectrum area and methane mass under different methane pressures.
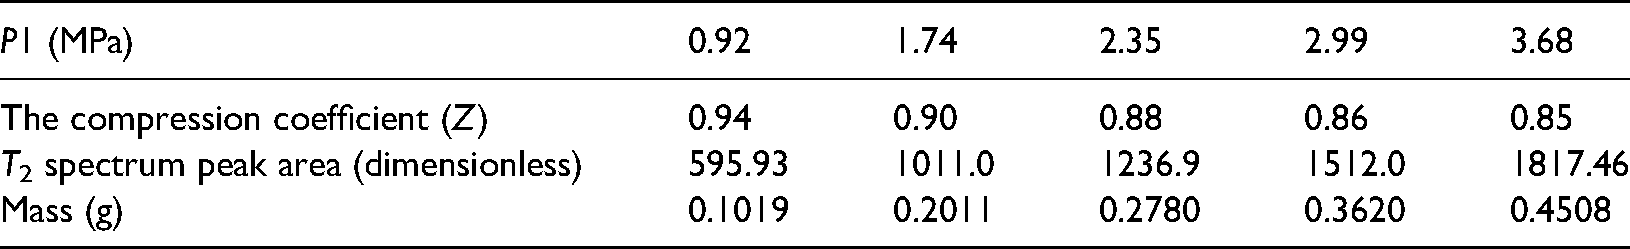
Methane mass under different methane pressures.
According to the results of the free-state gas NMR T2 spectrum calibration test in Figure 3, it can be seen that with increasing gas pressure, the free-state gas transverse relaxation time (T2) and the amplitude integral area increase, and there is only one free-state gas peak T2 spectrum curve. The characteristic peak is similar to the results of previous scholars (Guo et al., 2007; Yao et al., 2014) the free gas T2 is concentrated at 178.373–1520.94 ms.
According to the free-state gas NMR T2 spectrum calibration experiment, the T2 spectrum area is used as the gas mass change index. Figure 4 shows that the T2 spectrum peak area and the methane mass have a linear relationship under different aerated methane pressures: S = 3311.75 m + 218.83 (formula 2) with good correlation, as evidenced by R2 = 0.99. From the NMR T2 spectrum area obtained under different adsorption conditions, the mass of methane gas in different states can be obtained according to the relationship between the T2 spectrum peak area and the mass of methane.
Experimental study of the methane adsorption process under different aerated methane and confining pressures
To reduce the interference effect of different adsorption conditions on the coal sample methane adsorption process, different coal samples were selected in the experiment to study the methane adsorption process. Coal pores and cleats were measured from a 100% water-saturated T2 spectrum by Yao et al. (2010), who found that pore types of coal can be classified by measuring NMR T2 distributions. NMR T2 distributions for 100% water-saturated samples are commonly bimodal, unimodal, and multimodal, with peaks of adsorption pores (<0.1 μm) at 0.5–2.5 ms, seepage pores (>0.1 μm) at 20–50 ms, and cleats or fractures at >100 ms. By analyzing Figure 5, it is evident that the T2 spectrum curves of the coal seams are similar when focused in the same area, indicating that the pores of the coal seams in the same area are the same. The T2 spectrum of the coal sample shows a continuous three-peak distribution, indicating that the internal pores of the coal sample are well developed and that the connectivity between the pores is good, which benefits gas migration.
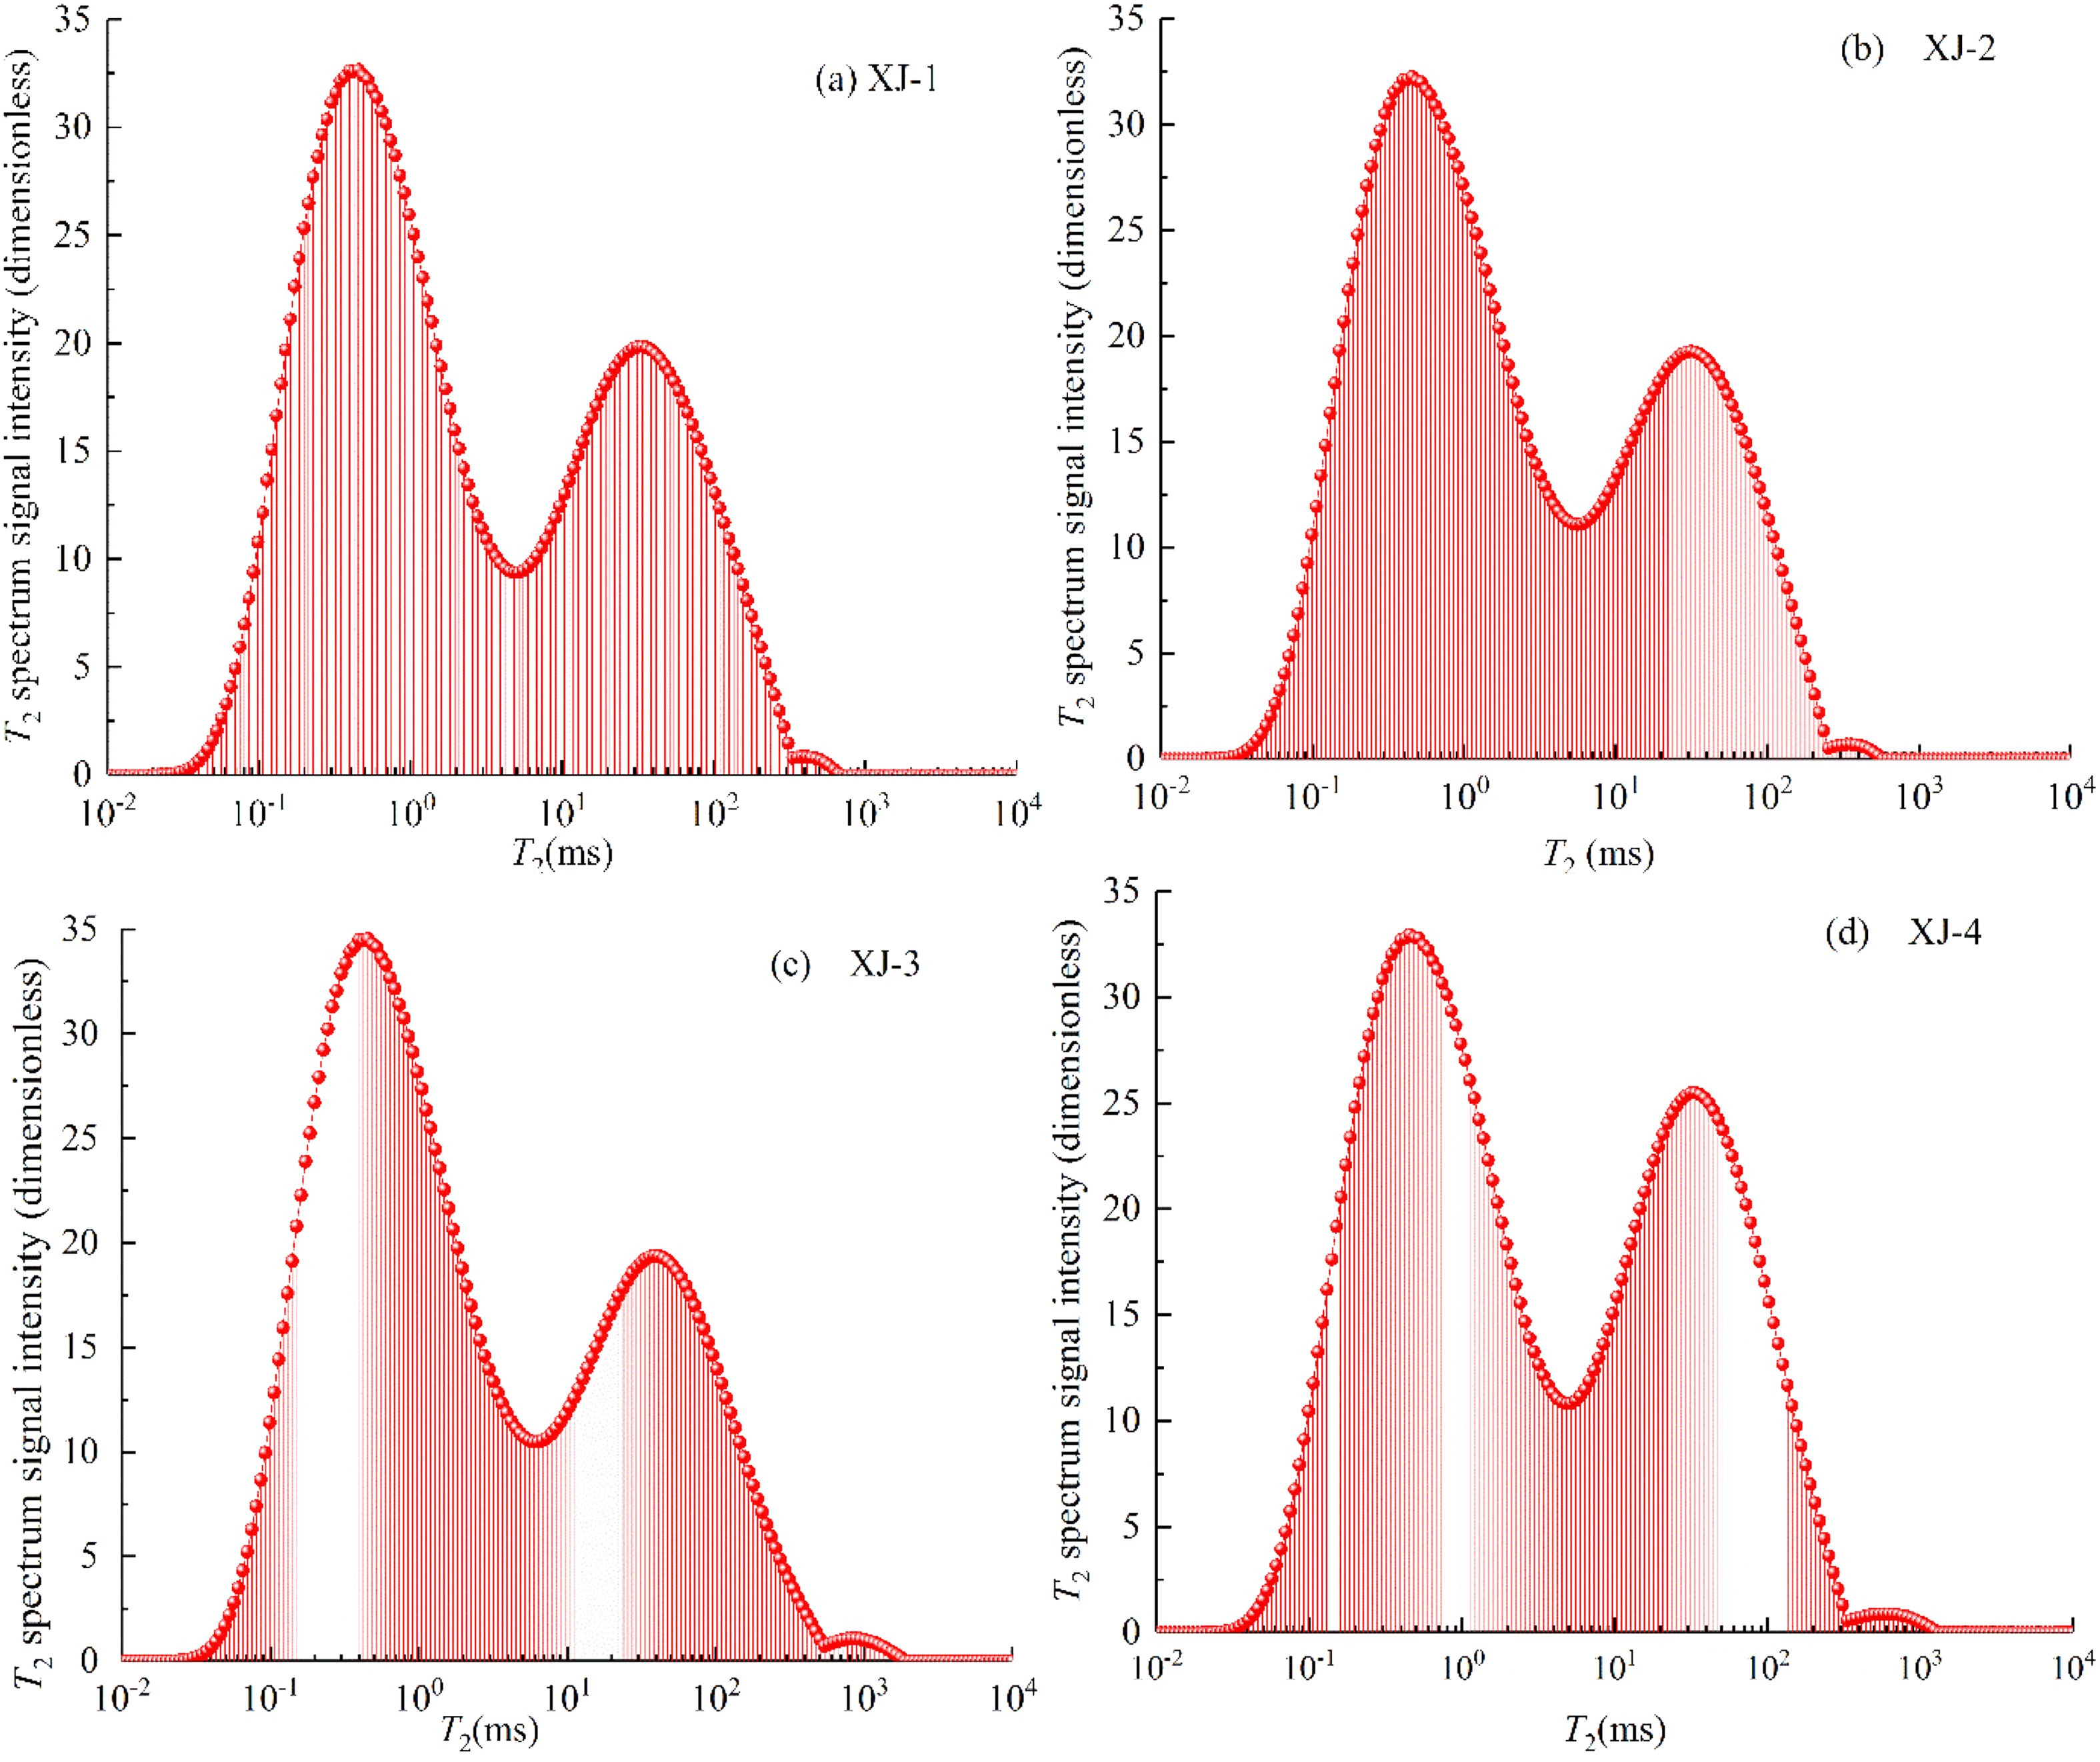
T2 spectrum of coal sample. (a) XJ-1, (b) XJ-2, (c) XJ-3, (d) XJ-4.
It is known that the methane pressure of the mine increases with increasing burial depth, and the corresponding methane pressures at burial depths of 171, 220, 300, and 400 m are 0.25, 0.63, 1.05, and 1.50 MPa, respectively. Taking the XJ-1 coal sample as an example to study the influence of different aerated methane pressures on the coal methane adsorption process, orthogonal experiments were performed: the confining pressure was constant at 3 MPa, and the aerated gas pressures were set to 0.31, 0.74, 1.11, and 1.46 MPa, respectively.
Taking the XJ-2 coal sample as an example to determine the influence of different confining pressures on the methane adsorption process of the coal sample, orthogonal experiments showed the aerated methane pressure to be constant at 1.46 MPa with confining pressures of 3, 4, 5, and 7 MPa.
When carrying out gas adsorption experiments under different conditions, the holder cavity is first flushed with helium gas, followed by inserting the coal sample and sealing it before continuously evacuating it for 0.5 h. The test gas used is 99.99% pure methane gas. To reduce experimental error, the coal sample was not removed for the next pressure test. Instead, only the test pressure was changed. The duration of the experimental test was 11 h. The signal was collected manually every 0.5 h to avoid frequent tests that would cause the instrument to heat up and adversely affect the experimental results.
Results and discussion
Experimental results of the gas adsorption process under different aerated gas pressures
Figure 6 shows the results of the gas adsorption NMR experiment. It can be seen from Figure 6 that the methane transverse relaxation time (T2) spectra have three distinct peaks at T2 < 1.83 ms, T2 = 1.83–89.07 ms, and T2 = 178.373–766.341 ms. NMR theory shows that the smaller the pore radius is, the larger the specific surface area, and subsequently, the stronger the interaction between methane molecules and the surface of the substrate, which leads to a smaller T2 value. Therefore, the corresponding T2 value of the micropores in the coal sample is smaller than that of the seepage pores and cracks (Guo et al., 2007; Tang et al., 2017; Yao et al., 2014). Combined with the free-state gas NMR spectrum calibration experiment, it can be determined that the third peak T2 = 178.373–766.341 ms in Figure 6 represents the relaxation of free methane. The peaks at T2 < 1.83 ms and T2 = 1.83–89.07 ms are interpreted as “coal-adsorbed methane” and “porous-medium free methane,” respectively.
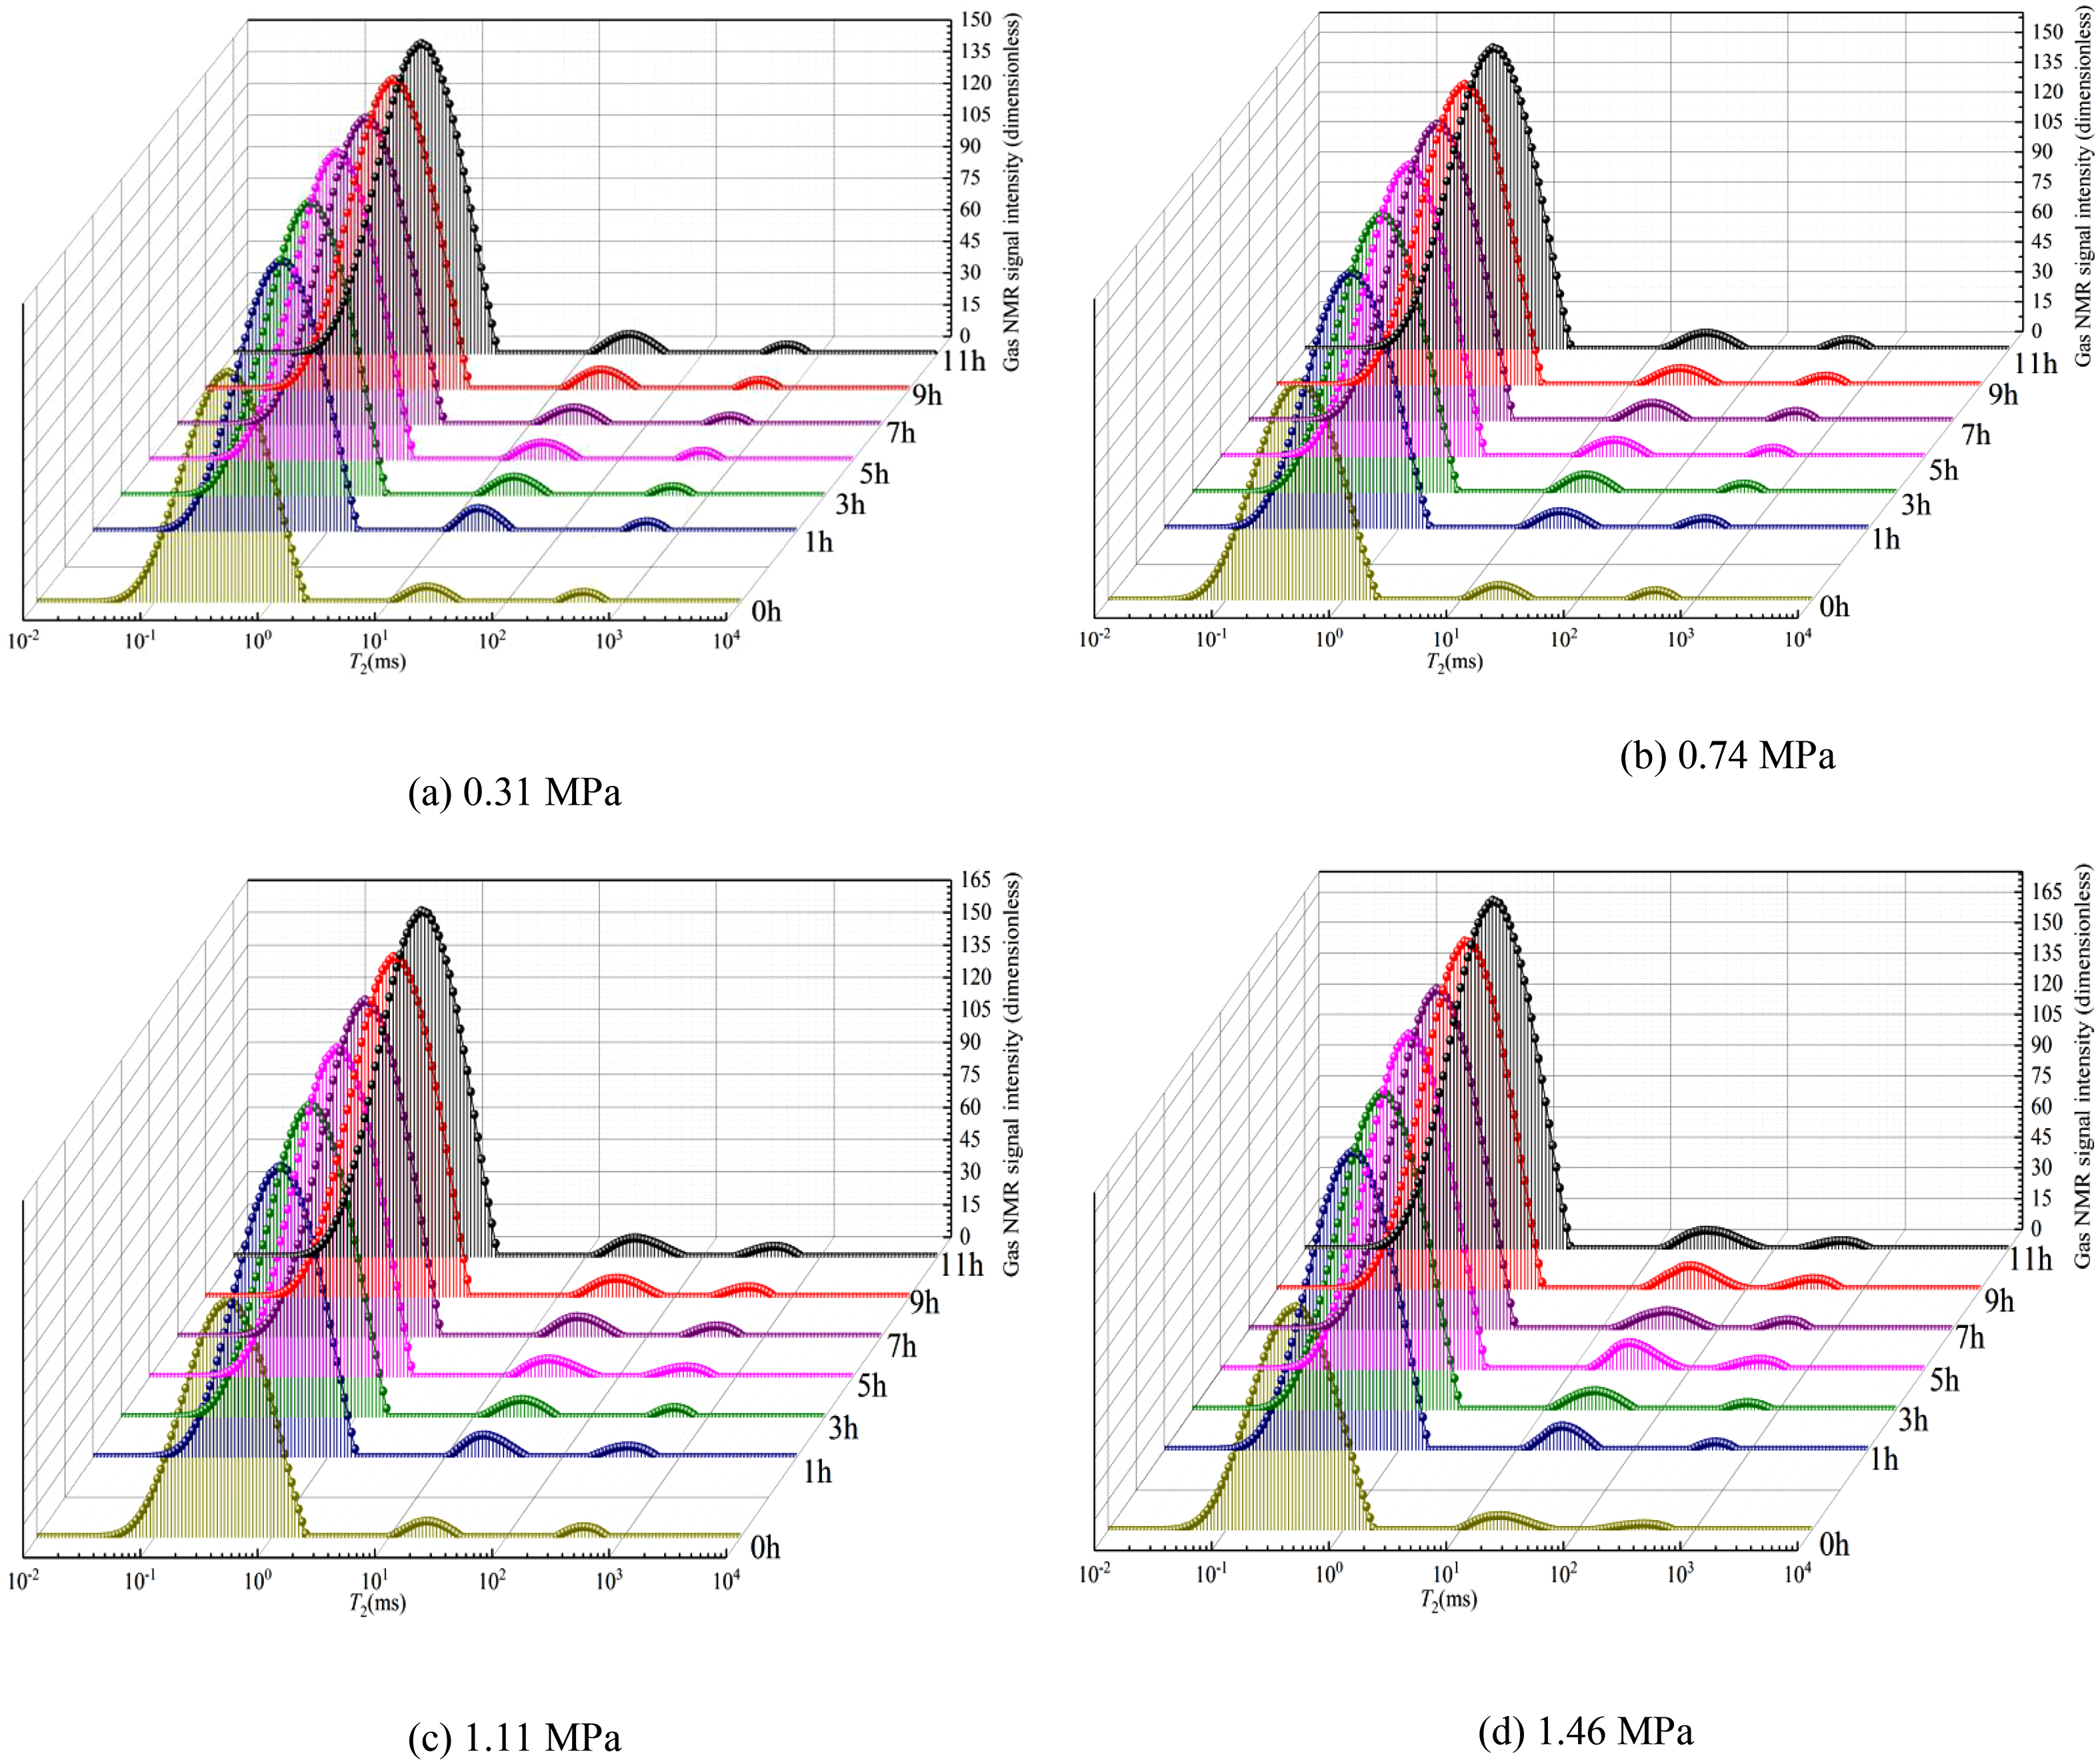
T2 spectrum curve of coal sample methane adsorption process under different aerated methane pressure. (a) 0.31 MPa, (b) 0.74 MPa, (c) 1.11 MPa, (d) 1.46 MPa.
Through the T2 spectrum curve of the coal sample at different aerated methane pressures in Figure 6, it can be found that the pressure increases step-by-step to ∼1.46 MPa. The integrated T2 amplitude of adsorbed methane even reaches an amplitude >85% of the total amplitude during the first 5 h, which indicates that the gas adsorption rate is very fast initially and then gradually reaches the maximum value (not the equilibrium state because the change in T2 amplitude of two consecutive tests cannot be neglected). This indicates that the gas adsorption rate is very fast initially, whereas a long process is needed to reach the adsorption equilibrium state.
The T2 spectra distribution of coal samples under different gas pressures of 0.31, 0.74, 1.11, and 1.46 MPa has a similar trend in T2 morphology and amplitude. As the pressure increases step-by-step to ∼1.46 MPa, the total mass of adsorbed methane also increases. Taking Figure 6(a) as an example, the mass of gas adsorbed by the coal sample increases rapidly during the first 5 h (>85.0% of the total mass of adsorbed methane), then the rate of increase slows down and gradually reaches the maximum value (but not the equilibrium state). In the experiment, gas molecules are introduced from one end and are then injected into the coal sample under the action of the pressure difference. The large internal surface area of the coal sample provides space for gas molecule adsorption, but the injected gas molecules cannot be combined with the coal at the same time. All pores and cracks inside the sample are in contact with each other, forming a gas pressure gradient and concentration gradient inside the coal sample. Under the pressure gradient, gas molecules percolate through the large pores and cracks of the coal sample. Under the concentration gradient, gas molecules diffuse through the coal sample. The deep minute pores increase the amount of gas adsorption as the inflation time increases. As the charging time proceeds, the number of adsorption sites for gas molecules in the coal sample decreases, and the adsorption tends to become saturated. That is, as the pressure of the gas changes under the same increased gas filling time, more gas molecules will be absorbed by the coal sample.
The mass of adsorbed gas changes with the inflation time under different aerated gas pressures
Micropores in coal are the main places where methane is adsorbed. The peak area of the adsorbed methane T2 spectrum characterizes the amount of methane adsorbed by the micropores. According to the relationship between the T2 spectrum area and the methane mass in formula (2), the fitting curve of the mass of adsorbed methane with the methane charging time under different aerated methane pressures is shown in Figure 7.
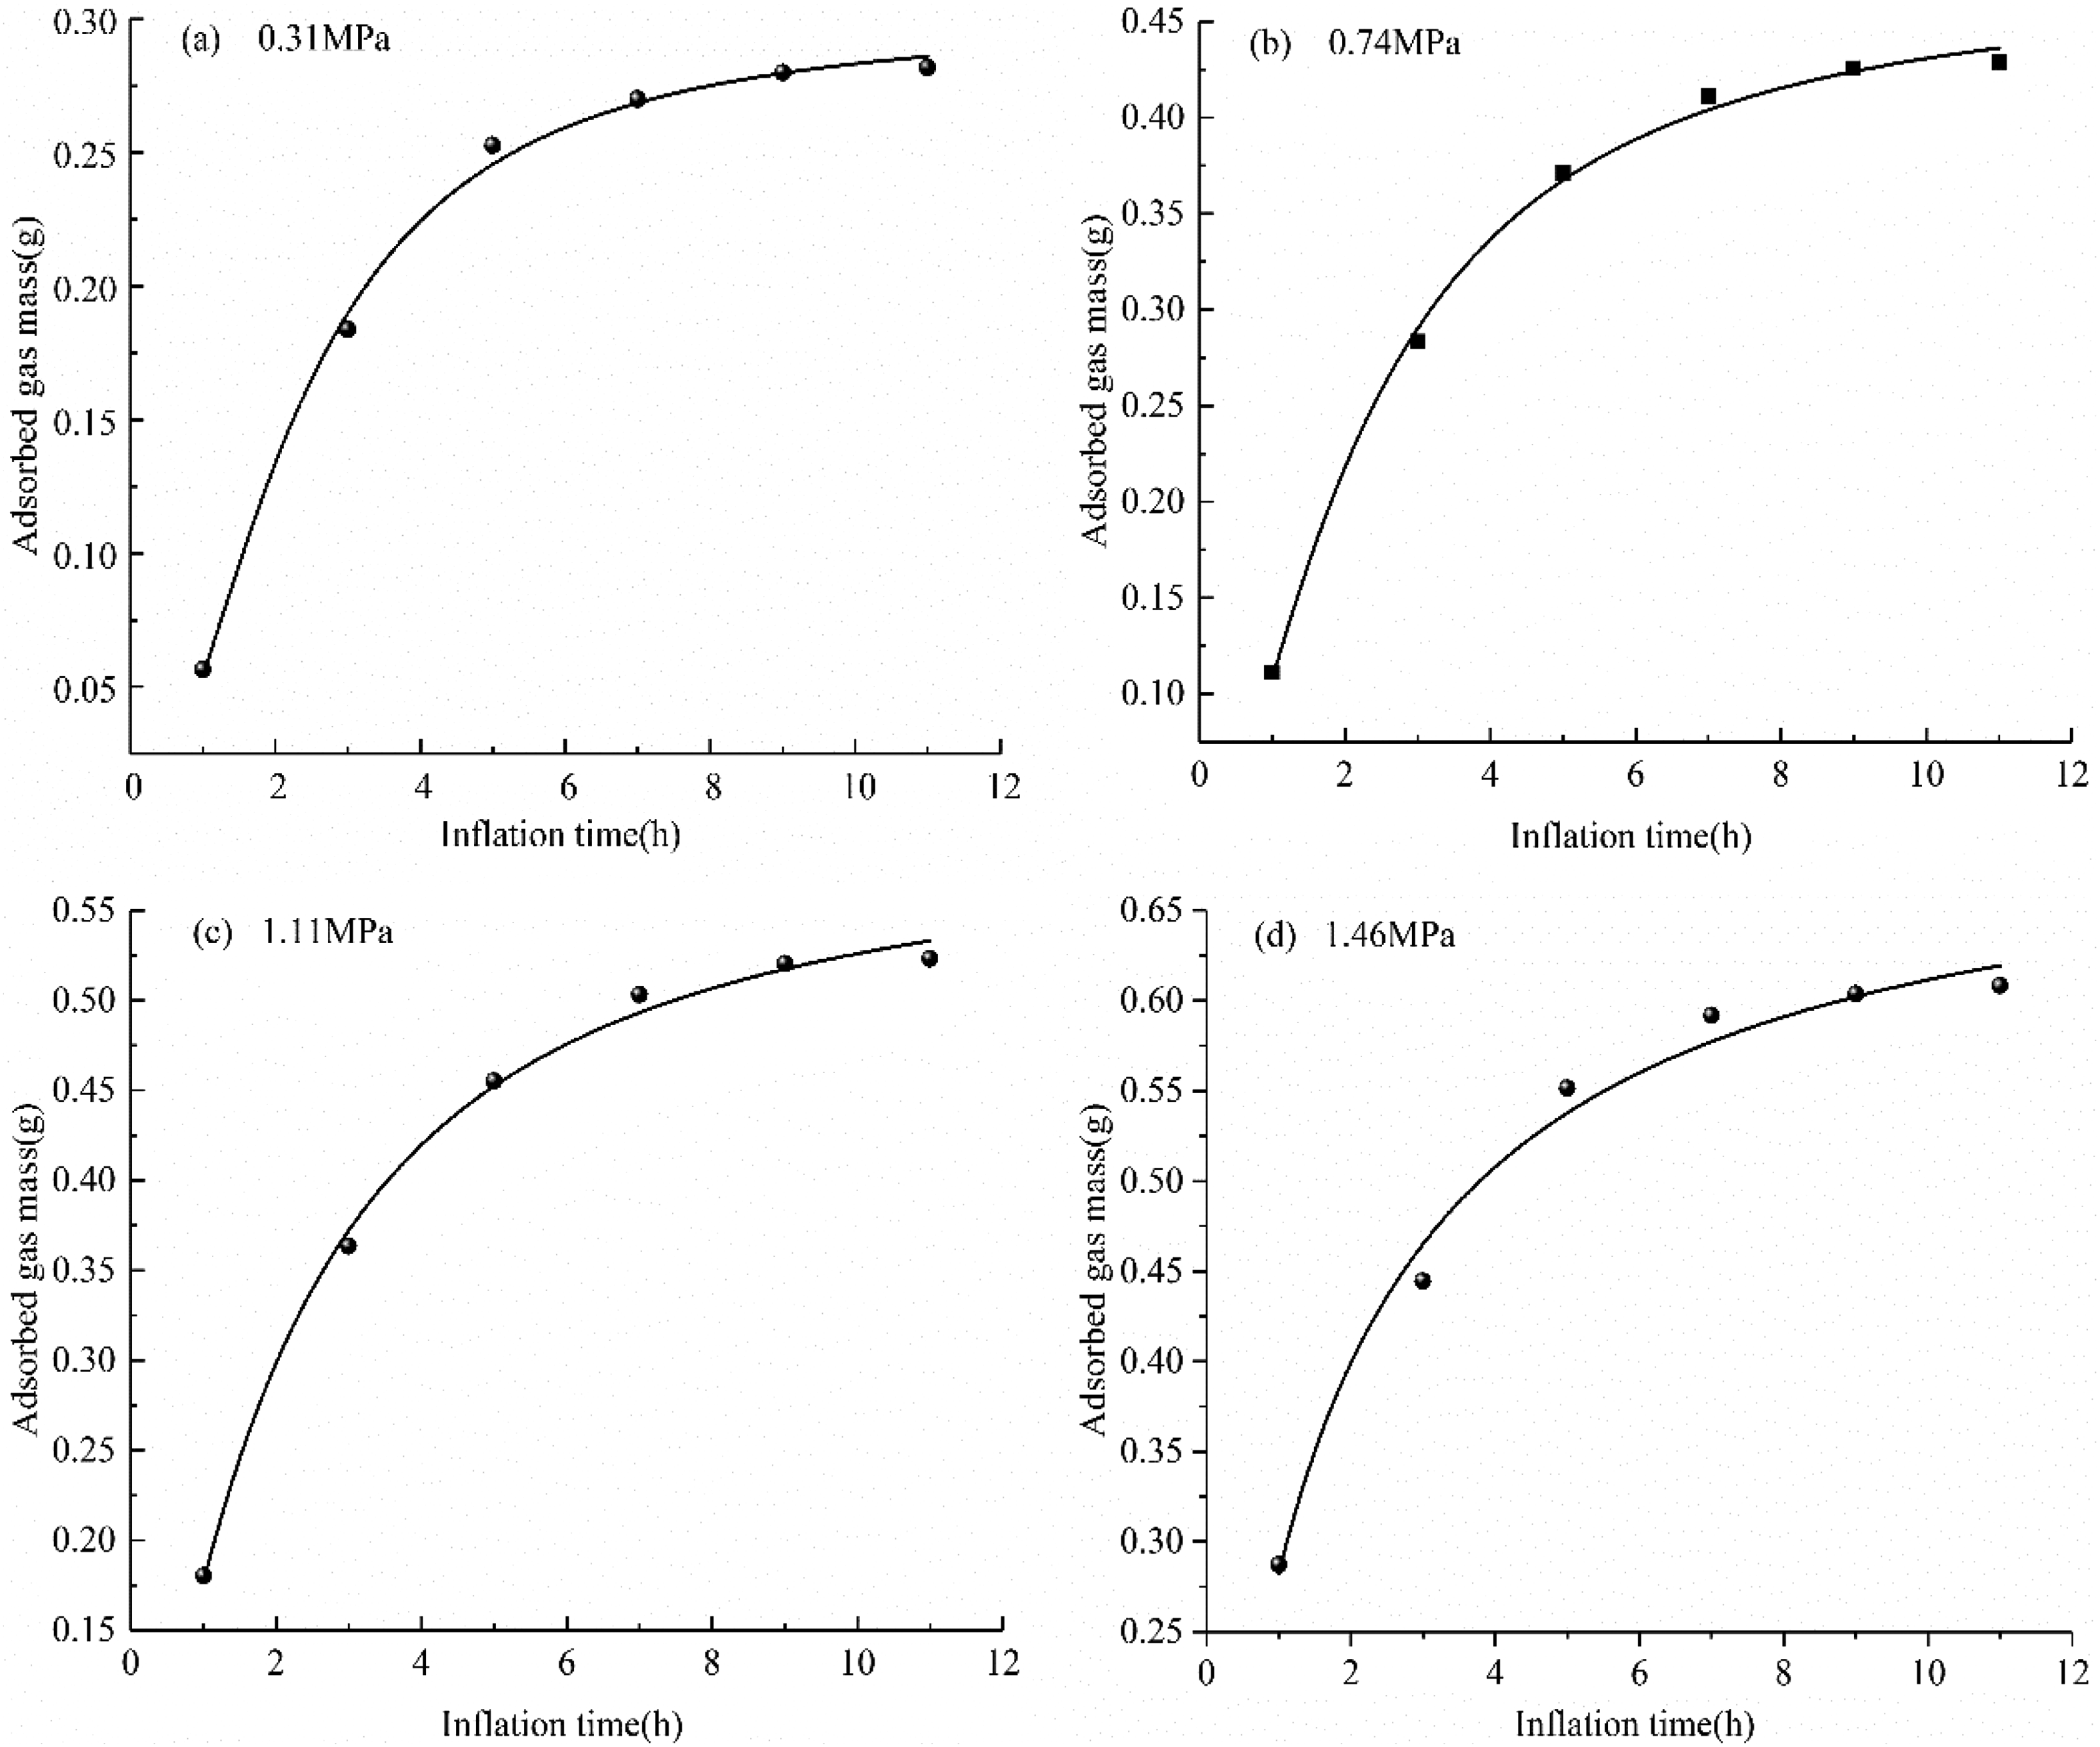
The change curve of adsorbed methane quality with inflation time. (a) 0.31 MPa, (b) 0.74 MPa, (c) 1.11 MPa, (d) 1.46 MPa.
It can be seen from Figure 7 that when the gas is continuously charged for 11 h at each gas pressure point (0.31, 0.74, 1.11, and 1.46 MPa), the mass of gas adsorbed by the coal sample increases rapidly during the first 5 h (accounting for 85.0% of the total adsorption mass), whereas it reaches >90.0% of the total mass of gas adsorbed in 5 h as the gas pressure is increased exceeding (1 MPa). The gas adsorption capacity accounts for >95.0% of the total adsorption during the first 9 h.
This indicates that the gas adsorption rate is very fast in the initial 5 h, whereas a long process is required to reach the adsorption equilibrium state; this difference mainly depends on the coal properties, gas diffusion characteristics, and gas pressures. The gas adsorption kinetics in a coal reservoir is a comprehensive dynamic process involving the gas seepage stage, bulk diffusion stage, surface diffusion stage, and gas adsorption stage. As the pressure increases, the probability of gas molecules striking the surface of coal sample pores and crevices increases, producing a fast gas adsorption rate. The denser the arrangement of gas molecules on the surface of coal sample pores and crevices, the greater the mass of gas adsorbed.
With reference to the results of previous literary works by Zhong et al. (2002), the coal sample was adsorbed for 11 h at each gas pressure point without reaching adsorption saturation. In Figure 7, according to the fitting of the test results, it is found that the relationship between the gas content of the coal sample and the aeration time is more in line with the relationship
The mass of free methane changes with inflation time under different aerated gas pressures.
Large pores and fissures in coal are the main migration channels of free gas, and the T2 spectrum area of free gas represents the amount of free gas. According to the relationship between the T2 spectrum area and the mass of methane in formula (2), the fitting curve of the mass of free methane gas with the methane charging time under different aerated methane pressures is shown in Figure 8.
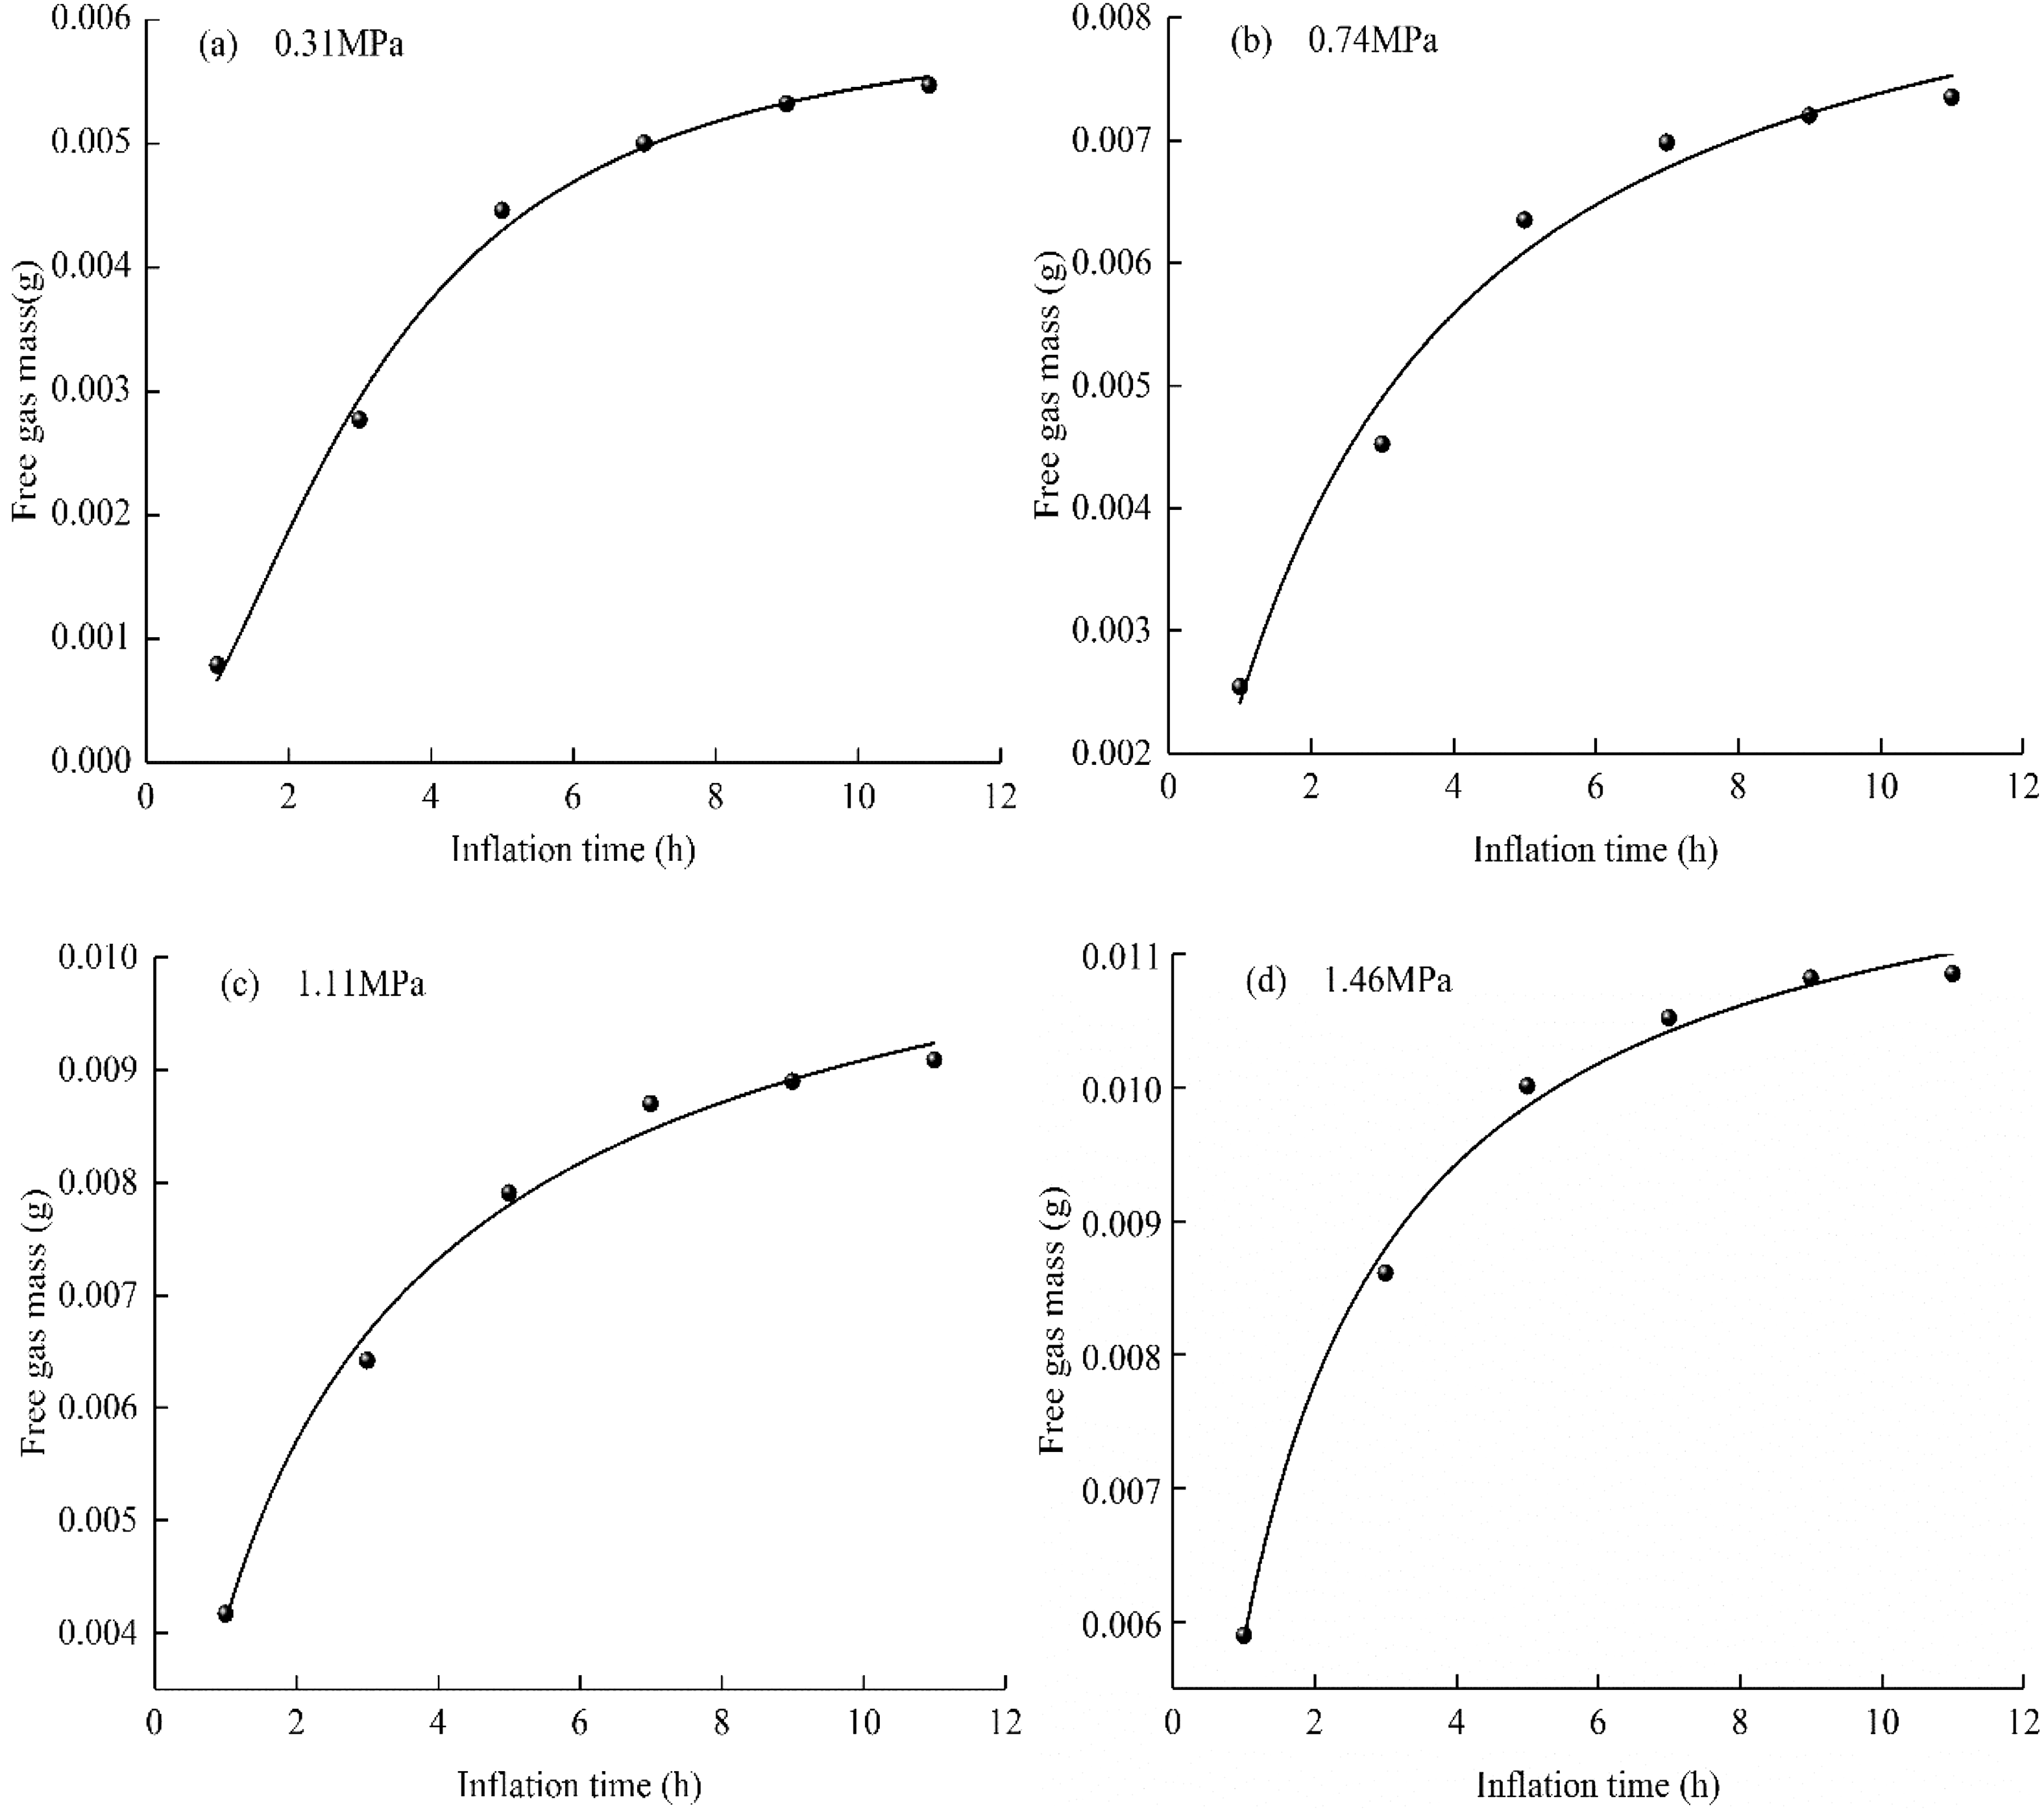
The relationship curve between free methane mass and aerated methane pressure. (a) 0.31 MPa, (b) 0.74 MPa, (c) 1.11 MPa, (d) 1.46 MPa.
Figure 8 shows the change in the mass of free gas with the inflation time under different inflation gas pressures. The mass of free gas increased rapidly during the first 5 h (>80.0% of the total mass of free gas) and then increased slowly until reaching a maximum value. This change is consistent with the change in the mass of adsorbed gas with the inflation time. When the coal sample is initially filled with gas, its large pores and fissures have a larger space, the free gas molecules are quickly filled into the large pores and fissures of the coal sample, and the amount of free gas increases significantly. As the adsorption time increases, the mass of gas in the coal sample increases. The pore pressure of the coal sample also increases and tends toward the aeration pressure, while the increased rate of the amount of free gas slows down.
When the gas is continuously injected for 11 h at each gas pressure point, the relationship between the mass of free gas and the inflation time is
Experimental results of the methane adsorption process under different confining pressures
By analyzing the T2 spectrum curve of the gas adsorption process of the coal samples in Figure 9 under different confining pressures, a similar trend is found in T2 morphology and amplitude in the T2 spectral distribution of coal samples under different confining pressures of 3, 4, 5, and 7 MPa. The T2 spectrum of the XJ-2 coal sample shows three separated crests and as the confining pressure increases, the total integrated T2 amplitude (signal of the peak area) decreases. Taking Figure 9(a) as an example, the integrated T2 amplitudes increase rapidly during the first 5 h and then increase slowly until the change in T2 amplitude of two consecutive tests becomes negligible. The mass of adsorbed gas in the micropores also behaves the same way as the aeration time increases. As the confining pressure increases, the mass of gas in the coal sample decreases. Thus, the greater the confining pressure is, the more obvious the decrease in gas mass.
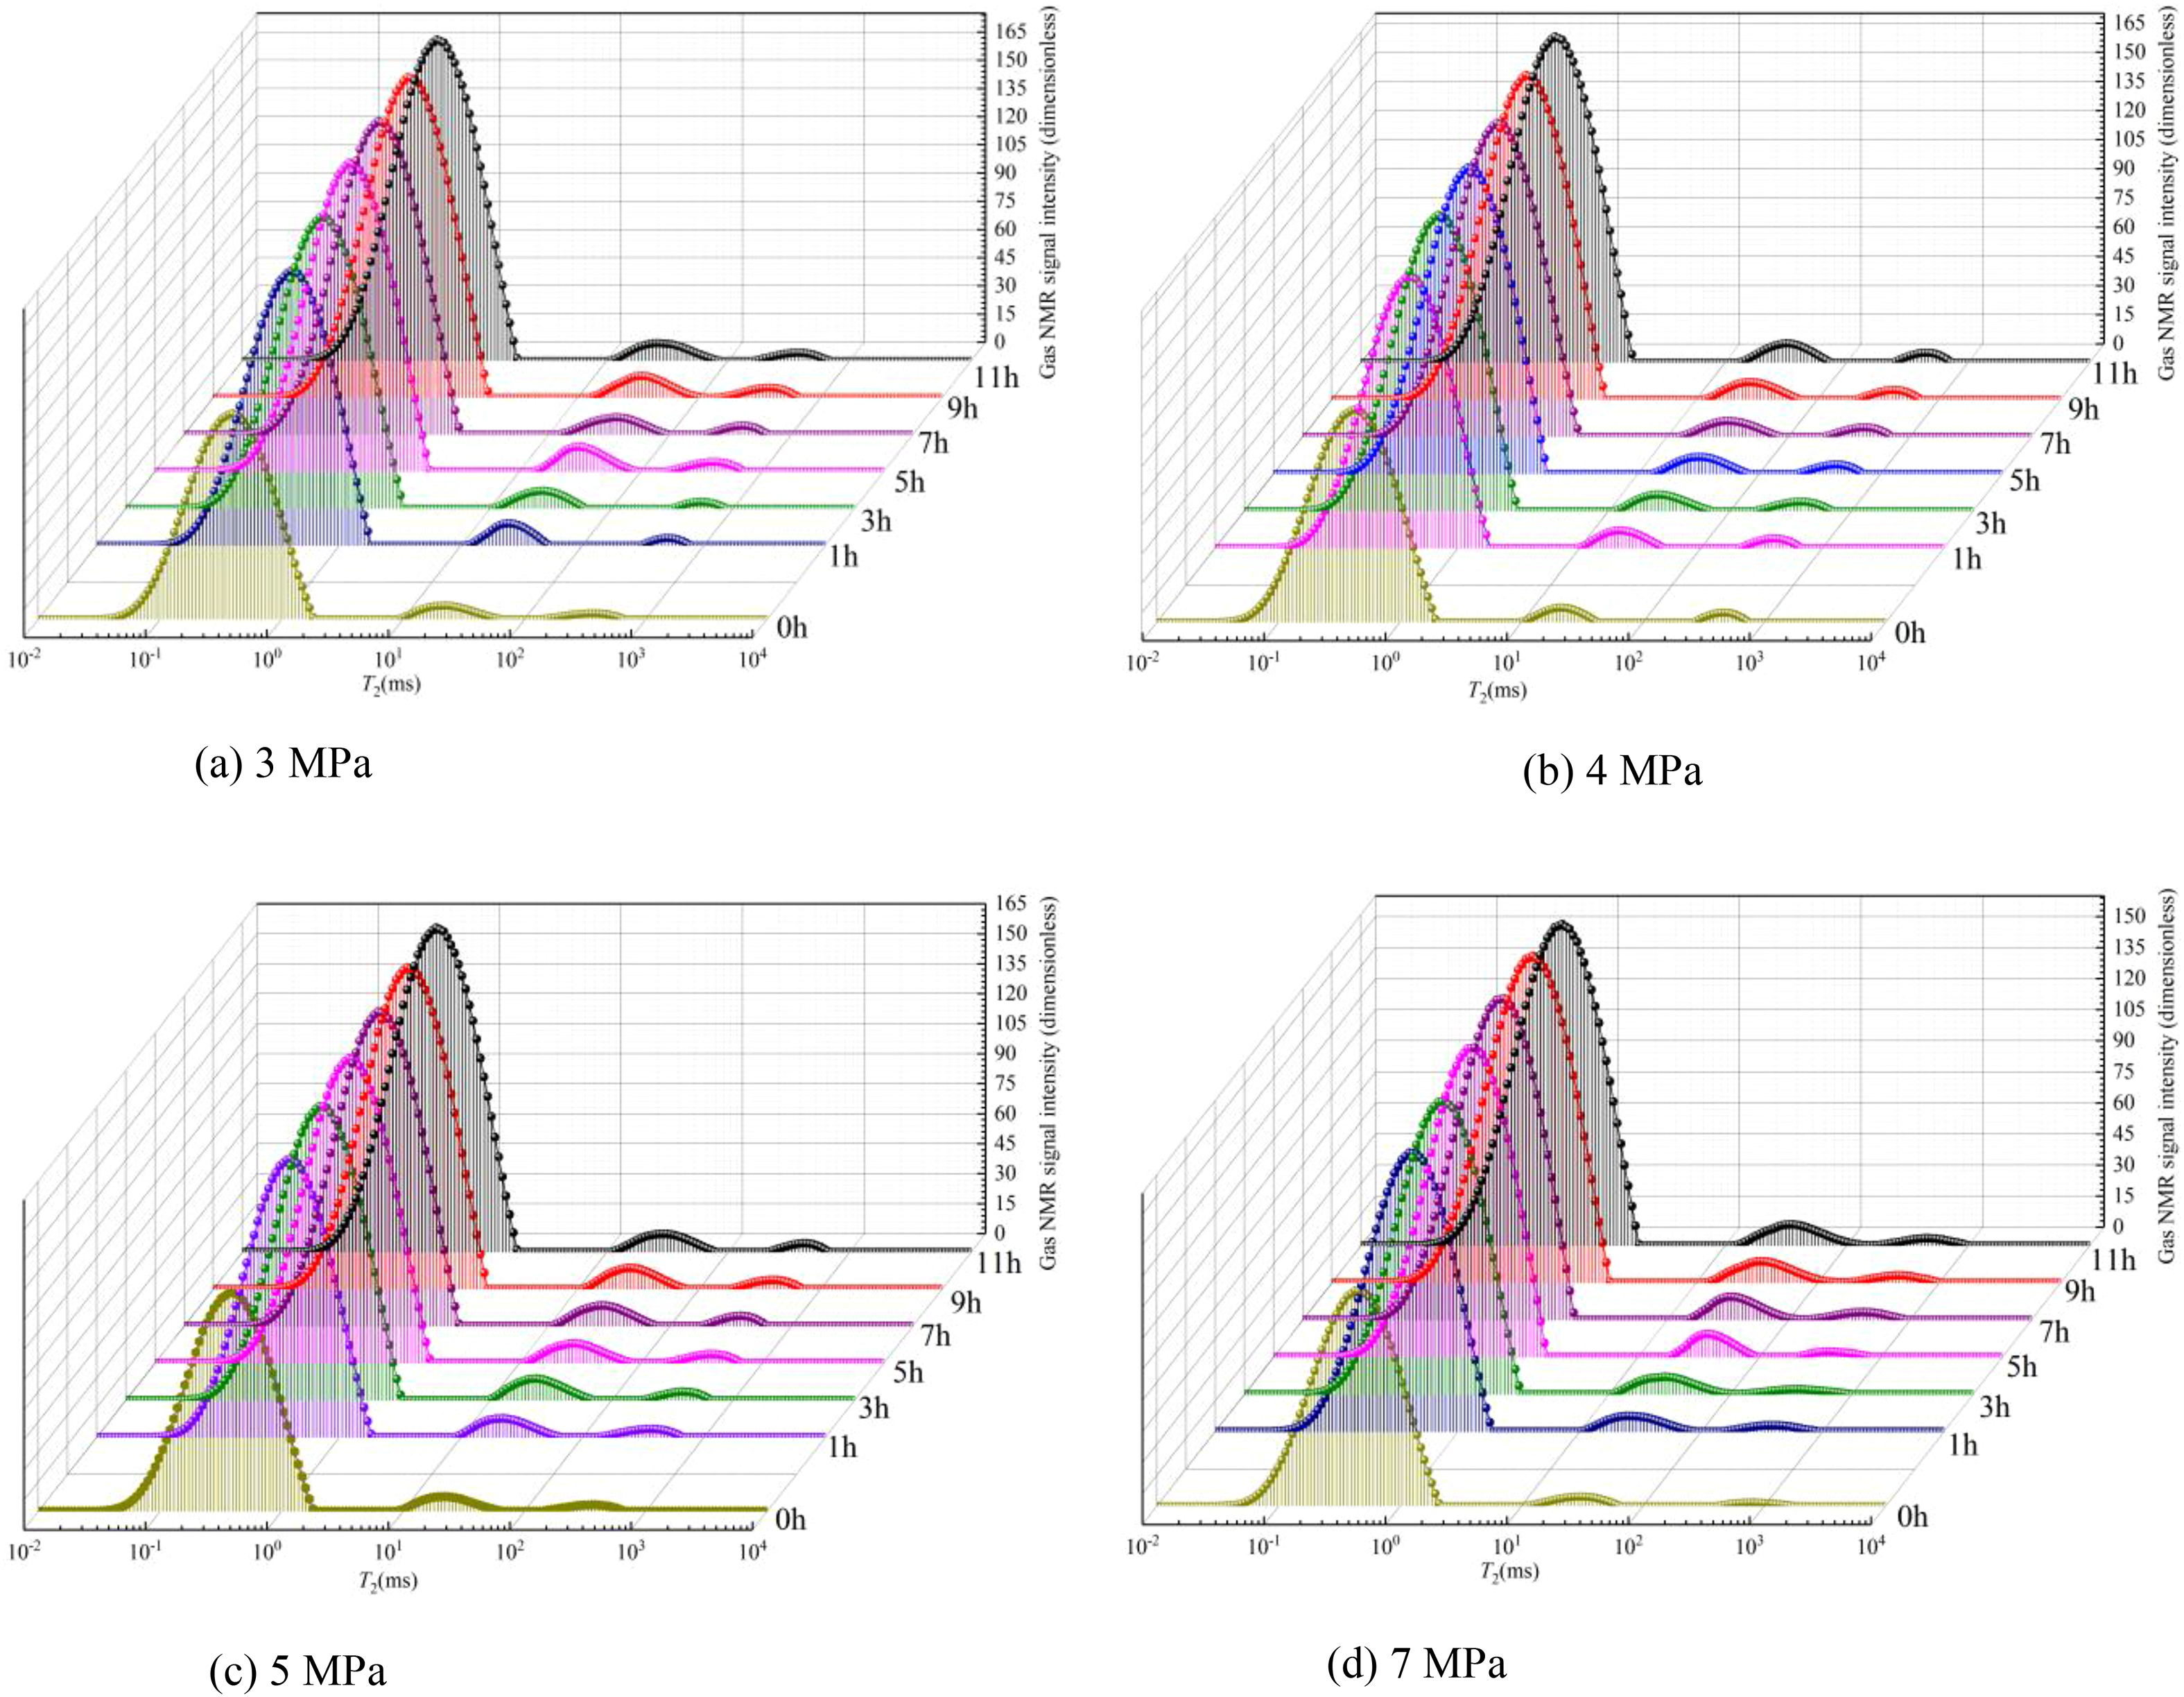
T2 spectrum of methane adsorption process under different confining pressures. (a) 3 MPa, (b) 4 MPa, (c) 5 MPa, (d) 7 MPa.
The mass of adsorbed methane changes with time under different confining pressures
Methane is mainly adsorbed in the micropores in coal. According to the relationship between the T2 spectrum area and the mass of methane in formula (2), the fitting curve of the mass of adsorbed methane with the methane charging time under different confining pressures is shown in Figure 10.
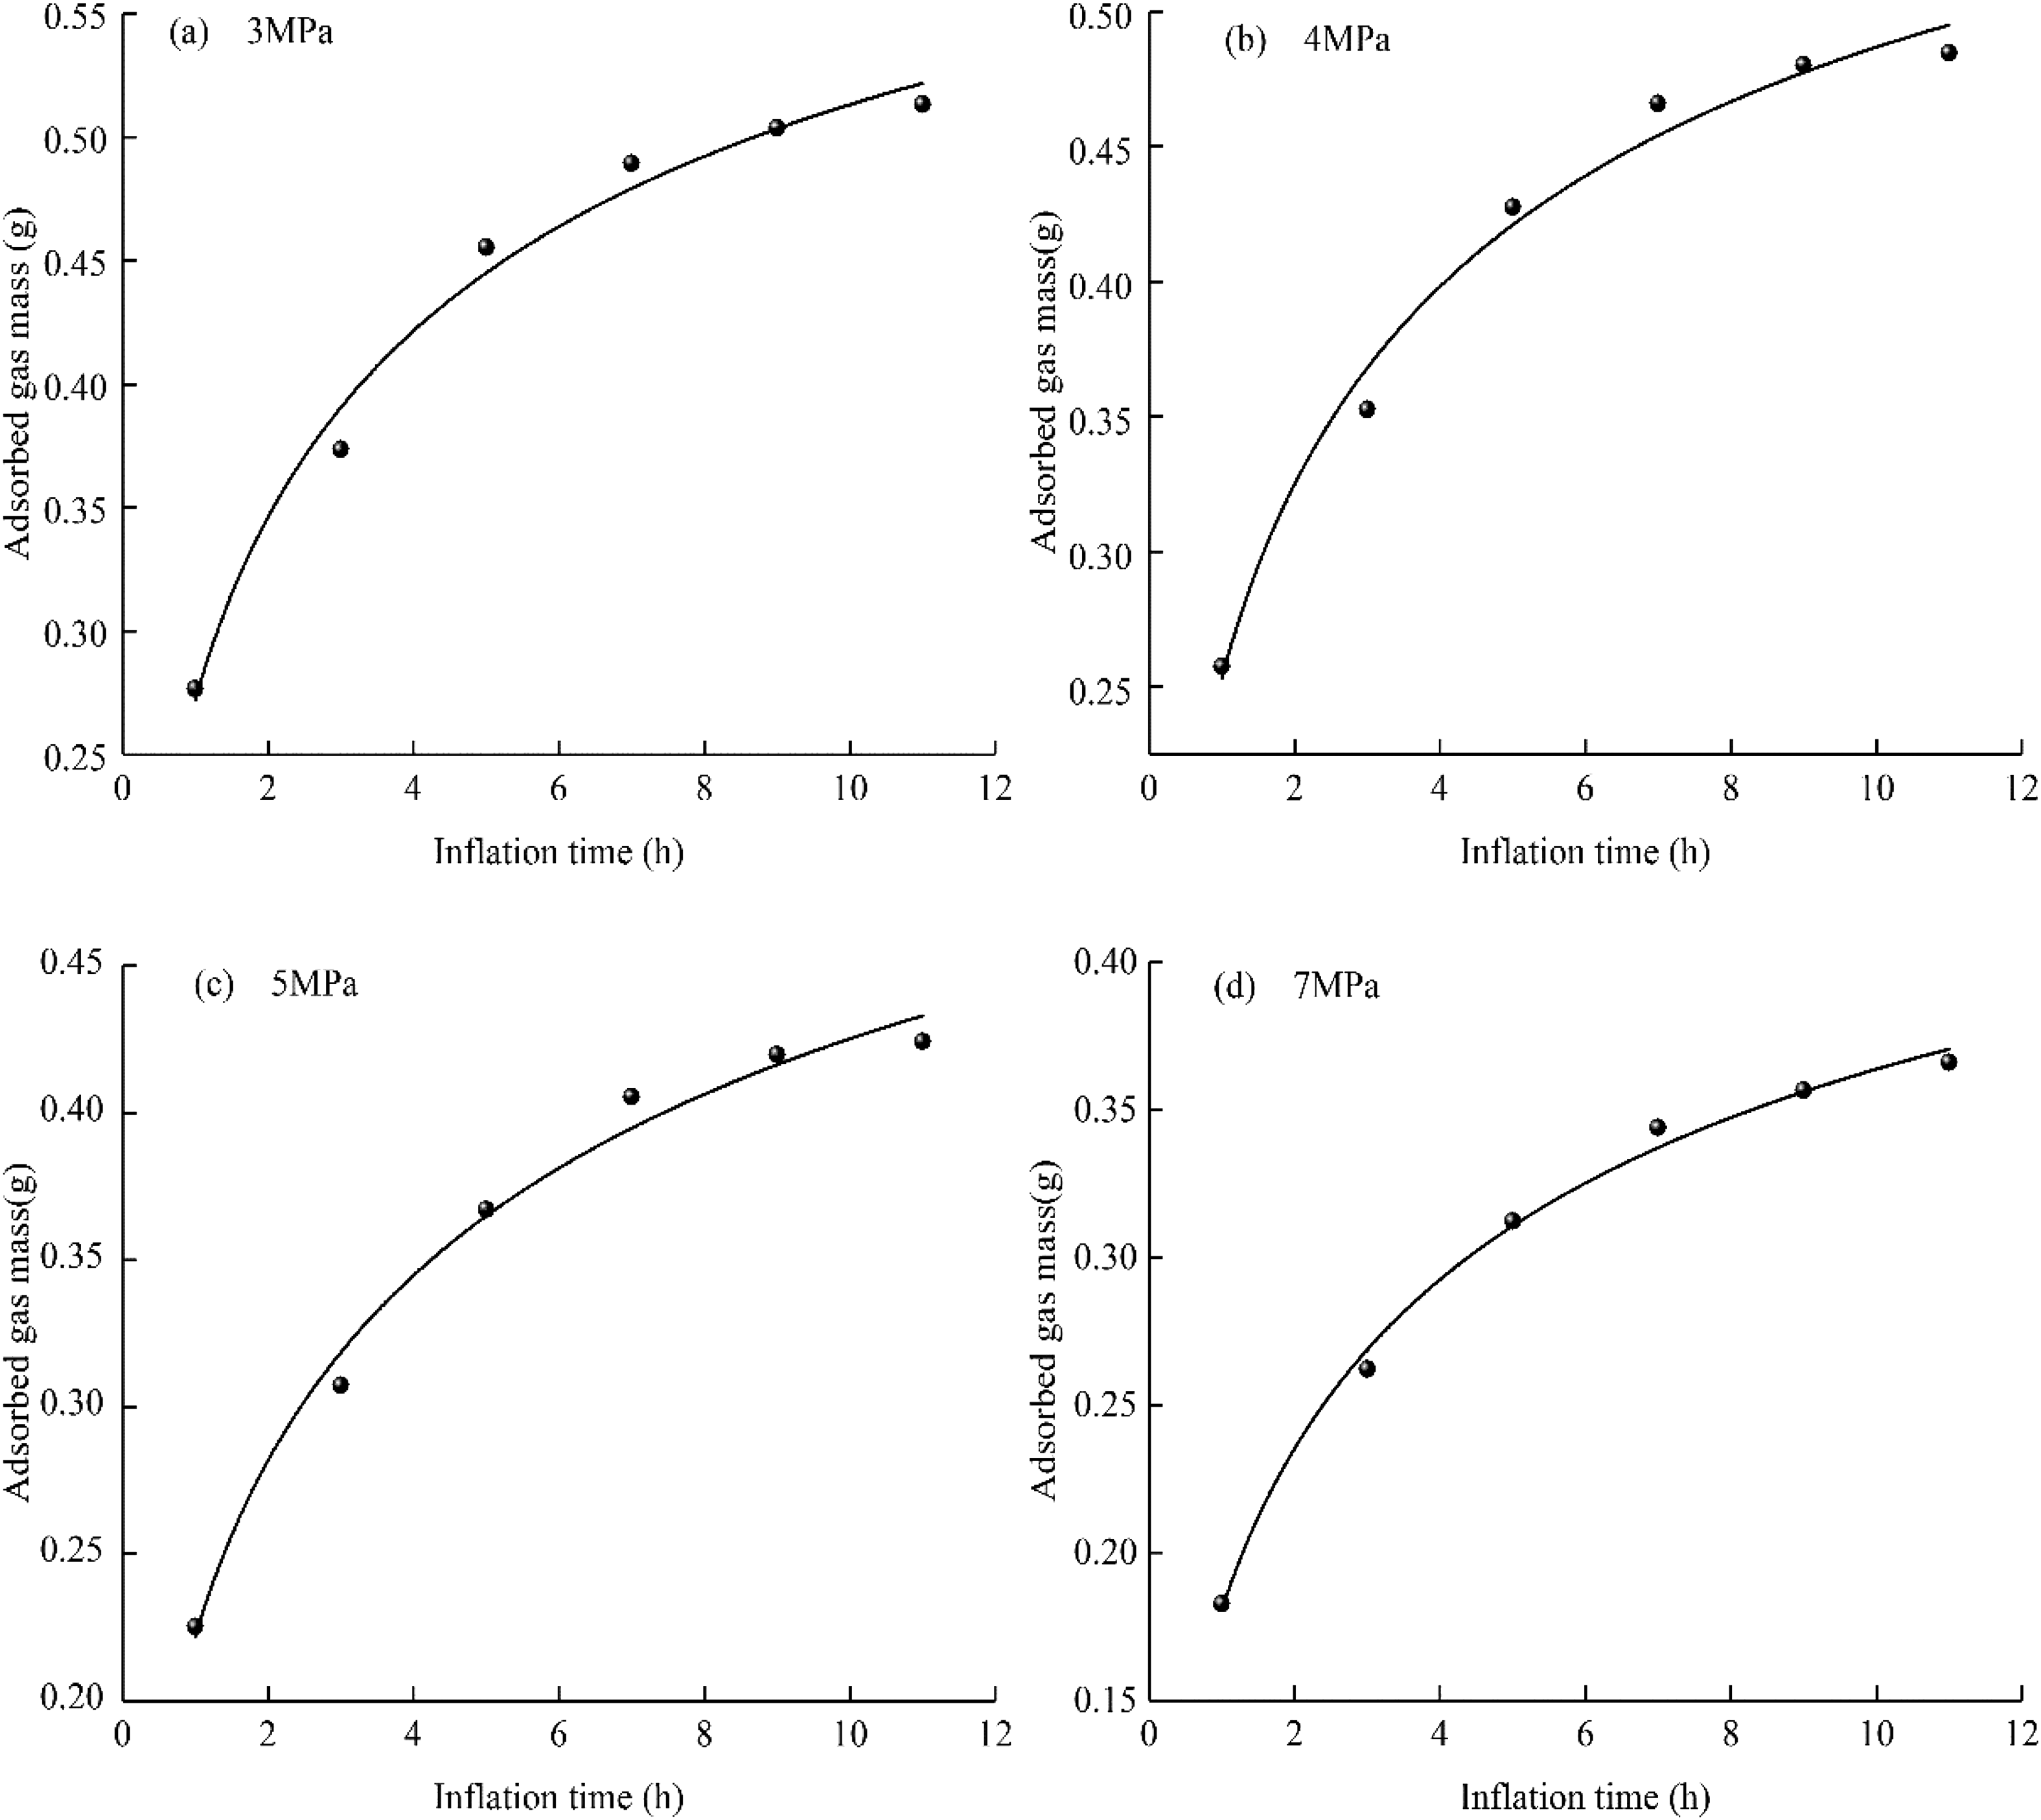
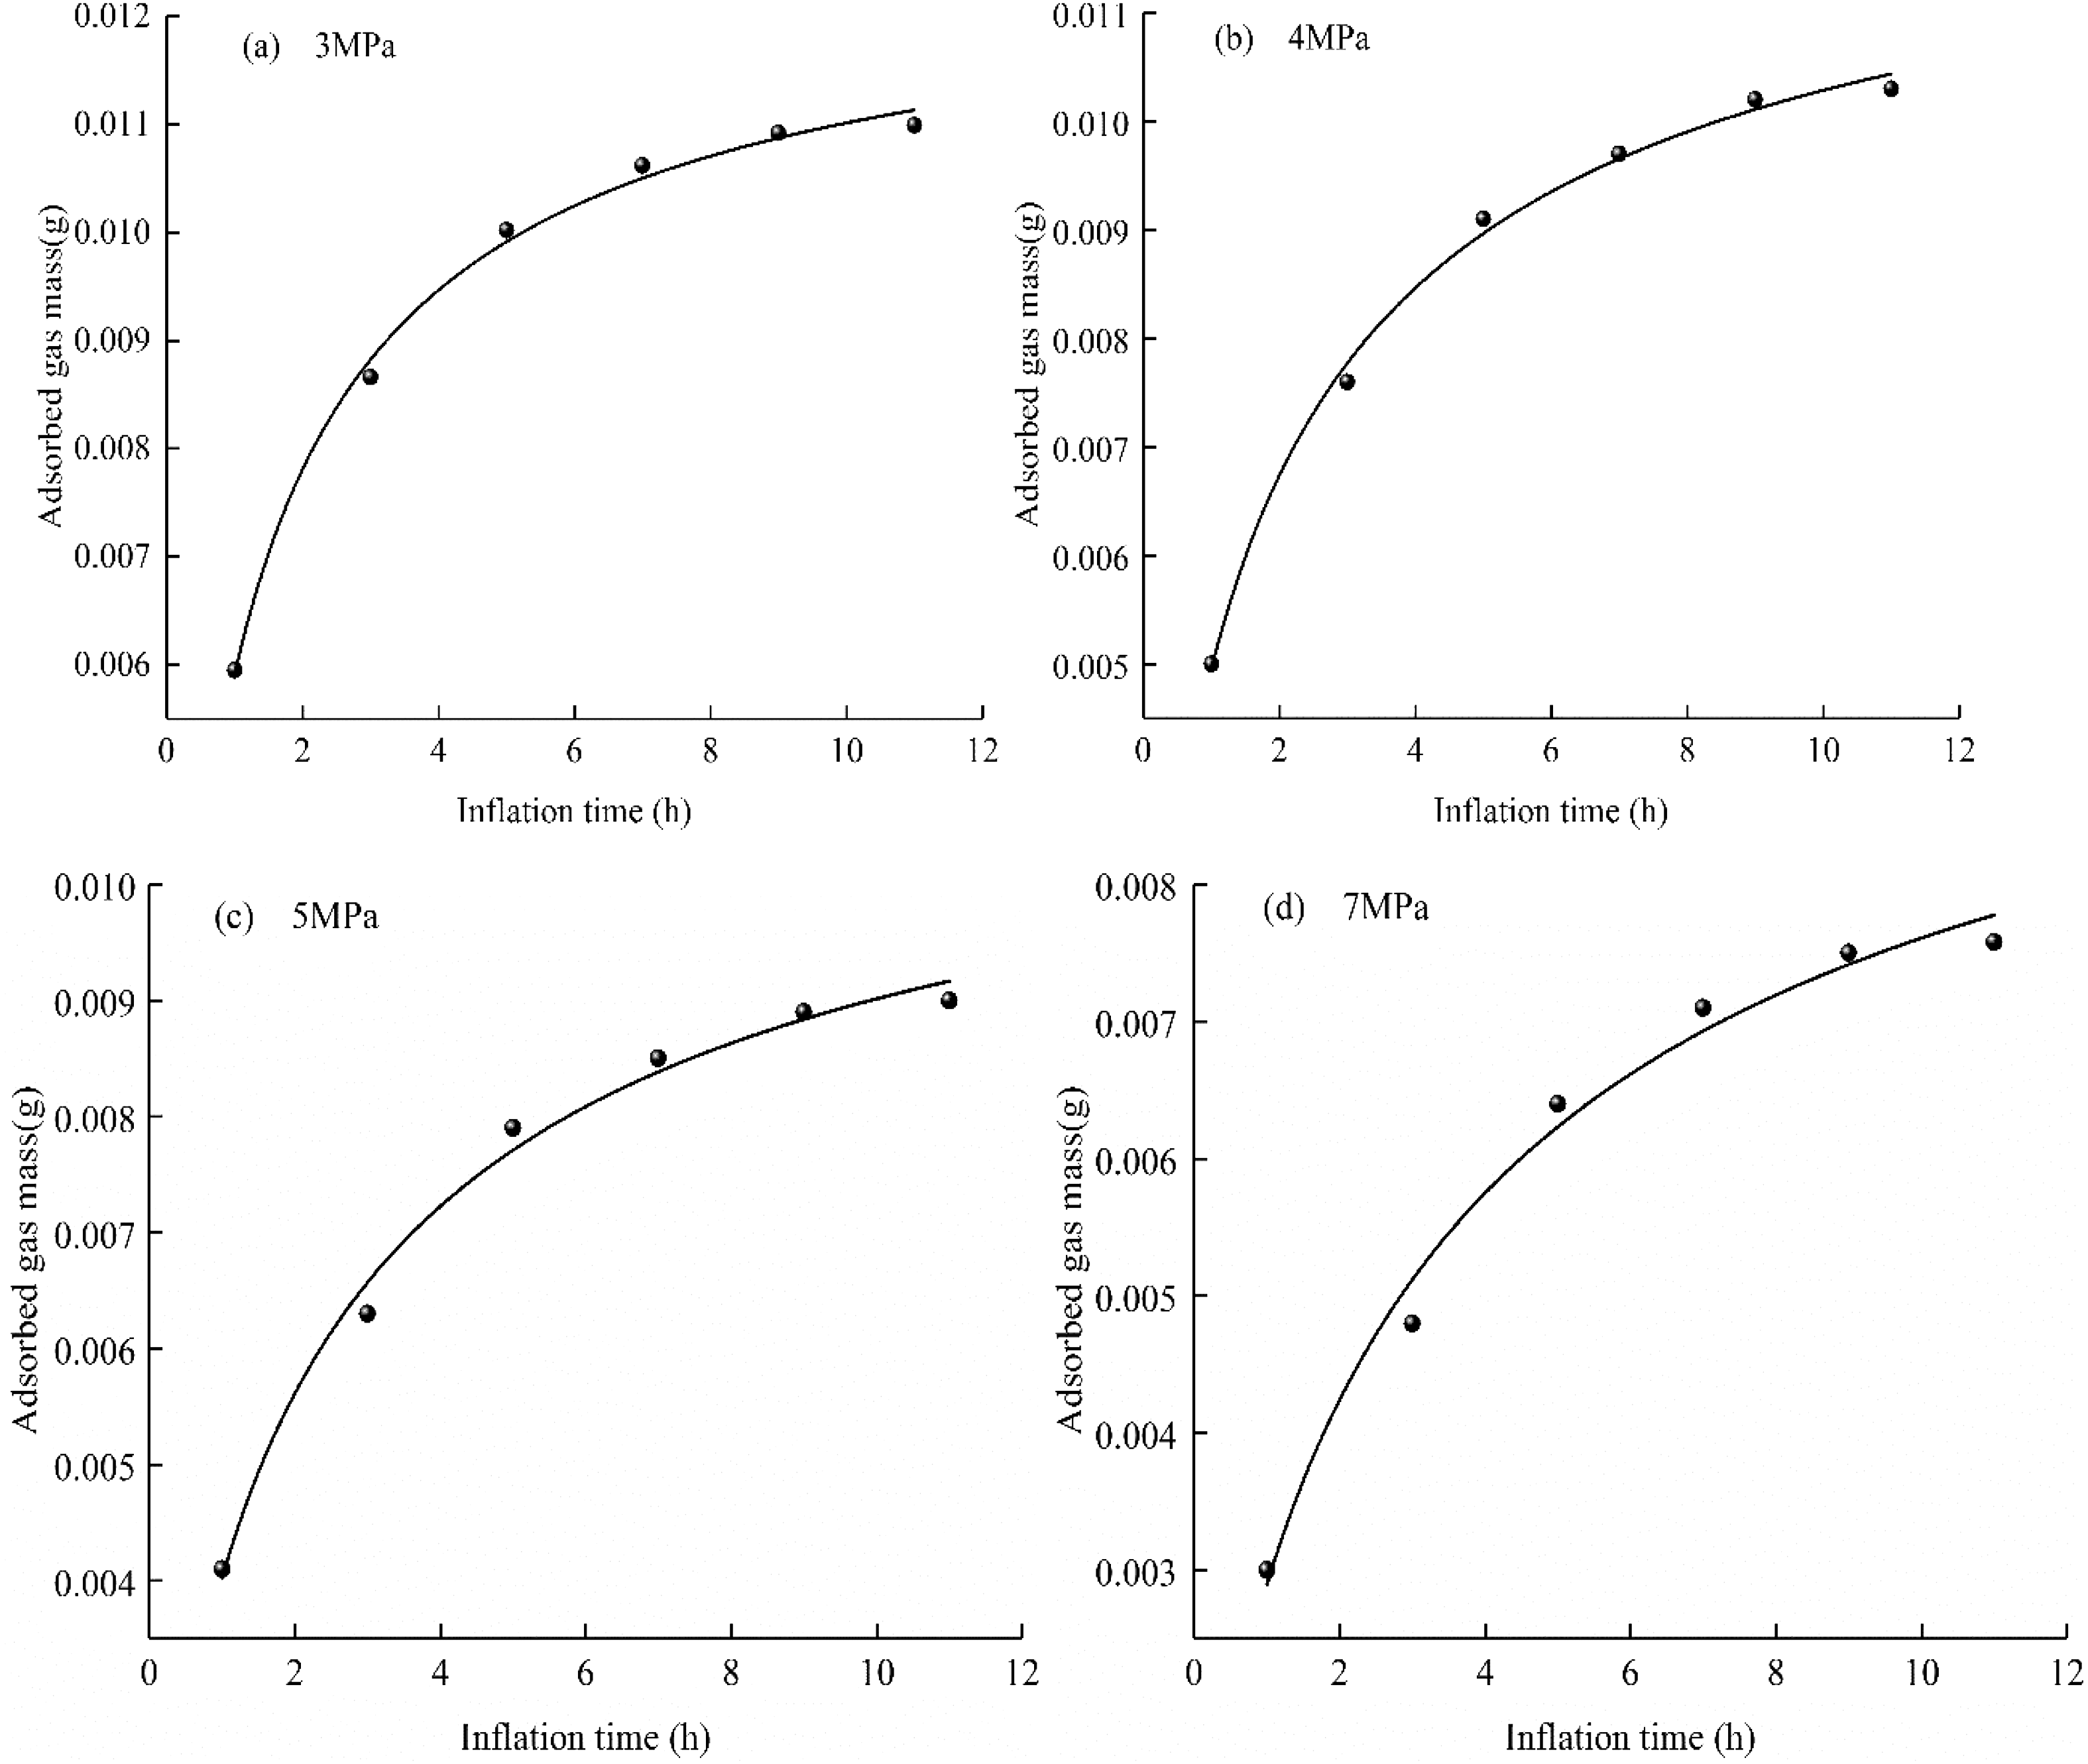
The change curve of adsorbed methane mass with adsorption time under different confining pressures. (a) 3 MPa, (b) 4 MPa, (c) 5 MPa, (d) 7 MPa.
From the analysis of Figure 10, it is clear that when continuously inflating for 11 h at each confining pressure point (3, 4, 5, and 7 MPa), the mass of adsorbed gas increases quickly during the first 5 h (>85.0% of the total mass of adsorption) and gradually reaches an essentially stable value after ∼11 h. As the confining pressure increases, the mass of gas adsorbed during the same adsorption time decreases (the mass of adsorbed gas at a confining pressure of 7 MPa decreases by ∼10.0% compared with that at a confining pressure of 3 MPa), and the larger the confining pressure is, the more evident is the reduction of adsorbed gas (∼30.0%). The amount of gas adsorbed by the coal samples decreases with increasing confining pressure. The prominent peak (of adsorbed methane) T2 was located at (0.011–1.825) ms. This means that increasing the confining pressure has little effect on the micropore structure of coal.
Further analysis shows that a high confining pressure leads to the closure of the larger pores and fissures in the coal, and the flow of gas is hindered. In the experiment, gas was introduced from one end, and high-pressure gas entered the gap between the coal sample and the holder from the gas cylinder. The high confining pressure closed the larger pores and cracks in the coal. During the same inflation time, the gas flowed into the inner pores and cracks of the coal, and the number of adsorbed gas molecules decreased.
The mass of free methane changes with inflation time under different confining pressures
Large pores and cracks in coal are the main migration channels of free gas, and the T2 spectrum area of free gas represents the mass of gas contained in the large pores and cracks in the coal sample. According to the relationship between methane mass and the T2 spectrum area in formula (2), the fitting curve of the mass of free methane with the methane charging time under different confining pressures is shown in Figure 11.
The curve of free methane content with time under different confining pressures. (a) 3 MPa, (b) 4 MPa, (c) 5 MPa, (d) 7 MPa.
In Figure 11 the mass of free gas increases to <80.0% during the first 5 h and then gradually slows down until it reaches an essentially stable value. Under different confining pressures, the mass of free gas during the same inflation time decreases with increasing confining pressure. Taking confining pressures of 3 and 7 MPa as examples, the mass of free gas at a confining pressure of 7 MPa at 5 h of inflation is reduced by 36.0% compared with that at 3 MPa. In Figure 9, subpeak T2 (of the free methane) is located at 11.098–89.077 ms when the confining pressure is 3 MPa, and when the confining pressure is 7 MPa the sub-peak T2 is located at 7.843–77.526 ms. This shows that increasing the confining pressure has a squeezing effect on the medium- to large-pore structures of coal.
The mass of gas adsorbed on the coal surface is closely related to the surface area of the coal. Gas is mainly adsorbed on the large specific surface area in the tiny pores of the coal. Figure 11 shows that under the same adsorption conditions, the rate of increase in the mass of the free gas becomes slower with increasing confining pressure. This phenomenon is more obvious at higher values of confining pressure. After summarizing the previous research results, (Hower et al., 1997) believes that the confining pressure and stress can cause macroscopic and microscopic deformations without involving changes in nanoscale structures.
From the results of scanning electron microscopy observations of the coal sample in Figure 12, the experimental coal sample has developed single or crossed cracks, the cracks are long and narrow, and the insides of the cracks are interconnected to form a crack network. Previous studies have shown that the stress damage of cracks (and coal and rock pores) have nonlinear characteristics that increase as the pore diameter increases. With the increase in confining pressure, the change in pore and crack diameters shows the characteristics of the largest degree of crack change along with the weakest micropores (Liu et al., 2015, 2016). Therefore, the experimental coal samples show that the gas adsorption amount decreases with increasing confining pressure during the same aeration time. Additional experiments involving the influence of confining pressure on coal sample gas adsorption using low-field NMR further verified the effect of confining pressure on the pores of coal samples. These showed that the amount of adsorbed and free gas decreases as the confining pressure increases during the same aeration time.
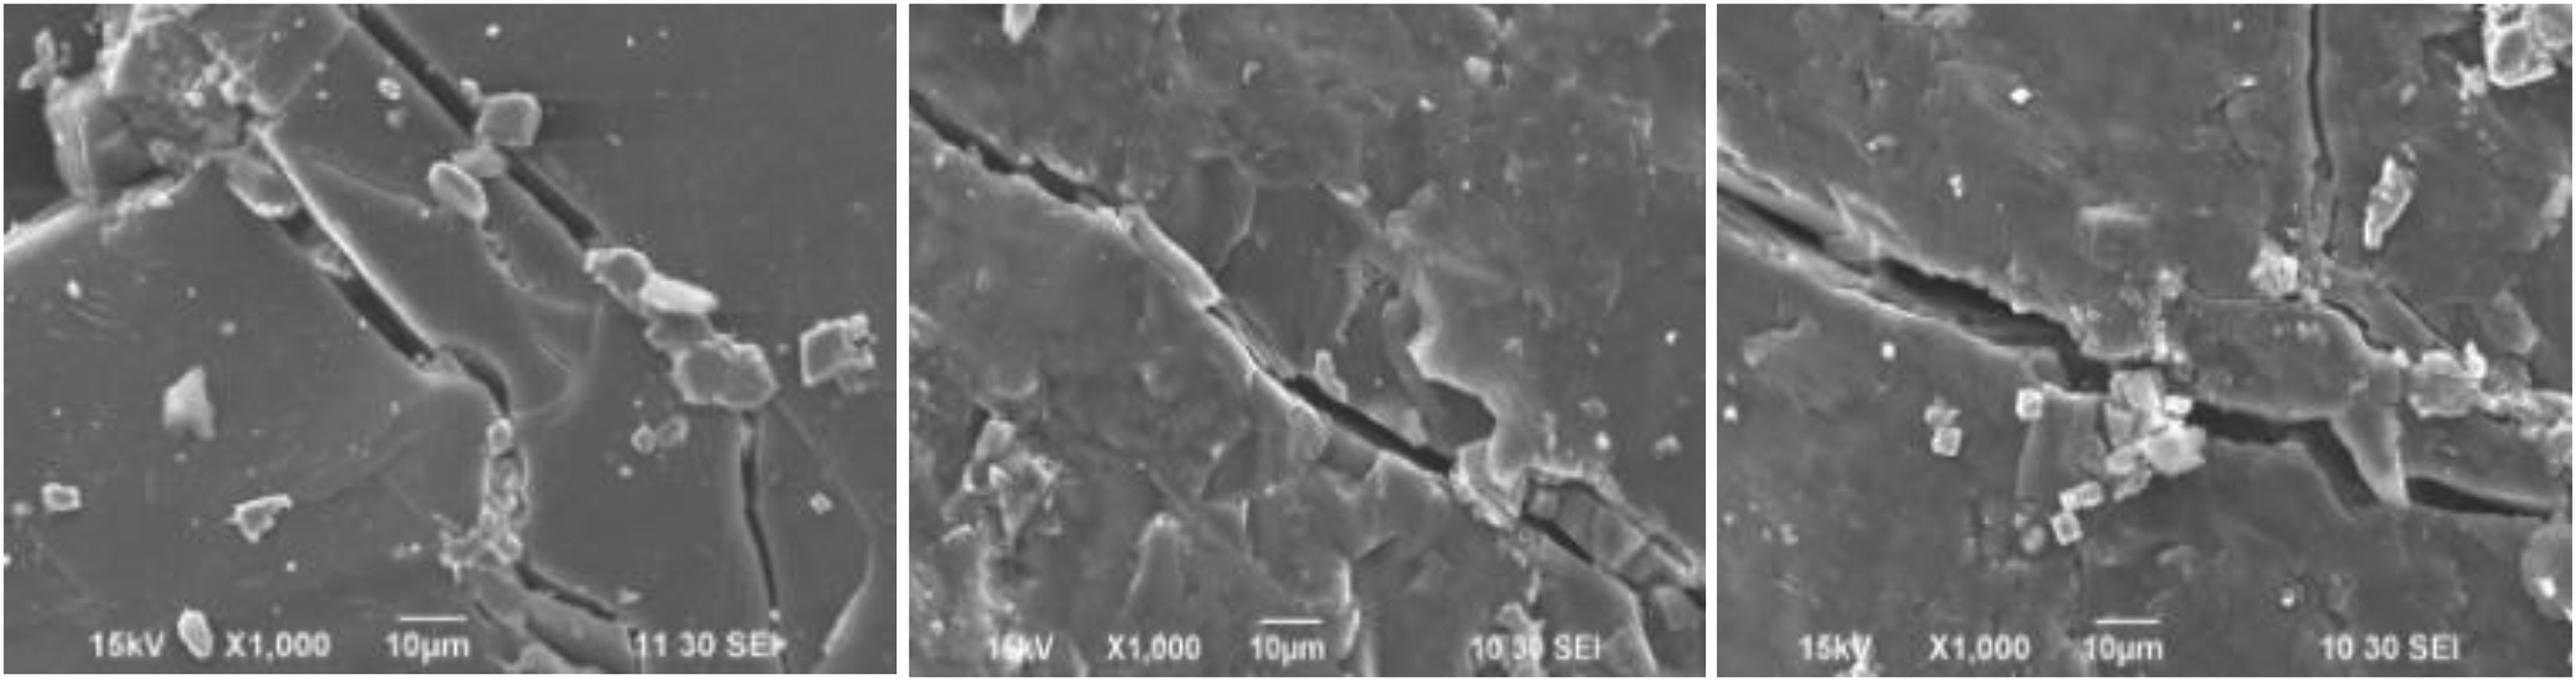
Holes and fissures in coal samples (1000×).
Conclusion
(1) The influence of different gas pressures on the adsorption process of columnar coal samples is obtained. Consider each inflation pressure point (0.31, 0.74, 1.11, and 1.46 MPa) being inflated for 11 h: As the methane pressure increases, the mass of free methane increases continuously during the same inflation time. The mass of adsorbed methane increases quickly during the first 5 h (>85% of the total mass of adsorbed methane) and then gradually reaches an essentially stable value, reaching a value even >90% of the total mass of adsorbed methane when the pressure >1 MPa. The amount of adsorbed-state gas and free-state gas under different aerated gas pressures satisfies the relational formula
(2) The analysis shows the influence of confining pressure on the gas adsorption process of columnar coal samples. When inflated for 11 h at each confining pressure (3, 4, 5, 7 MPa), the confining pressure increases and the mass of free methane decreases during the same inflation time. The mass of adsorbed methane increases significantly during the first 5 h (>85.0% of the total mass of adsorbed methane). When the confining pressure is <5 MPa, the mass of adsorbed methane will exceed 85.0% of the total mass of adsorbed methane and then will gradually stabilize. Increasing the confining pressure has a squeezing effect on the medium- to large-pore structure of free gas, but this squeezing effect has no obvious effect on the micropore structure of adsorbed gas. As the confining pressure increases, the large pores in the coal sample are closed, the mass of gas that seeps into the deeper part of the coal sample within the same aeration time is reduced, and the increase in adsorbed and free gas is reduced.
Footnotes
Declaration of conflicting interests
The authors declared no potential conflicts of interest with respect to the research, authorship, and/or publication of this article.
Funding
The authors disclosed receipt of the following financial support for the research, authorship, and/or publication of this article: The research was sponsored by the national nature science foundation of China (51734007 and 52074106), national key research and development program of China (2018YFC0808103), science and technology planning project of Henan Province of China (212102311146), the fundamental research funds for the universities of Henan Province (NSFRF200317, NSFRF180338), training plan for young backbone teachers of colleges and universities in Henan Province (2020GGJS053), the Key Scientific Research Projects in Colleges and Universities in Henan (19A440003), the Doctoral Fund of Henan Polytechnic University (B2019-56), Zhongyuan Postdoctoral Innovative Talent (ZYQR201810171), the China Postdoctoral Science Foundation Grant (2019M652536) and the Henan Postdoctoral Foundation (001801016).