
Abstract
The pore characteristics of coal reservoirs play a very important role in the migration of coalbed methane reservoirs, and its heterogeneity has been studied by a large number of scholars. However, there are few studies on lignite reservoirs. In this paper, three sets of lignite reservoirs in the Jiergalangtu depression are taken as the research object. The scanning electron microscope (SEM) images are converted from time-domain signals to frequency-domain signals through Fourier transformation, which quantitatively characterizes the heterogeneity of coal reservoirs. The variance of the value indicates that the three sets of coal seams NO.4Var<NO.5Var<NO.6Var. Through nitrogen adsorption experiment and fractal analysis, the pore continuity, surface roughness, pore structure, pore type and other aspects are studied. The lignite in the study area has high pore surface roughness and complex pore structure. Affected by various geological factors such as material composition, coal-forming environment, degree of evolution and other geological factors, lignite reservoirs in different layers and different mining areas show obvious heterogeneity.
Introduction
Coalbed methane (CBM) is a kind of clean energy, and its development and utilization not only benefits coal mine safety but also helps reduce greenhouse gas emissions (Bertoli et al., 2013; Montgomery, 1999; Moore, 2012; Singh et al., 2016; Xu et al., 2012). Low CBM resources are abundant, and in recent years it has become a hot spot for China's coalbed methane exploration and development (Xin et al., 2019). However, the exploration effect of China's low-rank coal is not satisfactory (Qin, 2018; Xu et al., 2015a; Yang and Han, 1979). Understanding the properties of lignite reservoirs is essential for CBM exploration and development.
Due to the uneven distribution of material composition and pore-fracture, coal reservoirs usually have strong heterogeneity in the vertical direction (Ward, 2002). The pores of coal reservoirs can be divided into seepage pores with a diameter greater than 100 nm and adsorption pores with a diameter of less than 100 nm. The adsorption pores have a large specific surface area, which mainly affects the adsorption, desorption and diffusion of coalbed methane (Tao et al., 2019). It has been shown that the different surface morphologies in the pores are also important factors in determining the methane adsorption capacity (Kumar et al., 2021). Studies have shown that methane adsorption is proportional to porosity (Kumar et al., 2019a; Kumar et al., 2019b).
The characterization of coal pore structure is mainly carried out by two methods: fluid intrusion and imaging description (Li et al., 2012; Liu et al., 2017; Nie et al., 2015). Due to the strong heterogeneity of the reservoir, the resolution and accuracy of coalbed methane reservoirs have been continuously improved. The fluid intrusion method is used for detection in different aperture ranges, such as adsorption of low-temperature nitrogen and carbon dioxide (Emmett, 1948; Xin et al., 2021). Small-angle neutron scattering and small-angle x-ray scattering are mainly used for small-diameter adsorption pores (Larsen et al., 1995; Sakurovs et al., 2012). Among them, low-temperature nitrogen adsorption is efficient and has the advantages of a wide range of test pore sizes (Xu et al., 2015b; Zhang et al., 2019). Imaging methods include two-dimensional imaging methods, such as scanning electron microscopy (SEM) and broad ion beam scanning electron microscopy (BIB-SEM), as well as three-dimensional imaging methods, such as focusing on ion beam scanning electron microscope (FIB-SEM) and ion beam-Helium ion microscope (FIB-HIM). Among them, scanning electron microscopy is the most widely used image description method because it is cost-effective.
Previous studies separated the pores in SEM images of coal samples by setting appropriate gray thresholds and then analyzed the pore structure characteristics of coal (Liu and Nie, 2016). However, considering that the brightness of different types of pores may be different and the uneven surface of the coal sample will affect the distribution of brightness, and many other factors will affect the distribution of grayscale, it is difficult to accurately identify all the pores in SEM images by a single threshold. Fourier analysis can mine the information in the frequency domain by identifying the degree of change in the brightness of SEM image to achieve effective identification of pores in coal. Fractal theory Fractal theory has been widely used in the analysis of coal reservoir pore structure (Fu et al., 2017; Wang and Li, 1997; Zhao et al., 2016), which can effectively evaluate the properties of pores in porous materials.
In this paper, based on maceral analysis and proximate analysis, the pore structure and its heterogeneity of lignite were analyzed. The composition and pore characteristics of the lignite in the Erlian Basin were analyzed by improved scanning electron microscope images and low-temperature nitrogen adsorption. It was expected to provide a reference for the efficient exploration and development of the CBM.
Geological setting
The Erlian Basin is a Mesozoic and Cenozoic intracontinental faulted basin in northern China. It is mainly composed of five subbasins and one uplift, including the Chuanjin subbasin, the Manite subbasin, the Wulanchabu subbasin, the Wunite subbasin, the Tengger subbasin and Sunite uplift (Figure 1(a); Lin et al., 2001). The coal seams in this basin are mainly developed in the Lower-Middle Jurassic and Lower Cretaceous strata. The Lower Cretaceous is composed of the Aershan Formation, the Tengger Formation and the Saihantala Formation (Figure 1(b); Wang et al., 2019). Saihantala Formation is dominated by fluvial facies. Jiergalangtu sag is located in the Wunite subbasin. The Saihantala Formation in this area is rich in coal resources, and a huge thick coal seam is developed. The maximum coal cumulative thickness exceeds 200 m, the coal-bearing area is 342km2, and the coal reserves are 22.4 billion tons.
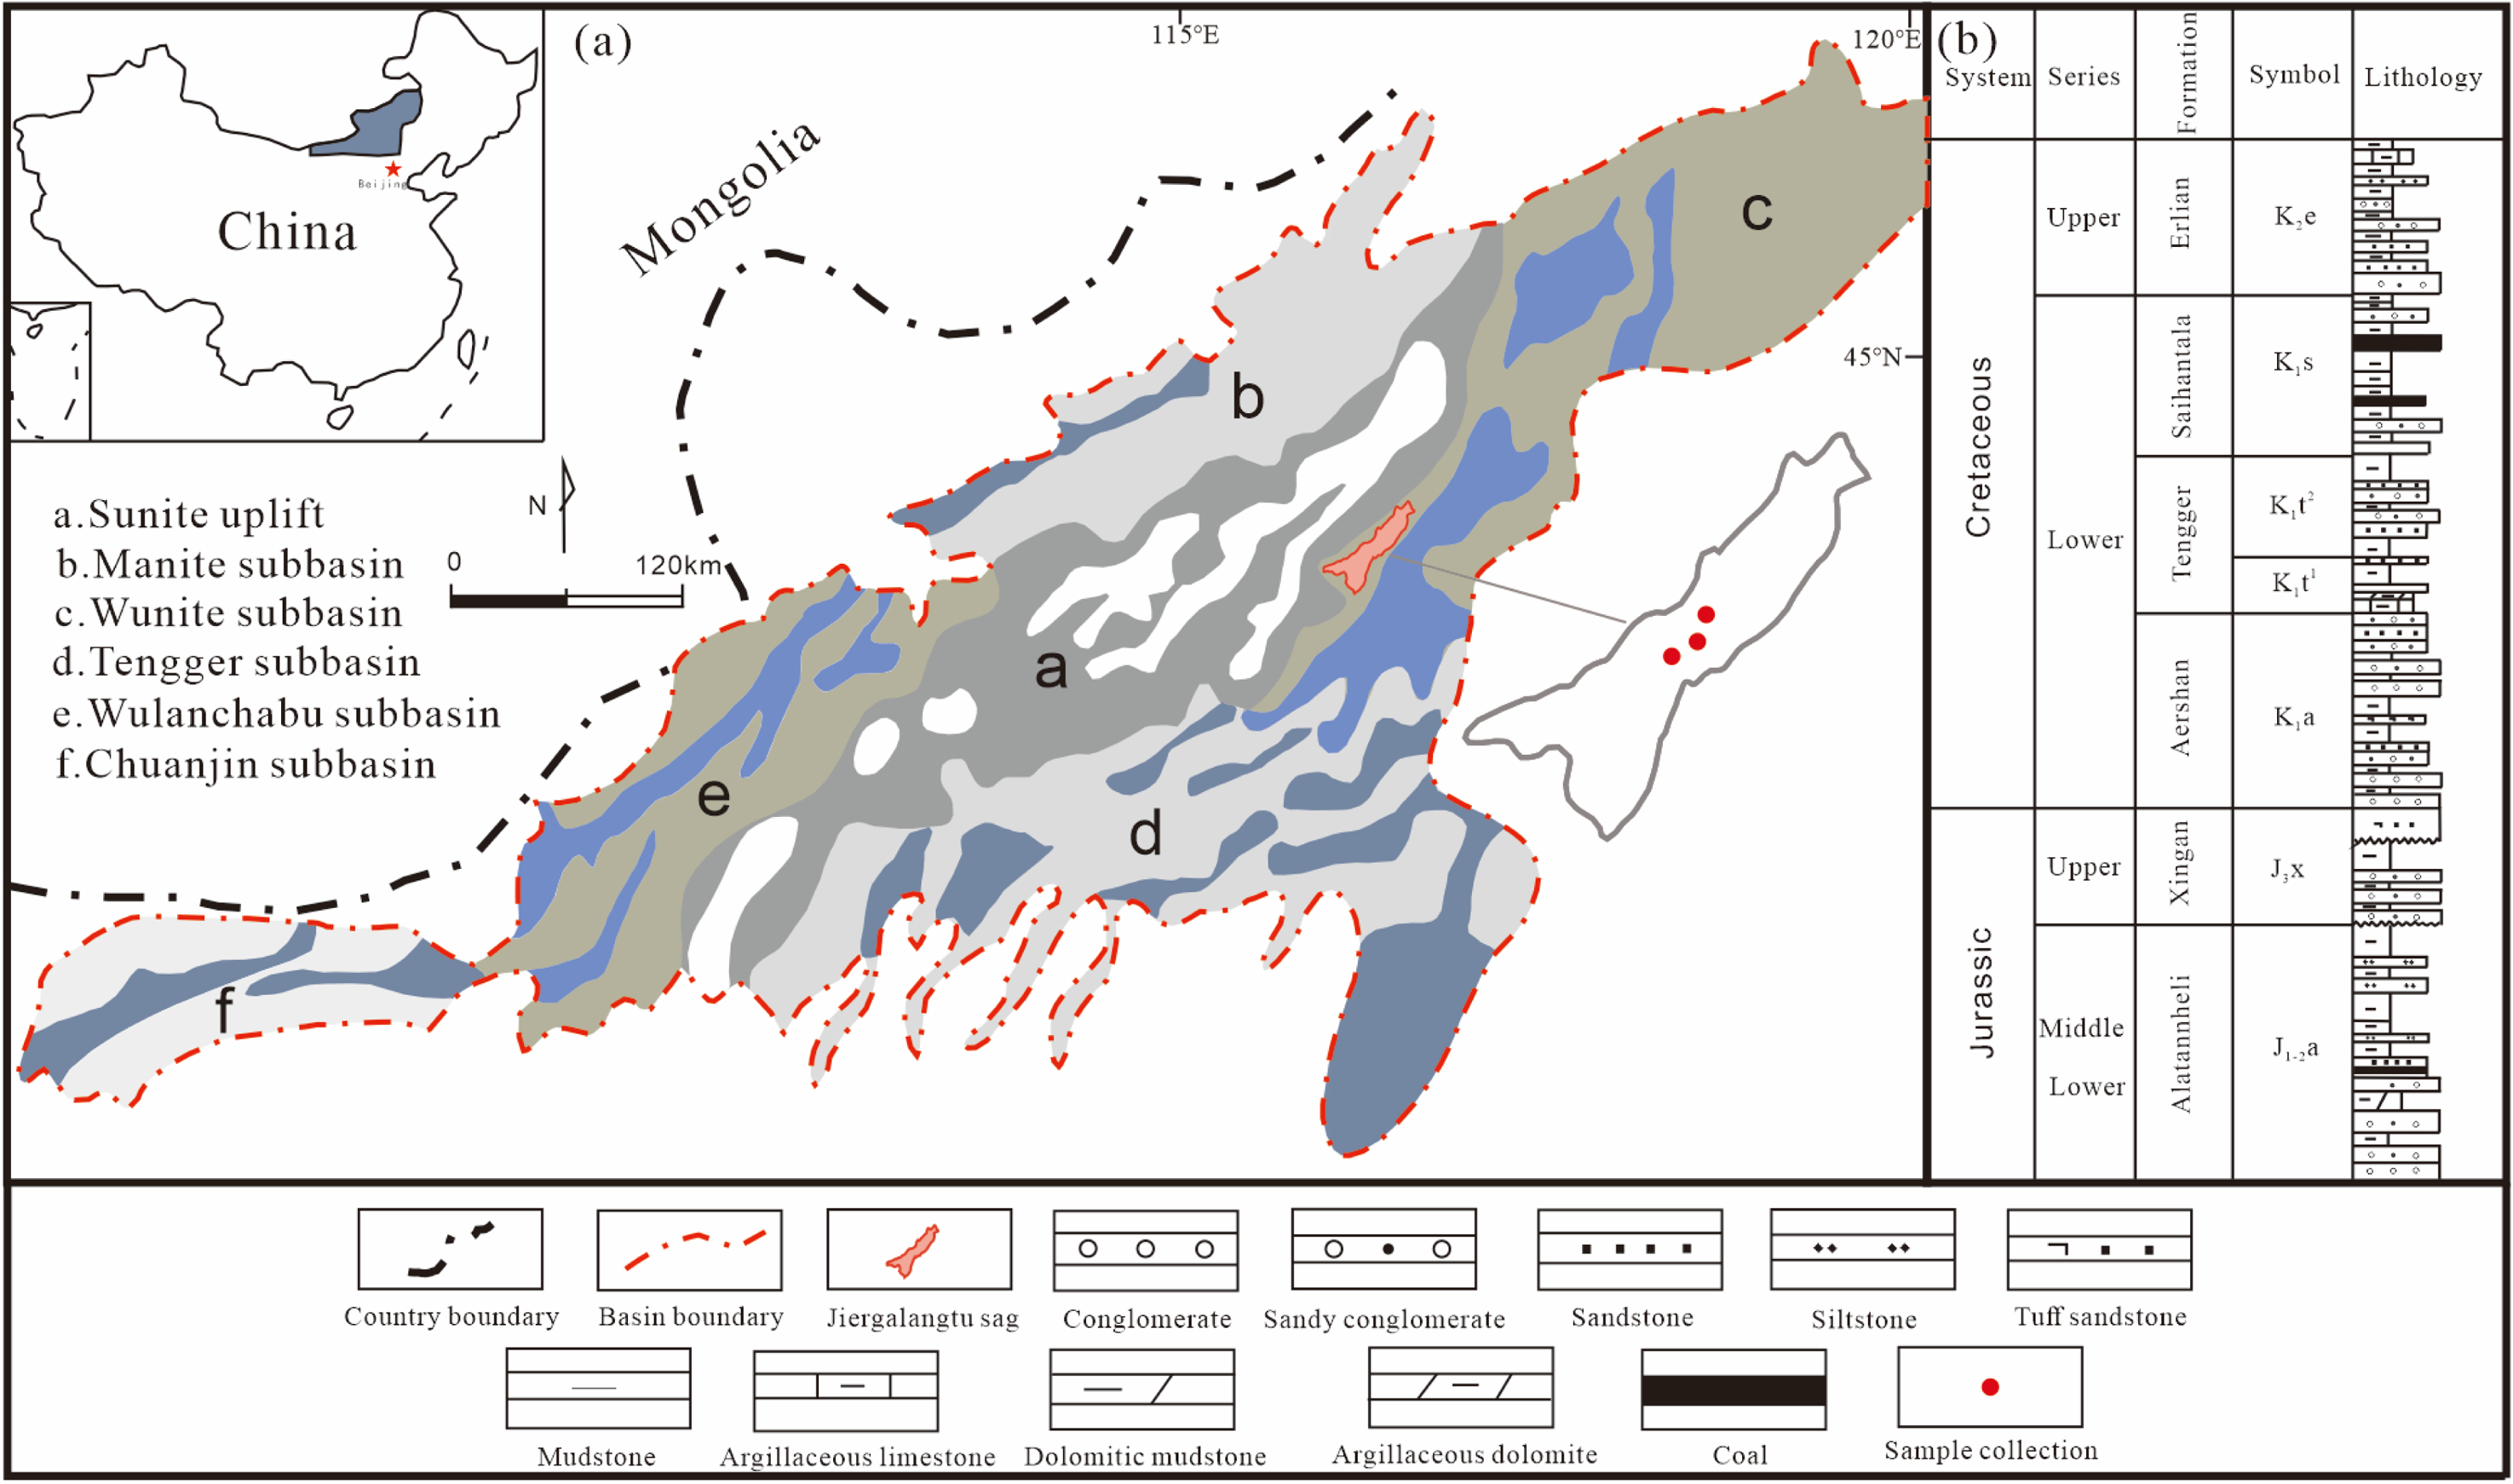
Location, structural units, and stratigraphic column of the Erlian basin. (modified from Xin et al., 2020).
Experiments and methods
Samples
The three sets of coal seams (NO.4, NO.5, NO.6) are the main mined coal seams in the area (Figure 2(a)). The thickness of NO.4 coal seam is 19.3 m on average, which is relatively thin compared with other coal seams. The average thickness of NO.5 and NO.6 coal seams is about 70 m, which is widely distributed. The sample collection takes into account the main mining seam, the depth of the sample, the horizontal and vertical spreading of the coal seam and other factors, and the sample has strong representativeness.
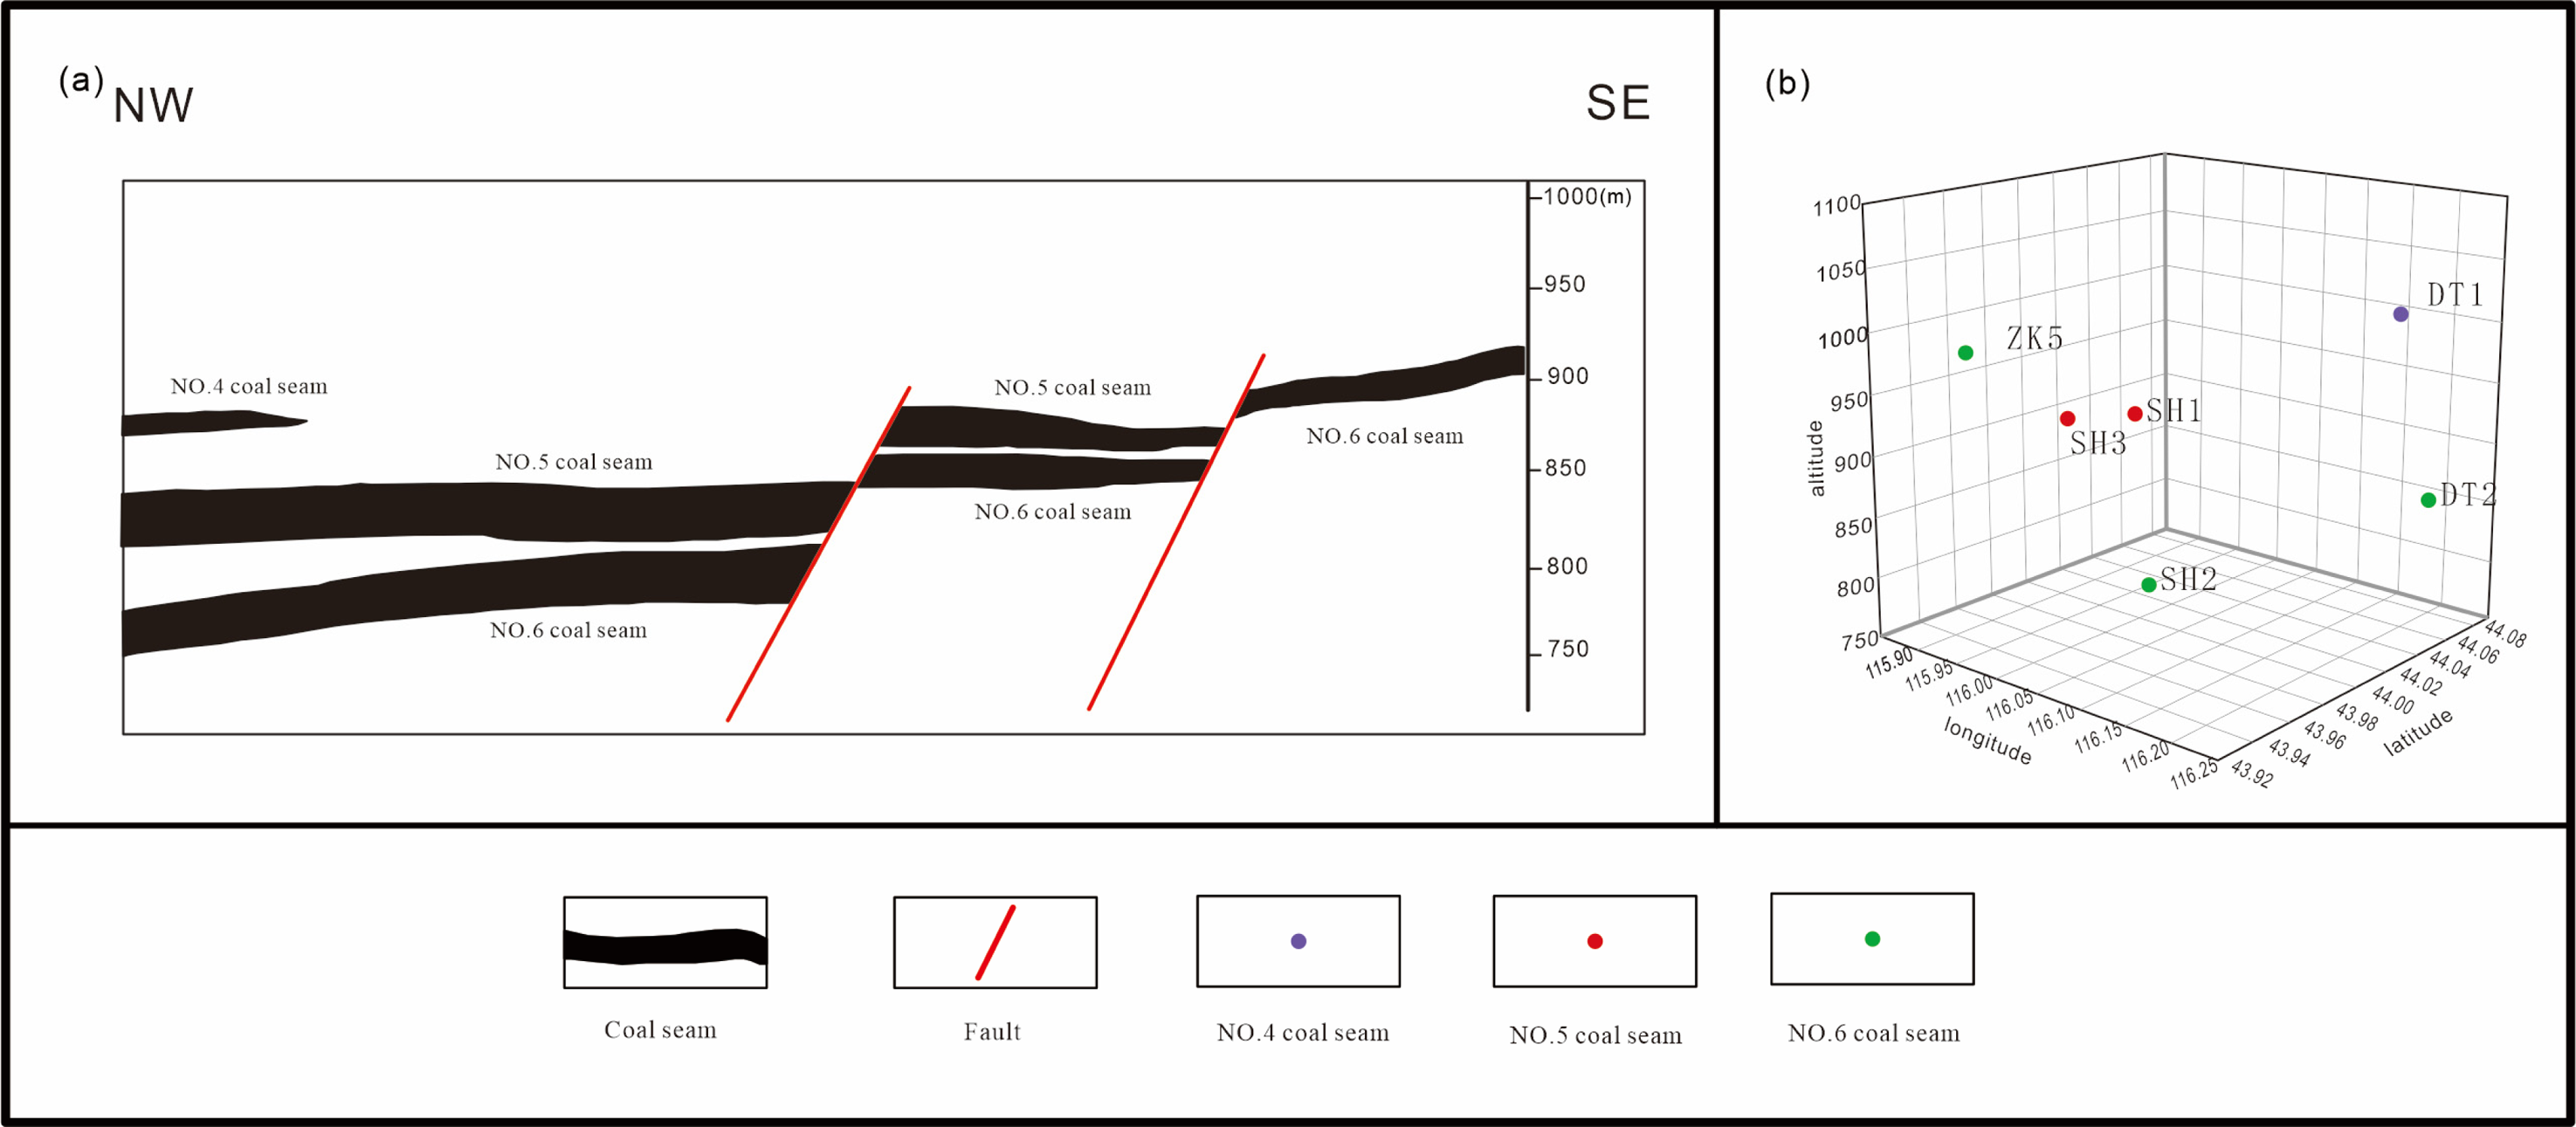
Sample spatial distribution.
13 samples of three sets of coal seams (NO.4, NO.5, NO.6) were collected from Datang Coal Mine, Shenhua Coal Mine, and Zhekuang Coal Mine in Jiergalangtu Sag, Erlian Basin, Inner Mongolia, China. In this study, samples of different coal seams were collected to reveal the heterogeneity of lignite reservoirs. The distribution and spatial position relationships of the samples are shown in Figure 2(b). Lignite easily loses moisture at room temperature, and then fresh coal samples were collected from the working surface and immediately packed in sealed valve bags. Then the coal samples were quickly measured in the laboratory.
After sample collection, proximate analysis, huminite reflectance measurement and maceral analysis were performed. Maceral analysis is the basis for studying the composition and structure of lignite. In the process of maceral analysis, the lignite classification of the international conformity certifcation programm is often used to divided coal maceral into the huminite, the liptinite and the inertinite, which respectively correspond to the vitrinite, the exinite and the inertinite in the hard coal.
Huminite reflectance (Ro%) measurements and maceral analysis (500 points) were performed, under oil immersion in reflected lignite using a photometer-based microscope. Proximate analysis was performed using a 5E-MAG6700 fully automatic proximate analyzer. By using the 5E-MAG6700 fully automatic proximate analyzer, the moisture content, ash yield and volatile content of the sample are measured.
The maceral composition of the samples is determined. The experimental results show that the coal maturity of the Jiergalangtu Sag is low, and the huminite reflectance between 0.29% and 0.53%, Its maturity has strong heterogeneity between layers and different mining areas. The Ro of coal seams in the same mining area shows a general trend of increasing with the increase of burial depth. The Ro of each mining interval in the sag also changed significantly. The composition of the coal seams differs greatly, and the overall change law is as follows: in the vertical direction, with the increase of the burial depth, the moisture content increases first and then stabilizes. The ash yield is mainly affected by the sedimentary environment, and the volatile content is mainly related to the coal rank. Overall, the material composition of lignite is the result of a combination of various factors, resulting in lignite exhibiting strong heterogeneity.
Experiments
Coal fundamental properties
To prevent dehydration and oxidation of samples, store them in vacuum bags immediately after sampling. Mean random vitrinite reflectance and microscopic composition of coal were measured using a leitz microscope with a photometer as required by ISO 7404-3-1994 (1994) and ISO 7404-5-2009 (2009). According to |ISO1171-2010 (2010) and ISO 11722-2013 (2013), the basic material composition of coal was determined by proximate analysis. Basic information can be found in Table 1.
Basic information of the samples.
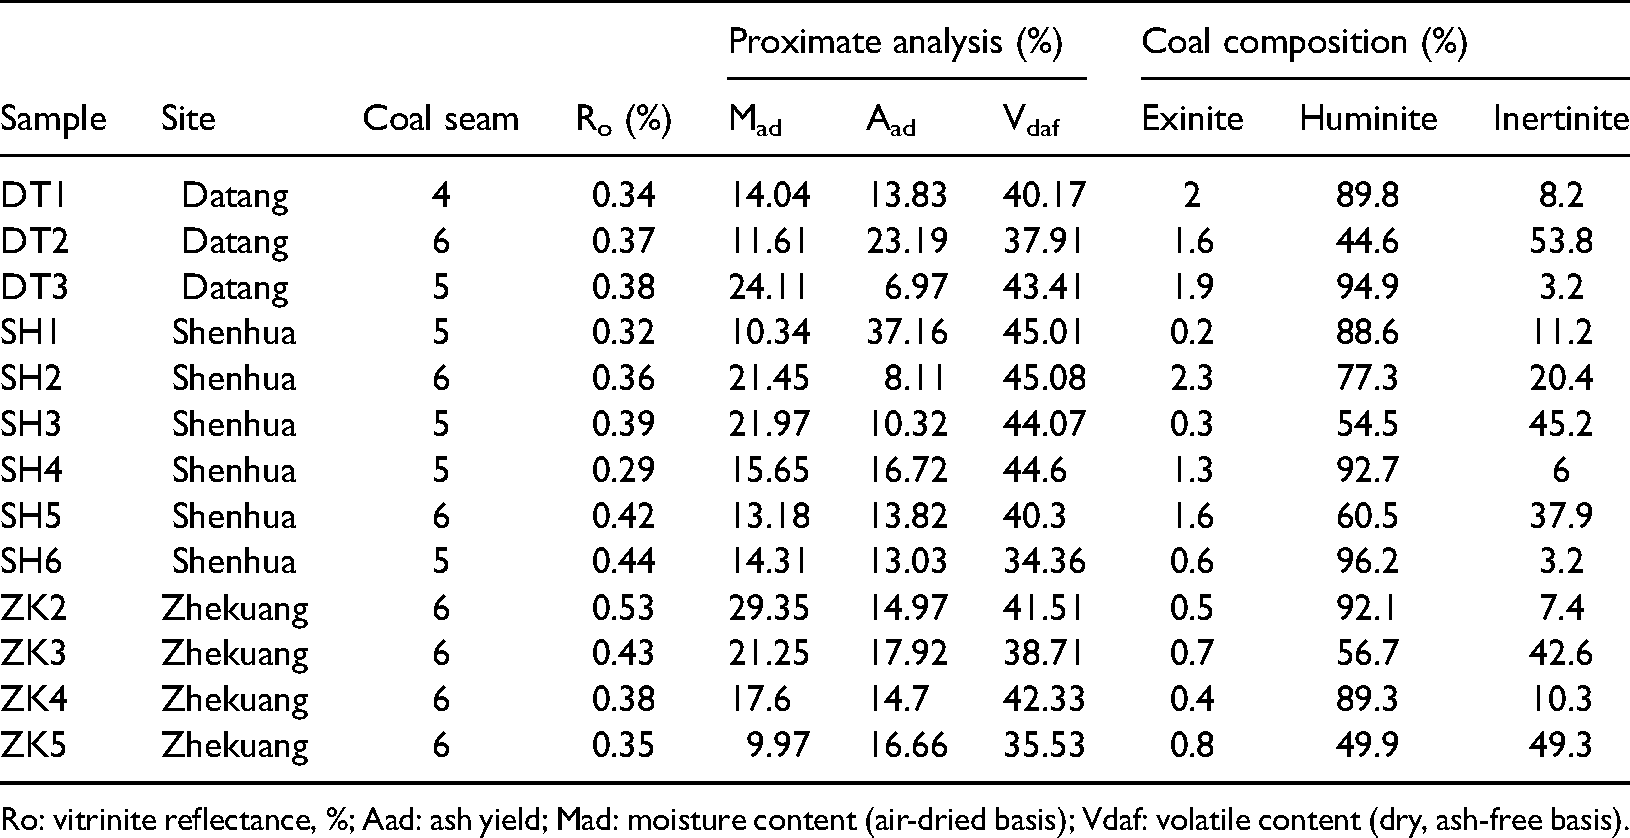
Ro: vitrinite reflectance, %; Aad: ash yield; Mad: moisture content (air-dried basis); Vdaf: volatile content (dry, ash-free basis).
Nitrogen adsorption
The specific surface area, pore volume and pore size distribution of the sample can be measured through the low-temperature nitrogen adsorption experiment. The experimental instrument used the Quantachrome NOVA2000e analyzer. The pore size theory test range is 2 to 200 nm, and the specific surface area theory test range is 0.1 to 3,500 m2/g. The test process was carried out following National Petroleum Industry Standard SY/T 6154-1995. The samples were crushed, and 5 g-10 g of samples with a particle size of 40–60 mesh (0.28mm-0.45 mm) were selected, then dried at 105°C for 8 h put it in the desiccator for later use. The nitrogen adsorption-analytical curve with a relative pressure ranging from 0.01 to 0.99 is obtained at a temperature of 77 K. The specific surface area and pore size distribution are calculated using the BET (Brunauer-Emmett-Teller) and BJH (Barrett-Joyner-Halenda) models (Fu et al., 2017; Zhao et al., 2016).
SEM
Using FESEM JSM-7500F scanning electron microscopic observation, the maximum resolution of the instrument 1 nm, the range of magnification × 30- × 1000 k. After the sample is evacuated, the pores, cracks, and microstructure and microscopic morphology of the minerals on the cleat surface of the coal sample can be observed under a voltage of 15 kv.
In this paper, the analysis of SEM images is not only limited to the direct response characteristics of the images. Since the images have a binary format stored in the computer, the pictures can be converted into numbers (red, green, and blue [RGB] values) through software processing, and the qualitative analysis can be extended to quantitative analysis. Through direct observation of the image, it is found that the edge color of the pore fissure development has a significant change, which shows a sudden change in the value of the RGB value. Therefore, statistical analysis of the value can obtain the development status and heterogeneity of the pore fissure in the coal seam.
Fourier transform (FFT) is widely used in digital signal processing. Its logical meaning is that any continuously measured signal can be represented by an infinite superposition of sine wave signals of different frequencies. The formula can be expressed as follows:
This method can transform the time-domain signal of the digitally processed SEM image into a frequency-domain signal that is easy to analyze. Frequency domain signals are expressed in the form of spectrograms. Filter out the frequency components that are not of interest in the spectrogram, and then keep the frequency components of interest Finally, the inverse Fourier transform (IFFT) is performed to obtain the SEM image after image processing. The formula can be expressed as follows:
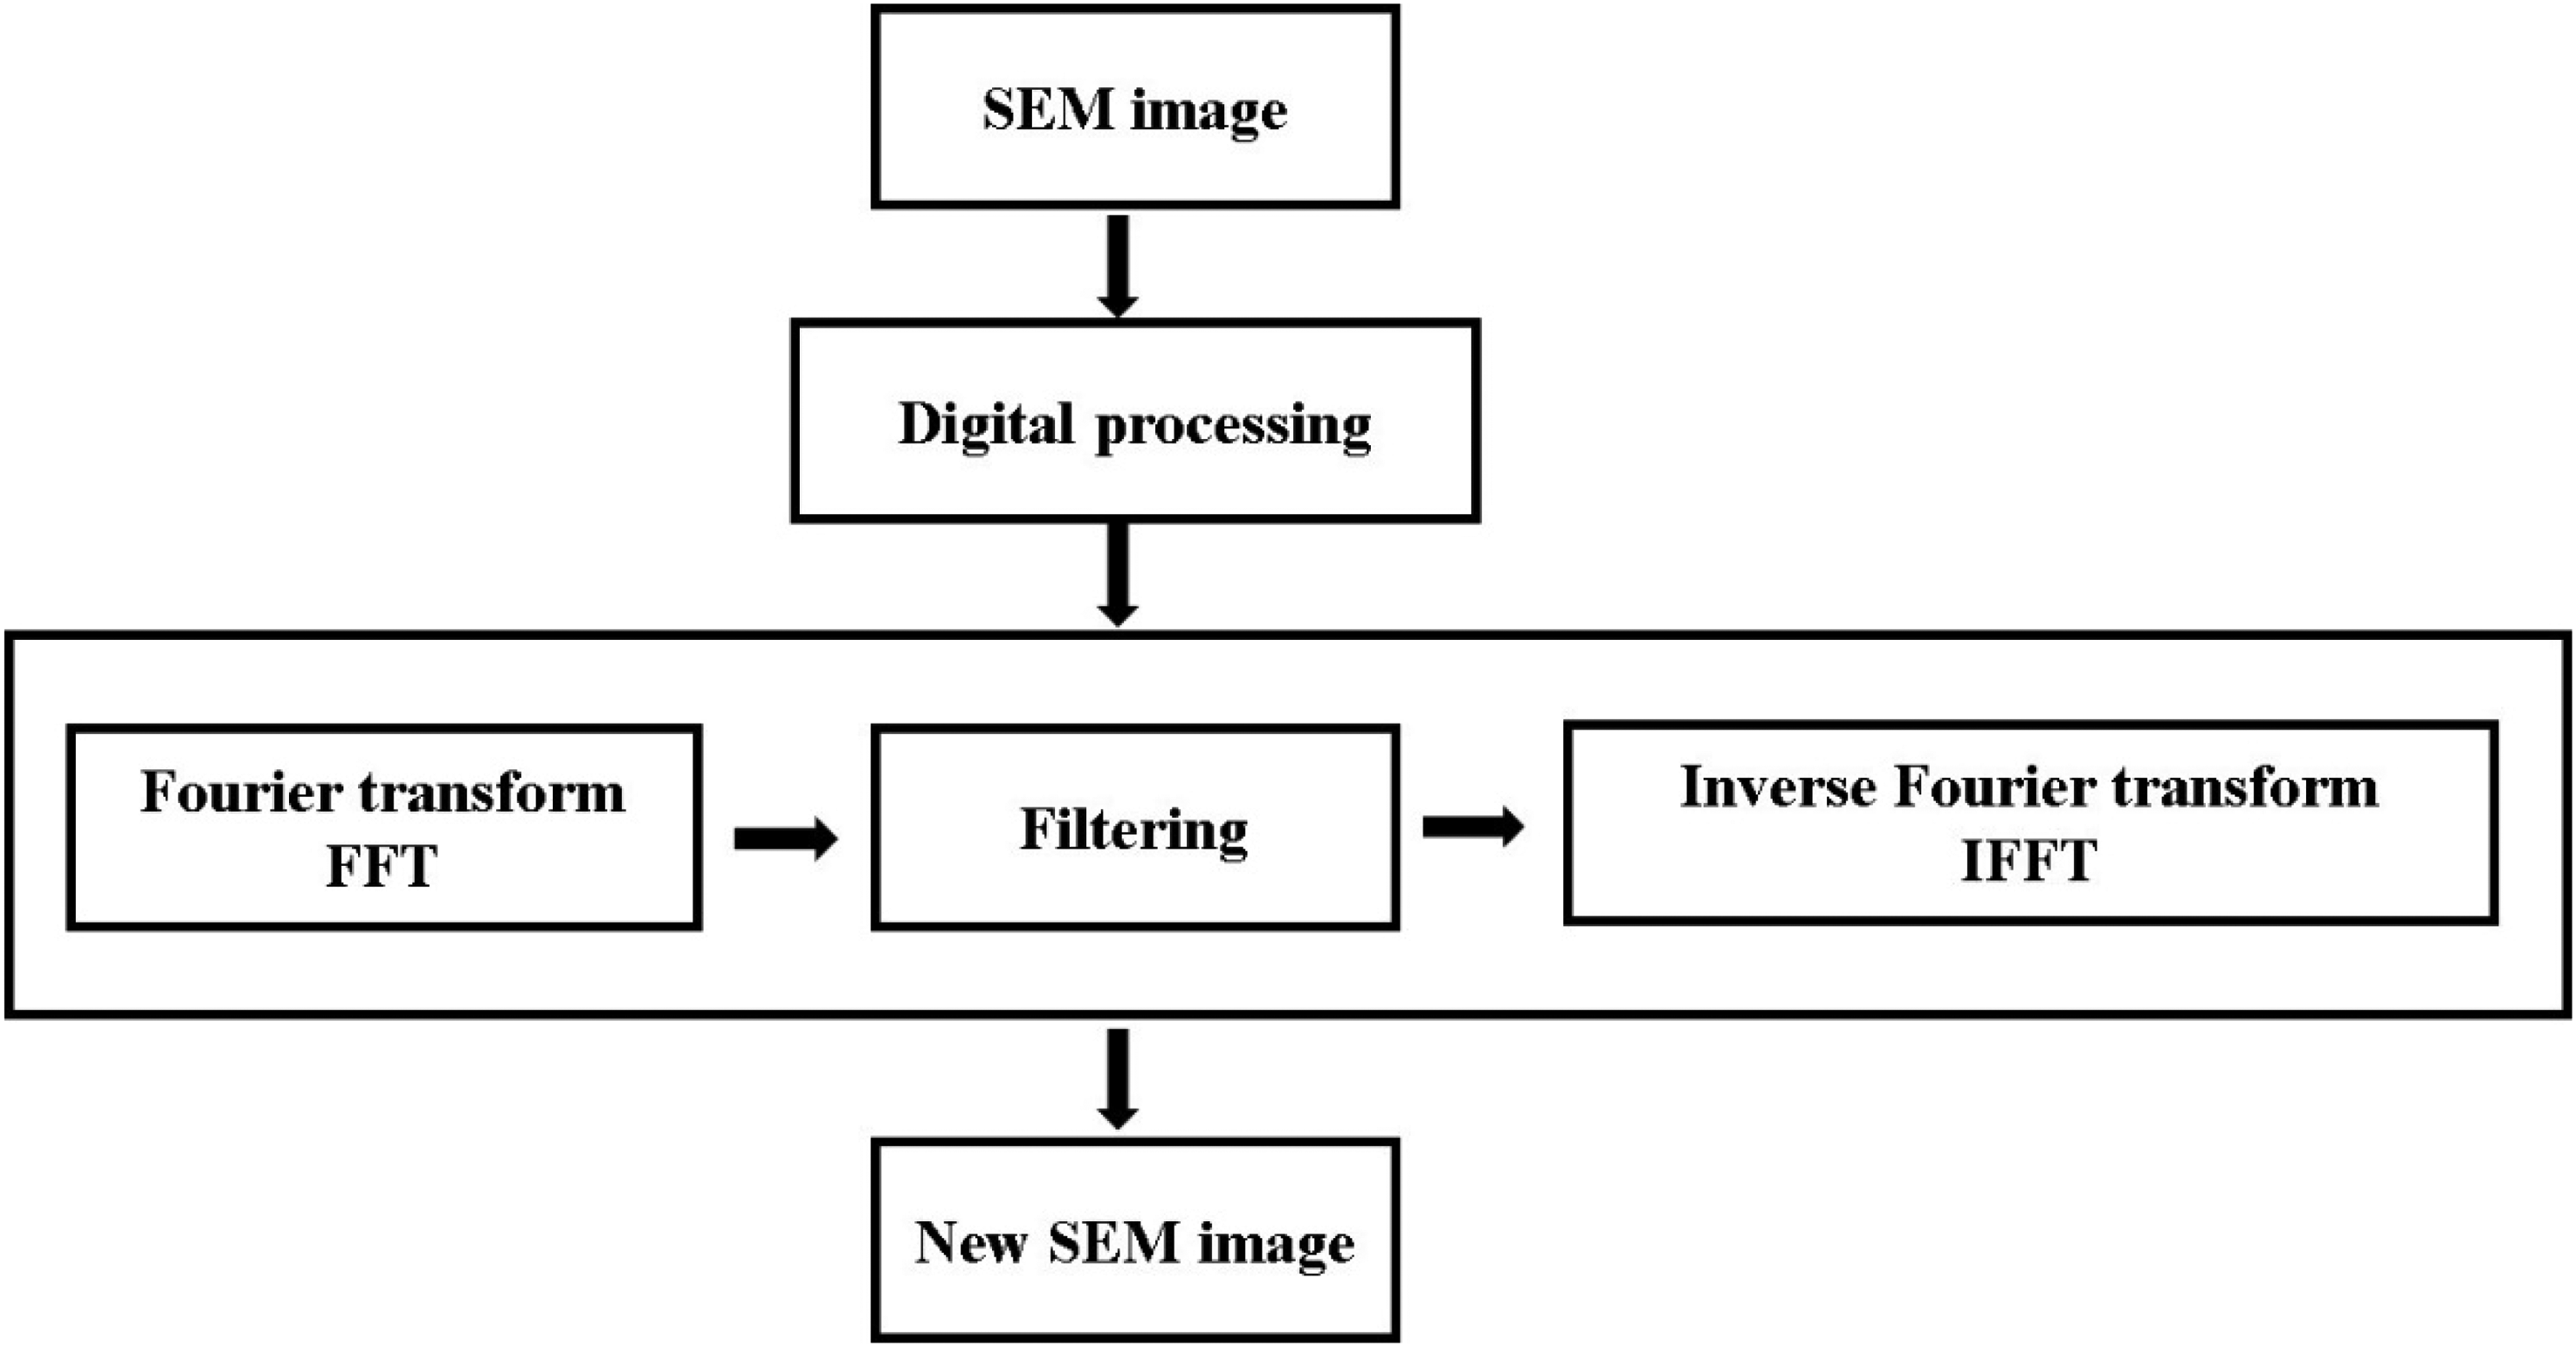
Fourier image processing.
Fraction dimensions from low-temperature N2 adsorption isotherms
The Frenkel-Halsey-Hill (FHH) model is the most widely used method for calculating coal reservoir pore fractal dimension based on gas adsorption isotherm (Jiao et al., 2014; Li et al., 2018; Pfeifer et al., 1989). The formula can be expressed as follows:
The fractal dimension D is generally obtained from the slope A of the line. However, at different stages of the adsorption process, there are different calculation formulas. During the early stage of multilayer adsorption, the solid-gas potential controls the adsorption process. The fractal dimension can be calculated by the following formula:

Results and discussion
Maceral analysis
The microscopic components of the coal seam in the study area are dominated by huminite, which are mainly composed of huminite formed by lignin and cellulose. The huminite are brown-yellow to reddish-brown under transmitted light, and gray under oil-immersed reflected light, with high oxygen content. The observation under microscope showed that DT1 distributed microsporinite, cutinite, suberinite and Liptodetrinite in parallel, and occasionally resinite and a small amount of Pollen (Figure 4(a)); fluorinite, microsporinite, liptodetrinite and pollen are distributed in parallel in the SH1 sample; localized in SH3 See the enrichment of fluorescent components, mainly microsporinite, resinite, liptodetrinite, pollen and cutinite (Figure 4(c)); DT2 microsporinite is locally concentrated, the individual is deformed, and even broken into a liptodetrinite, occasionally resinite and pollen are seen, and the shape is small (Figure 4(e)); SH2 lignite is partially seen liptodetrinite Enriched, pollen are easy to see, and microsporinite are occasionally seen, which are mixed with each other randomly (Figure 4(d)); resinite and liptodetrinite are easily seen in ZK5 lignite, and microsporinite are occasionally seen (Figure 4(f)).
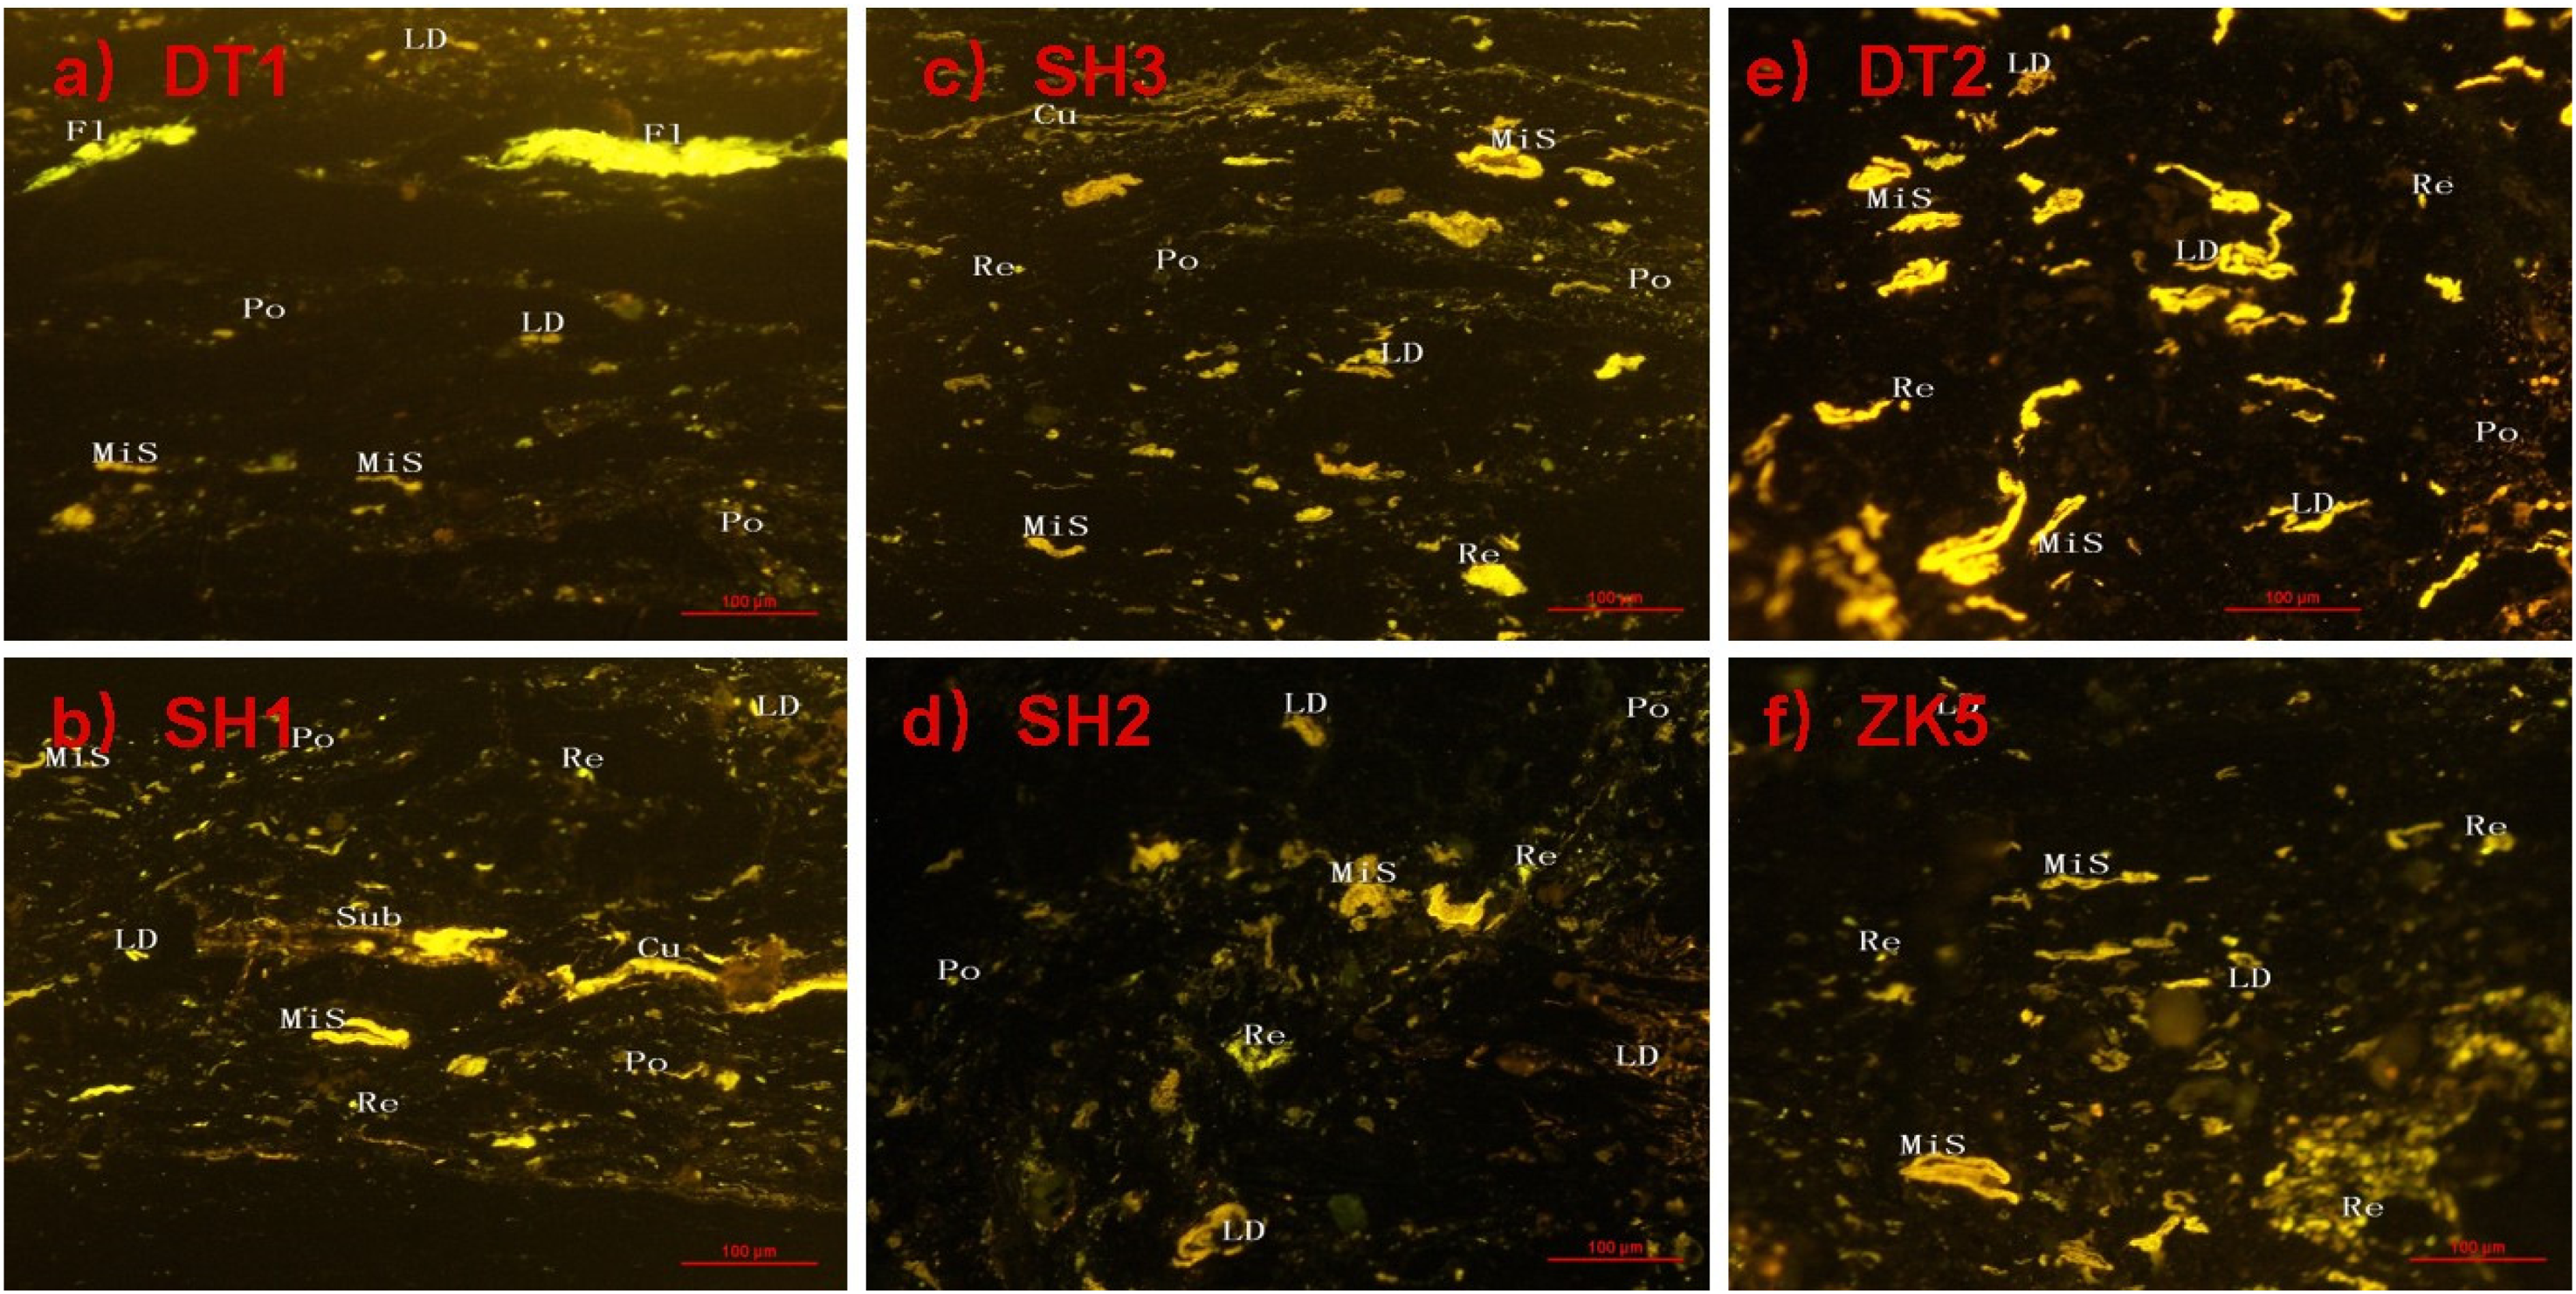
Photomicrographs of macerals.
The sample test results show that the content of Huminite is between 82% and 98%, and the content of liptinite and inertinite is less, the content of liptinite is 0.5%∼0.8%, and the content of inertinite is 1.6%∼17.5%. The distribution of maceral components of each coal seam shows that the content of huminite shows a decreasing trend with the increase of burial, and the change of content of inertinite is on the contrary, the content of huminite in the coal samples of No.6 coal seam is the lowest, and the content of inertinite is higher than the rest of coal seam (Figure 5). Therefore, No.6 coal seam mainly contains abundant plant tissue pores; No.5 coal seam has plant tissue pores and mineral pores developed together; No.5 coal seam is mainly dominated by intergranular pores, and the regularity and pore diameter of pores decrease due to the effect of compaction, and the connectivity of pores becomes (Rai et al., 2022).
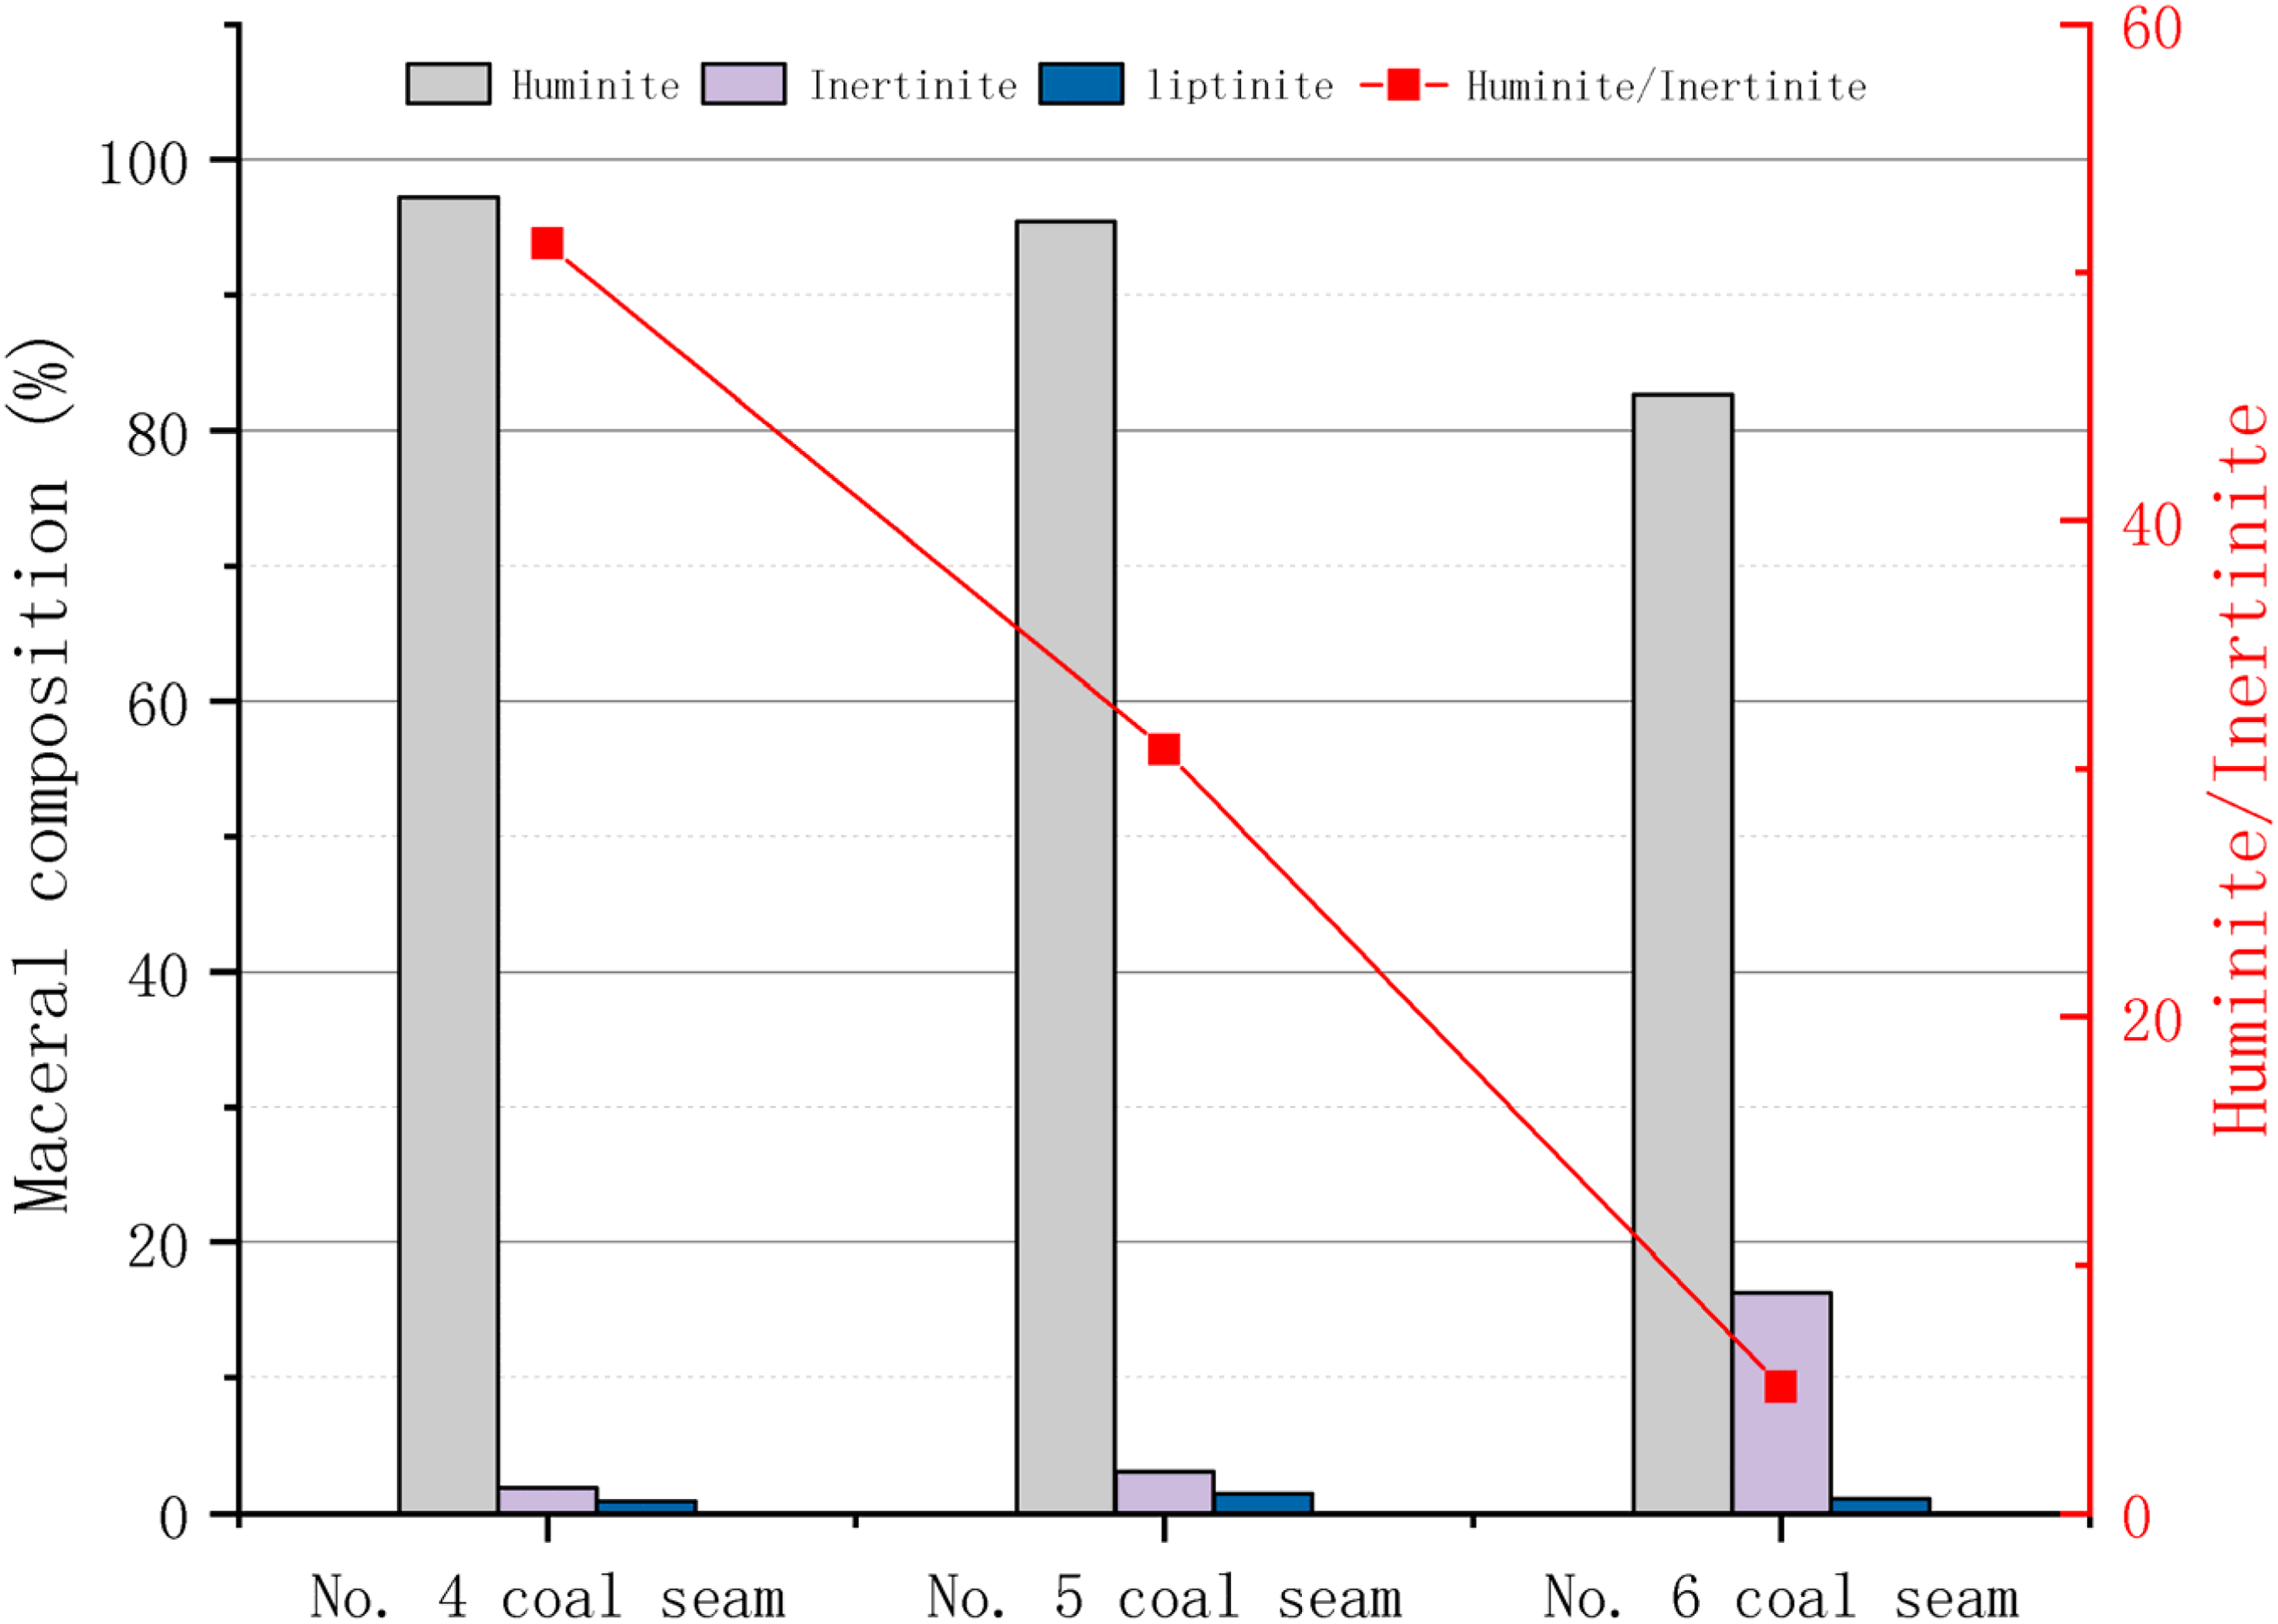
Variation of maceral composition in different coal seams.
Improved SEM analysis
The pores of low-rank coal can be divided into three types: plant tissue pores, mineral-related pores and thermogenic pores (Chen et al., 2015; Xin et al., 2019). Scanning electron microscopy results in this study showed that mineral-related pores and plant tissue pores were mainly developed, and no obvious thermogenic pores were found. This may be due to the low maturity (Ro) of the lignite in the study area; It has not yet begun to produce large amounts of natural gas during this geological period.
Scanning electron microscopy results also show that different coal seams have different results of pore cracks. No. 4 and No. 5 coal seams have mainly developed mineral pores and poor fracture connectivity (Figure 6(a)–(d)); No. 6 coal seam has a large number of plant tissue pores, cellular structure is well developed, microfractures are developed, and pore connectivity is good. However, it was damaged during the later compaction, cellular structure is incomplete (Figure 6(e)–(f)).
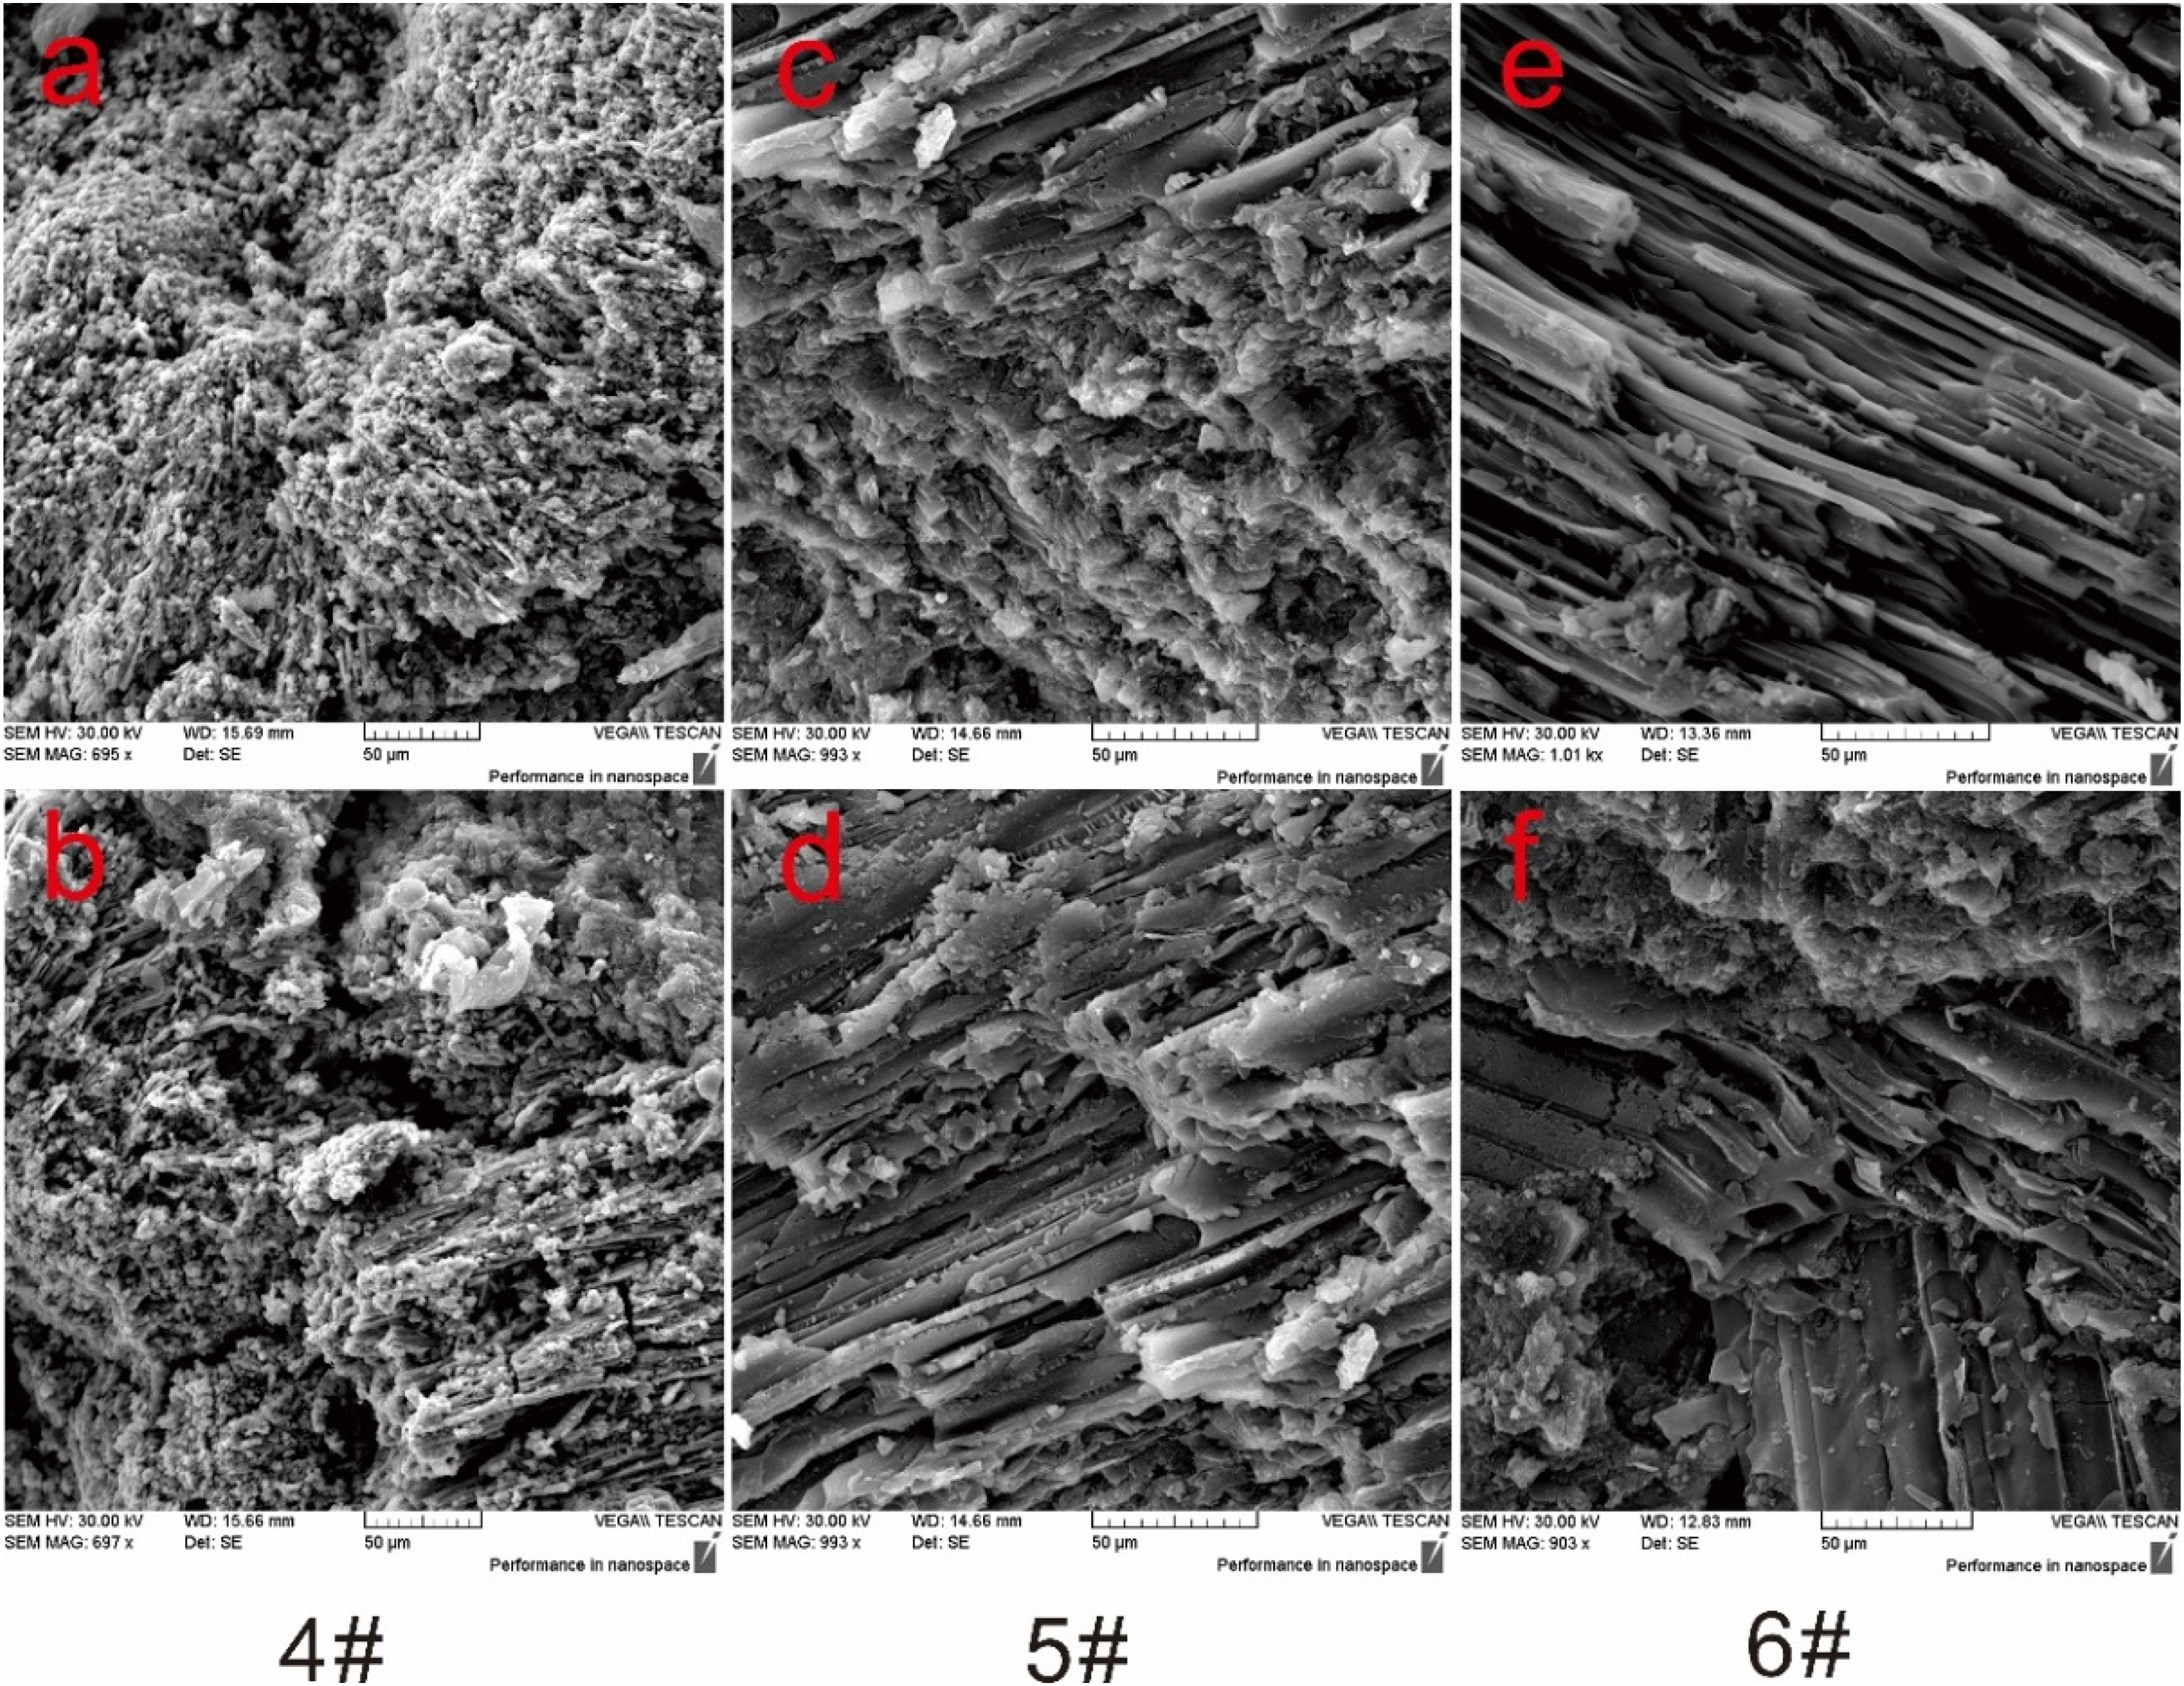
Different coal seam SEM images.
The Ro (%) and proximate analysis of the three coal seams are not much different, but the coal macerals are quite different (Table 1), which controls the type and development degree of pores. The inertinite of No. 6 coal seam is developed, and the content of inertinite in samples DT2 and SH3 are as high as 53.8% and 45.2% respectively. In comparison, the content of inertinite of No. 4 in sample DT1 is only 8.2%, and the content of inertinite of No. 5 is only 6%. The content of inertinite directly controls the degree of cellular structure and plant tissue pores development. At the same time, it can be found that the samples of the No. 6 coal seam generally have a high inertinite content, which also means that there are a large number of cellular structures and plant tissue pores in the No. 6 coal seam.
Scanning electron microscope observation can study the morphological characteristics of the sample, but it also causes difficulties for the effective identification of pores. Through image analysis technology, the observation of pores by SEM is expanded from qualitative to quantitative. First, digitize the RGB values based on the SEM images. The changes in the size and distribution of the RGB values reflect the lithology and pore distribution. Generally, the larger the atomic number, the brighter the SEM image, so the lithology can be judged by the RGB value. At the same time, the distribution of pores can be identified based on the same principle.
Then the Fourier transform method is used to filter the color signal of the SEM image in the frequency domain. This is the most critical step for the image processing of the SEM image. The high-frequency component represents a large change in pixel value, which can be expressed as the boundary between the pore and coal rock; the low-frequency component represents a small change in pixel value, representing the pore or the same type of coal rock component developed in the coal rock sample. Therefore, in the filtering process, the low-frequency components are filtered out, and then the filtered components are subjected to inverse Fourier transform (IFFT), and finally filter the Figure 6 to get Figure 7. The dark areas in the figure represent the development of pore and fractures, and the observation results similar to the previous ones can be obtained more intuitively.
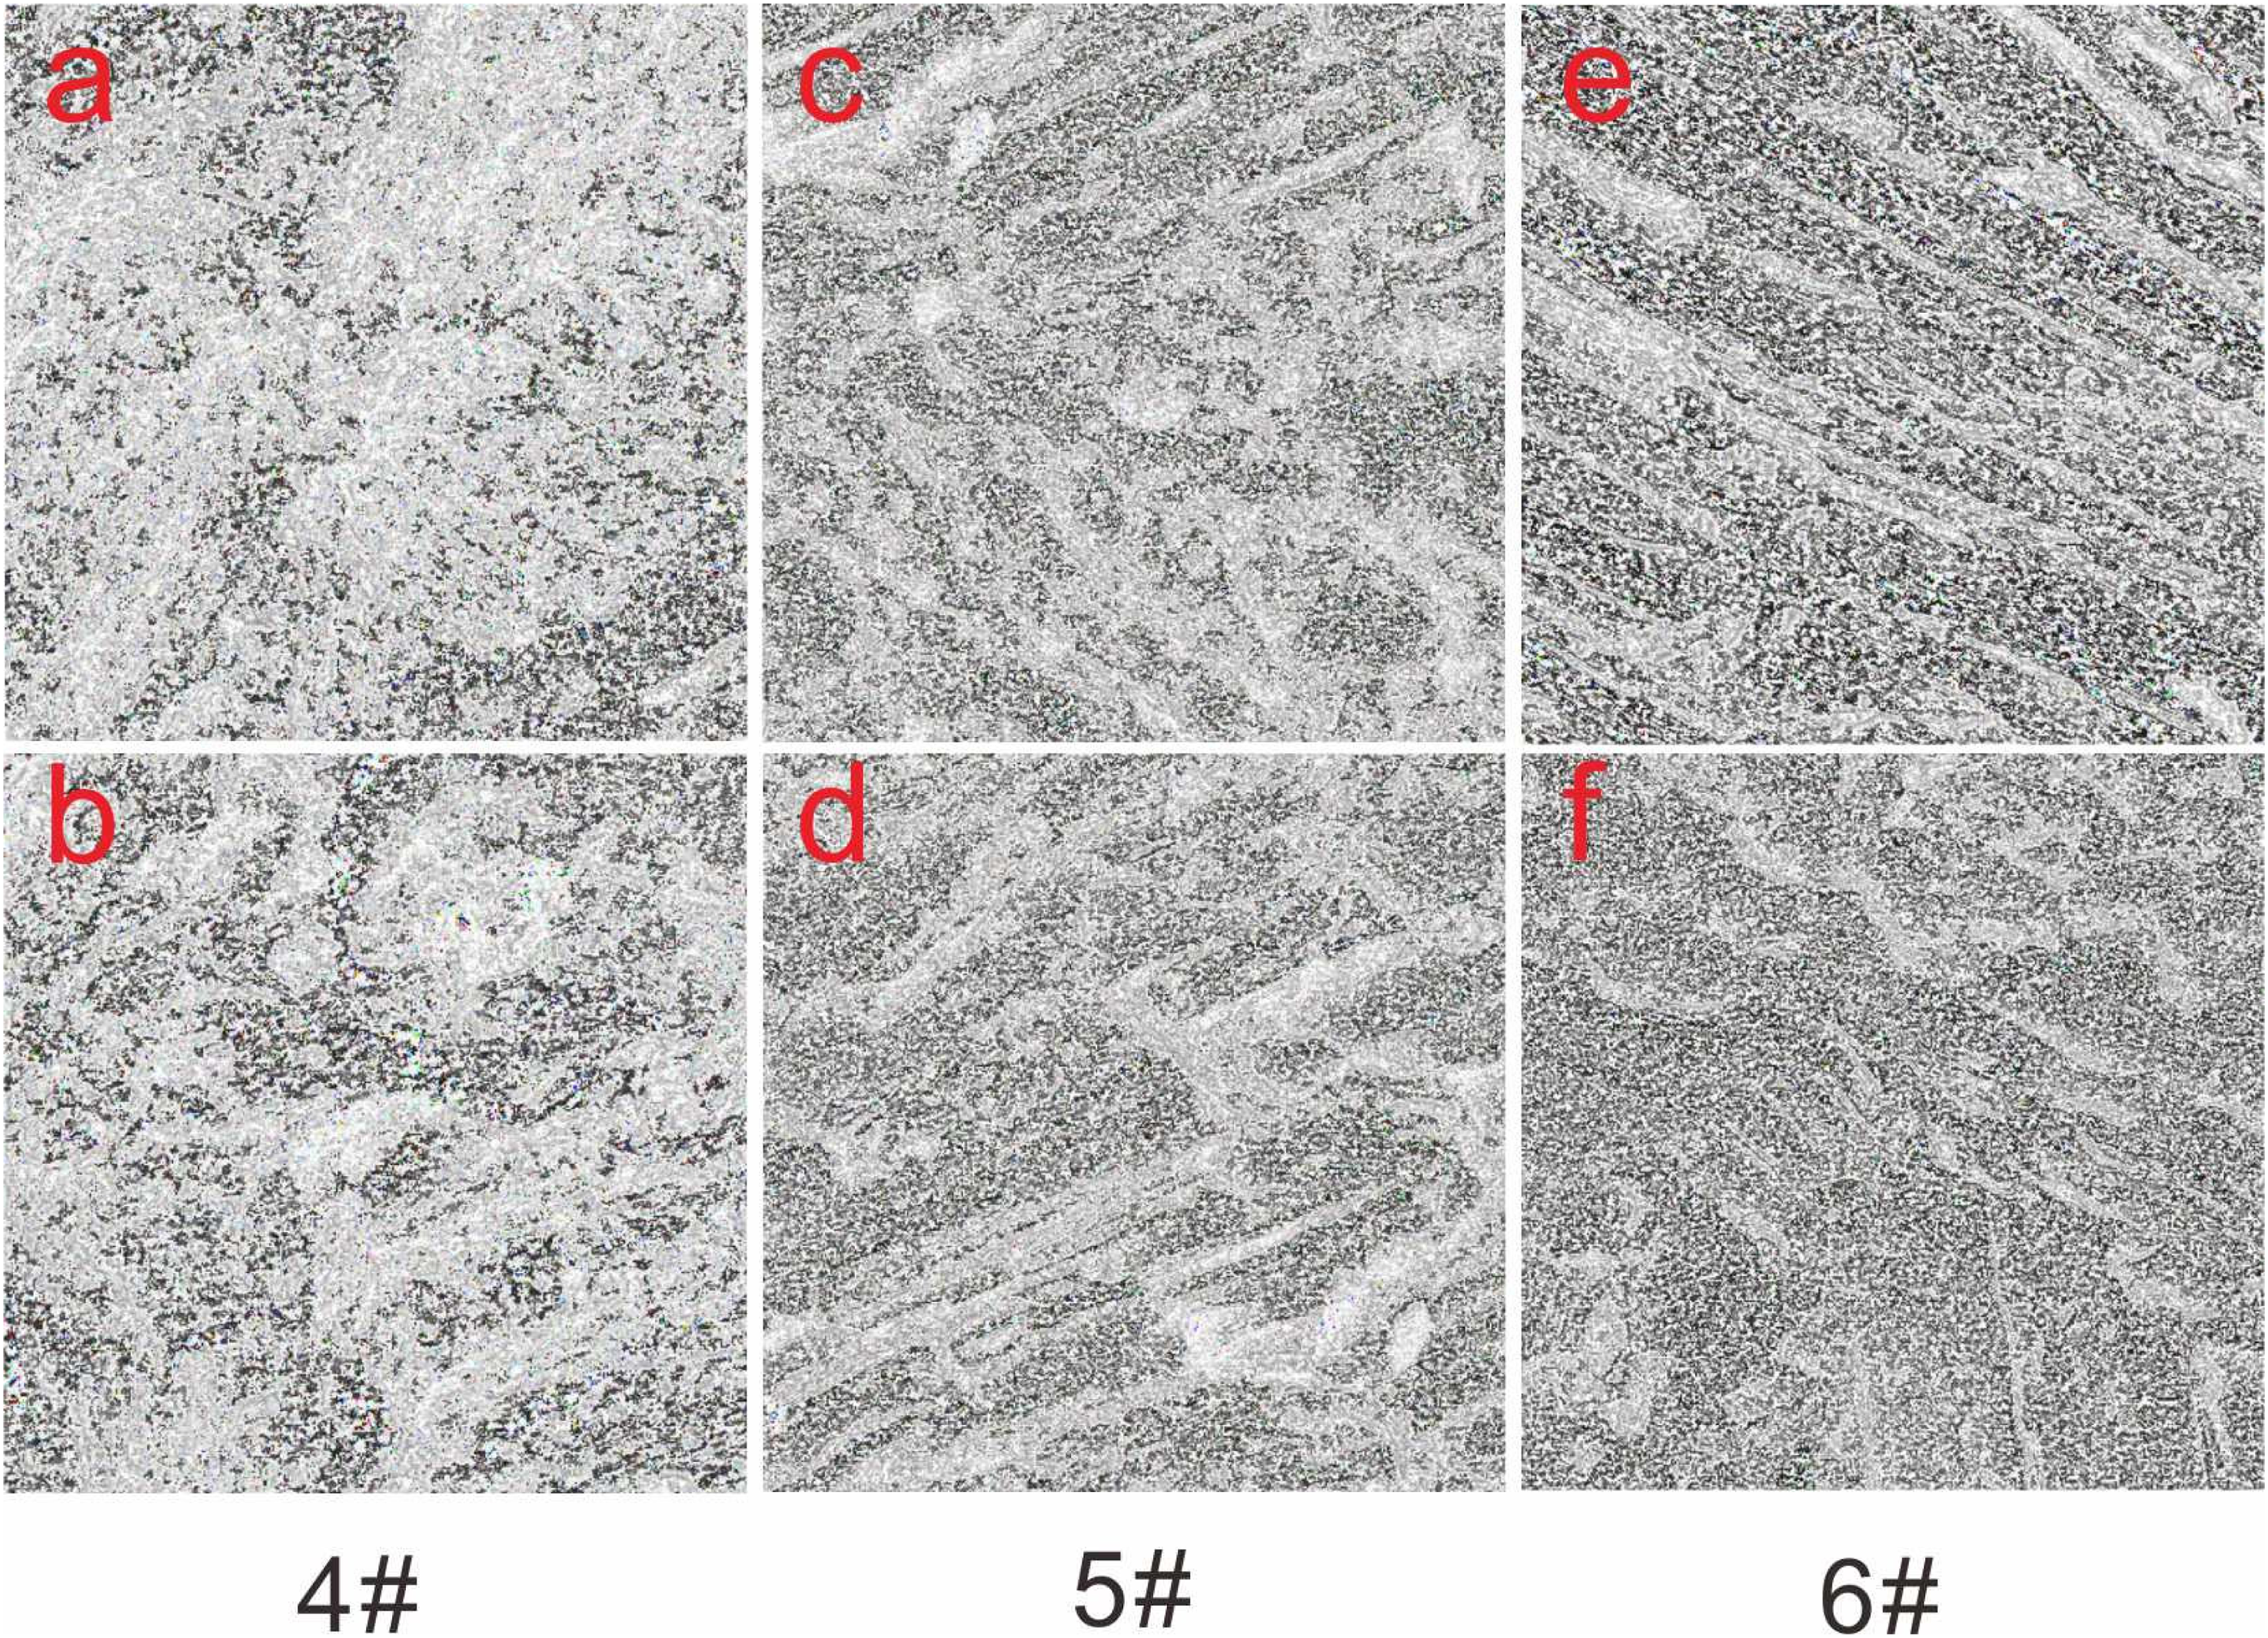
Improved SEM images.
However, there are some objectivity disturbances in the image processing, and the image processing needs to be adjusted to avoid the impact on the observation results. When observing the filtered SEM images (Figure 7), the mineral pores are easier to identify than the cellular structure and cell pores, which may be due to the higher atomic number of the mineral composition and the stronger secondary electron signal received, So the RGB value of the brightness is also higher. The brightness of the pores is generally the lowest because it receives the least secondary electronic signal. During the filtering process, low-frequency changes are filtered while high-frequency changes are retained, so the contrast between the mineral and the surrounding pores will be more vivid. On the contrary, the cellular structure and plant tissue pores of organic matter are usually developed in the coal rock matrix, and the atomic number of the coal component is relatively low, so the secondary electron signal received is weak, and the contrast with the surrounding pores is not sharp enough. When filtering out low-frequency signals during the filtering process, it may unintentionally reduce the recognition of such plant tissue pores. Therefore, when performing image processing on samples of low-rank coal and high inertinite, the low-frequency filtering range should be controlled to avoid missing identification of plant tissue pores.
At the same time, the surface morphology of the sample will also affect the brightness and darkness of the SEM image, which will also indirectly affect the quality of the image processing results, which may make us miss the identification of the plant tissue pores. For No. 6 coal seam, unprocessed SEM images can identify the plant tissue pores (Figure 6(f)), but when image processing is carried out, the cell pores cannot be well identified (Figure 7(f)). This may be due to the surface morphology of the sample, the location of the plant tissue pores is in the relatively concave part, the secondary electron signal received by the coal rock matrix around the pores is not strong, and the pores will not be well identified when filtered. Therefore, in the process of sample selection and preparation, the sample surface should be as much as possible to avoid fluctuations. Generally, the sample table can be tilted at a certain angle during the scanning electron microscope observation to avoid and reduce the influence of surface morphology on the later image processing.
The image processing method can not only efficiently identify pores and fractures but also further accurately compare the degree of heterogeneity between various coal seams. The analysis and comparison are performed in the form of the spectrum, and the filtered results (Figure 8) are directly compared in the frequency domain rather than in the time domain by inverse Fourier transform (IFFT). Due to different magnifications and different pixel values during the scanning electron microscopy process, try to select images with the same magnification as possible during the image selection process (Figure 6), and then homogenize the pixels, randomly selecting 1,000 samples points for spectrum display. The high-frequency component in Figure 7 represents the boundary between the pore and coal rock; the low-frequency component represents the pore or the same type of coal rock component developed in the coal rock sample. Due to the influence of sensitivity during shooting, the pores are mainly distributed in the medium frequency range. The results show that the pore development degree of the No. 5 coal seam in the study area is weaker than that of No. 4 coal seam and No. 6 coal seam. By calculating the Fourier Transform of three coal seams to obtain the variance (Var), it is found that all three coal seams have strong heterogeneity, of which NO.4Var < NO.5Var < NO.6Var, indicating that the heterogeneity of the No. 4 coal seam is the weakest compared to the the others, and the heterogeneity of coal seam No. 6 coal seam is the strongest in the three coal seams.
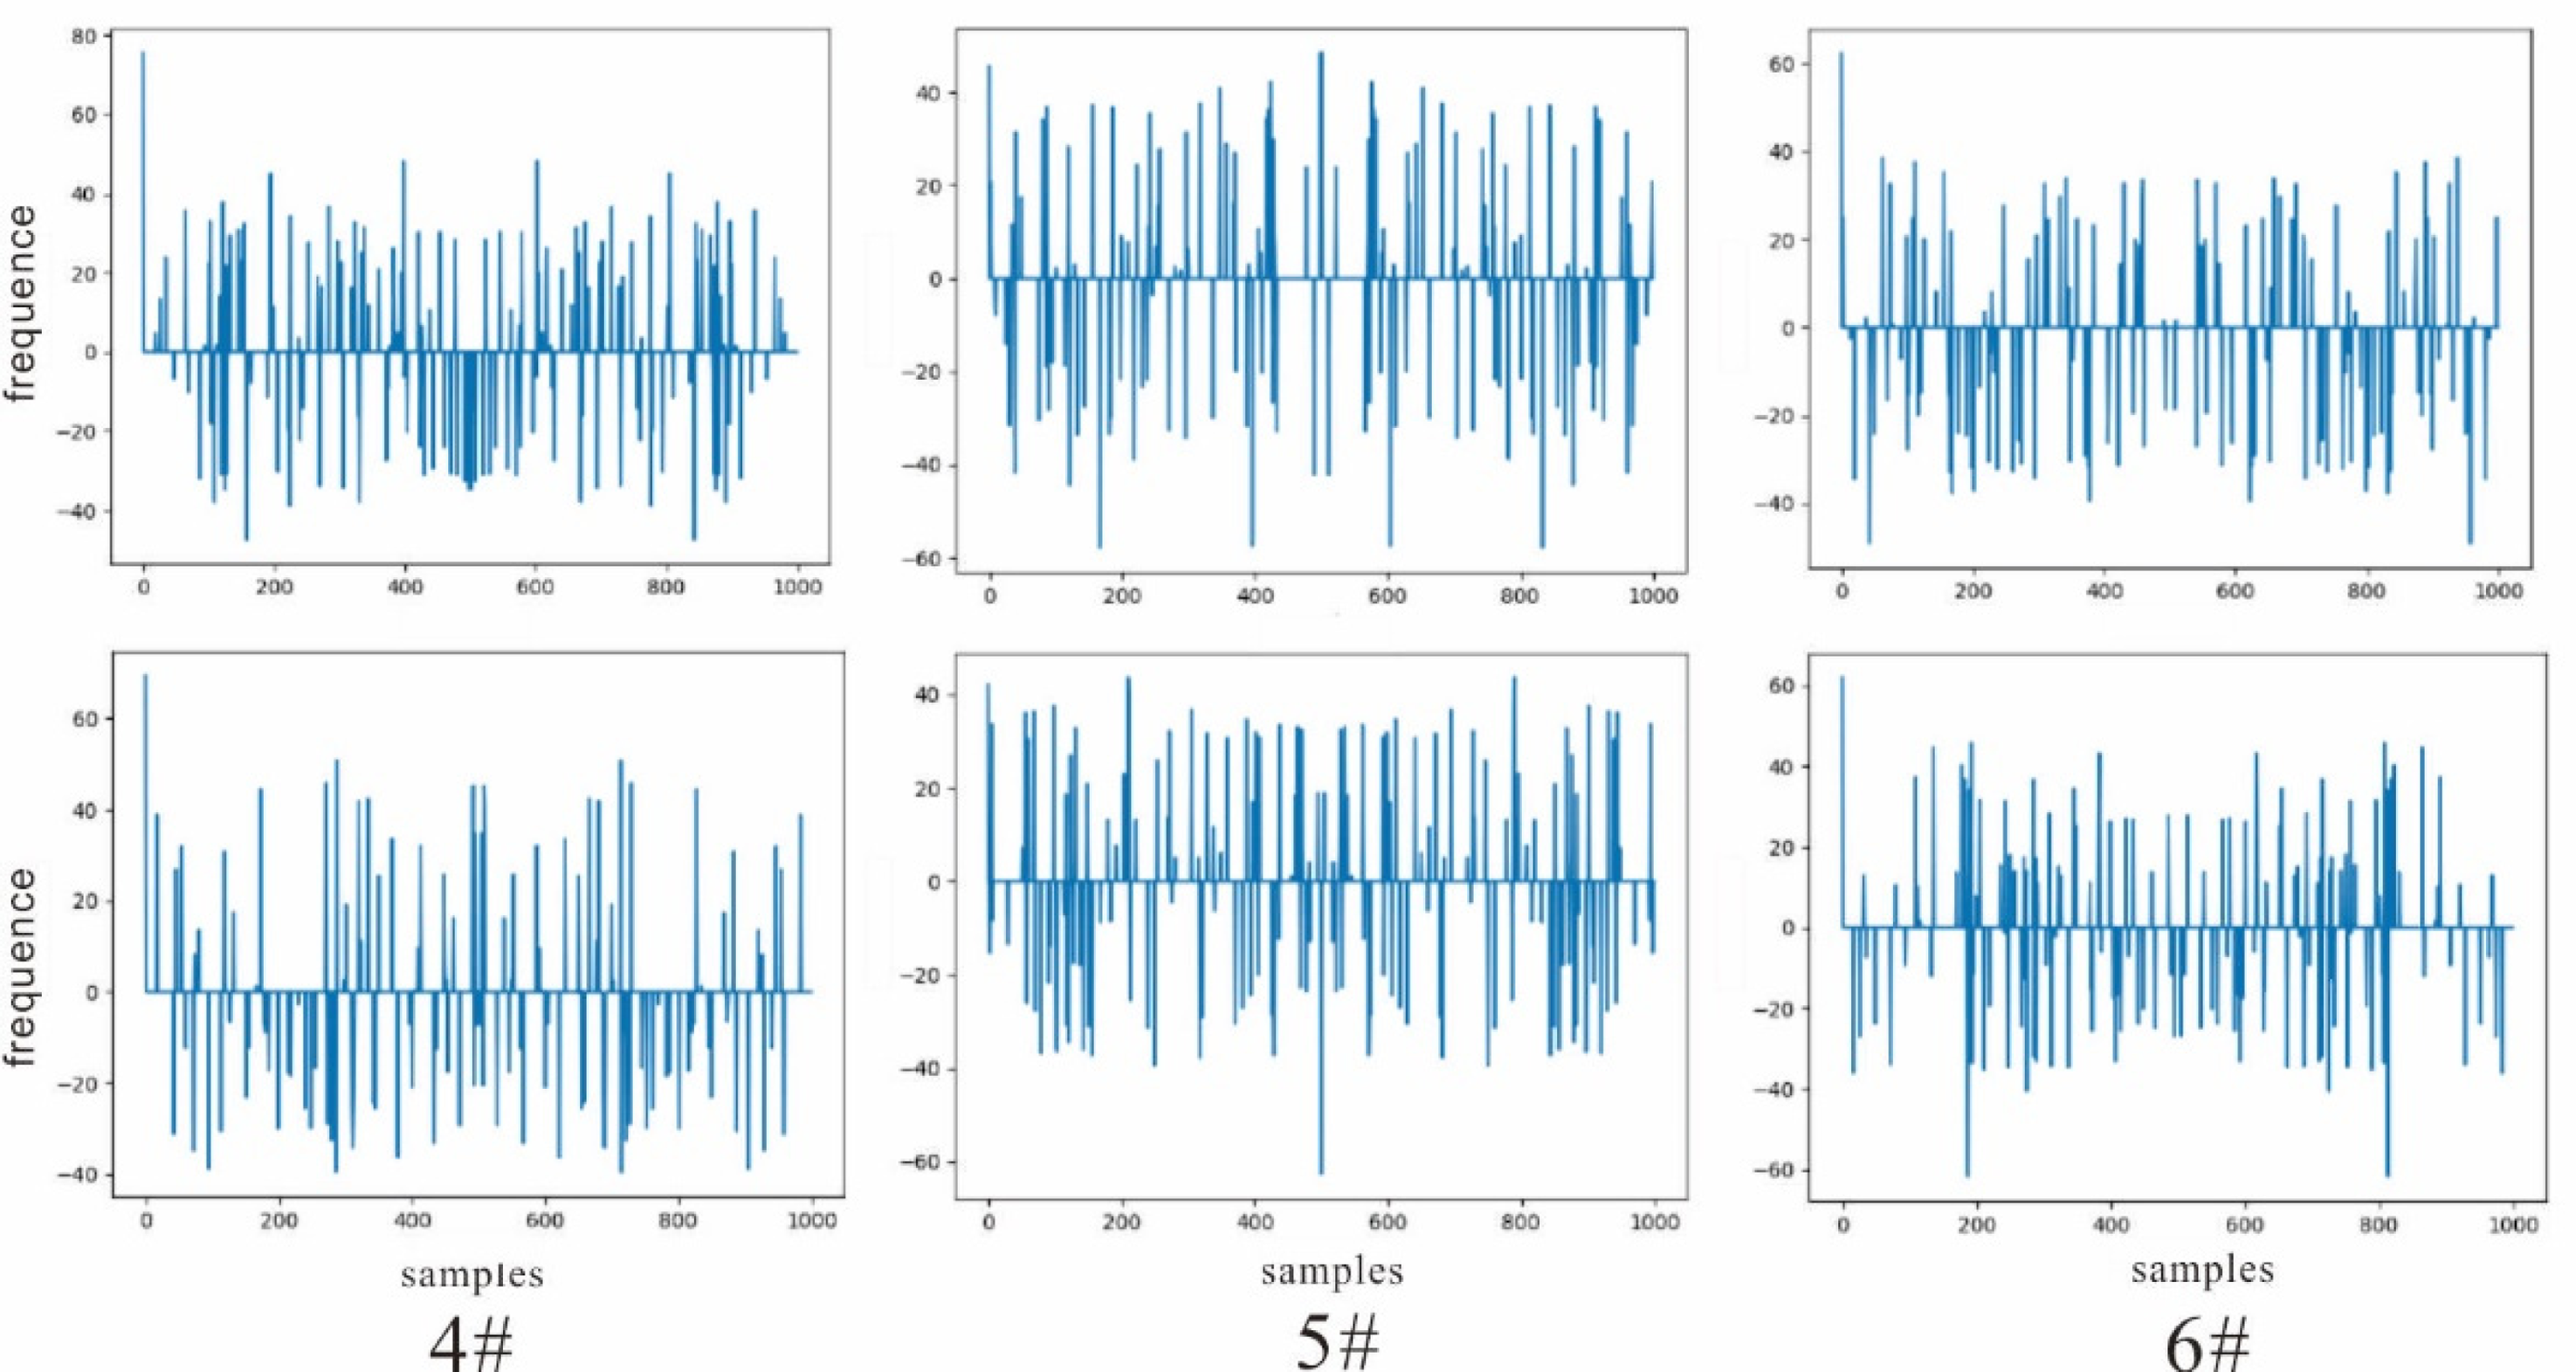
Scanning electron microscope Fourier transform spectrum.
They are all lignite samples, but there are clear differences in pore development type and reservoir heterogeneity, which shows that lignite reservoirs are highly complicated in actual exploration and development. Comparing the results of maceral analysis and proximate analysis, the main difference is the content of the inertinite, and the ash content also has a certain difference. Different material compositions and coal-forming environments profoundly affect the heterogeneity of the lignite reservoir.
Low-temperature nitrogen adsorption/desorption (Lt-N2ga) analysis
LT-N2GA isotherms and pore shapes
Low temperature nitrogen adsorption/desorption experiments are widely used to define the complexity and morphology of coal pores. For pores of a specific form, when the relative pressure points corresponding to adsorption condensation and desorption evaporation are different, a hysteresis loop will appear, and the shape of the hysteresis loop can reflect the type of pores. According to the classification of adsorption isotherms by Sing et al. (1985), it is found that the nitrogen adsorption/desorption isotherms of the target coal seams can be divided into two types.
Samples DT2 and SH1 belong to type A (Figure 9). This type of desorption isotherm exhibits a sharp drop when the relative pressure (P/P0) is 0.45–0.5. This significant inflection point indicates relative pressure during condensation in the gas adsorption process is higher than the relative pressure during desorption, indicating that the pore types of coal rocks in this area are mainly connected pores with open ends, such as parallel plate pores with open ends, which is beneficial to the enrichment and exploitation of coalbed methane. Samples DT1, SH2, SH3, and ZK5 belong to type B. There is almost no obvious hysteresis loop or only a narrow hysteresis loop between the adsorption and desorption isotherms of this type, indicating the relative pressures of such pores during adsorption and desorption are almost the same. These kinds of pores are semi-open pores with poor connectivity, such as slit-shaped pores with one closed side, and wedge-shaped pores., which is beneficial to the enrichment of coalbed methane, but not conducive to the exploitation of coalbed methane. The pore morphology of the No. 4 coal seam is type B, but the No. 5 and No. 6 coal seams have developed A-type and B-type pores. The pore structure is complex and the coal seam has strong heterogeneity.
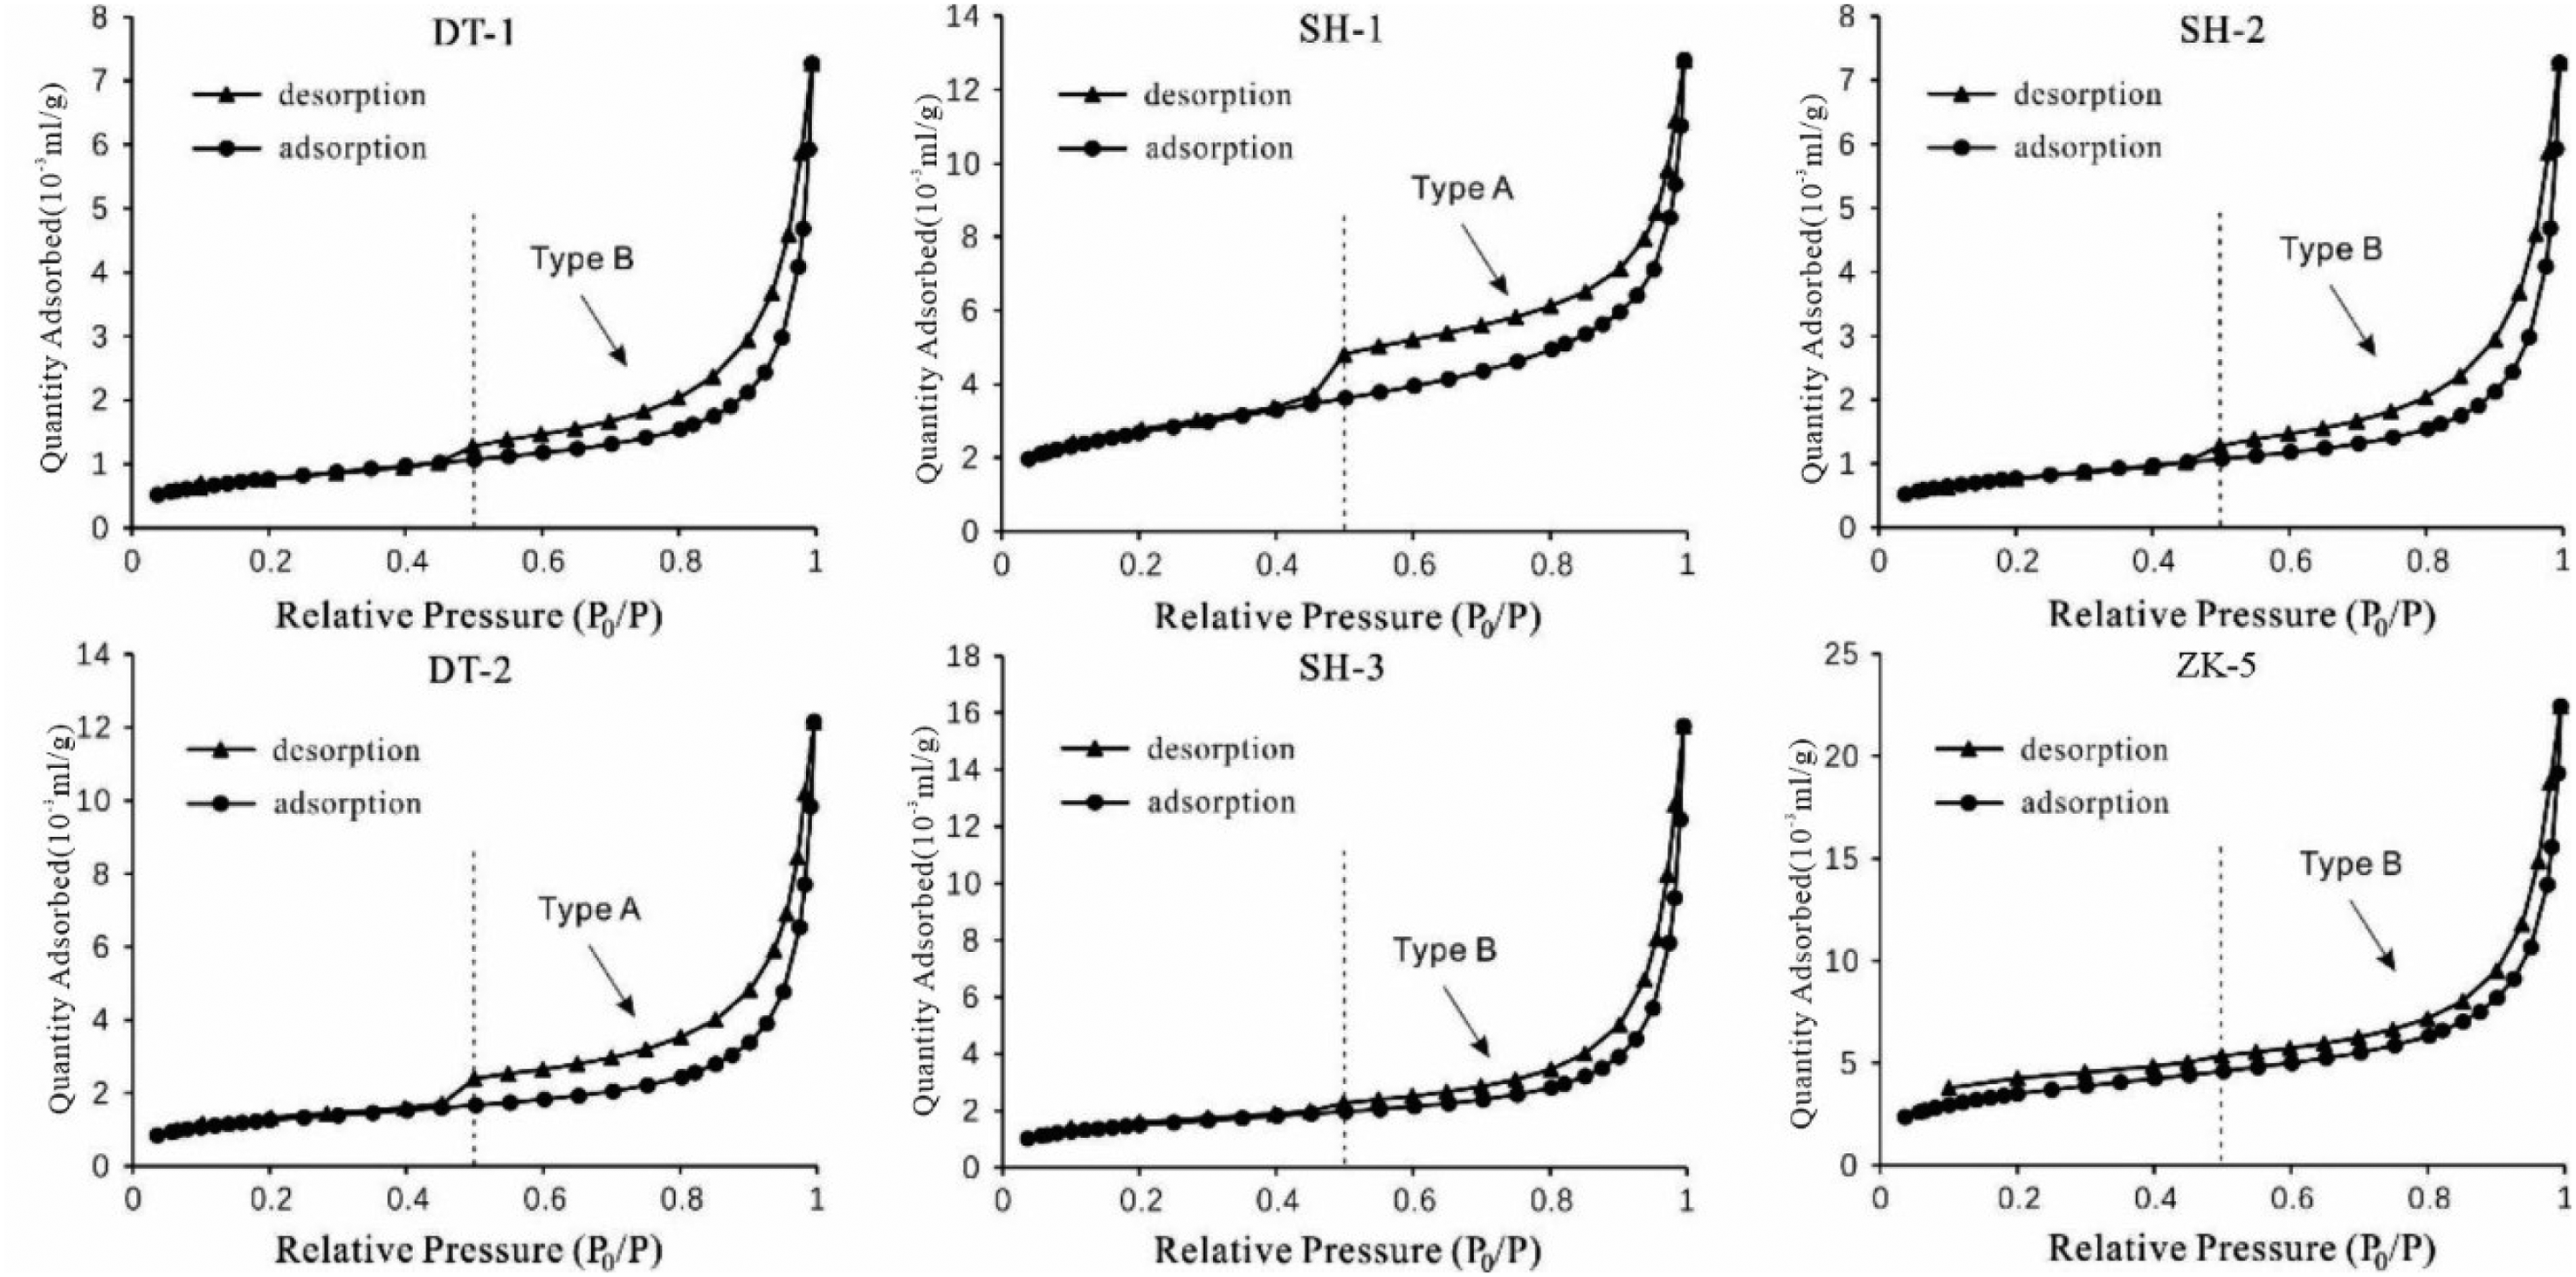
N2 adsorption/desorption isotherms of coal seams.
The maximum adsorption capacity of samples DT1 and SH2 is 8 (10−3ml/g), the pores are mainly mesopores and transition pores, and the development of B-type pores is conducive to the seepage of methane. The maximum adsorption capacity of samples Zk5 and SH3 is between 18–25 (10−3ml/g), the average pore size is 22.43 nm and 18.04 nm respectively, the degree of coalification is low, and the pores of plant tissue are the main ones. The maximum adsorption capacity of samples SH1 and DT2 is about 14 (10−3ml/g), and the average pores of BJH are 9.34 nm and 19.48 nm, respectively. Micropores and transition pores are developed. Compared with ZK-5, the crystal particles of plant tissue pores and intercrystalline pores are due to Compaction is tighter, resulting in reduced porosity.
Specific surface area and pore volume
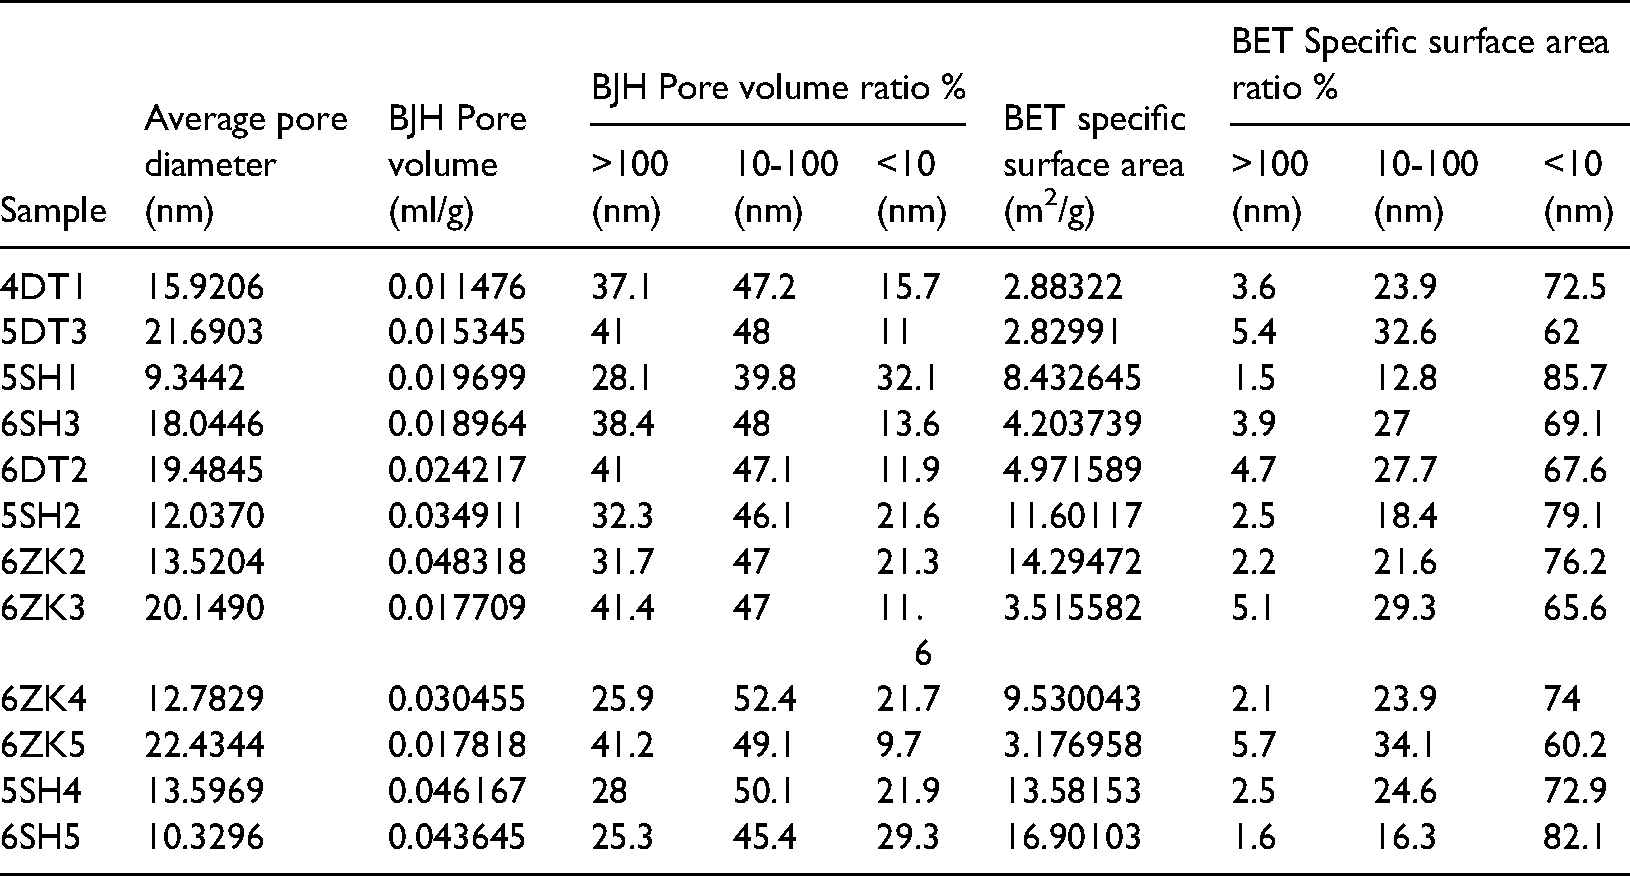
Table 2 shows the analysis of the results of low-temperature nitrogen adsorption/ desorption experiments. The BJH pore volume varies from 11.48 to 48.32 10−3ml/g (avg. 27.39), the BET surface area ranges from 2.83 to 16.90 m2/g (avg. 7.99). The contribution of pore volume mainly comes from the medium pores larger than 10 nm, while the contribution of the specific surface area of the pores smaller than 10 nm is significant. BJH pore volume is positively correlated with BET specific surface area (Figure 10a). The average pore diameter varies from 9.34 to 22.43 nm (avg. 15.78). But the average pore diameter of the sample showed an obviously negative correlation with BET specific surface area (Figure 10b). This negative correlation is caused by the geometrical characteristics of the pores. The larger the pore size, the smaller the specific surface area and volume ratio, so the small pores contribute more to the surface area and the larger pores contribute less to the surface area.
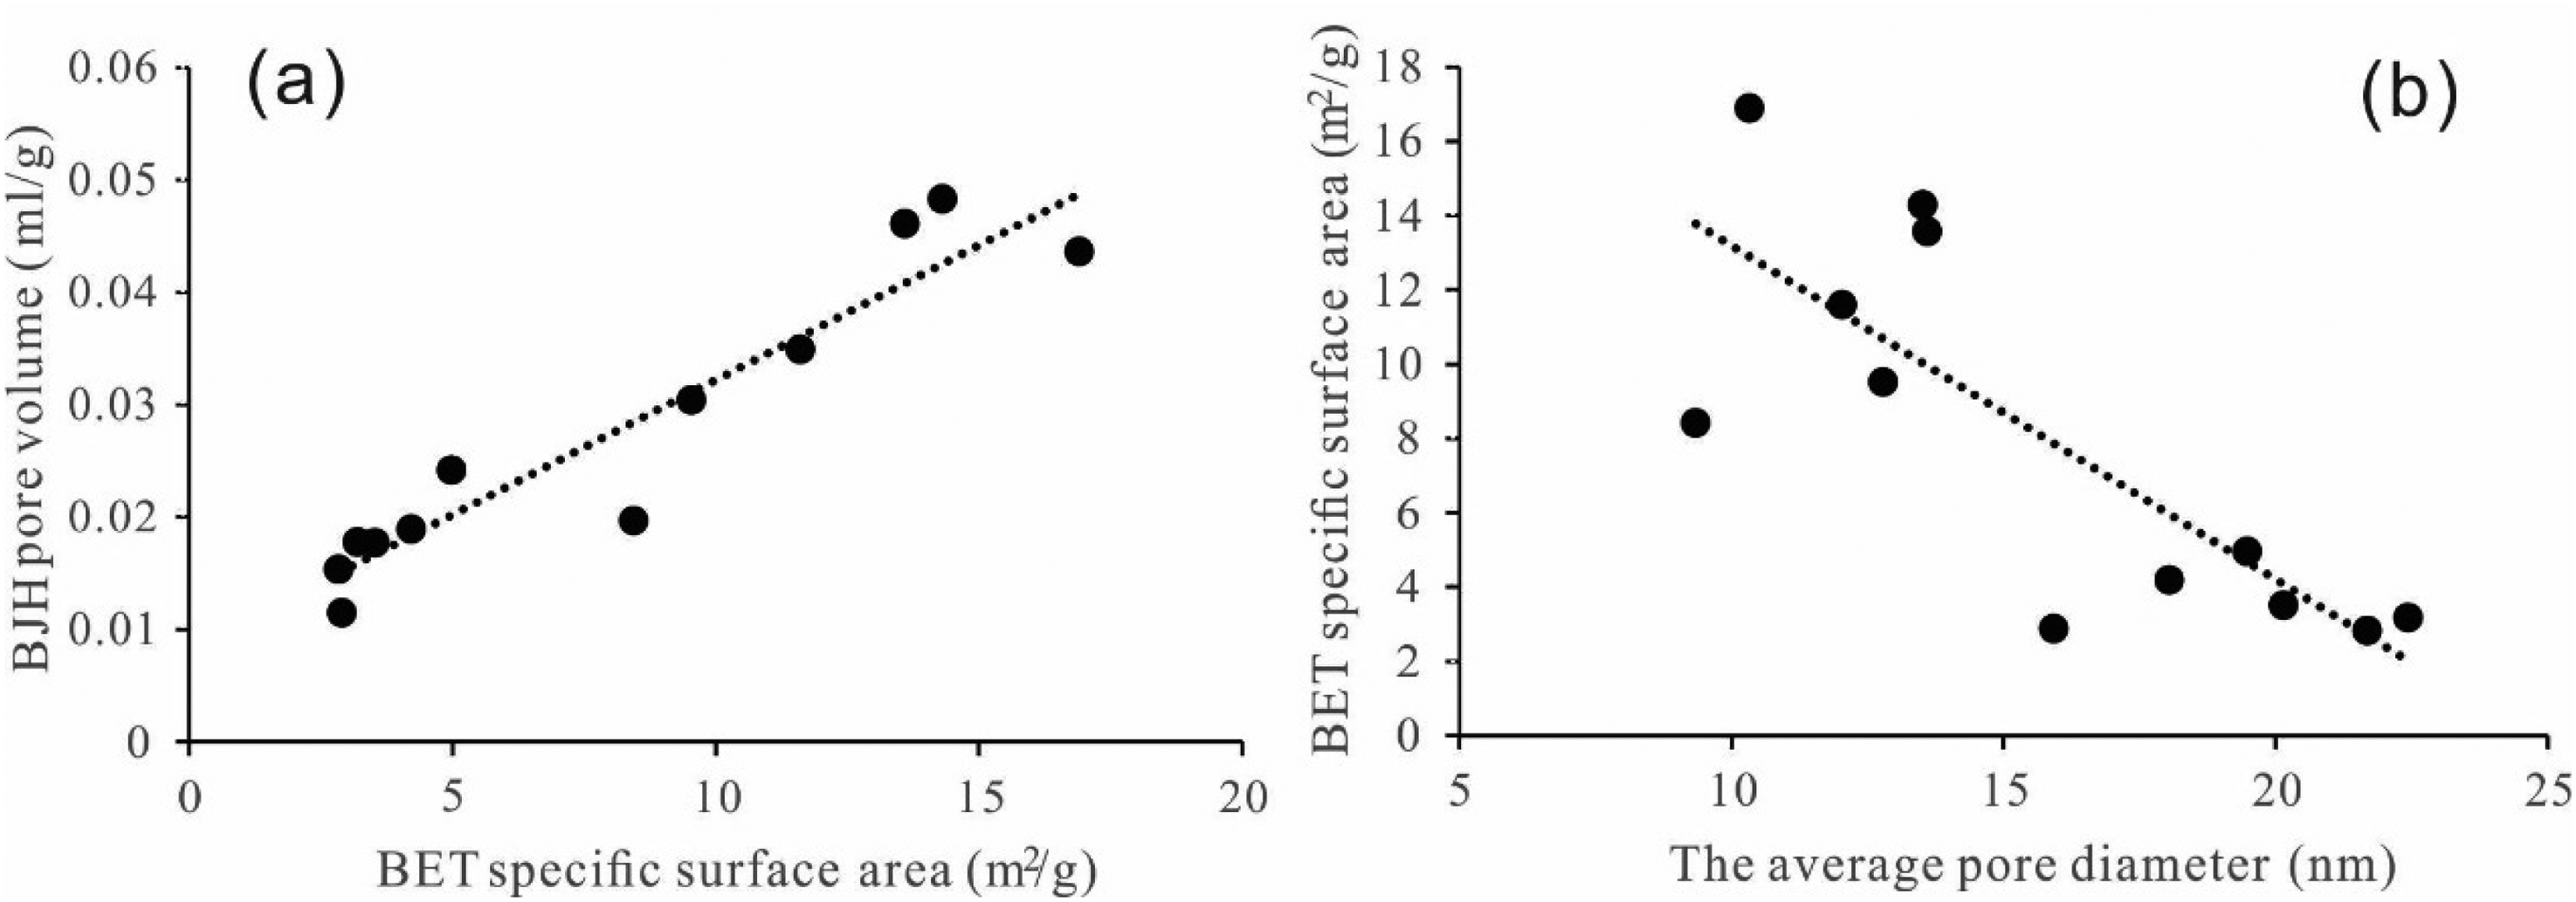
(a) BET specific surface area and pore volume of BJH; (b) BET specific surface area and average pore size.
Low temperature nitrogen adsorption test results.
Pore size distribution
Crosdale et al. (2008) proposed that matrix porosity in low-rank coal is large and has the potential to store free gas, which may account for 50–70% of the total gas content (Crosdale et al., 2008). Therefore, the relationship between pore distribution and volume in low-rank coal reservoirs is particularly important. The average pore diameter varies from 9.34 to 22.43 nm. The percentage of pore volume at each level was calculated by using Hodot pore size classification scheme, as shown in Figure 11 (Hodot, 1966; Zhao et al., 2016).
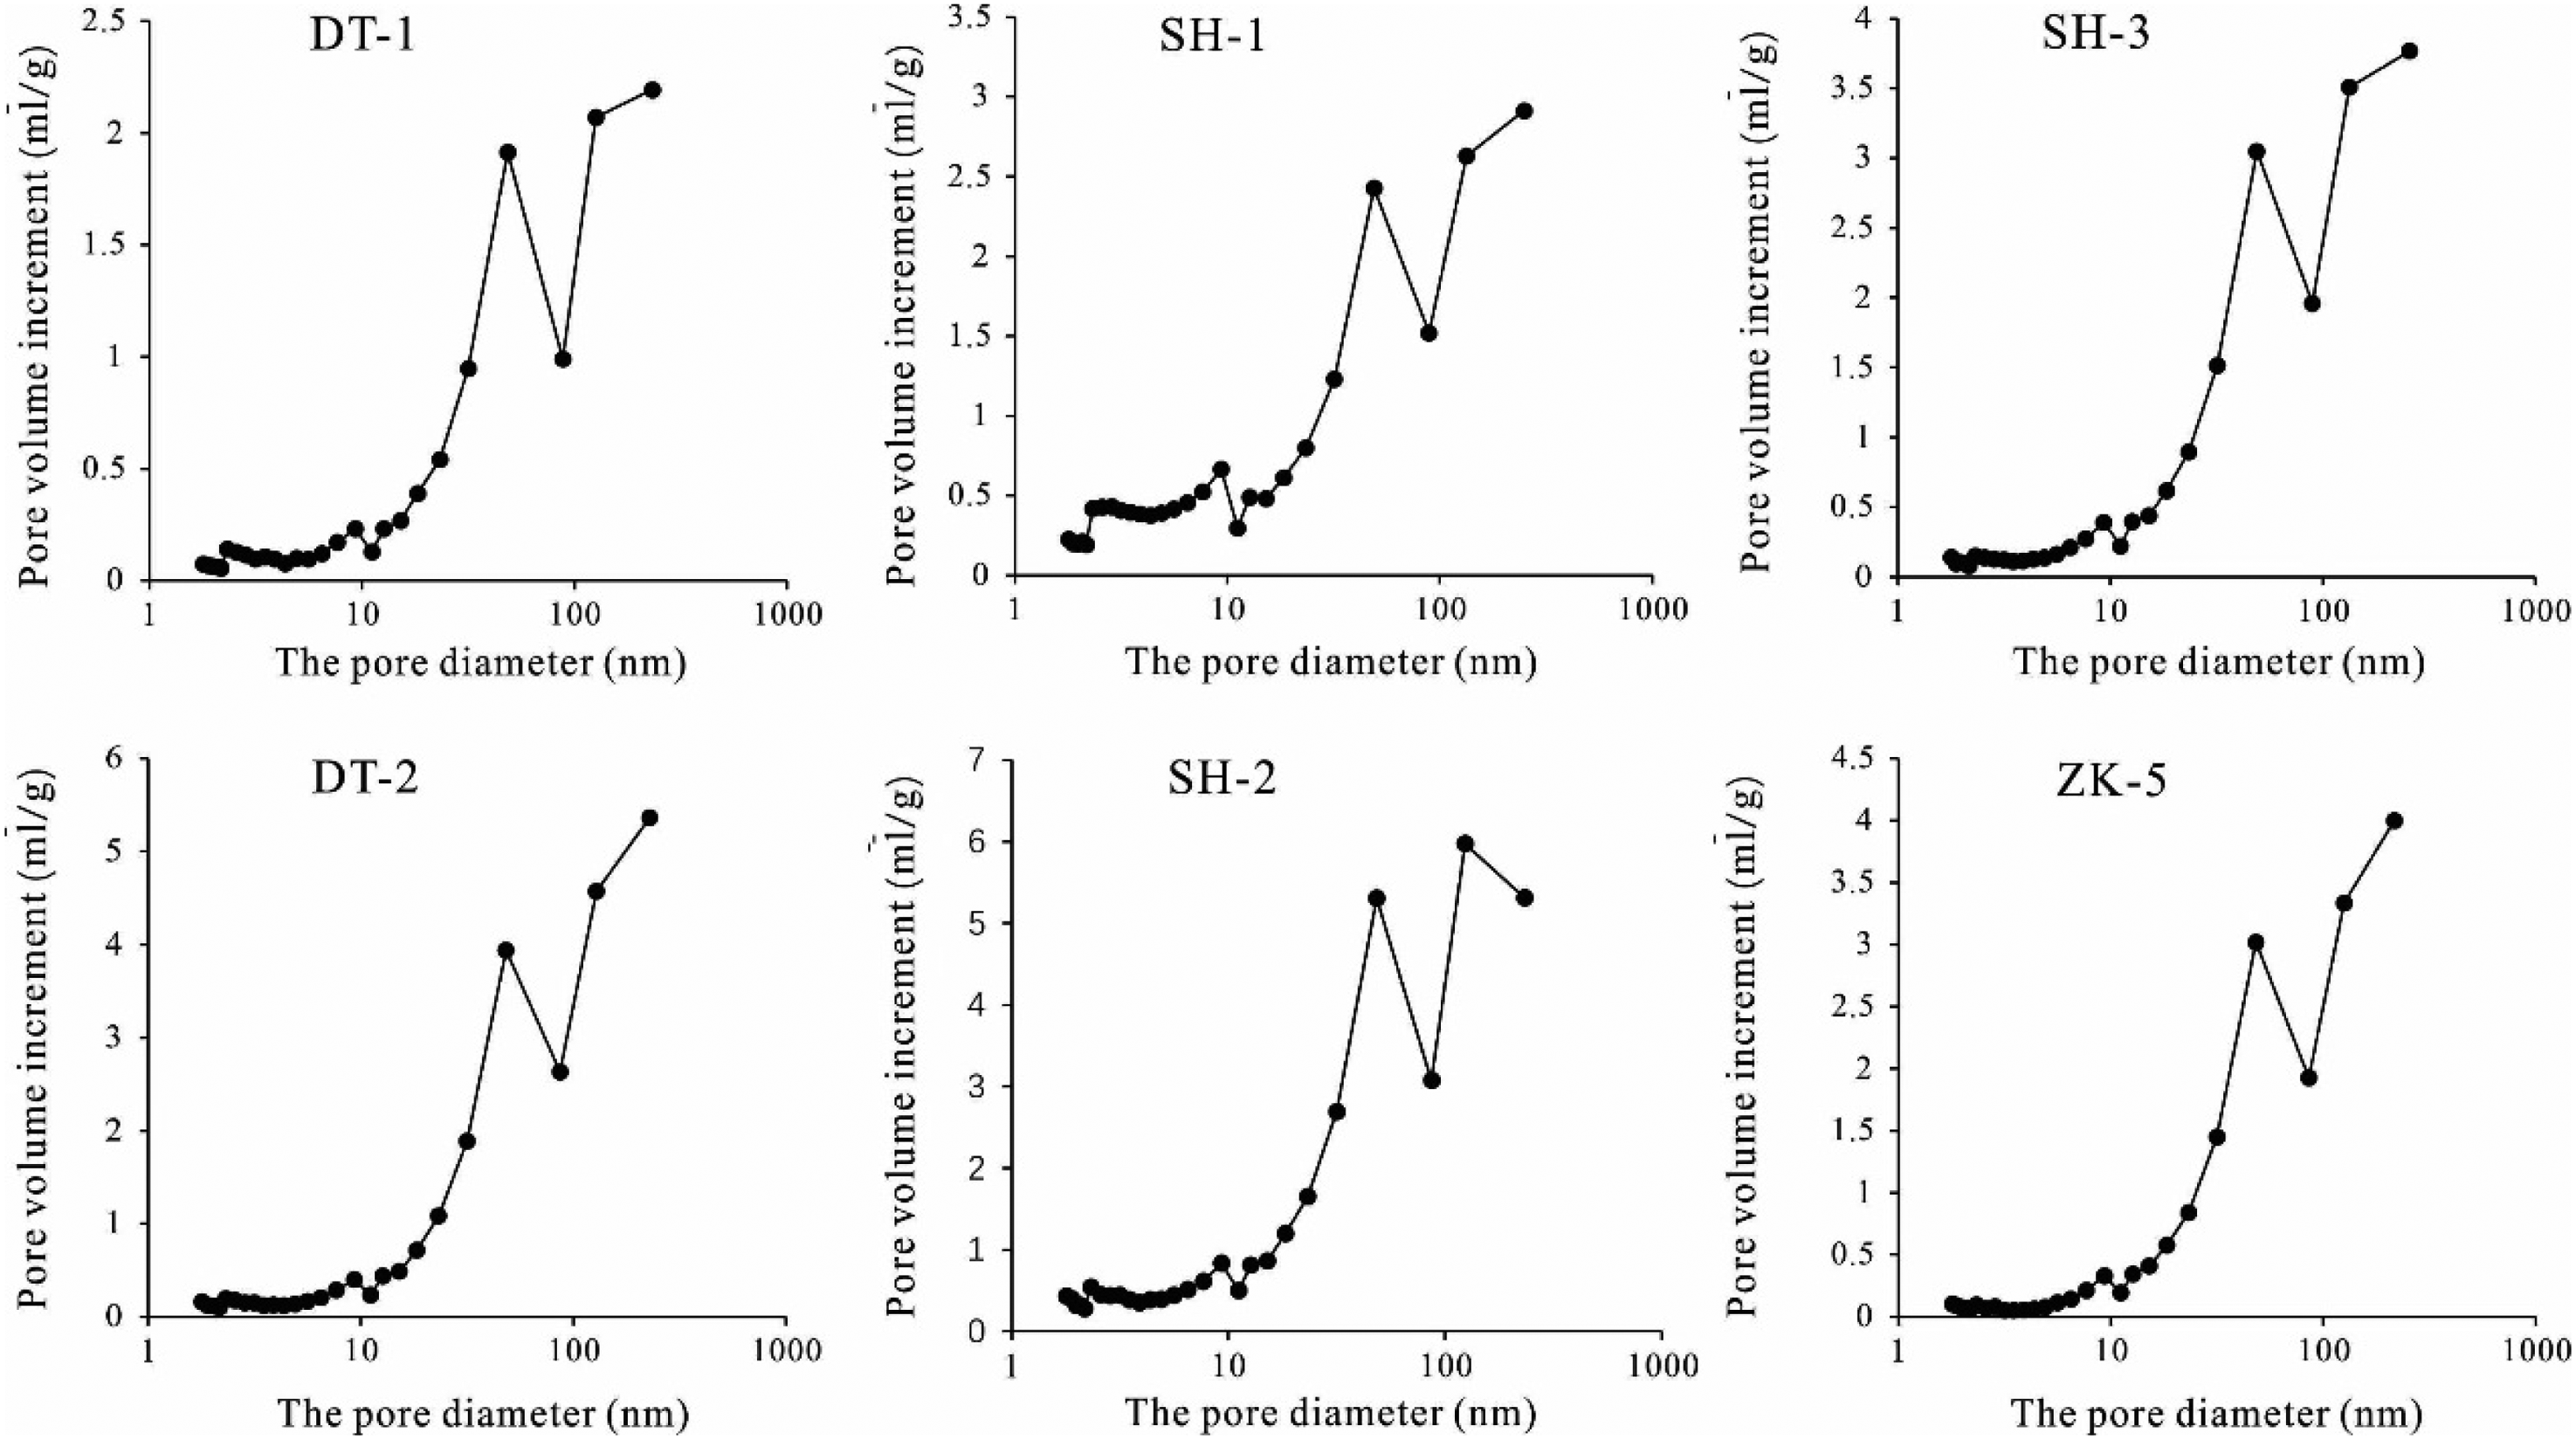
Relationship between pore size distribution and pore volume.
The pore size distribution characteristics of samples in the research area are shown in Figure 11. There are 3 peaks at 2–3 nm, 8–10 nm, and 40–50 nm, indicating that the pores in this range increase the volume contribution rate and the number of pores. The peak value is small at 2–3 nm and 8–10 nm, and its volume contribution is limited, but the contribution is huge at 40–50 nm. When the pore diameter is in the range of 50–100 nm, the increased rate of pore volume decreases sharply, and the content of pores in this range is not much. The increased rate of pore volume increased sharply in the range of 100–150 nm, indicating that the pore content in this range was in the majority. According to section 3.1, the genesis types of pores in this region are mainly mineral pores and plant tissue pores. Therefore, the difference in pore development degree in different size intervals may be controlled by mineral particle size and plant type.
The performance of heterogeneity in fractal characteristics
Table 3 and Figure 12 show the results of fractal dimensions, the D1 ranges from 2.5512 to 2.7474 (avg. 2.6239), the D2 ranges from 2.5404 to 2.6103 (avg. 2.5695). D1 represents fractals from pore surface area generated by surface irregularity of coals (Yao et al., 2008), high D1 represents high pore surface roughness due to the complex structure of the primary pore of low-rank coal. D2 characterizes fractals related to pore structures, high D2 represents the coal reservoir in this region with complex pore structure.
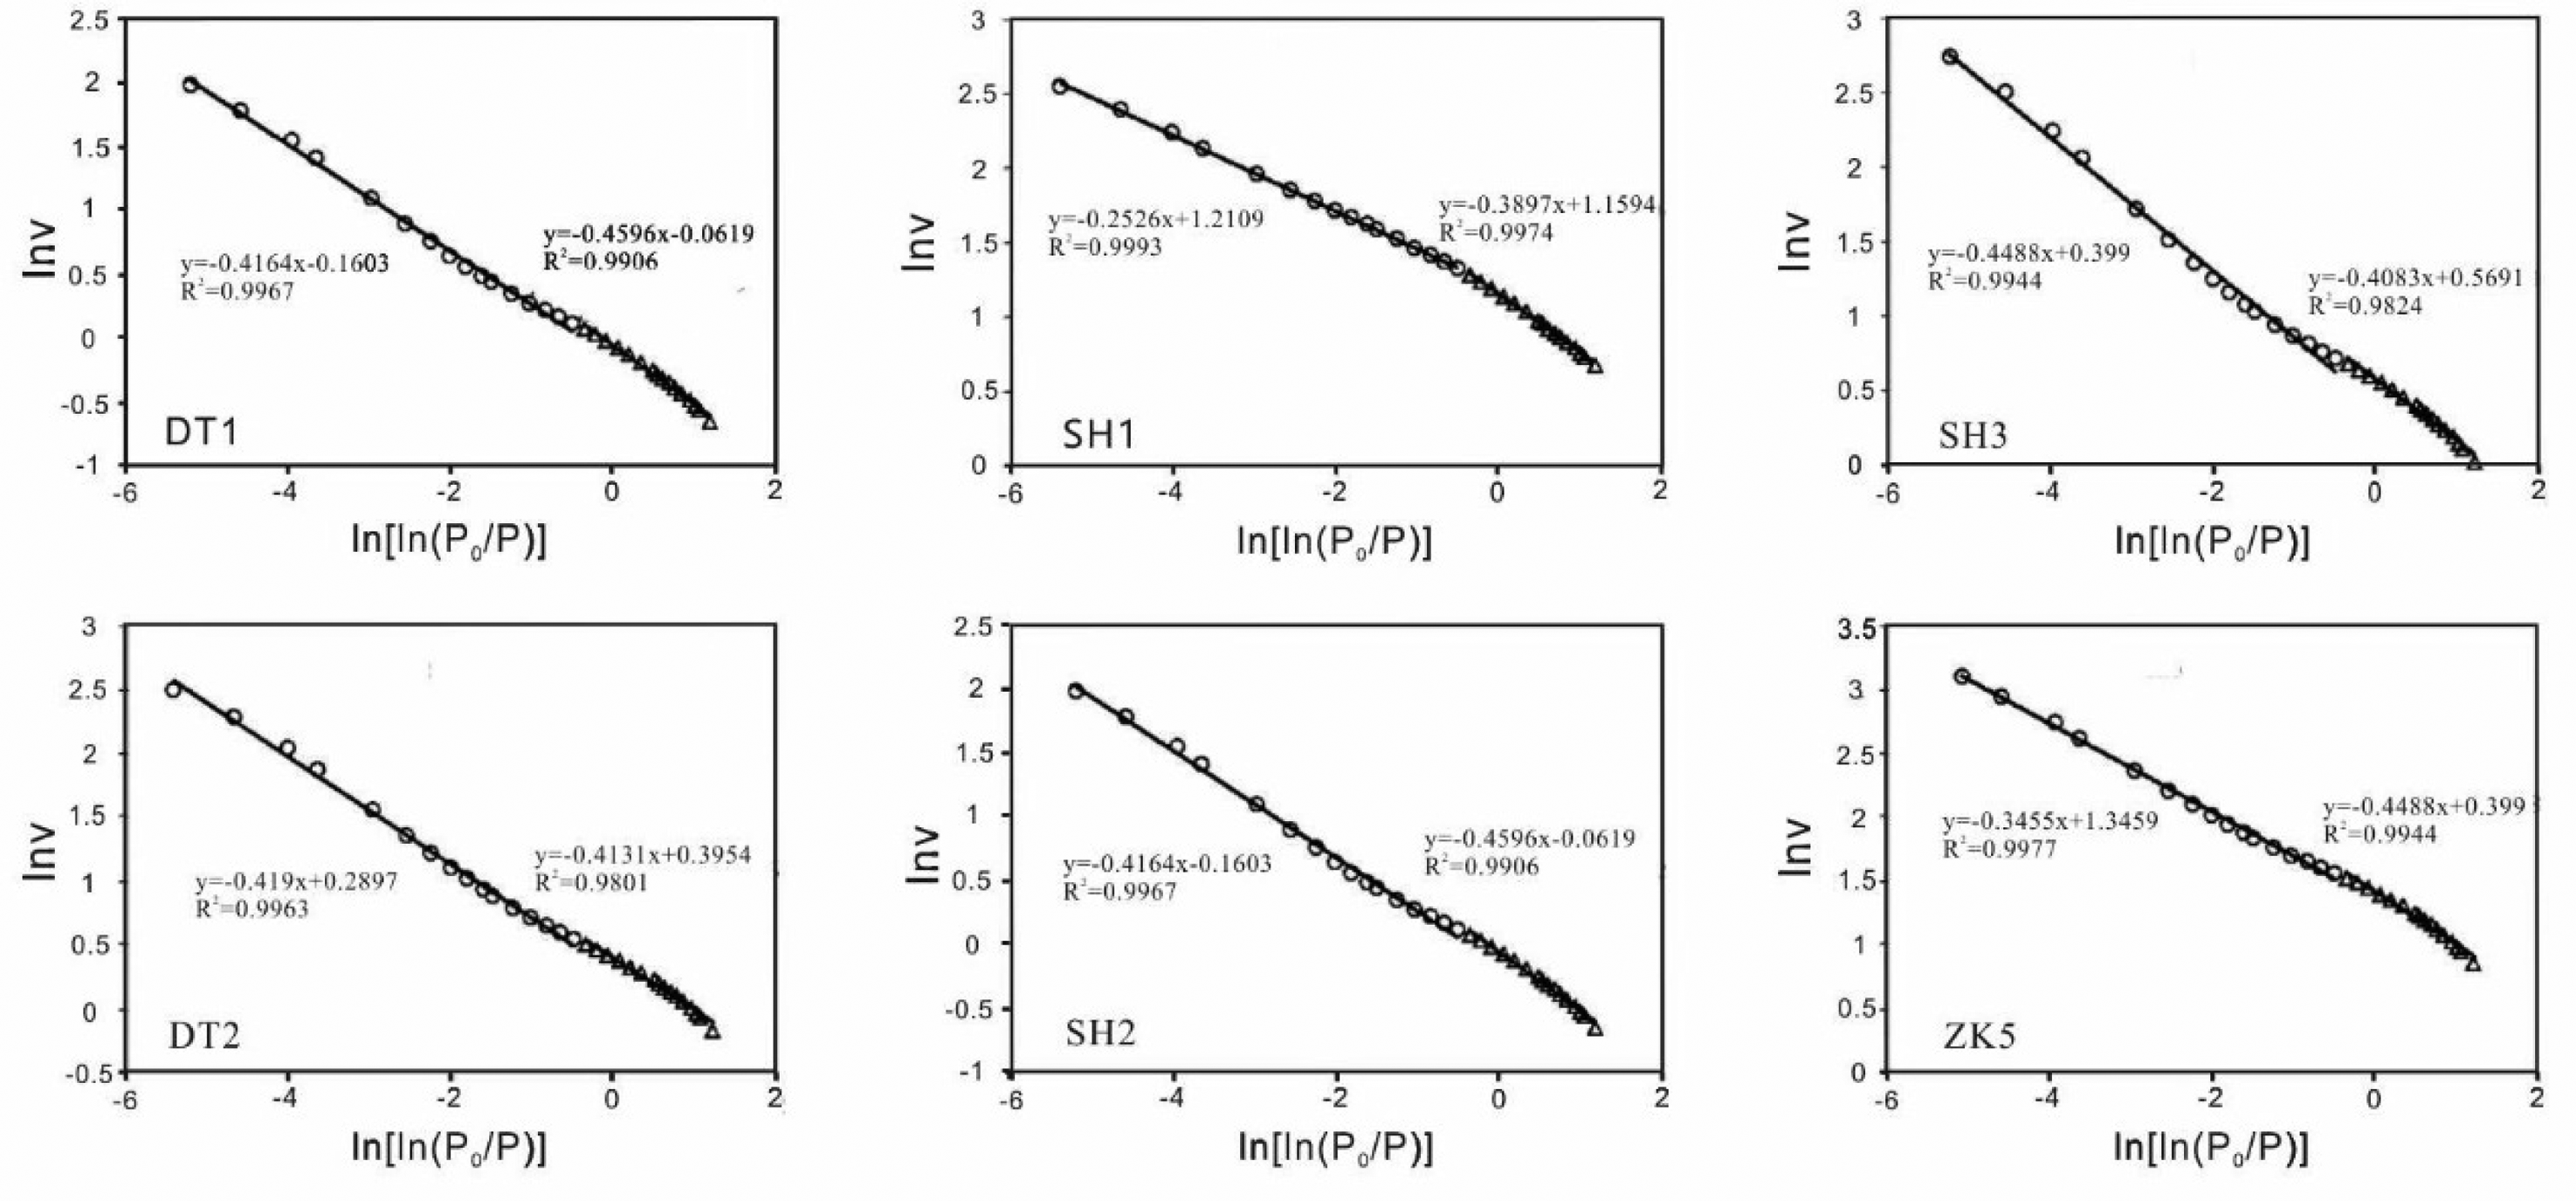
Plots of lnV vs ln(ln(P0/P)) evaluated by the N2 gas adsorption isotherms.
Fractal dimensions derived from fractal FHH model.
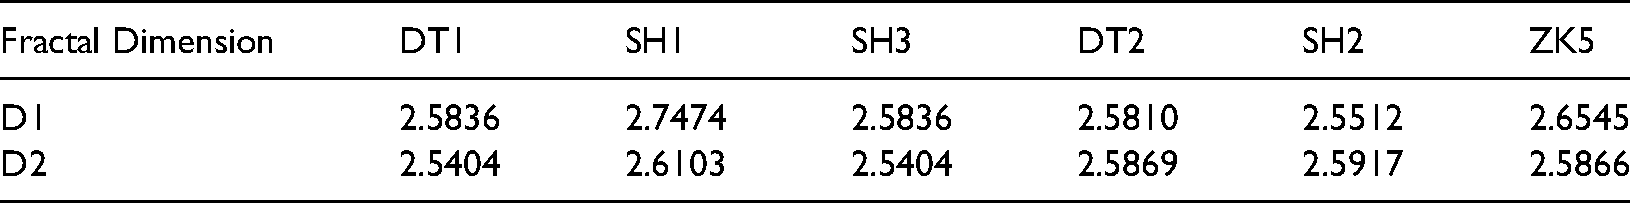
The fractal dimension is between 2 and 3, the larger the fractal dimension, the more complex the pore system of the sample. For example, the fractal dimension D1, the fractal dimension equal to 2 represents the very smooth pore surface, while the fractal dimension equal to 3 represents the very rough pore surface. Through the analysis of the fractal characteristics and fractal dimension of the samples, it is found that the dimension value D1 and D2 of the samples of low-rank coal reservoirs are both between 2.5 and 3, which shows that the low-rank coal in the study area has high pore surface roughness and complex pore structure.
Meanwhile, both samples SH1 and SH3 belong to the No. 5 coal seam, but the pore surface roughness and pore structure of sample SH1 are much higher than sample SH3, indicating that there is strong heterogeneity in the same coal seam. The above study believes that material composition, coal formation environment, and coal rank mainly control the pore type and reservoir heterogeneity. In summary, it can be found that there are very large differences between different lignite seams, and even the internal reservoirs of the same brown coal seam have very large heterogeneity.
Conclusion
In this study, the time domain signal of the SEM image is converted into a frequency-domain signal that is easy to analyze, and the qualitative analysis is extended to the quantitative analysis Through statistical analysis of the numerical values, the development status and heterogeneity of the pore-fracture in the coal seam were obtained.
The Fourier transform of the three coal seam SEM data shows that the variance of the numerical value indicates that the heterogeneity of the lignite reservoir between different coal seams and different mining areas is significant. Nitrogen adsorption data and fractal analysis indicate that the lignite in the study area has high pore surface roughness and complex pore structure.
Affected by various geological factors such as material composition, coal formation environment, evolution degree, etc., lignite reservoirs in different layers and different mining areas show apparent heterogeneity. Therefore, in the actual exploration and development process, it is necessary to conduct a favorable reservoir evaluation and adopt appropriate development technology.
Footnotes
Acknowledgements
This work was supported by the National Natural Science Foundation Project, China (Grant No. 42172188, U1703126), and the National Science and Technology Major Project of China (2016ZX05041-002).
Declaration of Conflicting Interests
The author(s) declared no potential conflicts of interest with respect to the research, authorship, and/or publication of this article.
Funding
The author(s) disclosed receipt of the following financial support for the research, authorship, and/or publication of this article: This work was supported by the The National Science and Technology Major Project of China, The National Natural Science Foundation Project, China, (grant number 2016ZX05041-002, No. 42172188, U1703126).