
Abstract
New characterization on petrophysical characteristics of tight sandstone reservoirs is of an important value to exploration and exploitation of oil and gas. In this paper, low-field nuclear magnetic resonance, combined with casting thin sections, laser scanning confocal microscopy, scanning electron microscopy and pressure-controlled porosimetry were applied to investigate the pore structure characteristics of nine tight sandstone samples of Yanchang Formation in the Upper Triassic Ordos Basin China. And then, based on the nuclear magnetic resonance T2 spectrum distribution and previous theoretical models, a new model is proposed to predict permeability of tight sandstone reservoirs. Petrophysical characteristics are qualitatively–quantificationally analyzed by a combination of various experiments, which is considered to be a new method that will be widely used in future research. Results indicate that nuclear magnetic resonance T2 spectrum distribution has a close relationship with characteristics of pore types and pore radius distribution. Three T2 spectrum peaks are identified by the relaxation time at 0.1–10 ms, 10–100 ms and >100 ms correspond to micropores (<0.2 µm), mesopores (0.2–4.9 µm) and macropores and fractures (>4.9 µm), respectively, which is well consistent with results from casting thin sections, laser scanning confocal microscopy, scanning electron microscopy and pressure-controlled porosimetry. Compared with the existing several classical models, the new permeability model can better estimate the permeability of tight sandstone samples. The new characterization method and new model can accurately evaluate petrophysical characteristics of typical tight sandstone samples, which have a great value for nuclear magnetic well logging in the exploration and exploitation of tight sandstone reservoirs in the Ordos basin.
Keywords
Introduction
With the increasing development of oil and gas exploration and exploitation, unconventional oil and gas, such as tight oil, tight gas, shale gas and coalbed methane, show a great potential in the existing economic and technological conditions, and global oil and gas resources will usher a second extension (Dong et al., 2015; Zou et al., 2009, 2010, 2013a). Unconventional oil and gas resources are very rich in China, which also brings great news for oil and gas resource potential evaluation, such as the tight sandstone oil and gas reservoirs in Ordos basin (Du et al., 2014; Hu et al., 2010; Jia et al., 2012; Li and Zhang, 2011; Liu et al., 2009a). Geological researches of unconventional oil and gas of China started relatively late, and understanding of resource potentials is insufficient. Due to these, it has been difficult to explore and exploit these resources (Liang et al., 2011; Ning et al., 2009; Zhao et al., 2012). In this paper, based on the present situation, we strive to study petrophysical characteristics of tight sandstone reservoirs, such as pore structure and rock physical properties by various experimental methods, which provide important information to exploration and exploitation of unconventional oil and gas in China.
Current technologies that characterize pore structure characteristics mainly include scanning electron microscopes (SEM), X-ray computer tomography (CT), low-field nuclear magnetic resonance (NMR), pressure-controlled porosimetry (PCP), rate-controlled porosimetry, nitrogen gas adsorption and small angle neutron scattering (Clarkson et al., 2012, 2013; Li et al., 2015c; Sakdinawat and Attwood, 2010; Ying et al., 2002; Li et al., 2013; Zhang et al., 2016a). However, all these technologies have some disadvantages in characterizing the pore structure of tight sandstone reservoirs (Guan et al., 2011; Liu et al., 2015; Shan et al., 2013). Currently, experimental methods cannot fully and accurately reflect pore structure characteristics of tight sandstone reservoirs, the development of NMR techniques brought new breakthroughs for the exploration of the petrophysical characteristics of tight reservoirs. It is a fast, simple and damage less testing method on pore structure characteristics, which can also be widely used in well logging. Low-field NMR experiments have been applied to conventional oil and gas reservoirs exploration for analyzing rocks’ petrophysical characteristics from the 1960s (Timur, 1969, 1972; Watson and Chang, 1997). Compared with other core analysis methods, it can provide various information about the reservoirs evaluation, such as pore structure, porosity, permeability, fluid saturation, free fluid type, etc. (Al-Mahrooqi et al., 2003; Arnold et al., 2006; Li et al., 2012; Schmitt et al., 2014; Wang et al., 2010). Furthermore, NMR testing is essential to parameters optimization of well logging, which can be widely popularized in oilfields (Liu et al., 2009b).
In recent years, scholars worldwide have applied these methods to test pore structure characteristics and physical properties of tight sandstone reservoirs. Mohnke and Yaramanci (2008), Wang et al. (2010), Li et al. (2012, 2015e), Cai et al. (2013), Zhou et al. (2013) and Ge et al. (2013) analyzed pore radius distribution of various types of reservoirs using NMR methods, but they failed to intuitively describe and analyze the reservoirs’ microscopic characteristics. Li et al. (2008, 2012), Wang (2009), Yao et al. (2010), Yao and Liu (2012), Mao et al. (2013) and Zou et al. (2013b) thought the results of pore radius distribution were consistent by contrasting NMR with mercury intrusion experiments/CT. Using NMR and other experiments contrast, Li et al. (2015a, 2015b) forecasted spaces of oil and water occurrence in the tight sandstone reservoirs. Many scholars analyzed parameters of oil occurrence and physical properties and built plenty of petrophysical and oil prediction models through T2 spectrum distribution characteristics for several kinds of reservoirs (Dillinger and Esteban, 2014; Li et al., 2015d; Liu and Hu, 2009; Peng et al., 2006; Wang et al., 2014; Yao et al., 2010). The predecessors’ researches show that characterization on the petrophysical characteristics (pore structure and physical properties) of tight reservoirs have many advantages in now commonly used experiments. However, there are still many disadvantages: (1) qualitative–quantitative characterization on pore throat characteristics of reservoirs rarely combines with various experimental methods; and (2) it cannot develop a petrophysical characteristics evaluation method that is suitable for tight sandstone reservoirs.
In this paper, we mainly use low-field NMR techniques, combined with casting thin sections (CTS), laser scanning confocal microscopy (LSCM), scanning electron microscopy (SEM) and PCP, to test pore structure characteristics of nine typical tight sandstone samples and analyze physical properties characteristics of tight sandstone reservoirs in Ordos Basin. The goals were (1) to develop a new method of qualitatively and quantitatively characterizing pore structure characteristics using NMR experiments, combined with other several experiments, (2) to set up a new theoretical model to better predict permeability being suitable for tight sandstone reservoirs and (3) to evaluate petrophysical characteristics of tight sandstone reservoirs by NMR and adapt for well-logging parameters optimization in the oilfield, which lacks of further studies.
Samples and experimental methods
The typical tight samples
Basic parameters of testing samples.
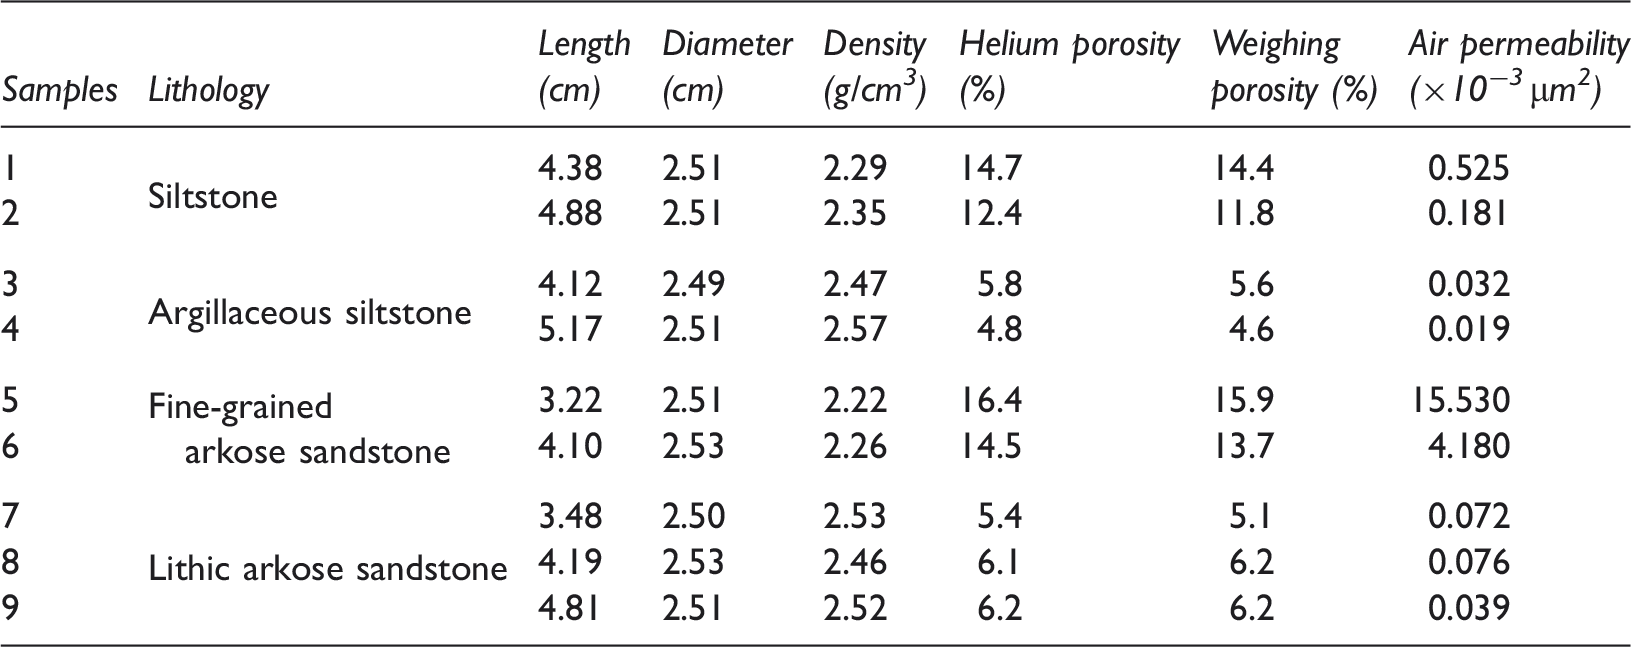
According to the effective radius of the testing instrument, samples were processed as core plugs of 3–5 cm long, 2.5 cm diameter. Before the test, these plugs must be pretreated, which consists of washing with a mixture of alcohol and benzene (as oil), controlling the temperature at 45℃ and continuous drying for 36 h, which is to wash the residual oil and fully dry samples. The porosity was measured using the helium expansion method, and the absolute permeability was determined using a bubble flowmeter by flowing air through the core samples until the variation of permeability became relatively stable. Helium porosity of the five samples ranges from 4.8% to 16.4%, the average value being 9.6%, weighing porosity and helium porosity can verify each other. Permeability of the different samples show evident diversities, with the lowest value being 0.019 × 10⁻³ µm2 from sample 4 and the highest value being 15.530 × 10⁻³ µm2 from sample 5, the average permeability of the five samples being 1.203 × 10⁻³ µm2 (Table 1). And then, the core plugs were performed for qualitative microscopic pore structure description experiments (CTS, LSCM and SEM) and quantitative pore radius distribution experiments (NMR and PCP).
Experimental methods
Low-field NMR
NMR measurement is conducted using a MARAN-DRX/2 NMR core analyzer made in the British Resonance Instruments Company. The instrument has a constant temperature of 35℃, resonance frequency of 2 MHz, fast testing speed, good repeating testing stability and high signal to noise ratio. Samples were centrifuged using a PC-12B Petroleum Core Centrifuge to obtain a perfect irreducible water condition at a centrifuge capillary pressure of 1.4 MPa (Kenyon, 1997; NDRC, 2007; Yao et al., 2010). T2 spectrum distribution is computed by multi-exponential inversion of the echo data with 64 preset decay time logarithmically spaced from 0.01 ms to 10,000 ms. Experimental procedures are as follows (NDRC, 2007):
General parameters of nine samples were measured, such as samples dry weight and weight in water. The solution that had the same salinity (in order to keep consistent with water salinity of reservoirs) and composition as reservoirs was compounded, samples were evacuated for more than 12 h, and forced saturation continued for 12 h using the above solution under the in situ formation pressure, weighing wet weight and calculating fluid porosity after taking out the cores. Saturated samples used NMR measurements, the measurement parameters were set as follows: echo spacing, TE = 0.3 ms; waiting time, TW = 6 s; echo numbers, Ne = 2048; numbers of scans, 128. Samples were centrifuged for 1.5 h to reach the state of bound water at a speed of 4500 r/min (1.4 MPa), and then measuring the NMR and parameters acquisition is the same as methods of saturation measurements.
Three experimental methods of pore structure characteristics
1. CTS are made by injecting liquid glue into pore spaces of samples and polished into rock thin sections; after solidification of glue, the characteristics of pore types and radius distribution characteristics are observed by an electron microscope. The sections are filled by colored glue, so it is easy to identify in the microscope. 2. Confocal laser scanning microscopy experiments apply Nikon A1R/A1, the work environment of instrument has a temperature of 19℃ and humidity of 46%–49%, confocal laser SEM can clearly recognize pores structure and fractures characteristics and there are great advantages in the study of pore structure characteristics of tight sandstone reservoirs. 3. Quanta 650 FEG SEM was used to examine pore types and shapes of samples, the accelerating voltage and resolution of SEM were 200 V–30 kV and 1.4 nm, respectively, temperament of 165℃–1500℃, magnification of 25–1,000,000. Fragments were first mechanically polished to make the ion beam bombardment samples surface avoiding the mechanical damage to the sample surface polishing process and retain the real samples surface pore configuration. Thickness of the samples should be no more than 0.1 cm. All samples were golden-coated and placed for secondary electron imaging, back scatter electron imaging and energy dispersive spectroscopy mineral identification.
Pressure-controlled porosimetry
PCP was performed on a Pore Master PM33-13 mercury porosimeter following the standard SY/T 5346-2005 of China. Maximum intrusion pressure was 80 MPa, corresponding to a pore throat radius of 9.2 nm. After reaching the highest pressure, the pressure was then gradually decreased and the mercury extruded from the samples. Mercury intrusion curves mainly represent pore throat radius distribution of samples, and mercury extrusion curves reflect pore throat connectivity. PCP can reflect the overall pore throat radius distribution, and it is suitable to test pore structure characteristics of tight reservoirs due to high mercury intrusion pressure.
Results
NMR relaxation time distributions of samples
Low-field NMR relaxation time
The dipole moment time evolution can be decomposed into a spectrum of attenuation times, i.e., the longitudinal (T1) and transverse (T2) relaxation time distributions. The measurement of T2 relaxation is preferred as it is fast and usually provides similar distribution to T1 (Kleinberg et al., 1993). Transverse (T2) relaxation time includes three kinds of relaxation time: surface relaxation, volume relaxation and diffusion relaxation, which is suitable for different types of fluids. Core saturated by single-phase fluid (saline water or light oil), the transverse (T2) relaxation time of the fluids mainly depends on acting force suffering fluids molecule of pore solid surface. When the acting force is strong (e.g., fluids in small pores or closely contacted with the solid surface within the larger pores), this part of fluids in the NMR shows a small transverse relaxation time. Conversely, when the acting force is weak (e.g., fluids less contacted with the solid surface within the larger pores), the transverse relaxation time of this part of fluids is large. Consequently, the T2 distribution in samples reflects the pore radius distribution, with the smallest pores having the shortest relaxation time and the largest pores existing the longest relaxation time (Li et al., 2015b; Yao et al., 2010). According to the theory of NMR, T2 distribution of single-phase fluid saturated rock can reflect the internal pore structure; saturated water atom transverse relaxation time of a single pore channel in a uniform magnetic field can be expressed as (Kleinberg, 1996)

NMR T 2 distribution at Sw
T2 spectra can reflect the status of fluids occurrence in different pores; these NMR measurements at Sw are performed for these nine samples (Figure 1). These T2 spectra distributions at Sw show peaks in three different ranges (black line). The T2 spectrum at less than 10 ms corresponds to micropores, the T2 spectrum between 10 ms and 100 ms corresponds to mesopores, while the T2 spectrum at longer than 100 ms corresponds to macropores/micro fractures. Three peaks in these ranges called P1, P2 and P3 within the scope of less than 10 ms, 10–100 ms and longer than 100 ms, respectively. For tight sandstone samples, P1 appears in almost all the rock samples, except for samples 5 and 6; however, P2 and P3 are not found in some samples (samples 4 and 9), P2 and P3 appear in the form P2 + P3 in some samples (samples 5 and 6). Three peaks are usually less simultaneously, which characterizes complex pore structure characteristics of tight reservoirs.
NMR T2 distribution of tight sandstone samples ( T2 at 100% water saturation
  T2 at irreducible water saturation).
Based on T2 spectra distributions of these three peaks, we can divide nine samples into four types. Type 1: P1 and P2 of samples 1 and 2 are obvious, and the amplitude of P1 is the same as that of P2. Type 2: T2 spectra of samples 3 and 4 only have an apparent peak (P1) and did not show P2 or present only a small peak (P2). The most special case is Type 3: P1 of samples 5 and 6 does not appear, which has a big difference with the other three groups, and the emergence of P2 + P3 is a distinctive feature, located at about 100 ms. The last group is type 4: it has large amplitude of P1 and small amplitude P3 in about 300 ms, expect for sample 9.
NMR T 2 distribution at Sir
The centrifuge pressure of 1.4 MPa used in the experiment corresponds to a pore radius of 0.1 µm, which means that the minimum pore throat radius for the water to be centrifuged is about 0.1 µm (Cai et al., 2013; Yao et al., 2010). In other words, the irreducible water is defined as including not only the bound water in less than 0.1 µm pores (micro-capillary bound water) but also the bound water film of the large pore surface (water membrane bound water). The T2 spectrum at Sir is commonly lower than that at Sw. In terms of these peaks, the effective T2 spectra at Sir are in the ranges of 0.1–100 ms as shown in Figure 1. By centrifugation, the P1 at Sir shows a very small difference with that at Sw, which shows the T2 spectrum at less than 10 ms (micropores) still contains the largest fraction of water; the P2 at Sir is distinctly smaller than that at Sw, suggesting the T2 spectrum between 10 ms and 100 ms (mesopores) has a part at irreducible water saturation, while the P3 is commonly not distinguishable at Sir, the T2 spectrum at longer than 100 ms (macropores/micro fractures) disappeared after centrifugation, which reveals that the water saturated in macropores/micro fractures is generally removable. However, there are significant differences for peaks distribution among samples with different pore structure characteristics, for instance, the peak of T2 spectrum (samples 5 and 6) at Sir is mainly in 10–100 ms, which is different from other samples. For each sample, the difference in the T2 distributions at Sw and Sir depends on diversities of pore structure of samples, which will be discussed later.
Mercury intrusion curve
According to the capillary pressure curves in the process of mercury intrusion and mercury extrusion, PCP can quantitatively evaluate pore throat structure characteristics (Pang et al., 2007; Zhao et al., 2015). Four typical samples (selected from four categories) are selected to perform the PCP experiments owing to limitation of samples length, these curves of four samples are shown in Figure 2, and characteristic parameters are in Table 2. Curves features of four samples have big discrepancies, the threshold and medium saturation pressure of sample 6 is only 0.076 MPa and 0.637 MPa, respectively, showing the pore throat radius is big and connectivity is good, and the threshold and medium saturation pressure of sample 4 can reach 2.962 MPa and 22.419 MPa that suggests the pore throat radius is small and connectivity is poor. The length of the horizontal stage of mercury intrusion curves length change shows some differences, sample 2 is shortest and sample 6 is longest, suggesting pore throat sorting differences are large. The maximum mercury intrusion saturations show some differences: the largest is sample 6 with 95.548%, the smallest is sample 4 with 79.816%, but all are greater than 70%. But the extrusion efficiency is not that good: the largest residual mercury saturation is sample 8 with 60.685%, and the smallest is sample 6 with 52.137%, with the average residual mercury saturation being 56.037%. The differences between intrusion saturation and extrusion saturation indicate that a large amount of mercury was snapped off in pore throats, implying a large pore throat discrepancy.
Intrusion and extrusion curves of pressure-controlled porosimetry. Characteristics parameters of PCP of four typical samples. Note: Pt, P50, Si and Sr represent the threshold pressure, medium saturation pressure, intrusion mercury saturation and residual mercury saturation of pressure-controlled porosimetry.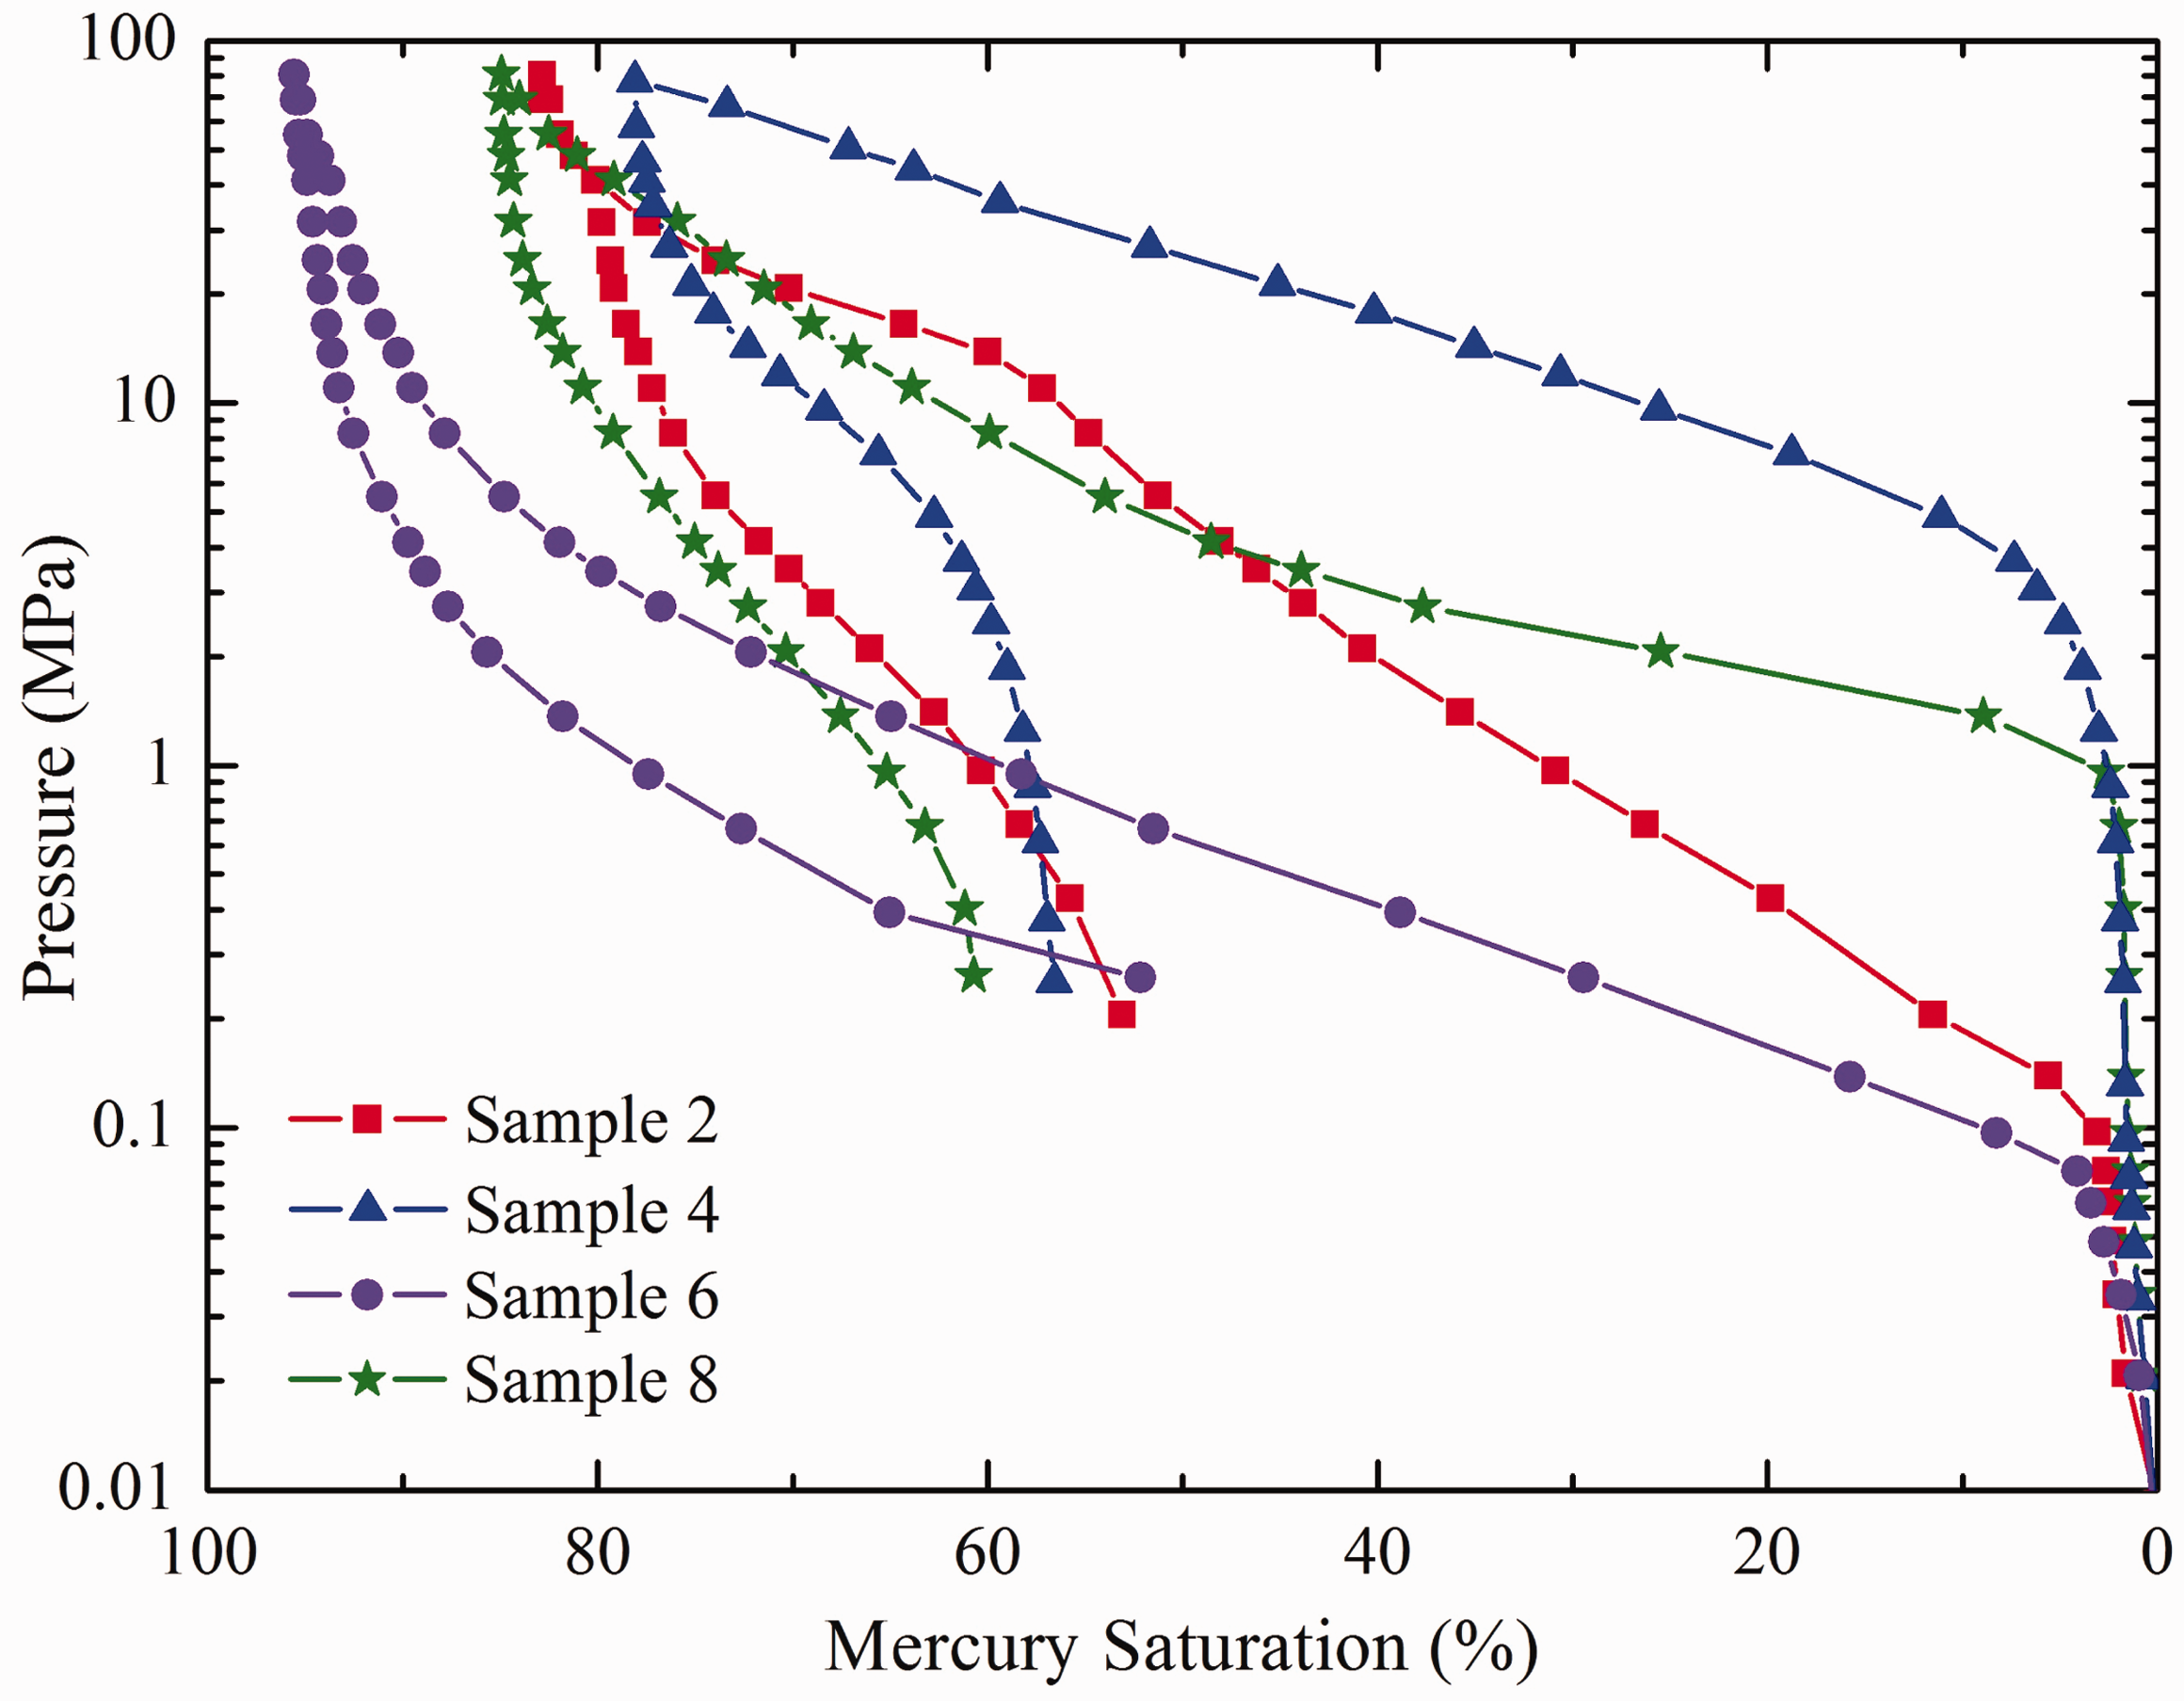
Mercury intrusion and extrusion curves features depend on pore structure characteristics (Yang et al., 2013), indicating pore types are multiple and differences of pore structures are large among four samples. Can be seen from the above analyses, main pore radius distribution ranking of four samples: sample 6 > sample 2 > sample 8 > sample 4.
Discussion
Pore structure characteristics
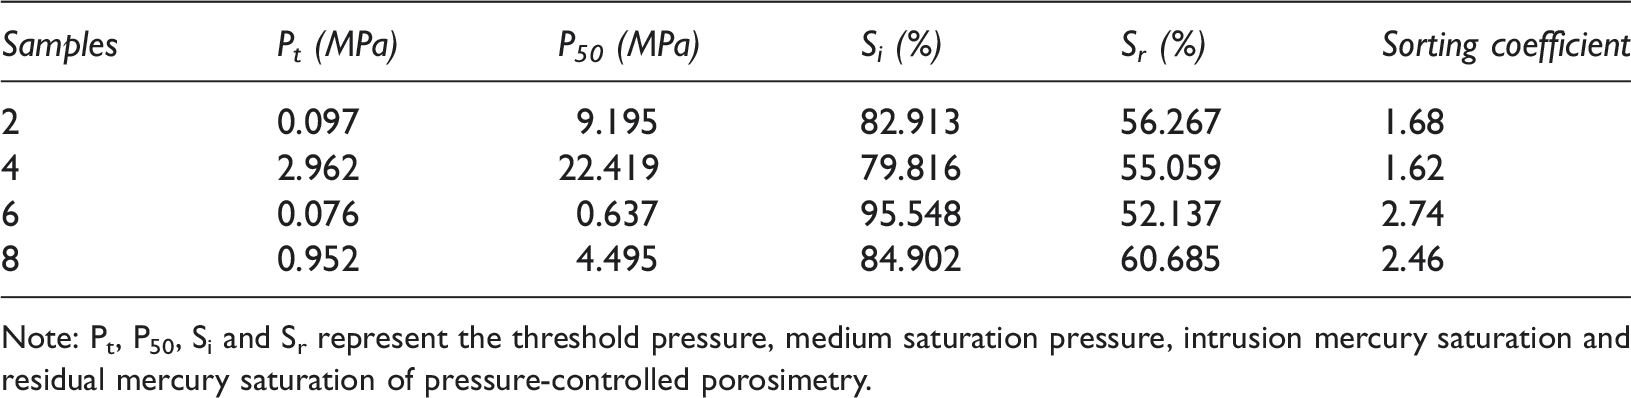
Experimental samples are taken from the Chang 6 Formation in Ordos Basin, which is typical of tight sandstone reservoirs in China. It has complicated diagenesis, multiple pore types and shapes (Wang et al., 2011; Wu et al., 2013; Xu et al., 2013; Zhang et al., 2016b; Zhao et al., 2015). By CTS, LSCM and SEM, we can clearly show the micro-nanometer scale pore structure characteristics and intuitively analyze pore types and morphological characteristics of tight sandstone reservoirs (Figure 3). And we find it contains intergranular pores, intragranular dissolution pores and micro fractures. There are big differences between pore types among the studied samples. Intergranular pores mainly exist in a micron scale and include primary intergranular pores and residual intergranular pores, which are the main oil and gas storage and seepage spaces owing to the fact that they are relatively large in size. Intragranular dissolution pores originated from the dissolution of grains such as feldspar, quartz and clay minerals range from nano to microns, and only can store oil and gas, but some become effective seepage channels due to connections with intergranular pores through micro fractures. Fractures mainly consist of interparticle and Feldspar broken micro fractures with nanometers’ width and microns’ length, these are important seepage channels of oil and gas (Zeng and Li, 2009; Zeng et al., 2010).
Typical pore types and shapes found in the tight oil sandstone samples (A, B and C are intergranular pores, intragranular broken fractures and grain-edge fractures of samples 1 and 2, respectively; D, E and F are intragranular dissolution pores of samples 3 and 4, respectively; G, H and I are cylindrical intergranular pores, micro fractures of samples 3 and 4, respectively; J, K and L are intergranular residual pores, intragranular dissolution pores and a few of grain-edge fractures of samples 7, 8 and 9, respectively).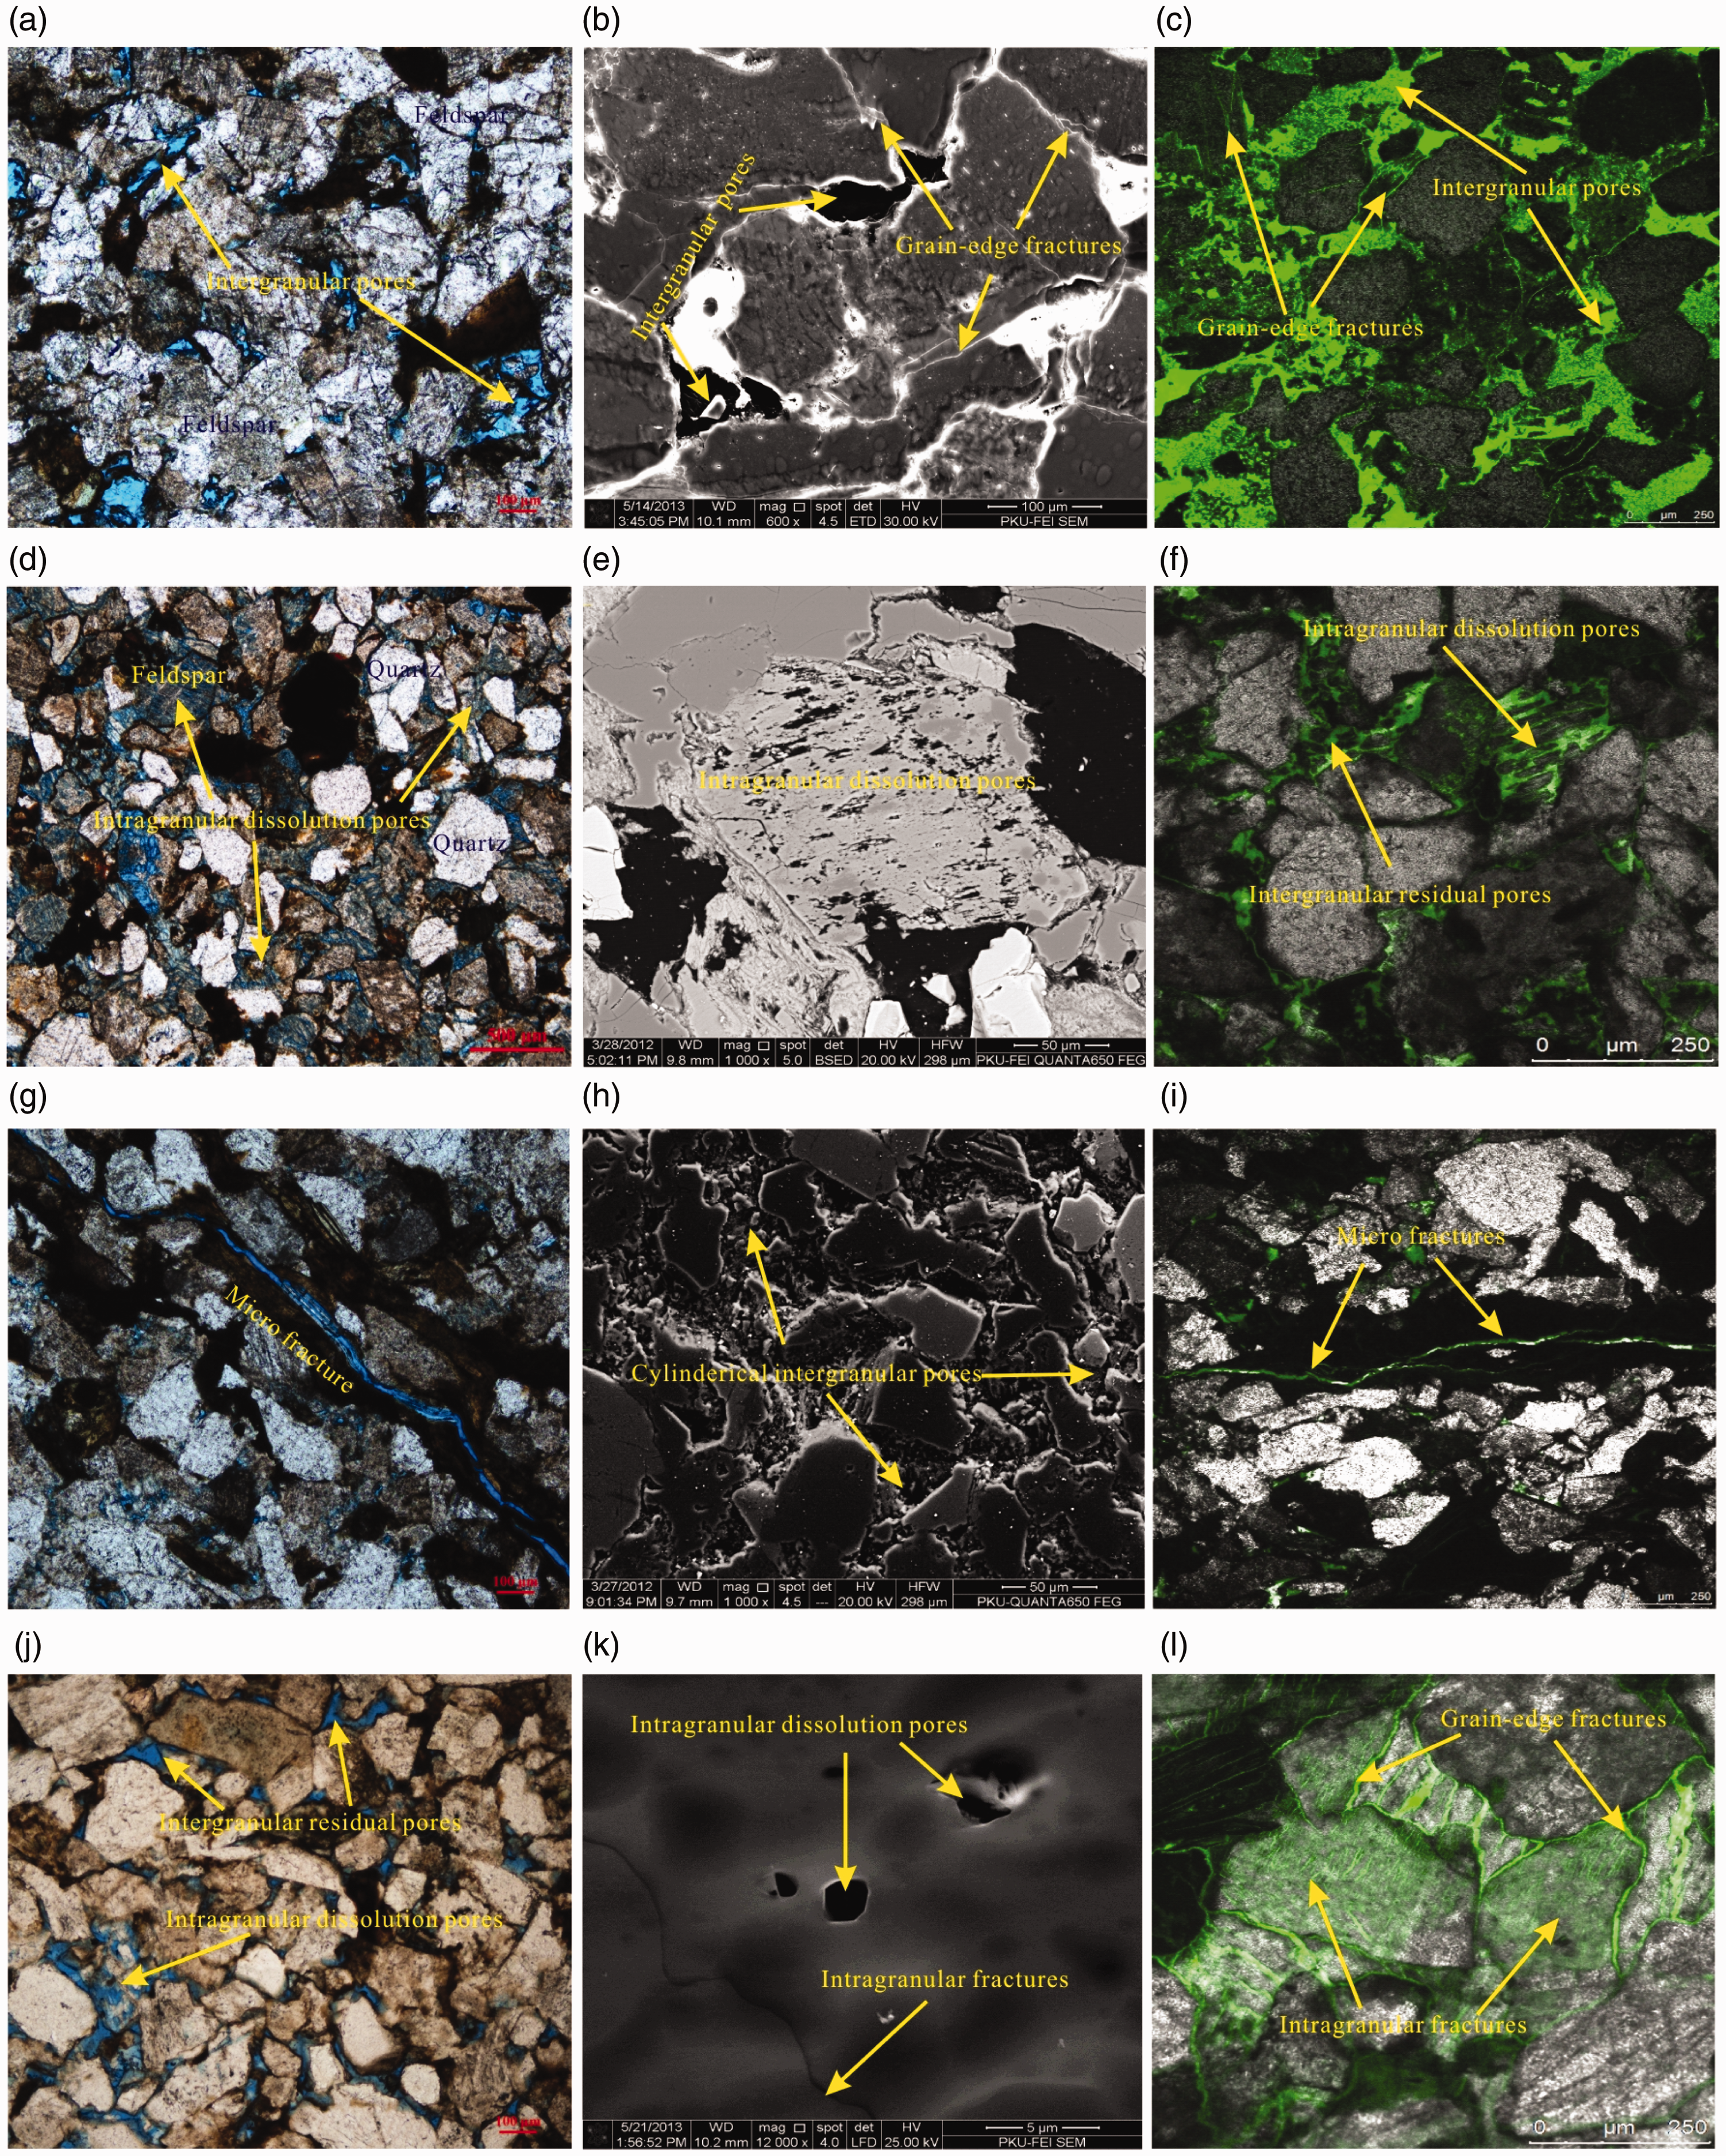
The study found that samples 1 and 2 mainly developed plenty of nanometers scale Feldspar broken fractures, micron-sized intergranular pores and some grain-edge fractures (Figure 3(a) to (c)), pore radius distribution ranges from nano to micron scale; samples 3 and 4 had a large number of intragranular dissolution pores and a few of intergranular residual pores (Figure 3(d) to (f)), which shows the overall pore radius distribution are small; samples 5 and 6 mainly contained cylindrical intergranular pores that always connected with each other through micro fractures, and intragranular dissolution pores that were not developed (Figure 3(g) to (i)); samples 7, 8 and 9 mainly had nano-micron scale transitional pores (clay minerals filling the pores, intragranular dissolution pores) and a handful of micro fractures (Figure 3(j) to (l)).
Comparison of results of NMR and PCP
In the low-field NMR testing, the number of hydrogen atoms within pore fluids can be detected; therefore, the study on pore structure characteristics of tight reservoirs using NMR is based on relationships between hydrogen atoms and pore radius distribution (Li et al., 2015b; Wang, 2009; Yao and Liu, 2012). T2 distribution corresponds to pore radius distributions with the smallest pores having the shortest relaxation times and the largest pores having the longest relaxation times; the results are accurate and reliable and undamaged. The relationship is based on previous research (Li et al., 2015a)

The contrasting experiments can discover microscopic testing results of NMR being in accordance with pore structure characteristics by CTS, LSCM and SEM. Through above experimental analyses, pore structure characteristics of samples can be divided into four typical categories, and PCP experiments are performed and analyze pore throat radius distributions of the four typical samples. In this study, these T2 spectra distributions are compared with the pore radius distributions obtained by PCP and NMR for four samples (Figure 4).
Comparison between T2 spectra distributions (left: a, b, c and d) and the pore radius distributions obtained by PCP and NMR for four samples (right: a′, b′, c′ and d′): sample 2: (a)–(a′), sample 4: (b)–(b′), sample 6: (c)–(c′) and sample 8: (d)–(d′).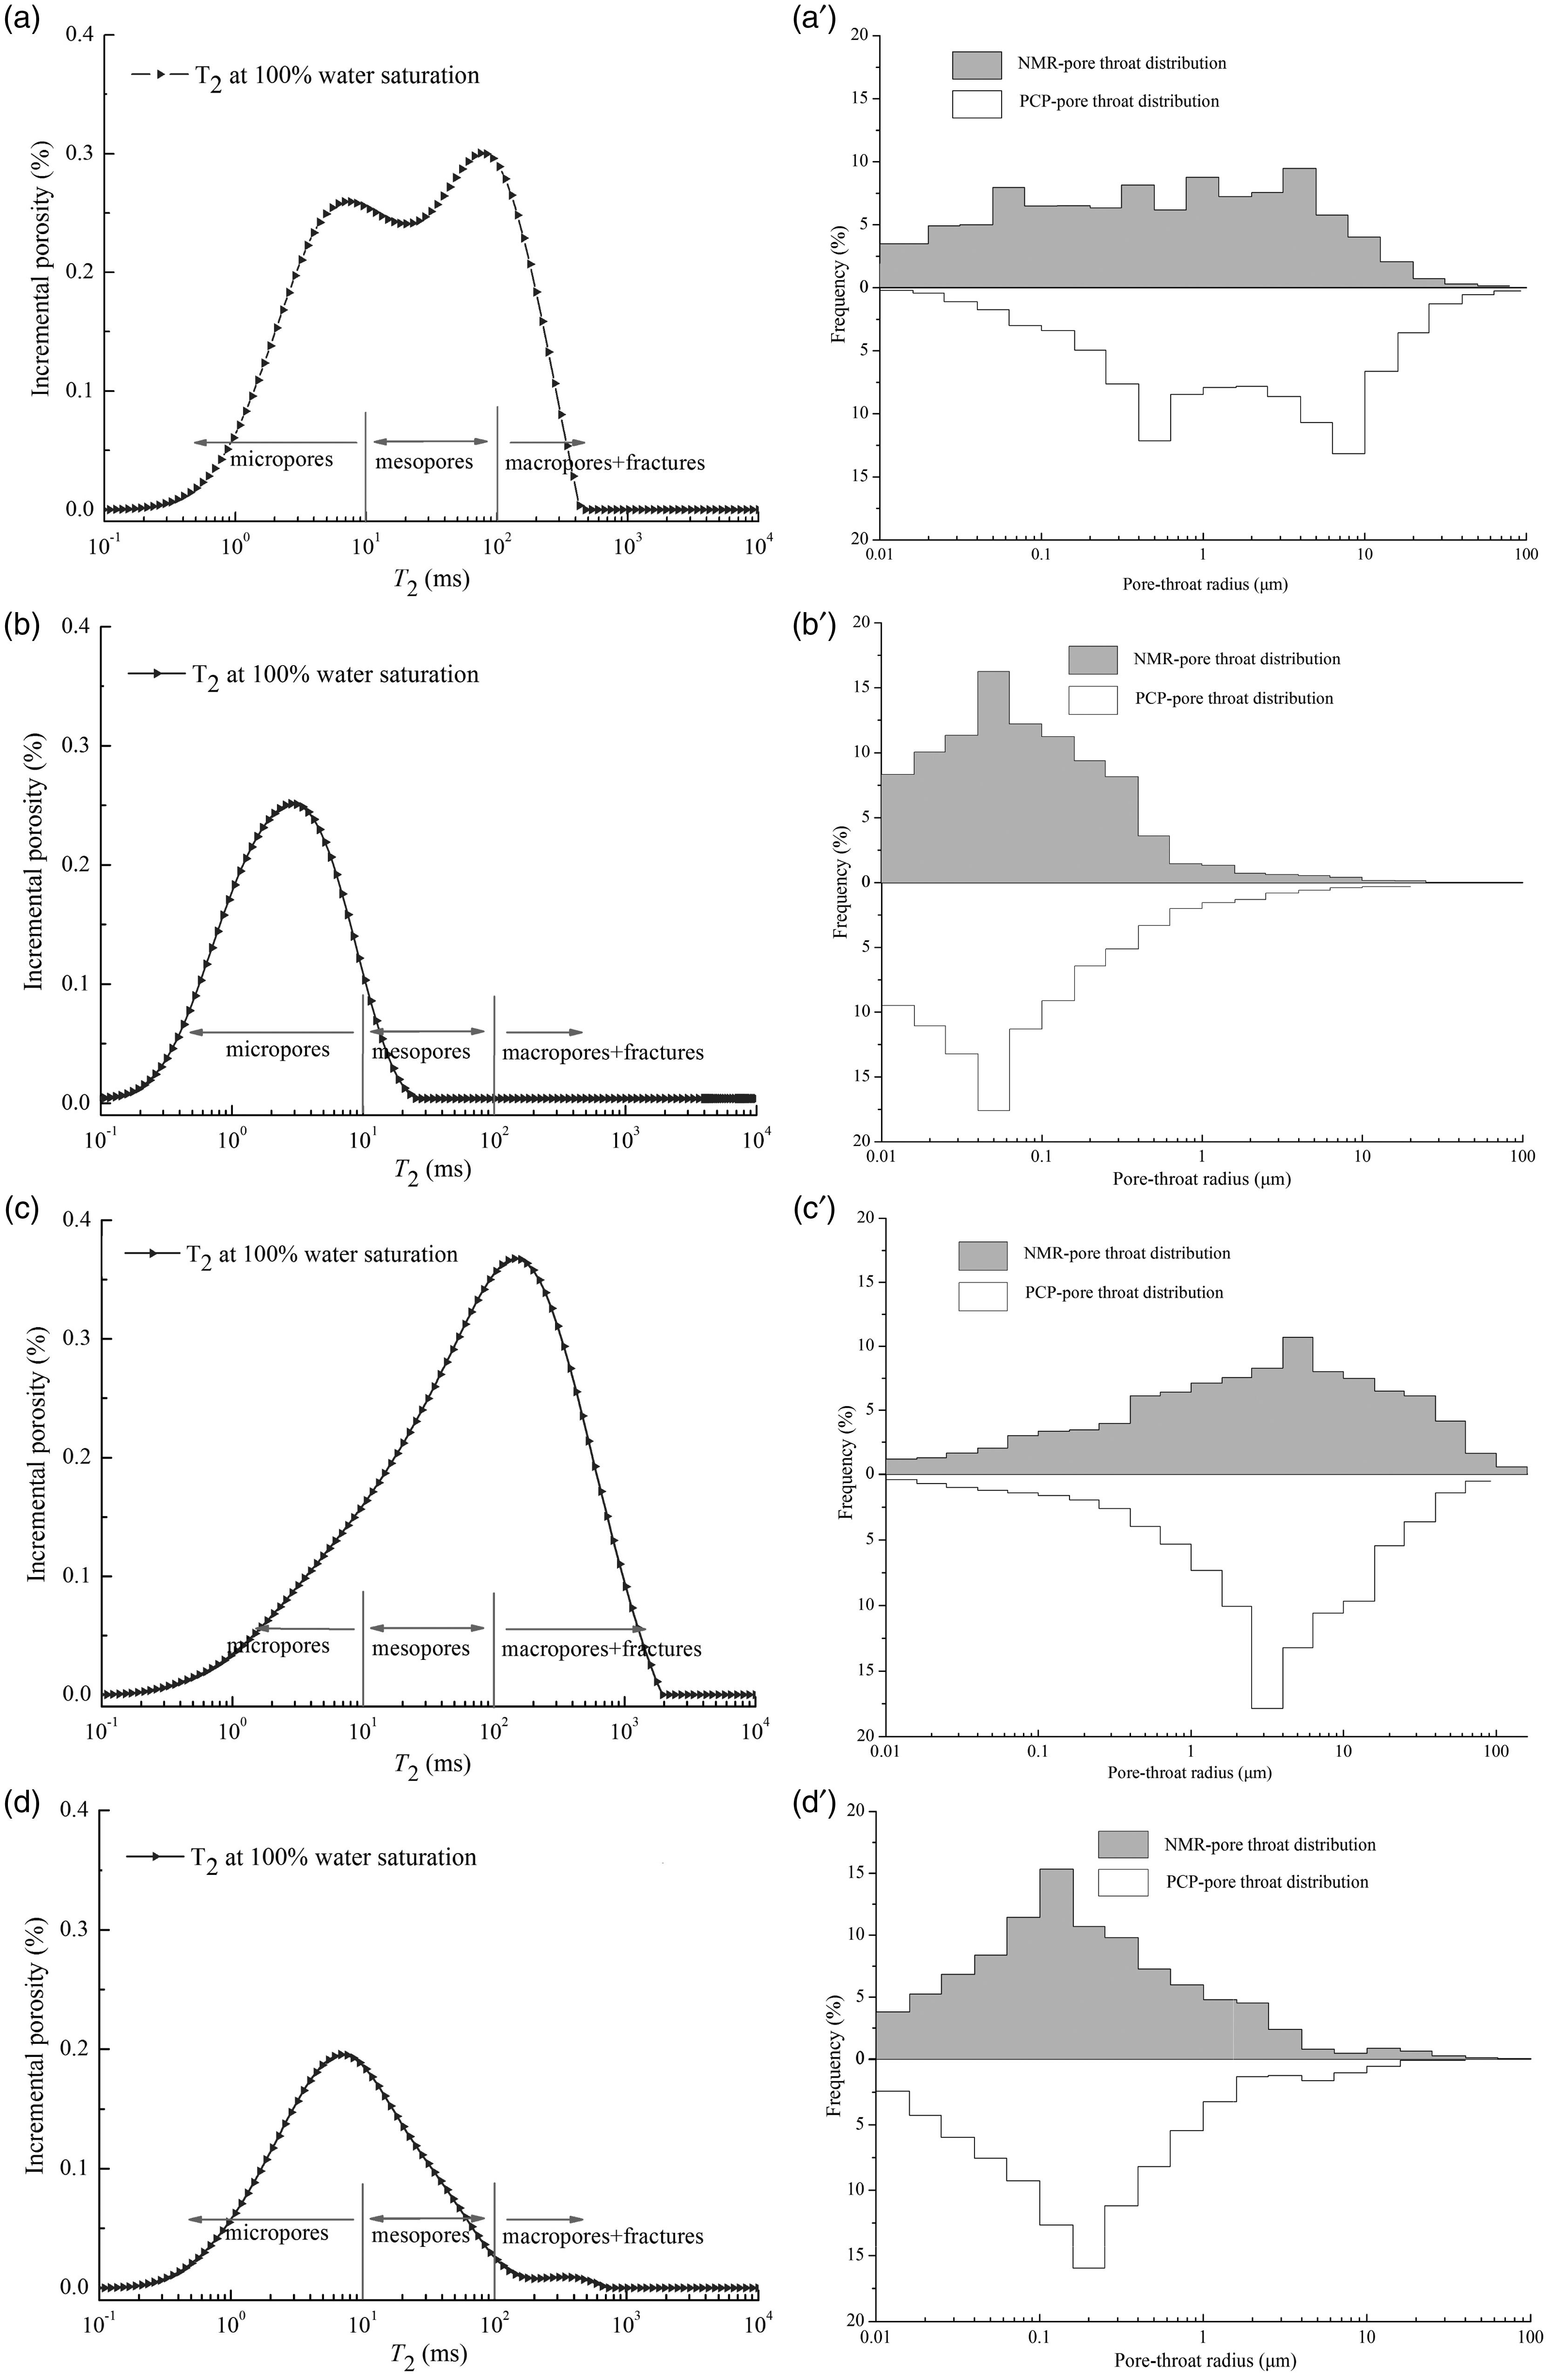
These can be found by above experiments comparison: generally, pore radius distributions of NMR correspond well with results from PCP (Figure 4). For sample 4 (Figure 4(b) and (b′)), the T2 spectrum distribution has a peak representing the micropores, and the percentages of micropores, mesopores and macropores by NMR (89.6%, 8.5% and 1.6%) and PCP (85.4%, 12.1% and 2.5%), respectively, which accords very well with pore throat structure characteristics obtained by CTS, LSCM and SEM. However, when there are larger pores (including micro fractures) of compared samples, PCP will exaggerate the proportion of macropores and fractures distributions, and underestimate the distribution of micropores. When comparing samples 2 and 6, it is evident that there are obvious overestimations of the percentages of macropores and fractures volumes (41.2% and 58.3%) by PCP compared with percentages of macropores and fractures volumes (15.7% and 43.1%) by NMR. It is because mercury intrusion in high pressure will expand macropores and fractures, while the micropores are compressed to close. Mercury saturation of tight samples is generally less than 90%, while the NMR technique can detect very small pores, therefore, comparison between T2 spectrum distribution of 100% water saturation and pore throat radius of less than 90% mercury saturation, conversion coefficient C values obtained will be inaccurate.
We can extract three kinds of parameters (S1, S2, S3) of porosity component percentages from T2 spectra distributions based on above classifications; therefore, S1, S2 and S3 represent porosity percentages of three components of the transverse relaxation time within the range of < 10, 10–100, >100 ms (Figure 5). According to relative proportions of S1, S2, S3, pore radius distributions of reservoirs can be divided into four different types. Using pore structure quality evaluation parameters, namely “PORCLA” parameters, pore structure characteristics of reservoirs can be quantitatively analyzed (Liu et al., 2009b; Wang et al., 2014).
Relationship among percentages of three pore components for nine samples.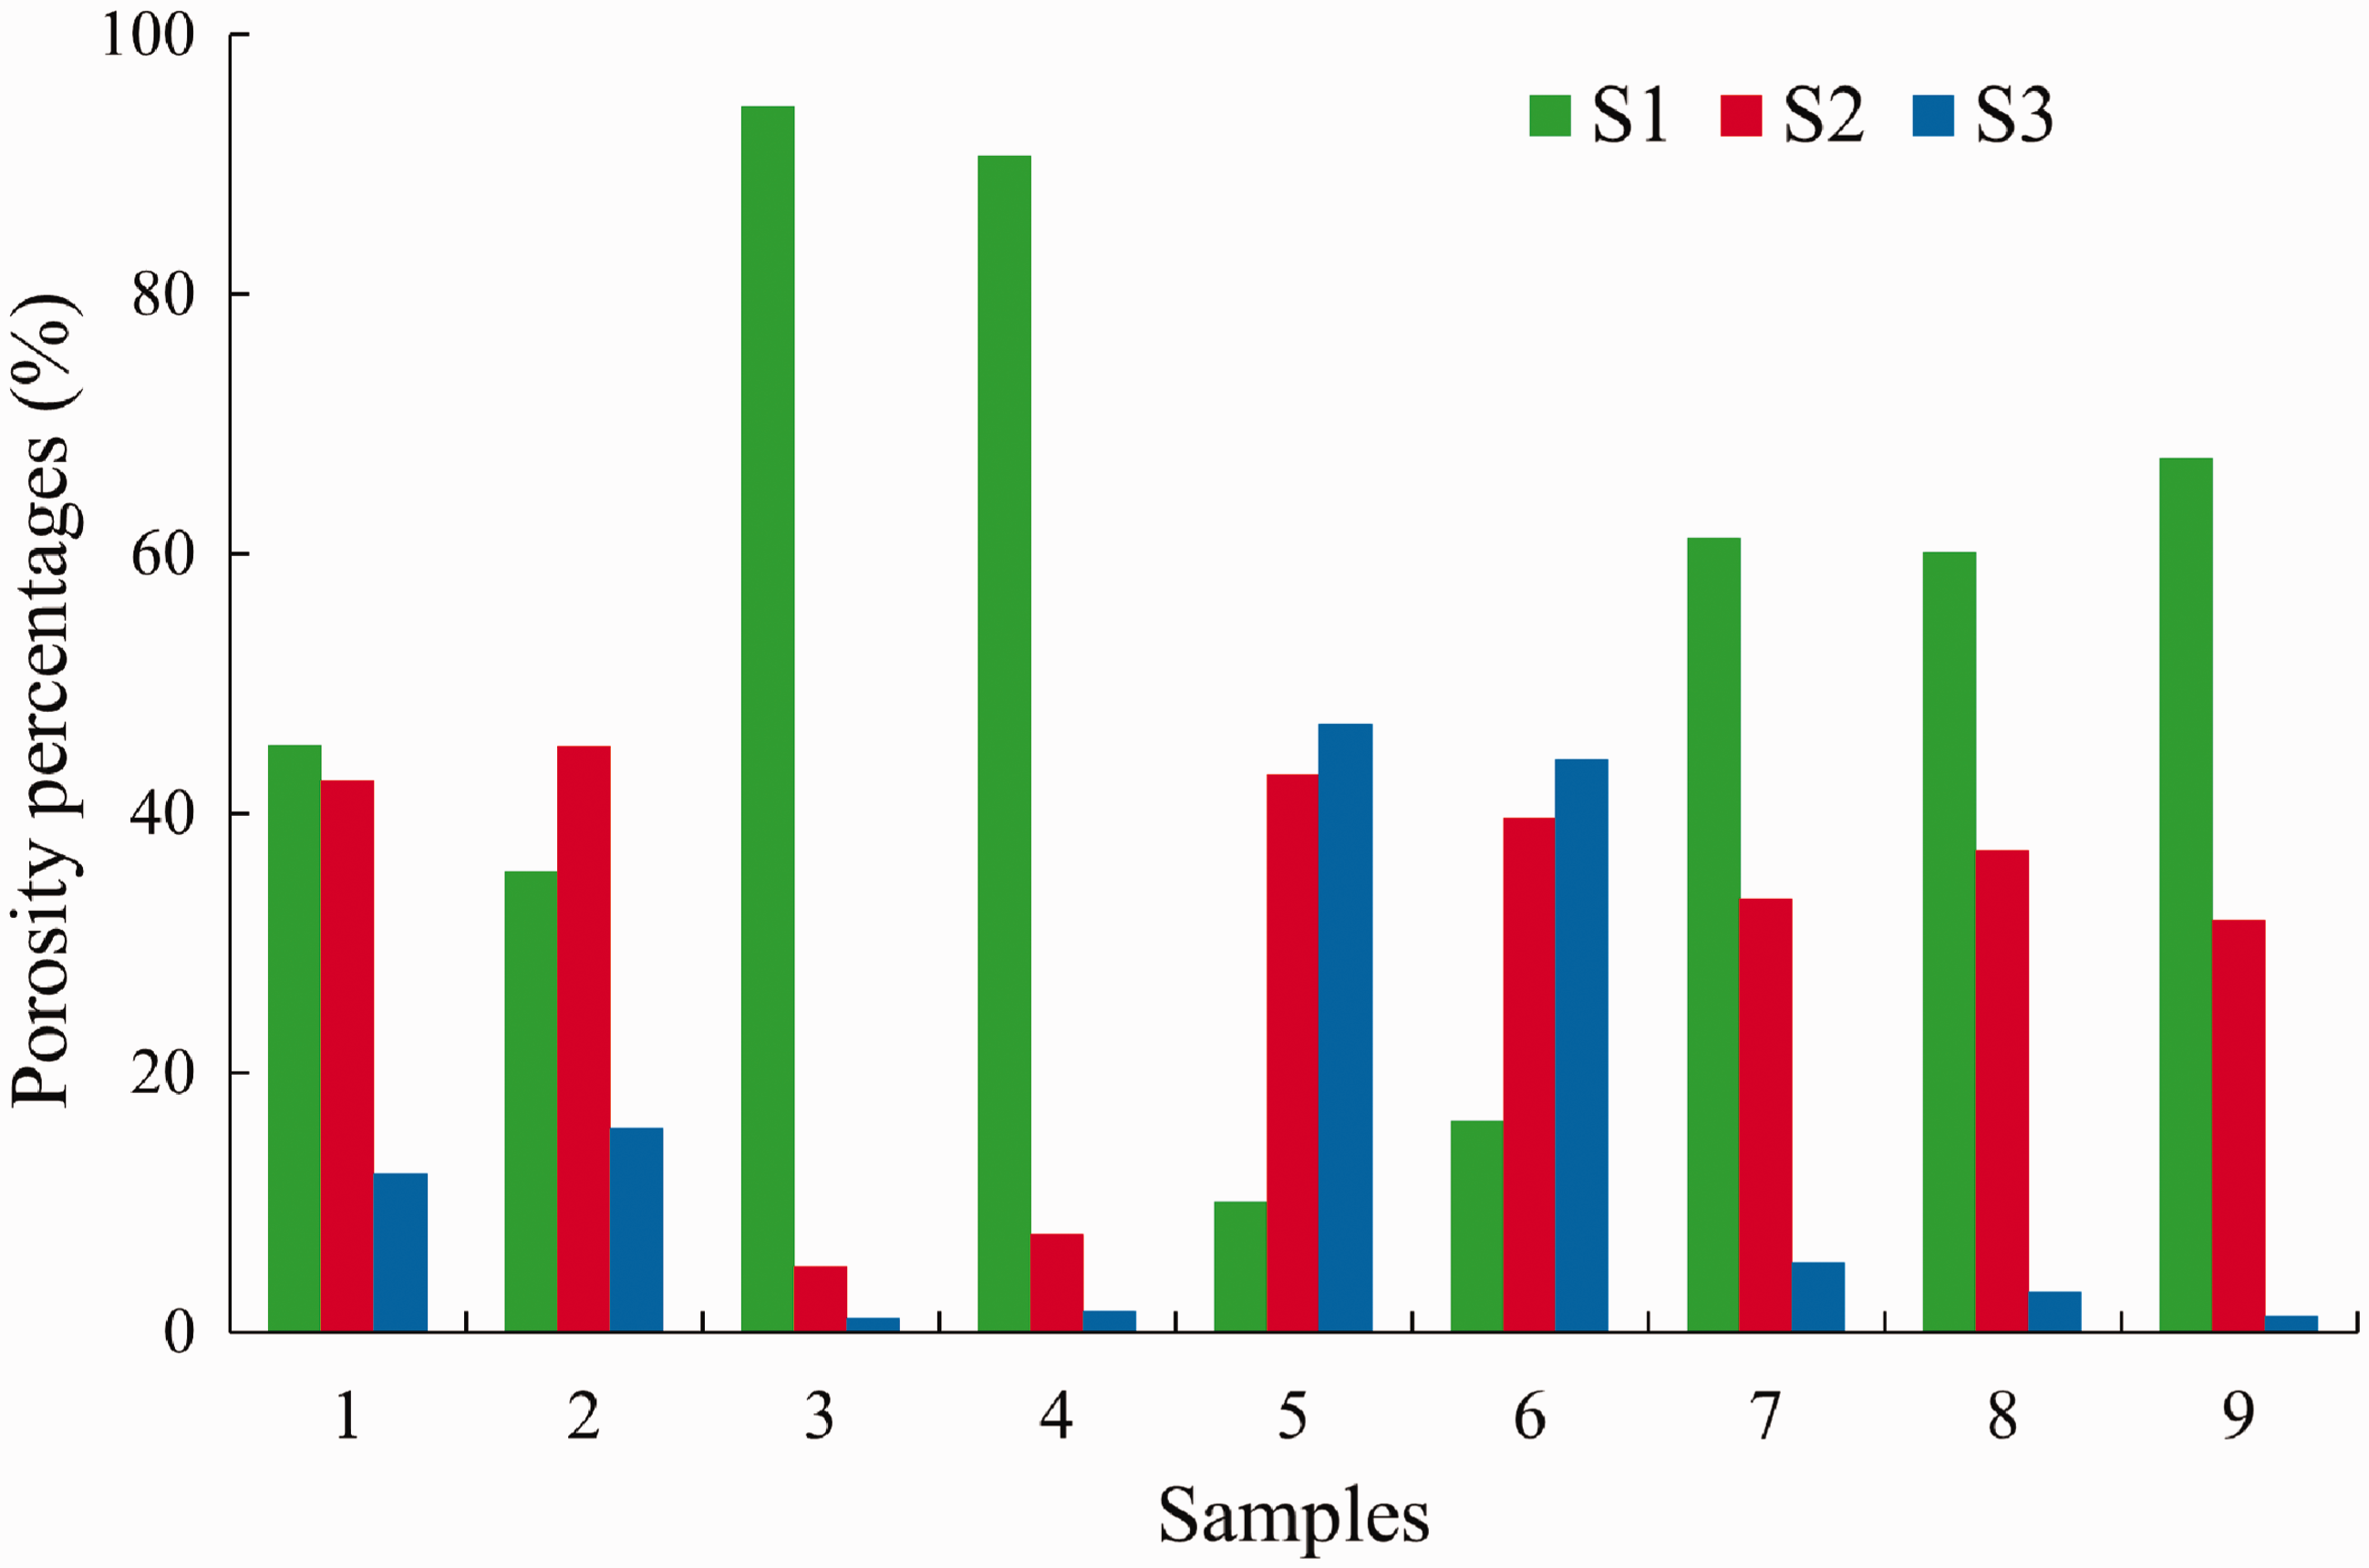
Evaluation on physical property parameters of reservoirs by NMR
T 2 cutoff values
T2 cutoff value (T2 c ) is relaxation time threshold that can divide the T2 spectrum into two parts: the area that is greater than T2 cutoff value is called free fluid pore volume and the area of less than T2 cutoff value is called bound fluid pore volume. The peak that is greater than T2 cutoff value is called free peak, and the peak of less than T2 cutoff value is called bound peak. The area ratio of free and bound peak is the ratio of free fluid index (FFI) and bound fluid index (BVI). The bounded water in storage pores has characteristic relaxation time T2 < T2 c , whereas the free water in seepage pores has T2 > T2 c .
An example (sample 1) for the T2
c
calculation method is illustrated in Figure 6 (Yao et al., 2010). First, there are two T2 distributions, one accords with 100% water saturation (Sw), and the other corresponds to irreducible water saturation (Sir). Then, these two T2 distributions are transformed into two accumulative T2 distributions based on the following rule: maximum cumulative porosity at Sw and Sir is equal to total porosity and BVI porosity, respectively. Finally, the T2 value of intersection points of extension cord of maximum cumulative porosity equilibrium value at Sir and maximum cumulative porosity at Sw. The T2
c
values of nine samples range between 3.08 ms and 52.45 ms; the average was 19.05 ms, which can be used as data analysis and well-logging modeling.
T2 cutoff value for sample 1 with the measurement at Sw and Sir.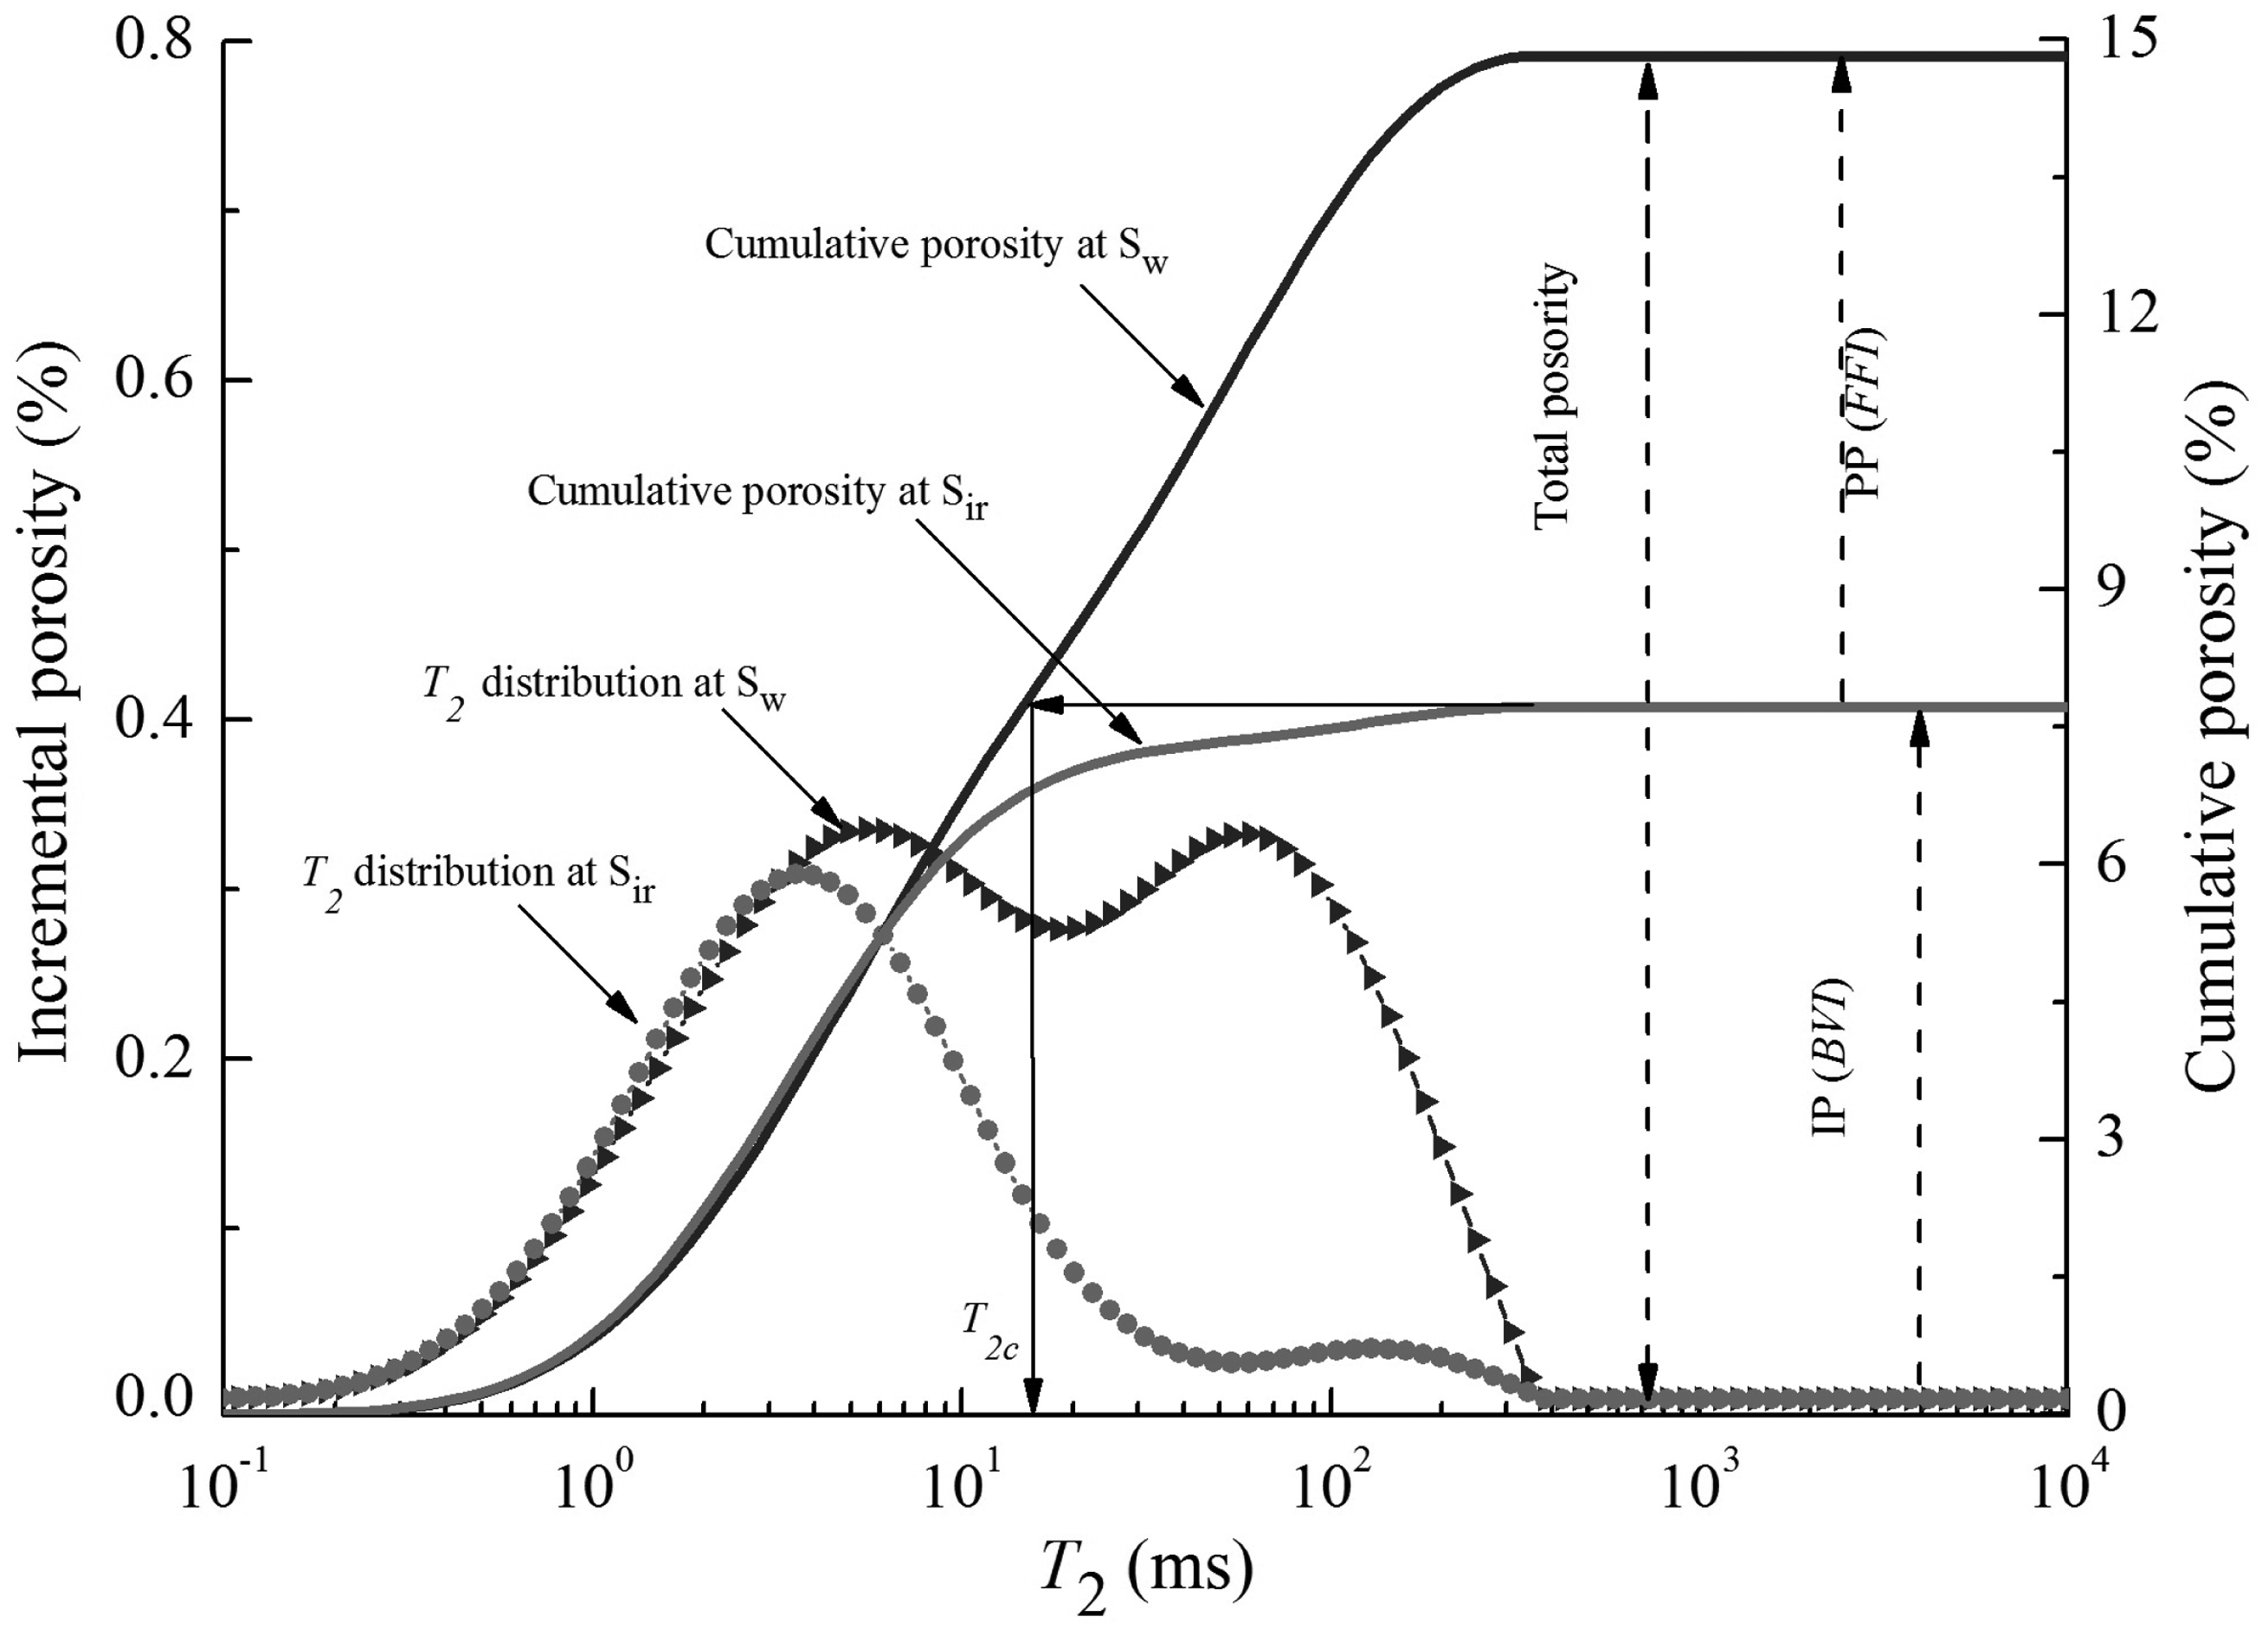
Porosity
NMR porosity of tight sandstone reservoirs is calculated by a model of the geometric mean of T2 (Peng et al., 2006; Straley et al., 1997). Figure 7 shows a correlation diagram of porosity between NMR method and the conventional method (Helium porosity and weighing porosity) of 16 samples. The correlation coefficient is 0.987 between NMR porosity and helium porosity by linear fitting. Weighing porosity and helium porosity can verify each other; the correlation coefficient is 0.995.
Comparison between NMR porosity, weighing porosity and Helium porosity. Linear relationships are observed between these methods with R2 = 0.995 and 0.987, respectively.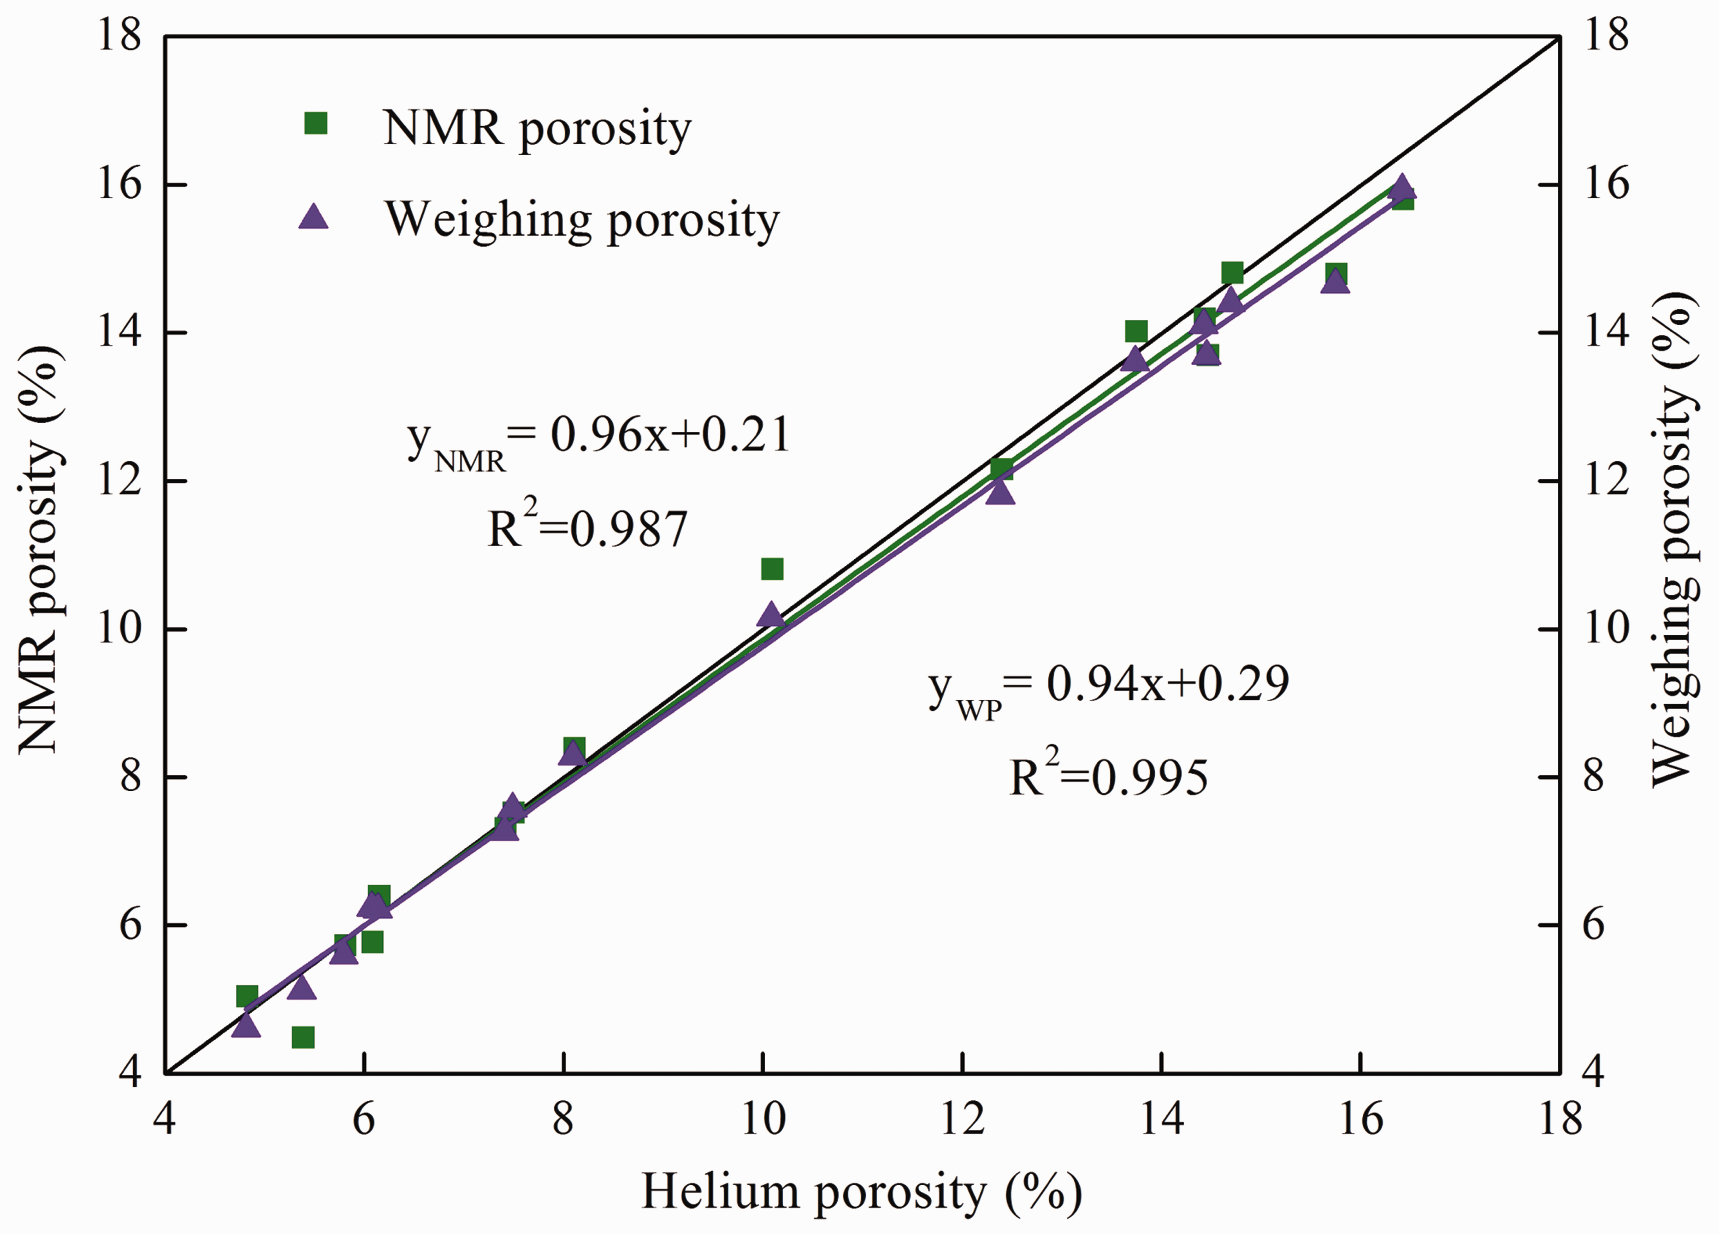
Figure 6 shows that pores are occupied by bound and free water. Theoretically, the pores storing bound water cannot be regarded as effective seepage pores and only as adsorption or storage pores, and these pores of free water can be regarded as effective seepage pores. Therefore, NMR porosity can be divided into irreducible porosity (IP) associated with bound water and producible porosity (PP) related to free water, which cannot achieve using the conventional method. Therefore, PP and IP can be got by Sw and Sir, mainly represented as follows


Porosity from NMR measurements, T2 c , and permeability by test, Coates, SDR and new PP models.
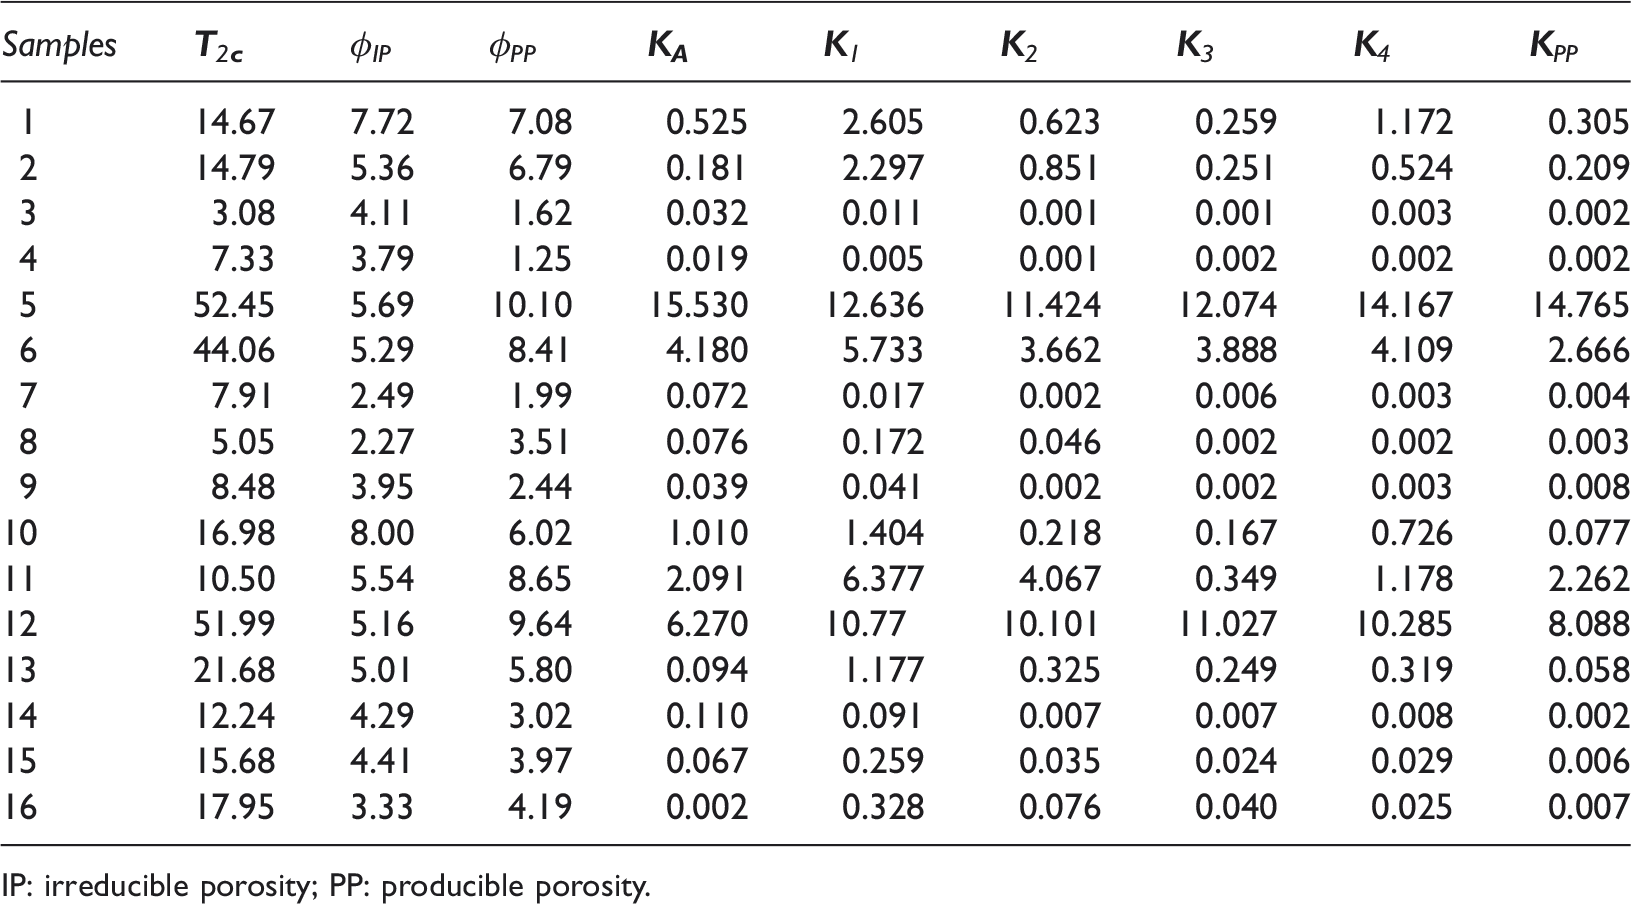
IP: irreducible porosity; PP: producible porosity.
Permeability
Permeability estimated by porosity and pore radius distribution is the important content. In tight sandstone reservoirs, two kinds of classical models and their extended models are usually applied to NMR well logging, which is based on the movable fluid model and the geometric average T2 spectrum model, respectively. In this article, several classical models are discussed, and according to the characteristics of the NMR spectral relaxation and previous researches, a new model is proposed to be suitable for studying permeability of tight sandstone reservoirs.
1. The free fluid models The free fluid model (also called Coates model) is based on the Timur–Coates equation (Jerosch-Herold and Thomann, 1994; Timur, 1969)
The improved free fluid model (called improved-Coates model) is also based on the Timur–Coates equation (Huang et al., 2004)
The mean T2 model (also called SDR model) can be formulated in several ways, which is a commonly used expression (Kleinberg et al., 1993; Skjetne et al., 1991; Westphal et al., 2005)
The improved mean T2 model (called improved-SDR model) can be expressed (Huang et al., 2004)


In tight sandstone reservoirs, good-connected macropores and fractures have main contributions to seepage. However, most pores are small-closed dead pores, bottle necking pores and dissolution pores that have poor connectivity. Therefore, based on clear understandings to pore structure characteristics of tight sandstone reservoirs, we get the new PP model using 


Although two classic models can predict the NMR permeability of tight sandstone reservoirs, there are still significant limitations compared to that of conventional reservoirs, which is due to the complexity of pore structures and seepage characteristics in tight sandstone reservoirs. By contrast, permeability by new PP model has the best correlation with air permeability mainly due to the concept of PP porosity is much better than the total porosity of the contribution to the permeability in tight sandstone reservoirs (Figure 8 and Table 3).
Comparison between NMR permeability and air permeability of five models (Coates model (red), y = 0.897x + 1.005; improved-Coates model (blue), y = 0.834x + 0.392; SDR model (orange), y = 0.894x + 0.088; improved-SDR model (dark yellow), y = 0.919x + 0.158; new PP model (green), y = 0.983x − 0.074) of 16 samples. Linear relationships are observed between these models with R2 = 0.799, 0.841, 0.836, 0.921 and 0.972, respectively.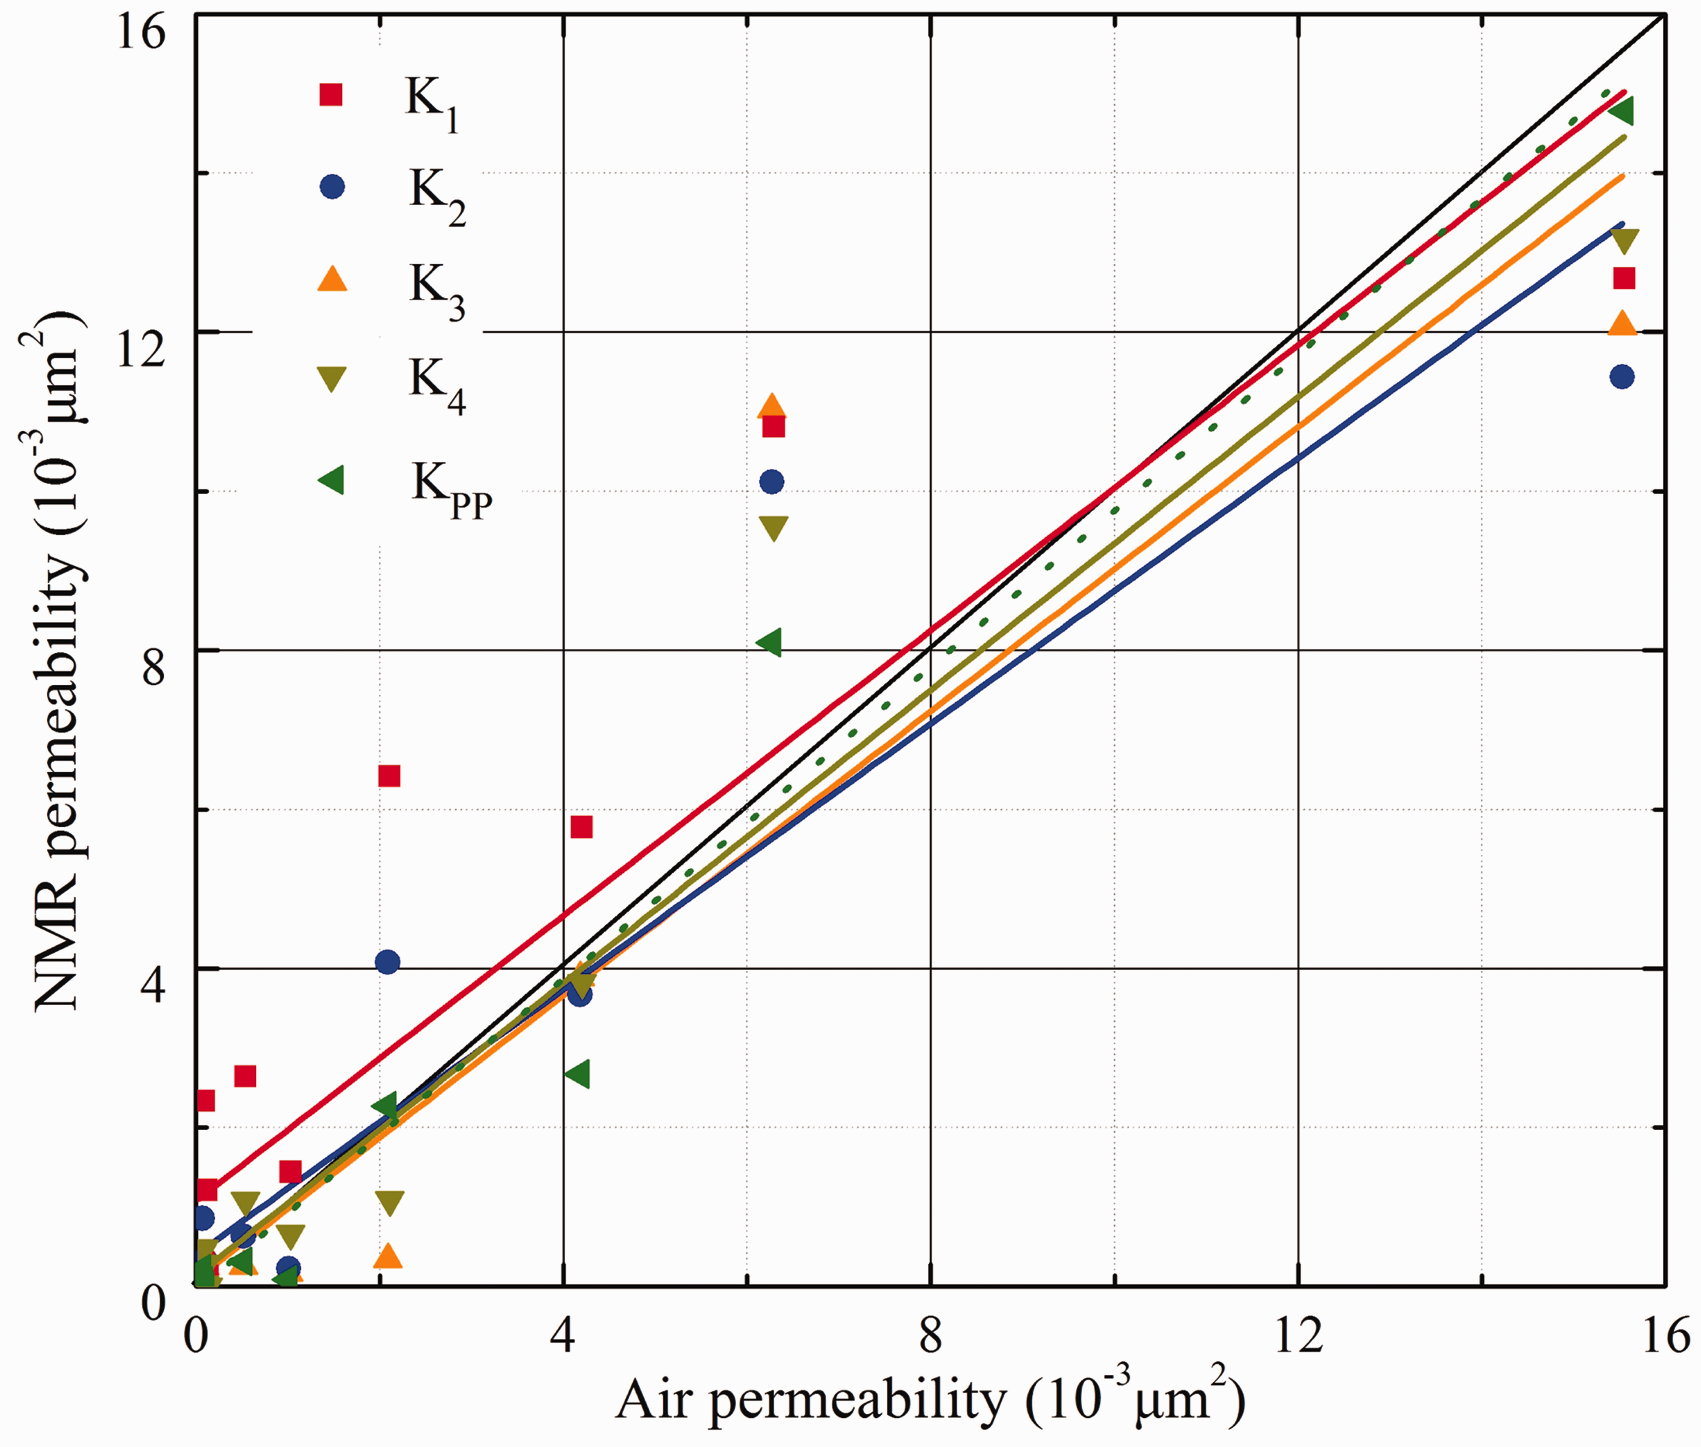
It is necessary to make errors analyses on estimated permeability of 16 samples by Coates, SDR, improved models and the new PP model (Figure 9). Obviously, the new model for the prediction of permeability is more accurate compared to classical models. Therefore, we can get several recognitions. Firstly, the previous classical models are built on some conventional reservoirs, with the continuous deepening studies, there are some limitations of these approaches for unconventional reservoirs. And then, there is a regional concept of Chinese continental heterogeneous reservoirs, it is necessary to establish a model being suitable for the different study areas. Finally, data accuracy of all experiments and combination of various methods are also important factors influencing accuracy of the model. However, there are many factors that impact these conclusions, such as experimental methods, experimental treatments and samples selection; therefore, it is necessary to ensure the reasonableness of each stage in scientific researches.
Errors analyses on estimated permeability of 16 samples by Coates, SDR and new PP models.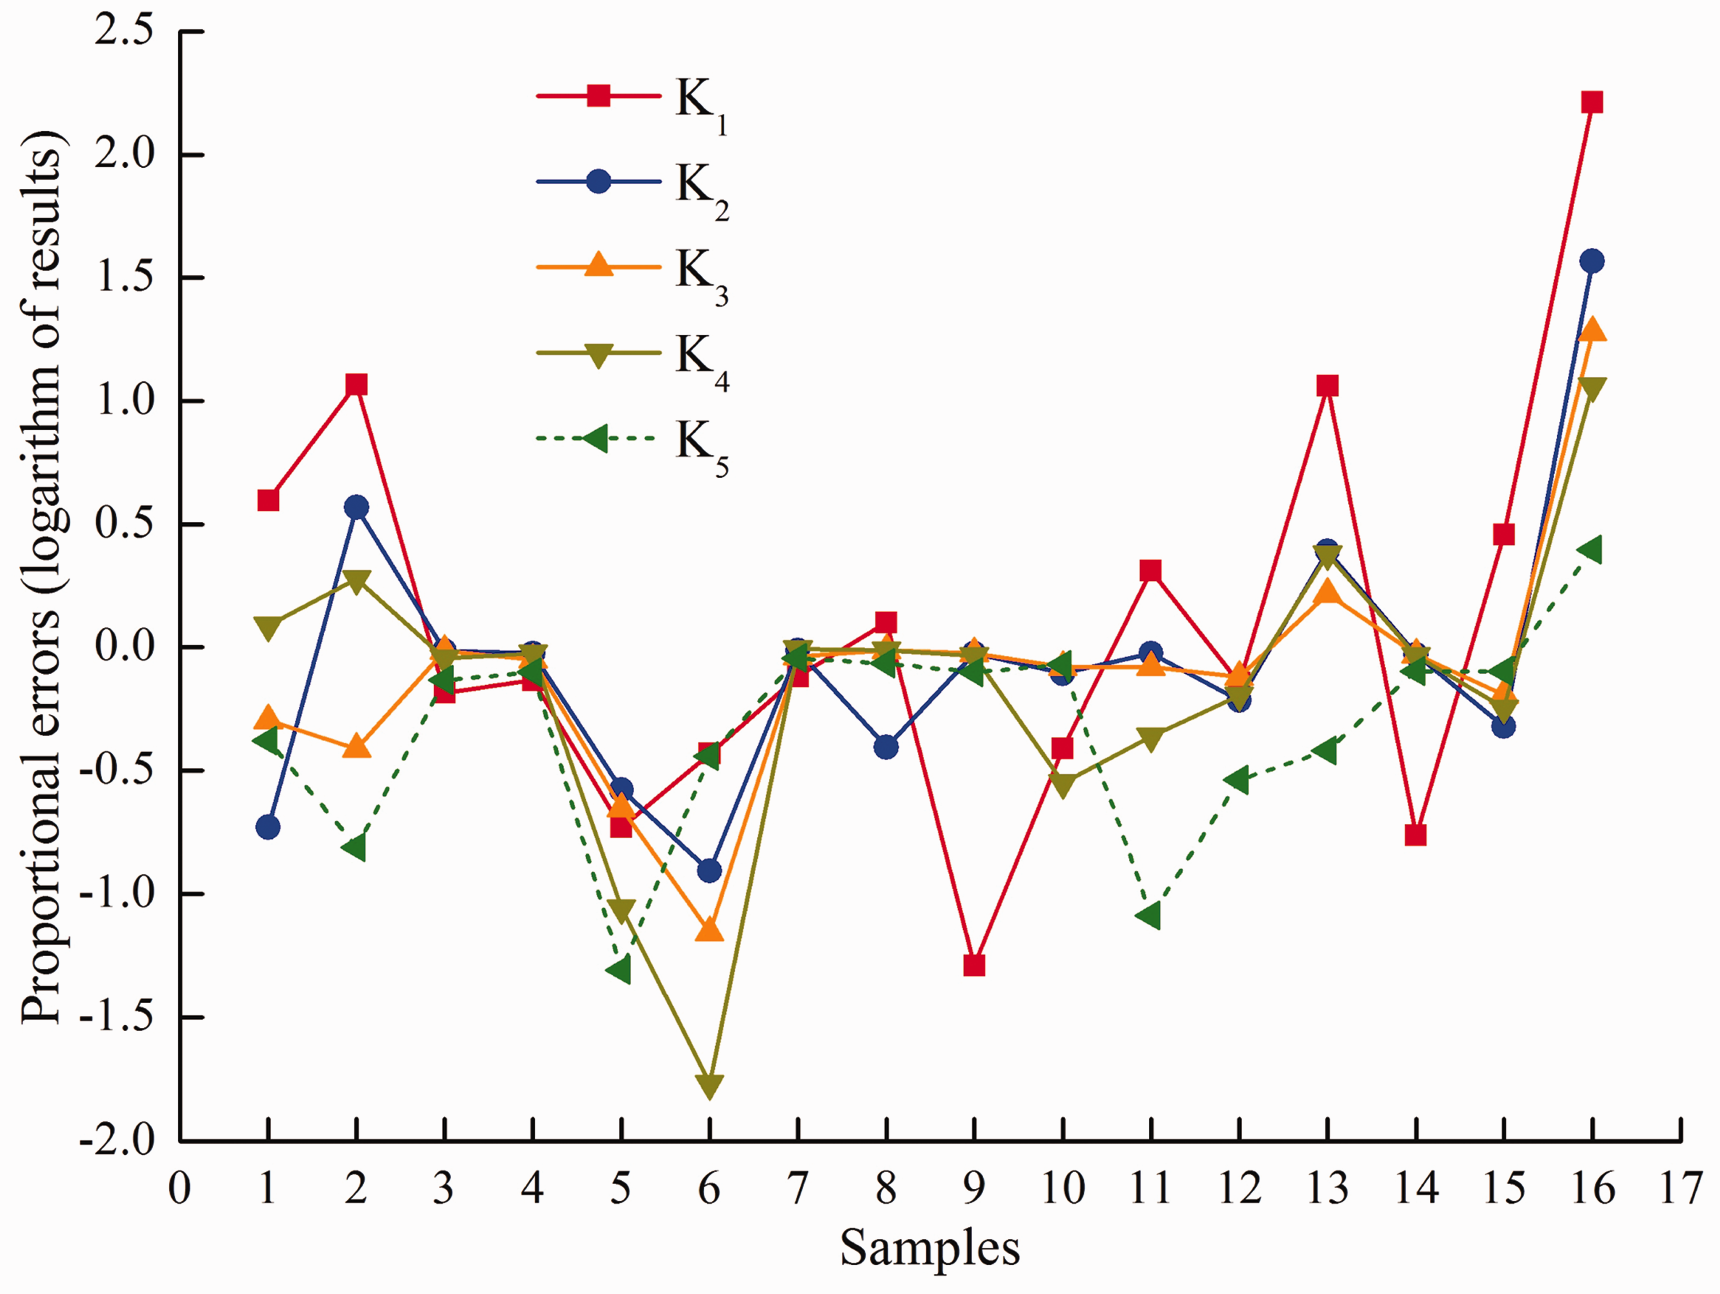
Conclusions
In this paper, low-field NMR, combined with CTS, LSCM, SEM and PCP, were applied to investigate the petrophysical characteristics of nine tight sandstone samples of Yanchang Formation in Upper Triassic Ordos Basin China. Based on above experimental studies and data analyses, we come to the following conclusions:
It has shown that pore types of samples can be classified into four categories through NMR T2 spectra distributions, these at 100% water saturation mainly show peaks in three different ranges corresponding with micropores (<0.2 µm) at 0.1–10 ms, mesopores (0.2–4.9 µm) at 10–100 ms and macropores and fractures (>4.9 µm) at >100 ms. Firstly, combined with CTS, LSCM and SEM, three pore types are qualitatively recognized: intergranular pores (intergranular primary pores and intergranular residual pores), intragranular dissolution pores (feldspar dissolution pores) and fractures (intergranular fractures and intragranular fractures). Then, pore radius distributions are quantitatively characterized by comparison of results of NMR and PCP, conclusions of them can be consistent, but there are also differences. Finally, we can analyze pore structure characteristics of tight sandstone reservoirs by combination of qualitative and quantitative experiments. Physical property parameters of tight sandstone reservoirs are evaluated by NMR. The total porosity, T2
c
, IP and PP values are estimated by T2 distribution at 100% water saturation and irreducible water saturation. In tight sandstone reservoirs, good-connected macropores and fractures have main contributions to seepage. However, most pores are small-closed dead pores, bottle necking pores and dissolution pores that have poor connectivity. Therefore, based on analyses of pore structure characteristics and classic models, a new PP permeability model is proposed by an exponential regression of air permeability and PP. This model provides significantly better permeability estimations for tight sandstone samples than the classic models (Coates, SDR and improved models) originally developed for conventional reservoirs. Through the above analyses, combined with CTS, LSCM, SEM and PCP, we propose a NMR-based pore structure model that efficiently estimates the pore radius distribution of tight sandstone reservoirs. Based on previous permeability estimated model, a new PP model is proposed to better predict permeability of tight sandstone reservoirs. The new experimental combination method and new model can evaluate accurately petrophysical characteristics of typical tight sandstone samples, which have great value for nuclear magnetic logging in the exploration and exploitation of tight reservoirs in the Ordos basin of China.
Footnotes
Declaration of conflicting interests
The author(s) declared no potential conflicts of interest with respect to the research, authorship, and/or publication of this article.
Funding
The author(s) received no financial support for the research, authorship, and/or publication of this article.