
Abstract
Lately, with the growth in energy consumption worldwide to support global efforts to improve the climate, developing nations have to take significant measures. Kingdom of Saudi Arabia (KSA) implemented meaningful policy actions towards promoting energy efficiency (EE) in several sectors, especially in the building sector, to be more sustainable. In this paper, various EE measures and solar energy prospects are investigated for the residential sector, in two locations in the middle region of the KSA. An energy performance analysis of pre-existing residential buildings with an overall design is performed using simulation programs. However, installing EE measures in the building envelope is important to achieve an efficient sector regarding its energy consumption. The findings showed that applying EE measures for the building envelope, walls, roof, and windows should be considered first that makes the energy conservation possible. In Riyadh, EE measures are responsible for reducing energy consumption by 27% for walls, 14% for roof, and 6% for window, and by 29%, 13%, and 6% for walls, roof, and windows, respectively, for Qassim. However, the most impactful EE solution was selecting a heating, ventilation, and air conditioning (HVAC) system with a high energy efficiency rate (EER), which can minimize the energy consumption by 33% and 32% for Riyadh and Qassim, respectively. The study's feasibility showed that the number of years needed to offset the initial investment for a proposed roof PV system exceeds the project's life, if the energy produced is exported to the grid at the official export tariff of 0.019 $/kWh. However, the simple payback time was 13.42 years if the energy produced is exported to the grid at a rate of 0.048 $/kWh, reflecting the project's economic feasibility.
Keywords
Introduction
Global warming has been a challenging task for society. The most fundamental initiative to reduce global warming is to conserve a substantial amount of energy uses globally. Some countries have been greatly affected due to global warming. For example, Buildings (residential, commercial, and governmental) in the Kingdom of Saudi Arabia (KSA) consume approximately 24 Mtoe of a total of 708.8 Mtoe of energy production and imports during 2018 (International Energy Agency (IEA), 2017). The kingdom has an annual rate of 1.54% of growth in population that is directly proportional to the annual rate of growth of energy intake (Alrashed and Asif, 2012). The rate of electricity intake in the residential sector was 48.1% of the total electrical energy consumption in the year 2017, as shown in Figure 1 (Saudi Electric Company Reports, 2017). Moreover, in 2018, the International Energy Agency (IEA) stated that the electrical energy use per capita in the KSA had expanded significantly. According to IEA, energy use raised from 7.2 MWh in 2006 to 10.2 MWh in 2018, with a rise of 41.7% over this period (International Energy Agency (IEA)). Such rapid increase requires an active infrastructure for expansion in all sectors, especially in the residential buildings. Furthermore, in the coming years, 2.32 million new residential buildings are estimated to be constructed to meet the demand of the rising population in the KSA. The rise in population contributes to increasing the energy consumption rate in the coming years (Alrashed and Asif, 2012).
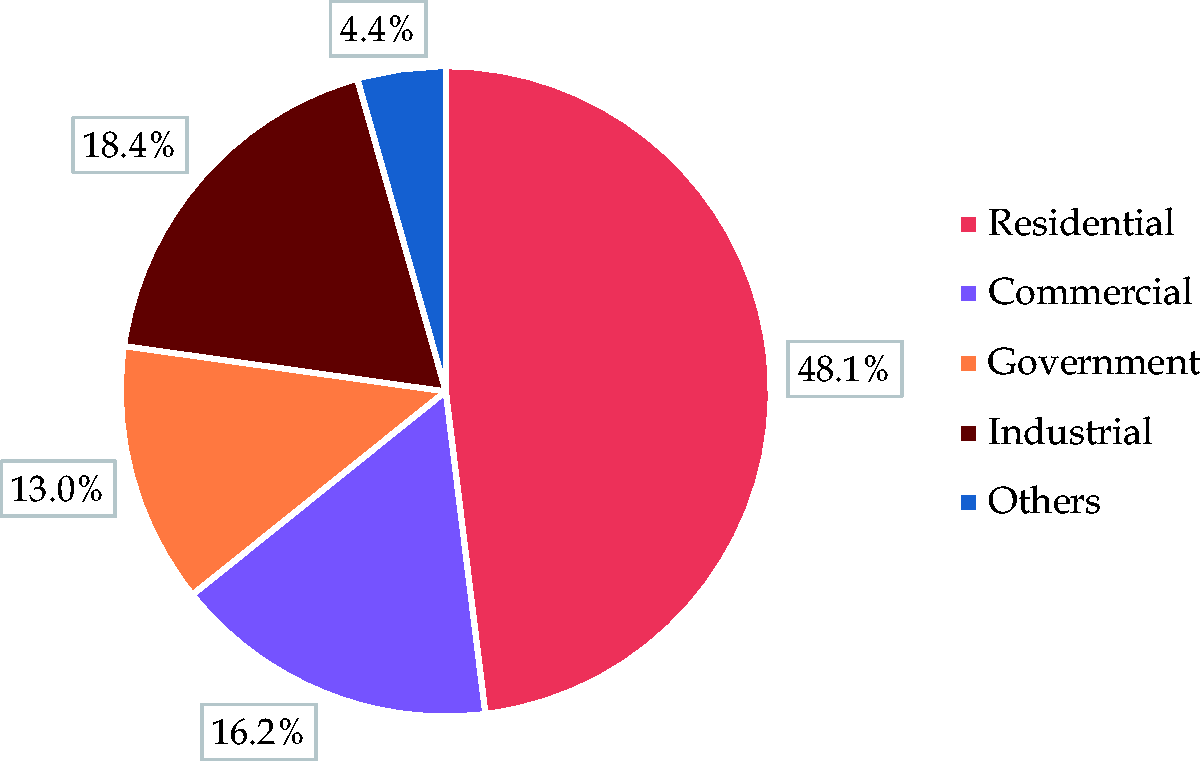
Total electrical energy intake per sector in KSA in 2017 (Saudi Electric Company Reports, 2017).
In April 2016, the government in the KSA had launched an aspiring model which is called “Saudi 2030 Vision”. This model mainly contributes to minimize the dependence on oil, diversify the economy, and improve public service sectors. In terms of the buildings sector, Saudi 2030 Vision focuses on achieving development and environmental sustainability (Vision 2030, n.d.).
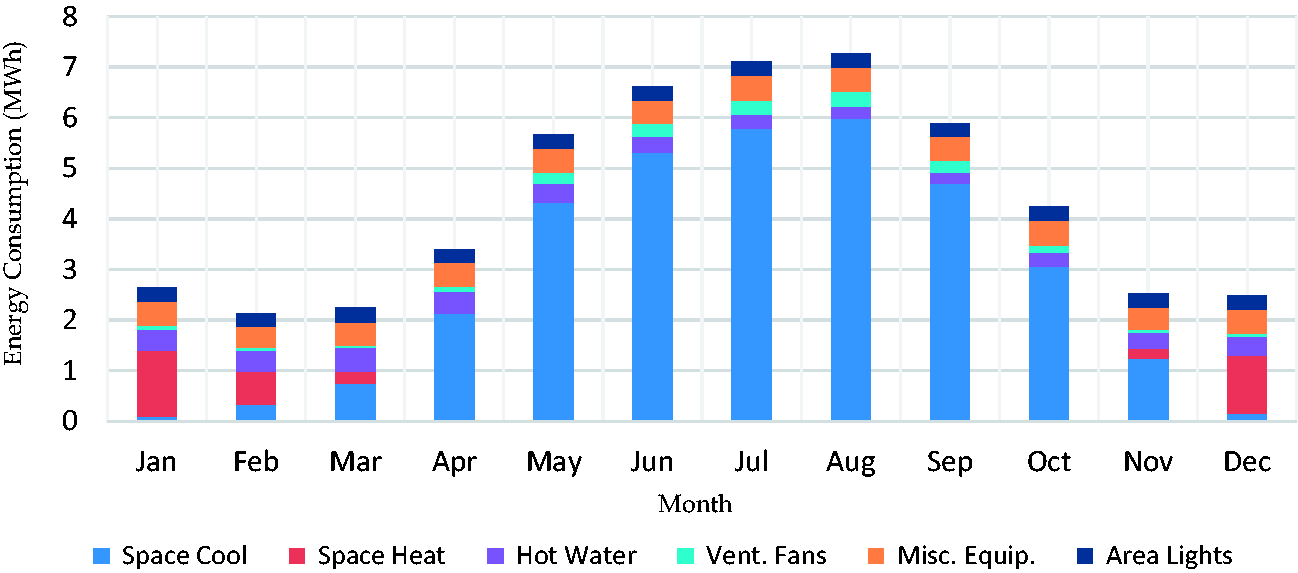
The Saudi policy aims to drive and control the country’s massive demands for construction projects (residential, commercial, etc.) to reduce reliance on oil revenues. Moreover, an initiative program launched by the KSA’s government in 2017, that aims to provide housing for citizens to accomplish the goals of the 2030 housing program. This program provided more than 300,000 housing products in 2019 alone which highlights significant growth in the residential sector (Housing, n.d.). Likewise, Saudi Energy Efficiency Center (SEEC, n.d.) published a report in 2018. This report claims that over than 70% of existing residential buildings do not have thermal insulation. This deficiency is responsible for the high energy consumption used in cooling equipment by about 250 million barrels of oil during the past five years (SEEC, 2019). Since residential electricity consumption in the KSA depends heavily on seasonal and daily temperature profiles as shown in Figure 2. So, the country would require a substantial amount of capital investment to expand the capacity for electrical generation to meet full demand at peak hours. Furthermore, the King Abdullah Petroleum Studies and Research Center (KAPSARC) conducted a study regarding existing residential building stock in the KSA, according to this study, a 27% reduction in electricity consumption would be possible when Energy efficiency (EE) initiatives are implemented. This study depicts savings of up to 10,000 GWh per year and 7.6 million tons of carbon emissions eliminated (Dubey et al., 2016).
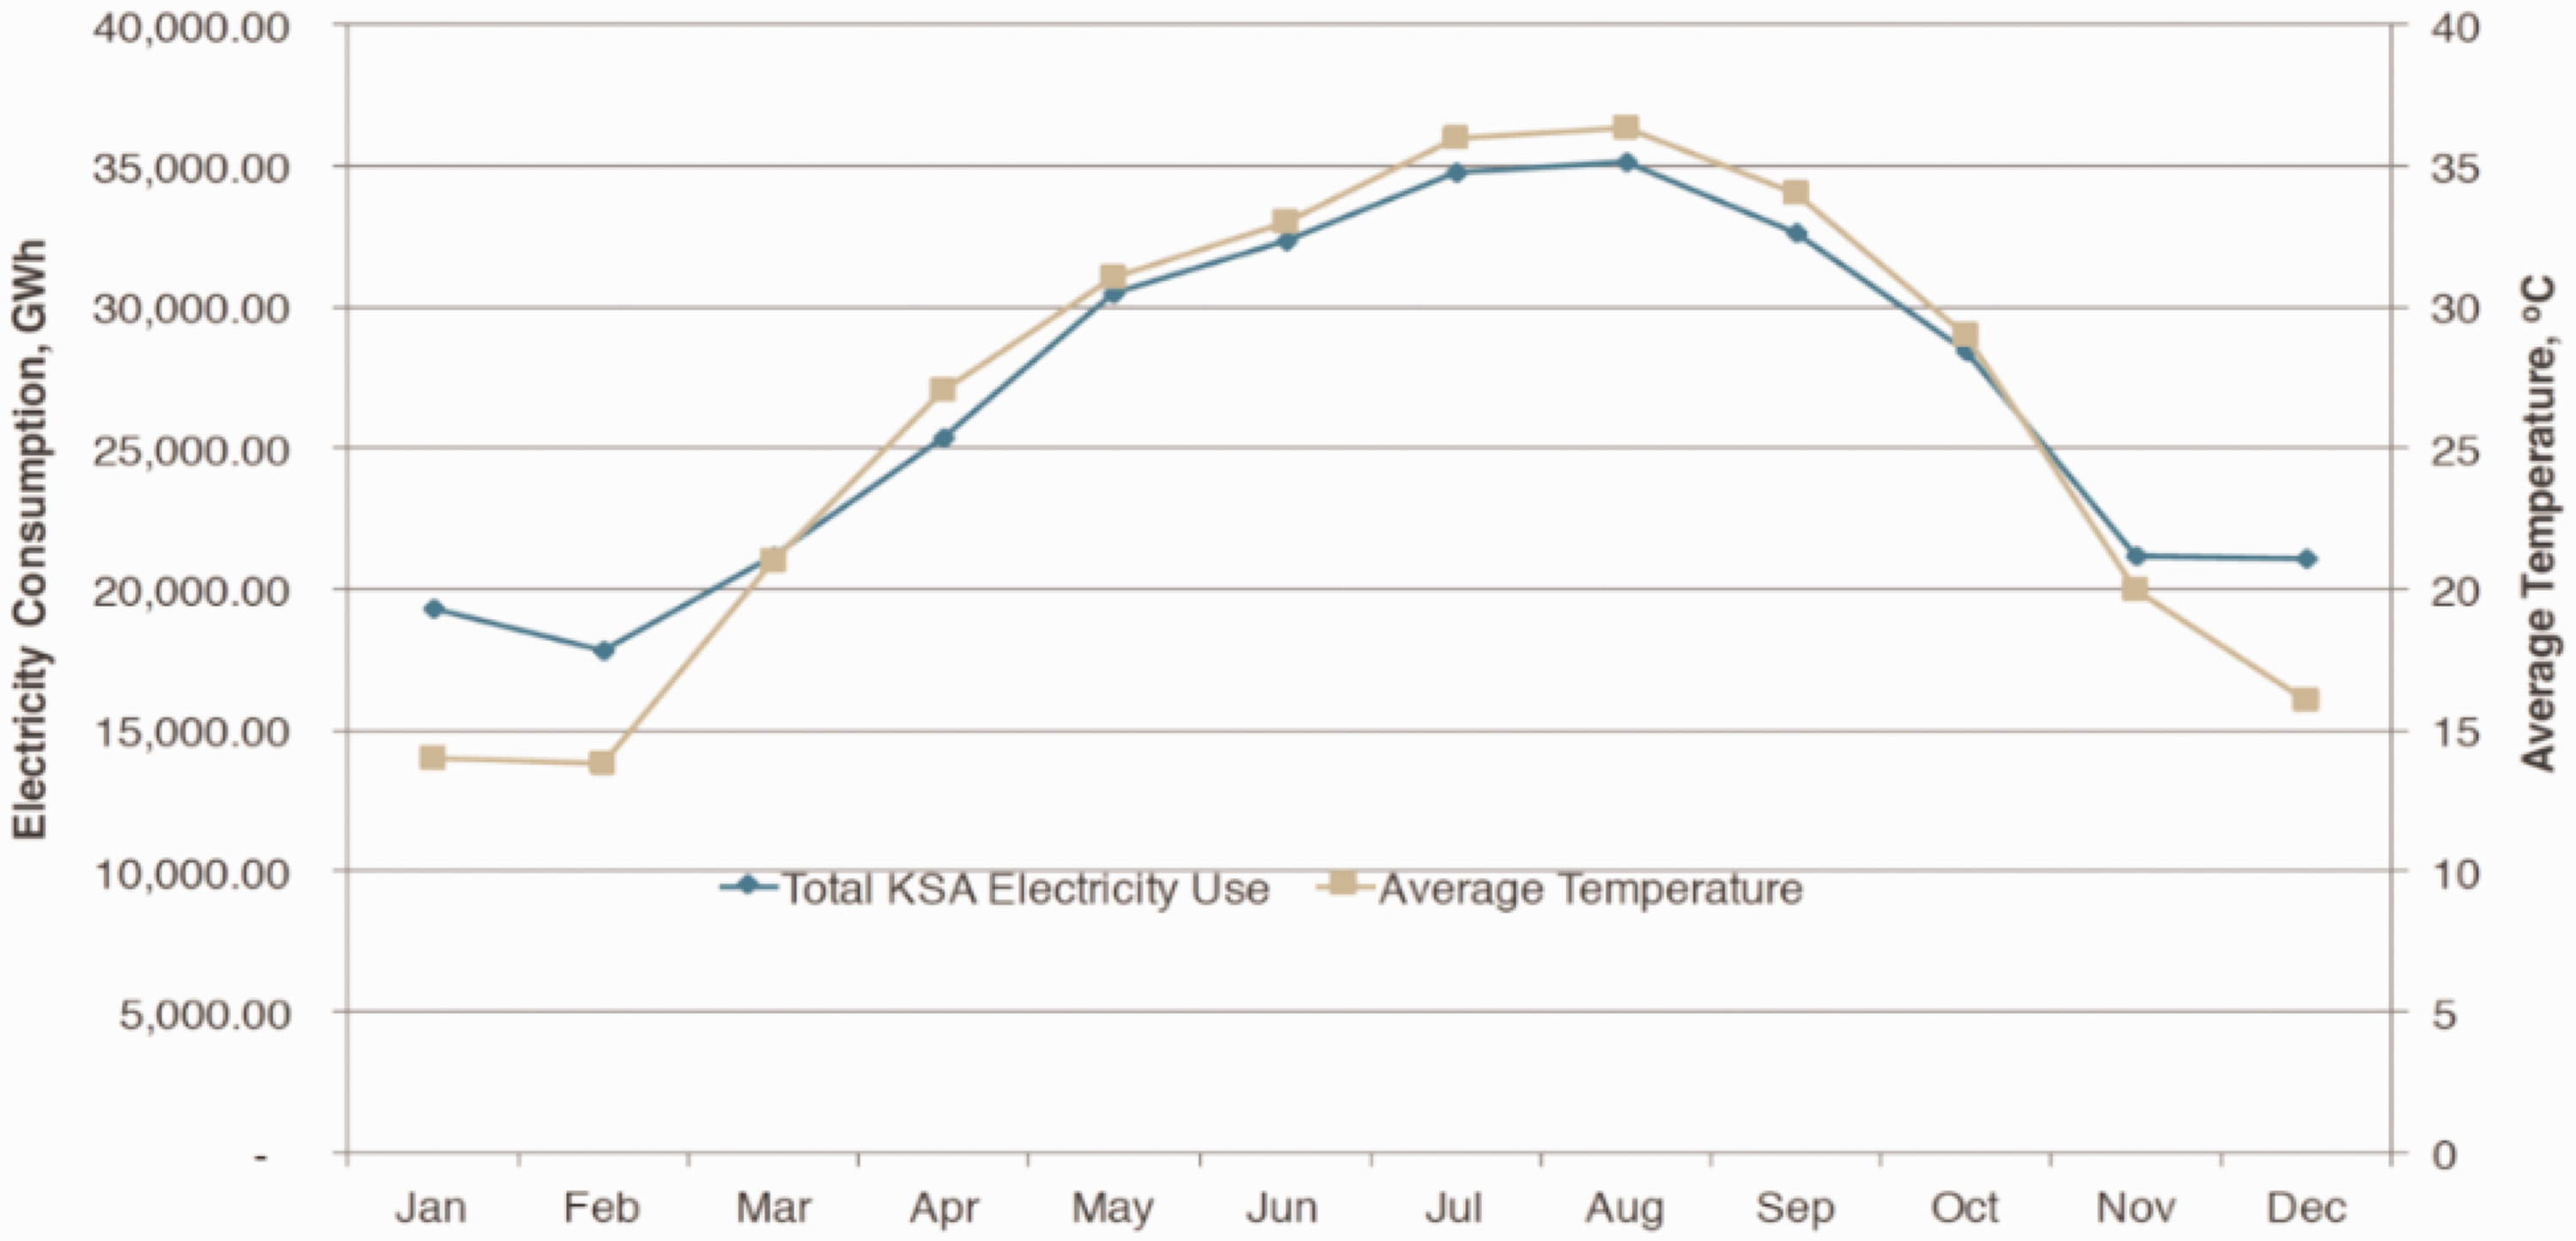
Total monthly electricity consumption of the KSA and average ambient temperature throughout 2014 (Saudi Electric Company Reports, 2017).
In KSA, buildings have very high energy consumption rates. Therefore, the government decided to introduce such initiatives that minimize energy consumption in all sectors. Consequently, a new building code was approved to be implemented in January 2017. This initiative considered as a mandatory requirement for the residential buildings starting August 2020 (Committee, SBCN, n.d.). However, current buildings are the main reason for the current energy consumption rate. So, this problem will stay until retrofitting is implemented. Moreover, multiple studies highlight the significance of an early-stage design process based on a model approach. This approach offers worthwhile and time-saving assistance for decision-makers by analyzing a variety of designs. To support the above study, (Schade et al., 2009) proposed that early model-based design can have an impact on the energy performance of a building. The estimation of the thermal performance and the energy consumption for residential buildings with accuracy has great importance (Liu et al., 2019) and (Al-Addous and Albatayneh, 2020).
The residential buildings in KSA have relatively high energy consumption. To achieve controlled energy consumption in the residential sector, EE measures implementation on the building envelope is of utmost importance. This study contributes to evaluate the impact of various measures on the building envelope’s elements and other EE measures. It also aims to estimate the implementation of solar energy applications on energy consumption by utilizing a model-based design.
Literature review
In the KSA, multiple studies reported that examined the proper thickness and position of thermal insulation in building envelopes. Likewise, the thickness of wall thermal insulation in three dimensions, 5 cm, 7.5 cm, and 10 cm examined in Riyadh (Saleh, 1990). Moreover, this study also contributes to measuring the effect on the interior temperature in a hot-arid climate concerning selected thermal dimensions and performance. The study concludes a substantial enhancement affiliated with the thermal insulation installed on the outer side of the building envelope. Furthermore, in the KSA, the structure of the most common and typical wall is hollow bricks with internal and external plaster. However, to reduce cooling load walls are layered with 20 cm stone, 20 cm concrete, 5 cm air gap, 10 cm brick, and 3 cm plaster. This composition has significantly improved the thermal resistance of the building’s walls (Ahmad, 2002). (Alaidroos and Krarti, 2015) simulated a KSA study by applying optimum energy performance measures based on energy savings and life cycle cost (LCC). This study analyzed a residential building in all climate regions using the Energy Plus software. The findings disclosed that a governmental subsidy savings of up to 36% could be attained.
Likewise, (Abdelrahman and Ahmad, 1991) investigated both clay brick walls and hollow concrete block walls. The study aims to identify polyurethane boards and expanded polystyrene boards. They directed that the insulation materials for buildings in the KSA involving types, cost, and availability. So, the findings indicated that clay bricks walls require shorter insulation thickness. They also proposed that the insulation layer should be placed on the outside of the walls.
Besides, Al-Sanea proposed analysis and comparison of roof components' thermal performance in KSA (Al-Sanea, 2002). The research relies on various features, including temperature variations, solar radiation, and non-linear radiation exchange. The study compares six traditional roof structures and their thermal properties. The findings indicated a 32% decrease in the average daily load when using a 5 cm molded polystyrene and a 27% decrease for extruded polystyrene. Similarly, (Al-Shaalan et al., 2014) introduced guidelines in buildings located in the KSA. The study mainly suggests implying those construction types and external color that minimize the thermal resistance.
Nonetheless, simple window shading can reduce the Building’s cooling load effectively. A minimize cooling load can be attributed by implementing shade with improved glazing for windows. Thus this initiative reduces the size of the mechanical air-condition (A/C) appliance (St Clair, 2009). However, shading can be achieved in various ways and results in energy savings ranging from 10 to 40% (Al-Shaalan et al., 2014) and (Hou et al., 2020).
Moreover, (Aldawoud, 2013) analyzed the implementation of window glazing and shading to improve energy efficiency (EE). The research ensures the inhibition of undesirable solar heat gains in KSA’s climate. This study used Design-Builder software to create a typical building model in Dammam by defining all the structure envelopes (lighting, heating, air conditioning, weather data, etc.). They emphasized that overhang shading was the optimum goal shading strategy to reduce cooling load during the summer season. Another way of avoiding undesirable solar heat gains is by integrating the building envelope with green plants that have the potential to save a considerable amount of energy (Tan et al., 2020).
Likewise, (Aldossary et al., 2014) analyzed various domestic energy consumption patterns in Jeddah city. In this study, six selected families’ residential buildings were selected to estimate an annual energy simulation using IES-VE software. The whole study surrounds the energy consumption pattern centering on building design and its occupants’ behavior. In this research findings, retrofitting solutions minimize the energy intake at a range from 21 to 37% when operating a shading instrument, double-glazing window, and an onsite photovoltaic (PV) system. Another study about optimum window overhangs for a residential building was carried out by (Alaidroos and Krarti, 2015) in five KSA cities. They proposed that energy can be preserved by introducing window overhang projections of 10 cm to 100 cm. For instance, adding 50 cm overhang projections conserve 3.6% energy in Dhahran, while the same overhang projection conserves energy by 5% in Riyadh. Similarly, energy conservation can go up to 6% for 100 cm projections.
(Aldossary et al., 2017) estimated the energy consumption patterns in three apartments and three villas. They compared their results with electricity bills to evaluate the electricity consumption rate in Riyadh. In this study, they find out the main reasons for the high residential energy demand. However, excessive cooling consumption and scarcity of optimum architectural design are the main reasons. They estimated up to 71.6% reduction in energy consumption when the energy intake patterns of three low-carbon prototype residential buildings were analyzed. Furthermore, (Al-Homoud, 1997) conducted a study in different climatic regions of KSA and the United States of America (USA). He investigates the optimization model for residential design to achieve an optimal A/C design. Findings showed significant energy conservation by optimizing the wall and roof insulation and window glazing. In Dhahran, KSA, (Ahmad, 2004) simulated the effects of building envelope materials on the cooling load. He analyzed that cooling load was distributed at 57%, 22%, and 17% for walls and roofs, infiltration, and glazing respectively. In addition, it can go up to 4% for other methods.
Similarly, (Ahmed et al., 2019) indicated that the energy use intensity (EUI) of a villa could be reduced from 148.8 to 72.5 kWh/m2 year, corresponding to 51.3% less than the existing conventional residential building in the KSA. They also proposed the most impactful EE solutions like installing envelope insulation and selecting a high coefficient of performance (COP) of an HVAC system, reducing energy intake by 20% and 35%.
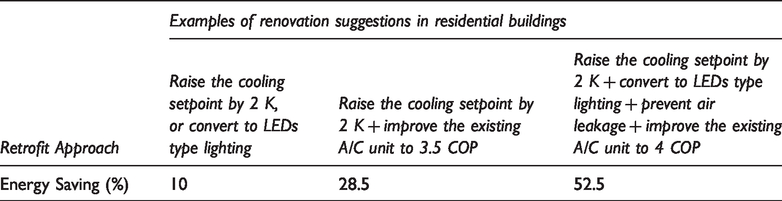
In January 2020, a recent study conducted by (Krarti et al., 2020) analyzed that 50% annual electricity reduction for the KSA residential sector can be attained by implementing ideal retrofit programs. Moreover, (Krarti et al., 2017) used building energy productivity for a renovation program for different scenarios in the KSA. They founded that the EE systems have considerable ability to reduce energy consumption and peak demand by 27% and 30%, respectively. The impacts of the suggested renovations approach can be found in Table 1.
Results of the building renovation program, data from 2014–2016, for the KSA (Krarti et al., 2017).
Several studies showed that the optimum range of comfortable home temperature lies between 18°C and 24°C (BBC News Magazine, n.d.). Regarding home temperature controls, (Krarti, 2020) evaluated the potential and the advantages of use-based temperature controls in residential buildings in the KSA They proposed that by this approach, 38.7% of electricity intake can be preserved in Riyadh. It can also minimize peak need up to 34.7% in nearly all of the KSA region. The economics for these investments showed less than two years of payback time.
Furthermore, (Alaidroos and Krarti, 2015) and (Krarti, 2020) showed that in Riyadh, the electricity consumption for an archetypical villa is about 120,000 kWh per year. However, this finding is significantly high compared to a study conducted by (Esmaeil et al., 2019) and (Almasri et al., 2020), who proposed that the average yearly electricity consumption lies between 29,155, and 34,448 kWh per dwelling in the same climate region in the KSA. Moreover, according to the General Authority for Statistics (General Authority for Statistics (GA STAT) (KSA), n.d.), in Riyadh, an annual average of electrical energy consumed per dwelling is about 21,540 kWh, as shown in Table 2. The difference between simulation-based results and the other-based results may be due to variation in essential parameters. For example, a real case of electricity consumption in KSA houses or the devices' operating time did not precisely define A/C units.
Compare the annual average electrical energy consumed per dwelling/consumer and the EUI residential buildings for the KSA.
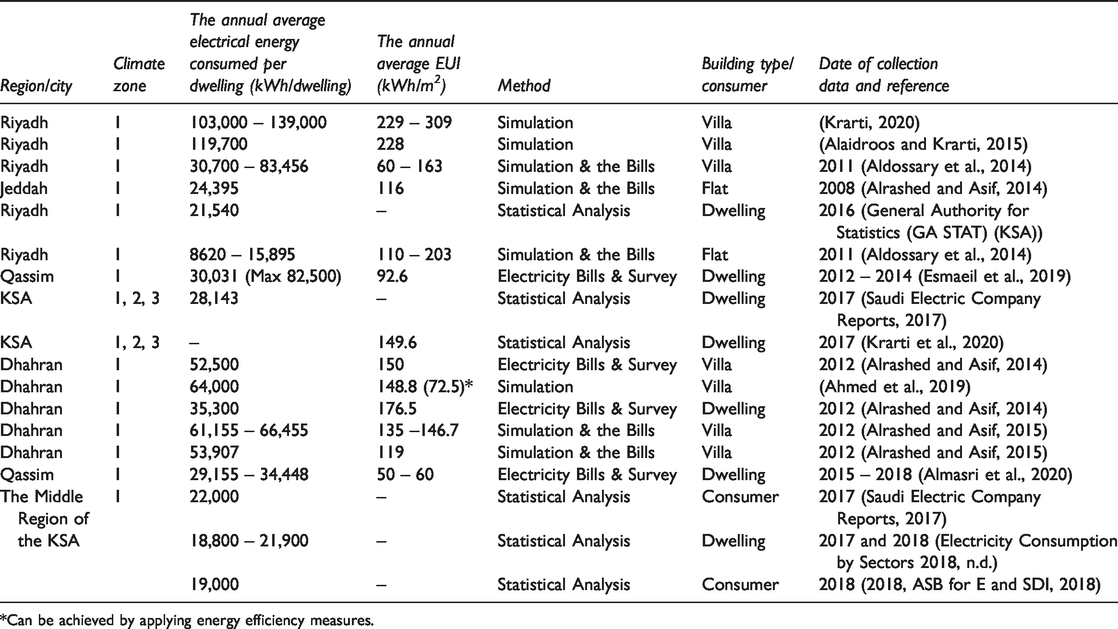
*Can be achieved by applying energy efficiency measures.
However, in the Gulf Cooperation Council (GCC) countries, (Dubey et al., 2016) conducted a study using an energy analysis approach. They estimated the economic and energy performances of EE actions using “building energy productivity.” In research findings, retrofitting the existing building stock can provide benefits to enhance building energy productivity. These benefits include the reduced fuel costs used to generate electricity, low CO2 emissions, and create jobs. In addition of offering a security in energy supply and the environment (Slimene and Arbi Khlifi, 2020). They reported that renewable energy exploitation could also improve expressively building energy productivity, remarkably when united with EE measures.
Similarly, In Qassim, KSA, (Almarshoud, 2017) proved the viability of a 1 MW grid-connected Photovoltaic (PV) system without any governmental incentives or grants using technical and economic indicators. The research proposed by (Salam and Khan, 2018) indicated that the KSA market possesses vast potential for investment in solar energy applications However, the Kingdom still needs to state laws and regulations for renewable systems feeding into the public network and provide incentives for renewable system programs.
In Dhahran, KSA, (Abd-ur-Rehman et al., 2018) studied the feasibility of residential buildings associated with Photovoltaic (PV) system using technical, economic, and environmental indicators. The study found that economic viability was influenced by the proportion of subsidization that may offer by the government. For instance, assuming 2.5 cents per kWh to be the electricity export tariff which equals the electricity cost, a payback period of 13.3 years can be minimized to 6.6 years if a 50% government funding is established grid-connected PV system is applied.
Over the years, solar technology has been an attractive field for scientists and researchers around the world seeking to improve the overall system’s efficiency and reliability. For example, two recent studies evaluated the effect of the cooling of the PV panel (Alizadeh et al., 2020) and the use of the nanofluids in solar systems (Ghalandari et al., 2020). (Alizadeh et al., 2020) investigated numerically four scenarios for the cooling of the PV panel. They reported that the increase in the efficiency by using new modes compared to the conventional one was between 23% to 35% at the solar radiation of 1235 W/m2, but it is less than 13% by low and medium solar radiation. They informed that applying a flat plate closed-loop pulsating heat pipe to cool the PV panel is proper to increase the efficiency and economy. A review study conducted by (Ghalandari et al., 2020) about the use of the mentioned nanofluids in solar systems. They reported that the utilization of multi-walled carbon nanotube/water in PV/T solar systems have a noticeable increase in PV efficiency, system efficiency, and size reduction of the system.
Methodology
Buildings in the KSA have significant growth in energy requirements, essentially due to high A/C demands during the summertime. Because in summers the temperature outside is hugely elevated, reaching 48°C almost throughout the country (Said et al., 2003). The simulation approach will be applied in this work to evaluate the energy intake and EE measures for a typical residential building located in both Riyadh and Qassim in the middle region of the KSA. The study is designed to evaluate and investigate the building’s envelope elements and the utilization of solar energy to achieve a reduction in energy intake. This leads to producing green residential buildings mainly focusing in the middle region of the KSA. Figure 3 shows this work design measures that aim for buildings’ optimal energy efficiency.
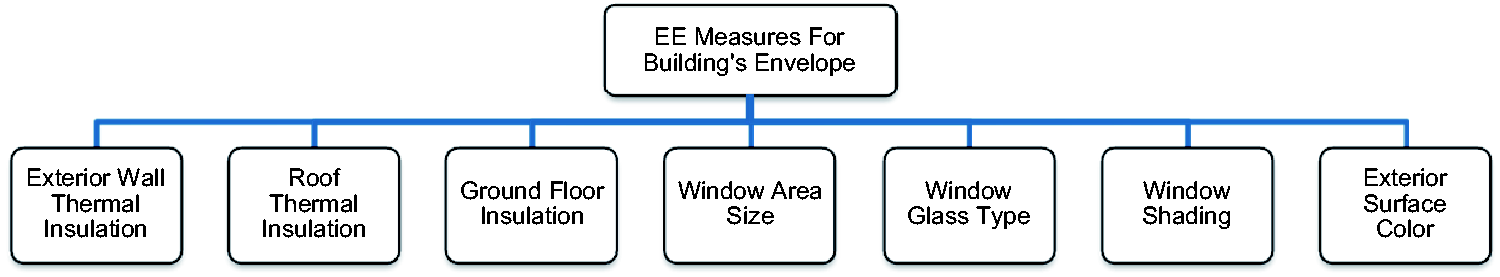
Schemes of this work EE measures for a building’s envelope.
However, the investigation will be carried out through the simulation process using eQUEST software to show ways to improve energy performance. For the study purposes, the weather data will be obtained from officially recorded data by Riyadh and Qassim stations. The simulation process will also be implemented for the same building using RETScreen (renewable energy technology screen) software to estimate the economic feasibility and environmental influence of installing an on-roof solar energy PV system. Moreover, simulations were conducted where data is organized and compared to the base case for every EE measure. This is essential to identify the most useful measures of the building envelope on energy performance. Taken into account are the design standards of the Saudi Building Code (SBC 602) for energy conservation. Finally, multiple measures are combined to show how energy intake be prevented by adapting the building envelope and other studied elements. Figure 4 shows the workflow of this work.
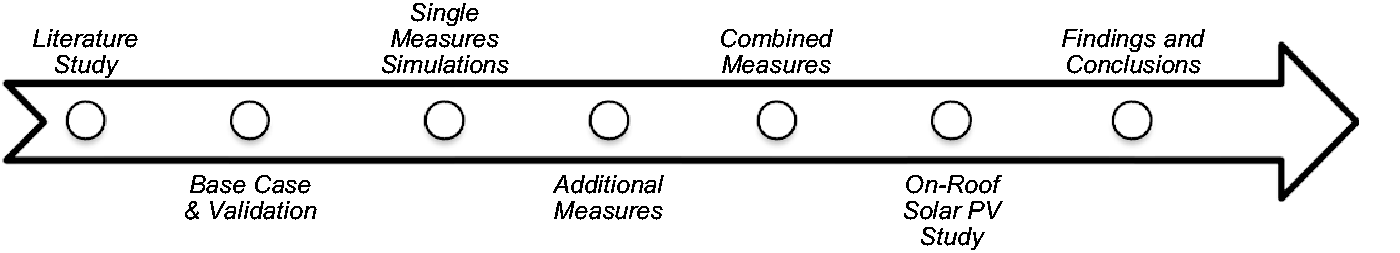
The workflow of this research.
Furthermore, the work is limited to a single geometric building design. This specific building design is an existing building in both Riyadh and Qassim. Thus, the building used was designed and developed by the public sector in the KSA as part of a significant housing project throughout the country. Forty-two housing projects are containing 13,667 houses that are similar to the construction design of the case study building, 3354 of which are located in Riyadh and Qassim (Housing, n.d.). Most of these buildings either under construction or not yet inhabited. However, monthly electricity bills were collected for five inhabited houses from the owners to ensure the correctness of base case modelling results, for the year 2019 from a housing project in Qassim. The building’s data and footprint are shown in Table 3, and the 3-D of the base case building model can be seen in Figure 5.
Data and footprint.

*Material properties retrieved from eQUEST (Hirsch, 2009).
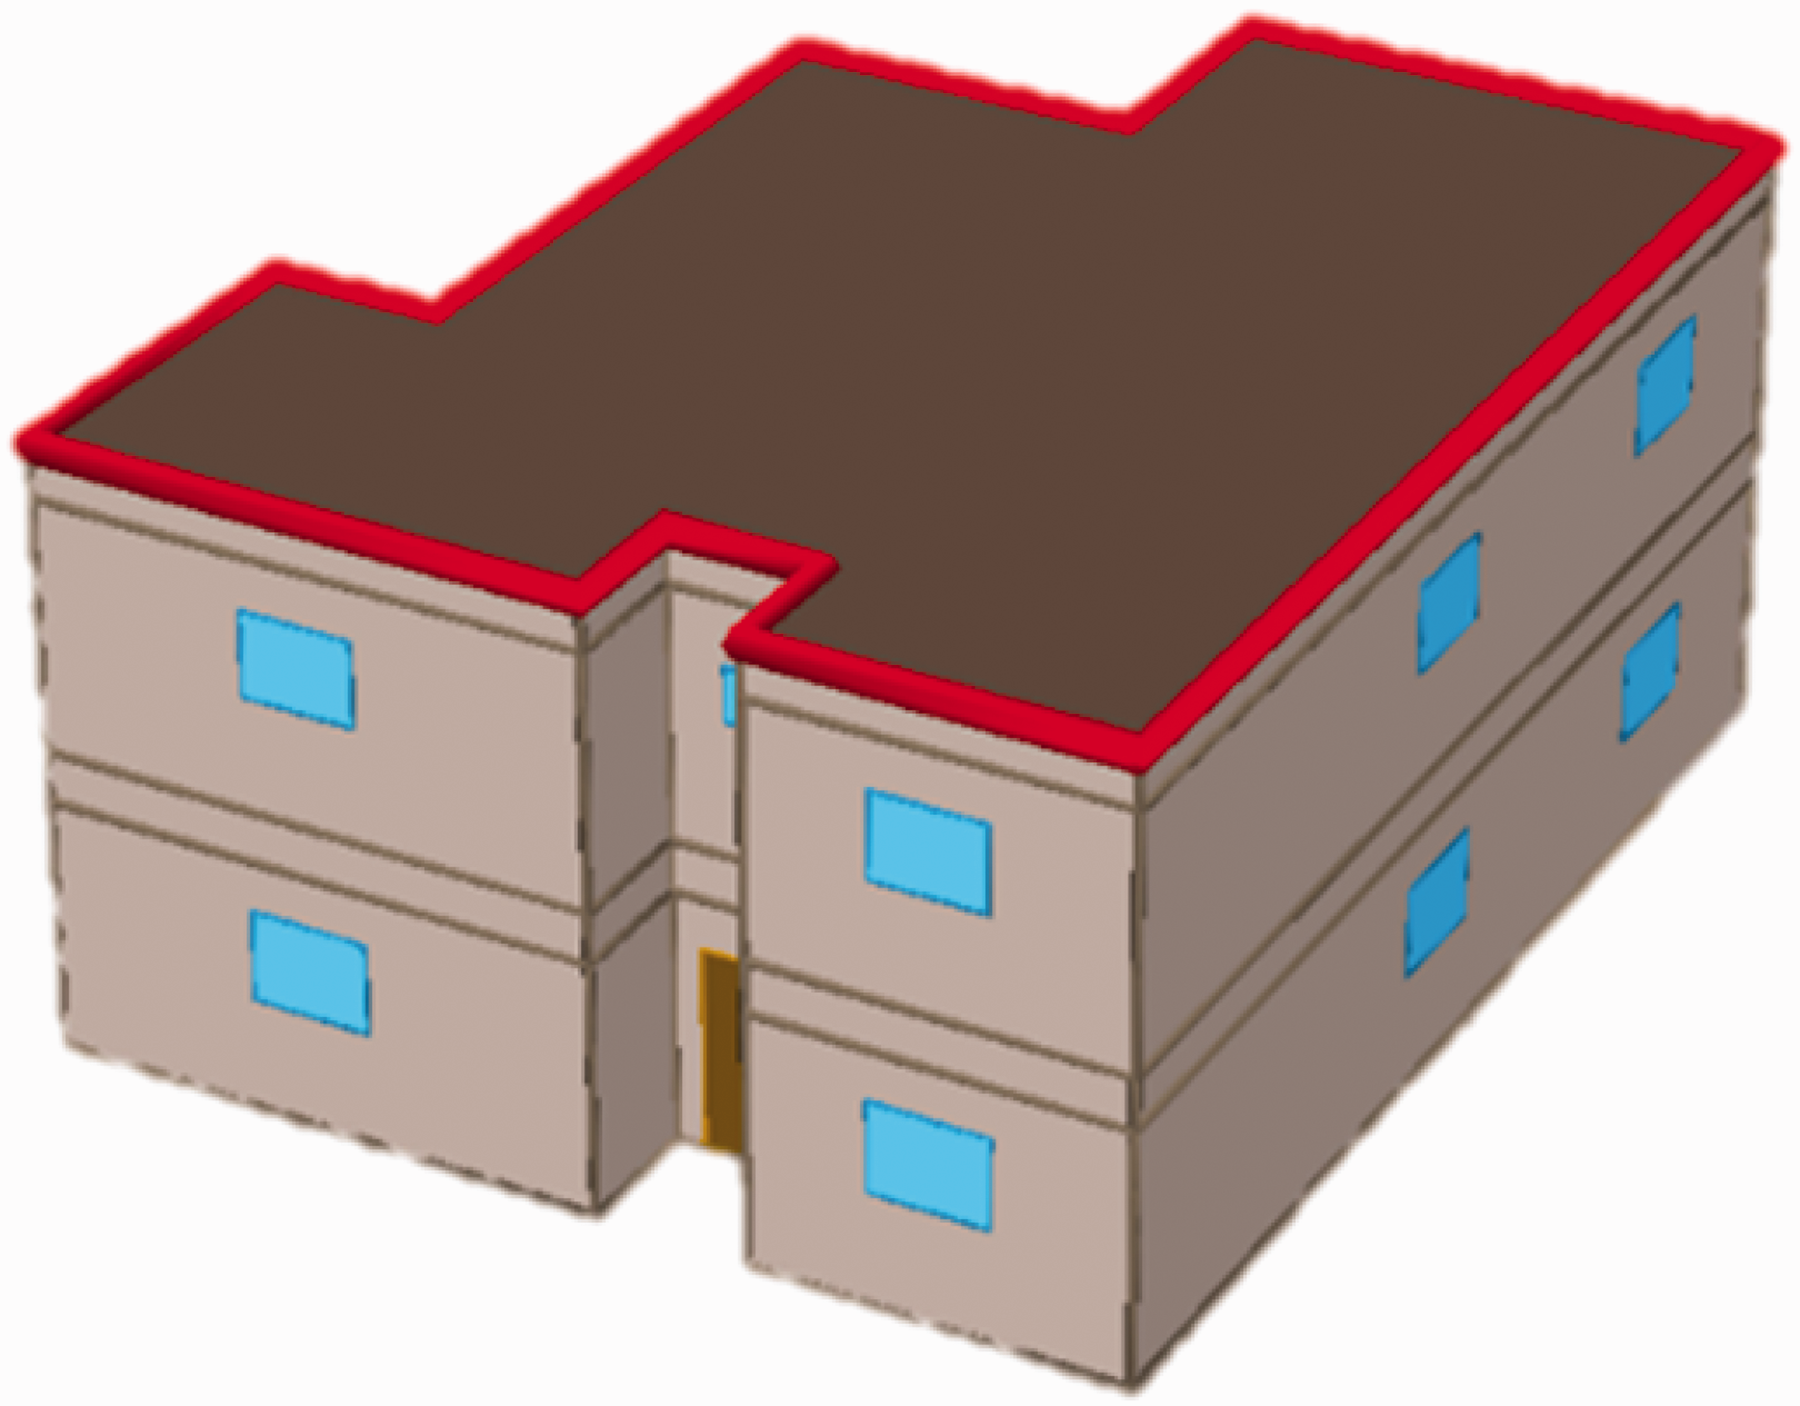
3 D representation for the base case building.
Both Riyadh and Qassim are located in the middle region of the KSA, as shown in Figure 6. The elevation is 600–750 m above the sea level. The middle region is considered as scorching and dry summers and mildly cold winters with temperatures between 47 °C in the summer and 2 °C in the winter (Hasnain et al., 1999). Therefore, the region is known for hot-arid climate summers, low humidity, and dusty weather.
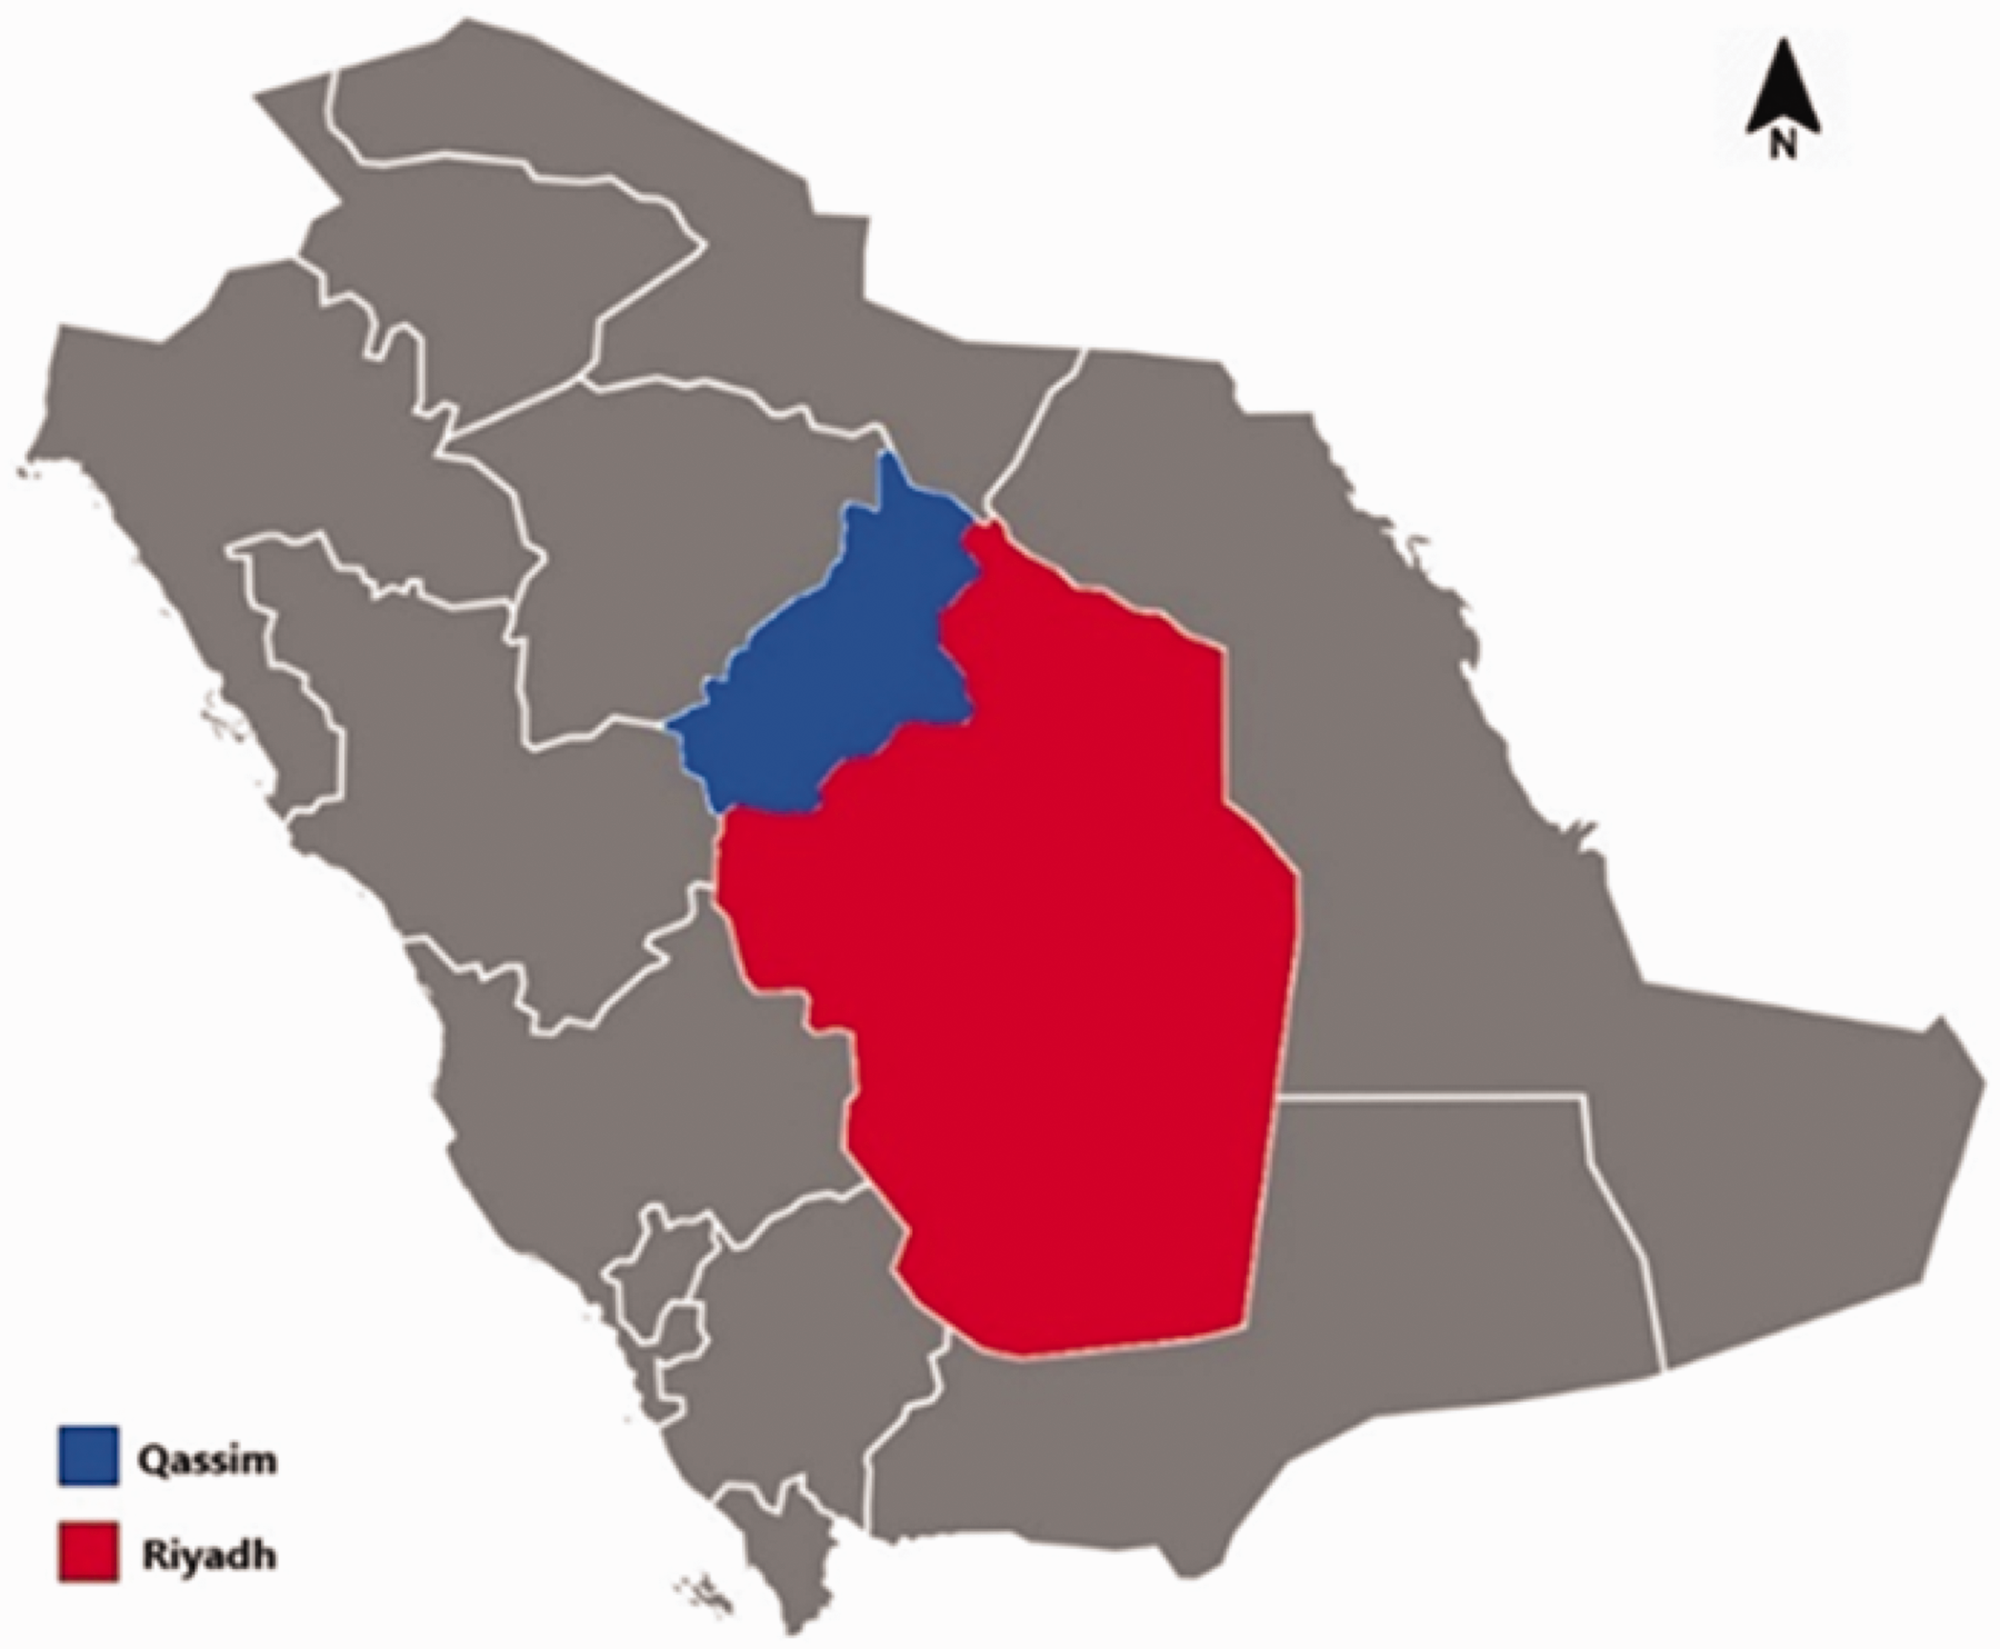
Location of Riyadh and Qassim in the middle region of the KSA.
Building Performance Simulation (BPS) requires weather data as an essential requirement. Weather data for Riyadh and Qassim are acquired as (.BIN) files from ASHRAE (ASHRAE’s IWEC2 “typical year”) which are compatible with the BPS software (eQUEST). Therefore, in order to analyze the effect of the building’s envelope elements on energy consumption, several parameters are stated as follow:
The overall heat transfer coefficient values for the external walls and roofs varied from 0.24 to 2.4 W/m²K and 0.22 to 1.37 W/m²K, respectively, of all simulation scenarios with different insulation types. Simulations are performed for several window types. However, their overall heat transfer coefficient values for the window elevated from 0.77 to 6.31 W/m²K and the SHGC from 0.47 to 0.86. The window to wall ratio (WWR) is varied for all directions to find how it can affect the energy demand. In addition to the base case 13.3% of the wall area. WWR is simulated for each direction at 30%, 25%, 15%, 10%, 8%, 6%, 4%, and 2%. To evaluate the effect of installing shading to the windows different lengths from 0 to 1 m of exterior overhang shading were simulated for the building. In addition, different kinds of blinds, scenarios were also simulated.
Moreover, the second part of the study will explore the feasibility and environmental impact to partially shift from a regular electric grid energy consumer to a solar PV energy producer, which is the primary influence for more sustainability buildings. In this study, a grid-connected PV system was simulated on the rooftop of the building. The yearly climate data and site information of both Riyadh and Qassim is obtained from RETScreen database. The annual average temperature for these cities is about 25.7 °C and 24.9 °C. Therefore, the daily average global horizontal irradiance (GHI) is 5.78 kWh/m2/d and 5.62 kWh/m2/d for Riyadh and Qassim, respectively. The complete PV system is mounted on the roof of the building and positioned towards the south and assumes no shading/shadows were reflected on the system throughout the entire duration of the year. Figure 7 represents a simple sketch of the rooftop of our case study. So, the area roof available for installing the PV system is 173 m2 out of 190 m2 for all rooftop area. In general, the ideal tilt angle is the same as the latitude of the location for a stationary PV system (Alhaidari, 2017). Hence for our location, the optimum tilt angle will be equal to site latitude of 26.3° due south for Qassim. Although RETScreen calculates the optimum energy yields for location when the slope is ranged between 21° and 25°, nevertheless the designed PV system is to be installed on a structure upon a 26.3° slope angle due south.
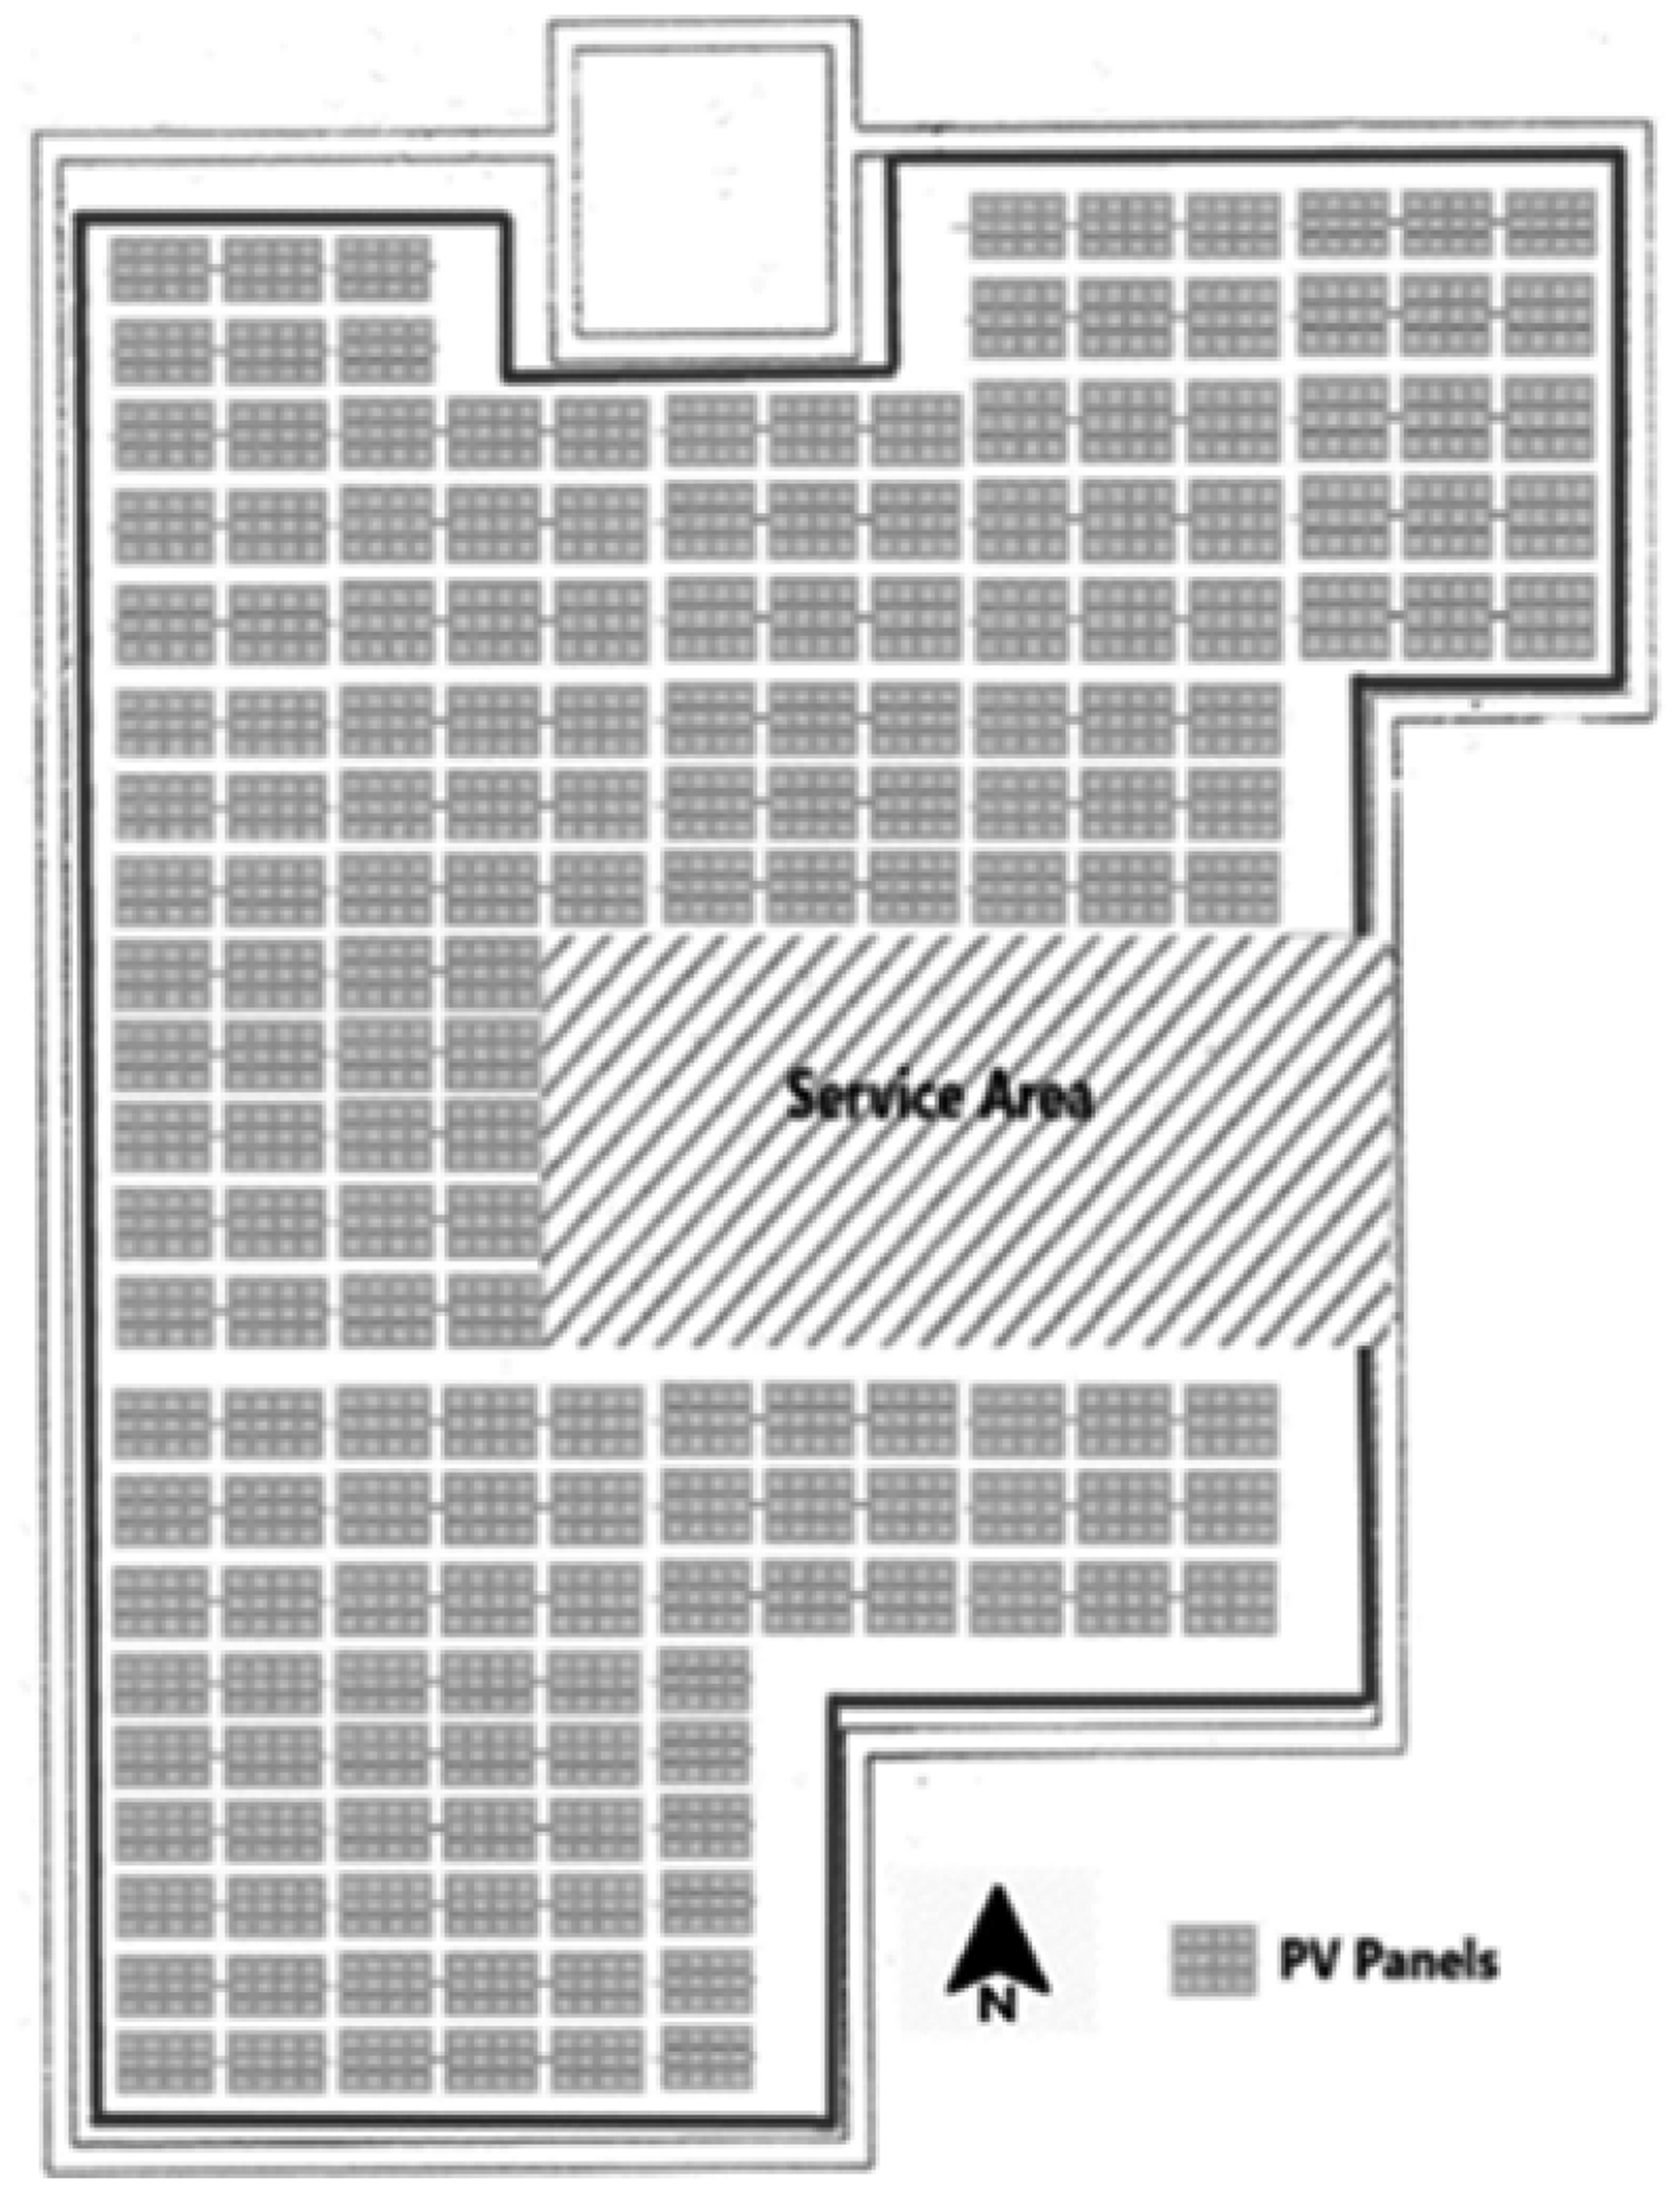
Rooftop sketch for base case.
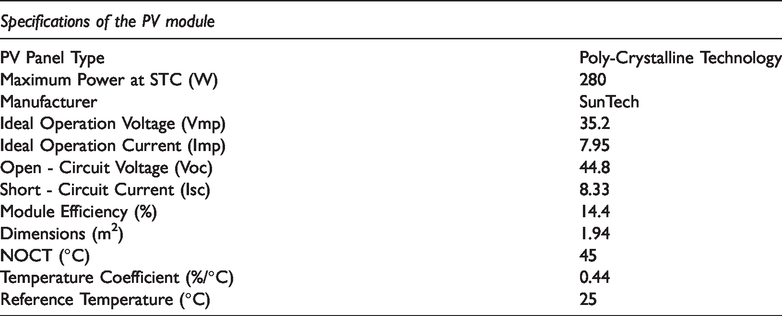
Furthermore, the PV module type was selected for the study due to some reasons that are worth mentioning: performance, warranty, availability in the local market, and RETScreen database. Specifications of SunTech polycrystalline was selected for the study are shown in Table 4. Project life was set as the same as the module lifetime of 25 years, and sunshine hours (h) were assumed to be 8 hours per day.
PV module specifications (SunTech PV module, n.d.).
The energy delivered by the PV array (EA) is as shown in equation (1) (Almarshoud, 2017); where A is the area of the PV array, Lm and Lc are “miscellaneous losses of PV array” and “power conditioning losses,” respectively. In addition, we assume Lm = 2% and Lc = 1.5%. Moreover, Gt in the following equation is the daily average global radiation on a tilted surface (kWh/m2/d) and 
PV system configuration summary.
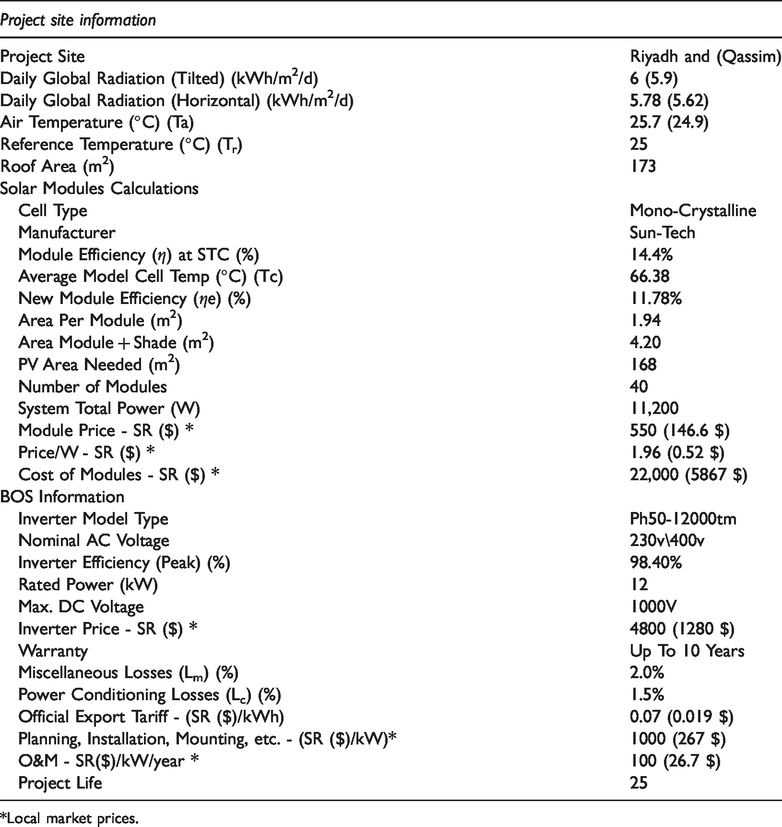
*Local market prices.
According to (Almarshoud, 2017) and the IEA, the PV power systems program suggested some technical performance indicators for assessing the efficiency of PV systems. This includes the sum-up quantity of energy inserted into the network, called total energy yield (

The rate of the energy yield to the total PV array energy would generate per year if it were operating at full rated power for 24 hours per day for a year; this ratio is called capacity factor (CF). The ideal CF would be 50%. Energy transformation losses and weather conditions are the primary reasons for affecting the CF value, and it is given by (Kymakis et al., 2009) in the following equation (4):

Performance ratio (PR) signifies the full effect of losses on the array’s nominal power (Marion et al., 2005). However, it is considered to be unbiased of position and system size, and it is given (Almarshoud, 2017) in the following equation (5), were (GSTC) is the amount of irradiance at STC and (∑Gt) is the accumulative irradiance on the plane of PV array within certain period:

To determine the economic performance indicators, the Levelized cost of energy (LCOE) and the SPBT should determine. LCOE is expressed as the life cycle cost (LCC) of the project divided by the expected output of energy during the project lifetime, which is the average energy produced cost ($/kWh) over the lifespan of the project as shown in equation (7) (Almarshoud, 2017). While LCC (Kazem and Khatib, 2013) in equation (6) is defined as the complete expenses associated with an energy delivery by the system over its lifetime in today’s money including capital cost (Ccapital), operation and maintenance cost (CO&M), parts replacement cost (Creplacement) and the salvage cost (Csalvage), considering the time value of money, which means any future cost must be discounted to their present worth (PW), taking into account both inflation (i) and discounting (d) rates. However, the PW is given by (Kalogirou, 2013) and shown in equations (9) and (10), where (n) is the number of years. On the other hand, SPBT can be calculated using equation (8) (Almarshoud, 2017).


(Saudi Arabian Monetary Agency (SAMA), n.d.) reported a report. The report states that the interest and inflation rates are 2.4% and 2.5%, respectively. On the other hand, the discount rate was estimated by (Almarshoud, 2017) at 4.5% in the KSA. The study concludes that there is not any debt as a part of the capital cost, and the life period of the project is 25 years which is equal to the life cycle of PV modules. The life period of inverters is 15 years, and the salvage value is 30% of capital cost.
In December 2019, a report was published by the (Electricity & Cogeneration Regulatory Authority (ECRA), 2019). The report defines the regulatory requirements related to small on-grid solar PV systems that connected to the distribution system in the KSA. Moreover, the export tariff for the excess energy generated by PV systems for the residential sector approved by the authority (Electricity & Cogeneration Regulatory Authority (ECRA), 2019) is 0.07 SR (0.019$) per kWh. In comparison, the electricity tariff for the same sector is 0.18 SR (0.048$) per kWh for consumers less than 6000 kWh per month. In this study, the different export tariff was varied from 0.07 to 0.25 SR/kWh. The purpose is to determine if the official export tariff is financially viable or if the government should consider increasing it as a PV incentive program.
Results and analysis
Total yearly energy intake – Base case
Figures 8 and 9 represent the total yearly electrical energy intake by month for the base case building for Riyadh and Qassim, respectively. The results show that total yearly electrical energy consumption was 52.25 MWh and 49.69 MWh for Riyadh and Qassim, respectively, which reflect a yearly energy use intensity (EUI) of 138 kWh/m2 and 131 kWh/m2 respectively. Moreover, space cooling account to 65% and 58% of the overall yearly energy intake for Riyadh and Qassim, respectively, as illustrated in the energy end-use distribution in Figure 10 and Figure 11.
Monthly electrical energy intake for base case in Riyadh.
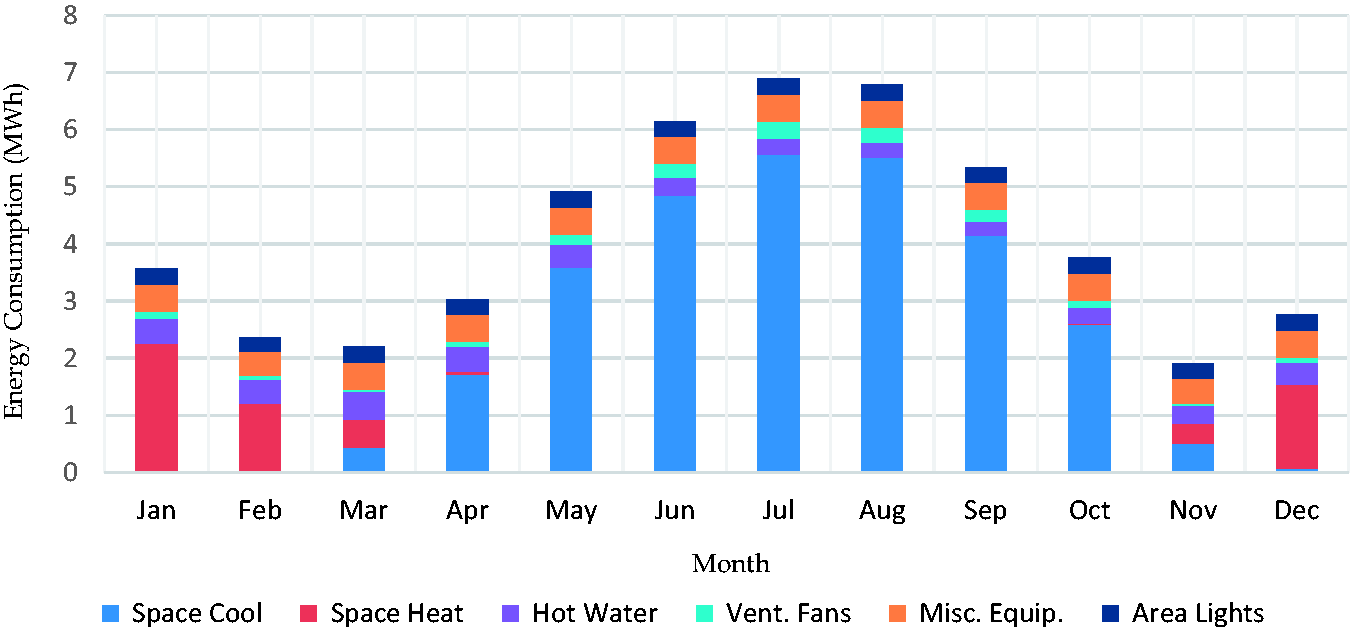
Monthly electrical energy intake for base case in Qassim.
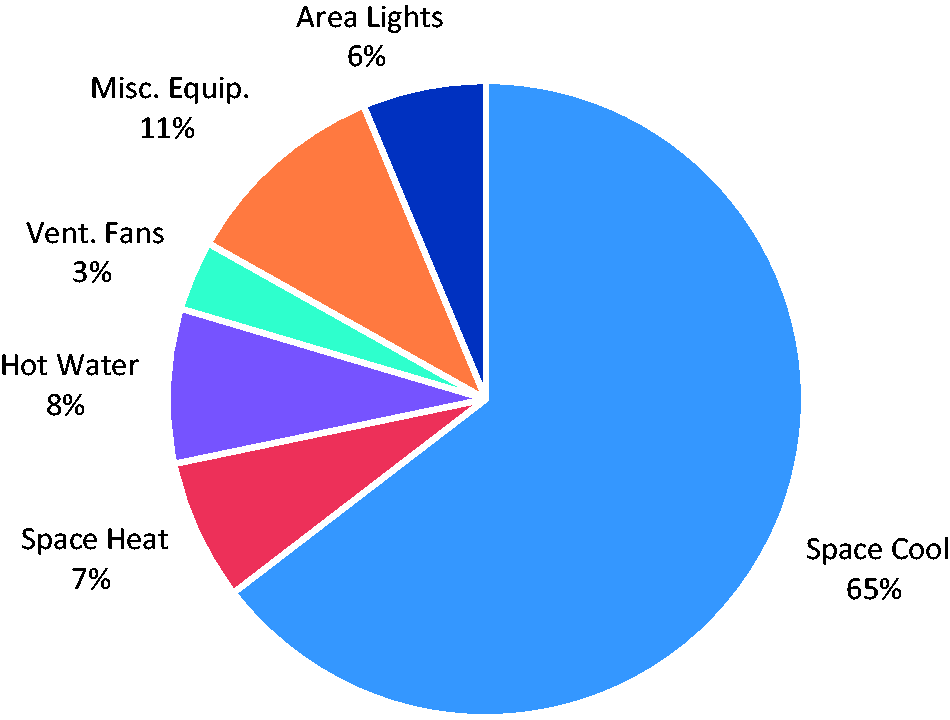
Energy end-use distribution for base case in Riyadh.
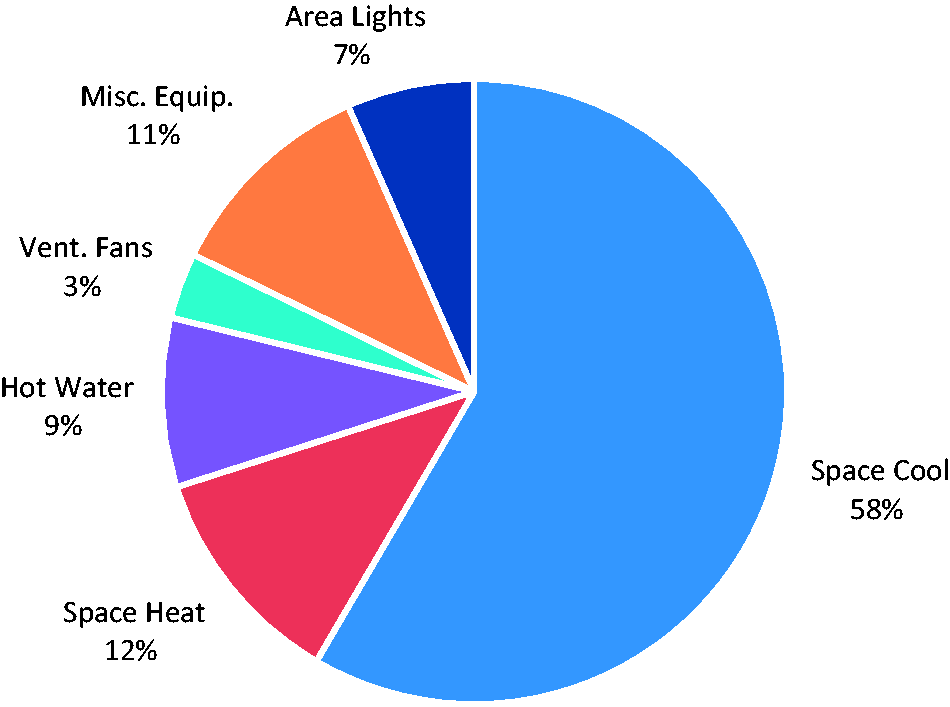
Energy end-use distribution for base case in Qassim.
A survey was conducted to validate the results of the modelling. The survey comprises of five houses of the same design located in the Qassim region. Unfortunately, it was not possible to increase the sample number because most buildings were not yet inhabited. The electrical energy consumptions were traced from the monthly electric bills for 2019. It is noted from Figure 12, that the modelling results trend was mostly consistent with the results of the survey. The annual consumption ranged between 35.6 and 51.6 MWh. Furthermore, about a 10 – 15% reduction in the survey results was observed while comparing to the modelling results in the summer months. So, the deviation indicated in the electric bills was understandable due to many reasons; for example, the household number of occupants, equipment used, attributes of occupants, and the building operation schedule.
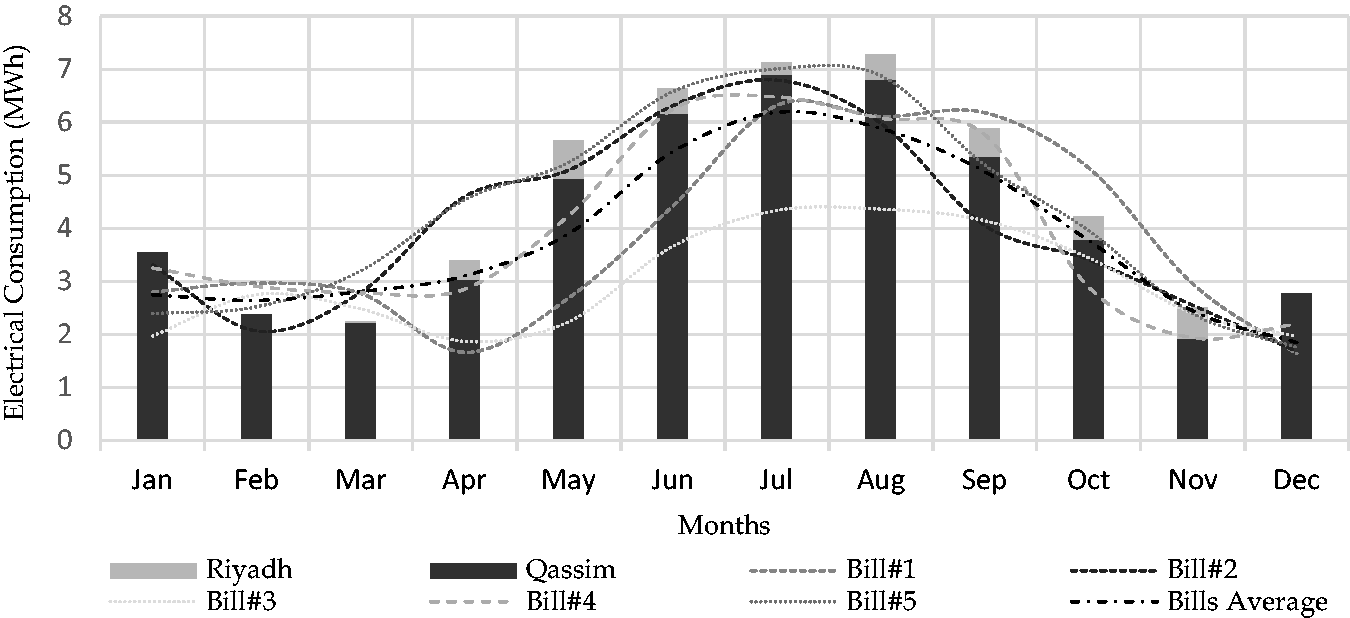
Model calibration results.
The EUI results were then compared with similar studies, as shown in Table 6, which are detailed comparisons of energy consumption per unit area in houses in the middle region of the KSA. These comparisons indicate that the presented outcomes are reasonably close to the study done by (Aldossary et al., 2014) and very low compared with results found by (Alaidroos and Krarti, 2015) for Riyadh. On the other hand, Qassim results are relatively high compare to a study found by (Esmaeil et al., 2019). According to SBC 602 for energy conservation, the Qassim and Riyadh areas lie in thermal zone 1, and according to this standard, Riyadh and Qassim have similar weather conditions.
Energy intake per unit area in houses in the middle region of the KSA.
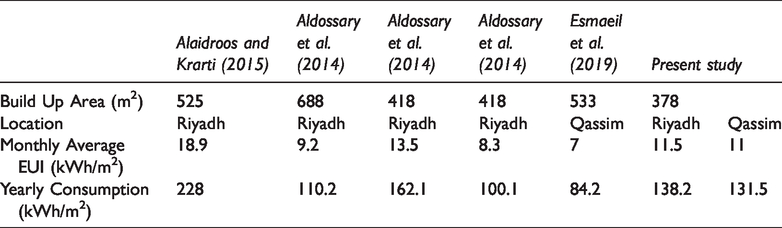
Moreover, the simulation study done by (Alaidroos and Krarti, 2015) considered an archetypical villa in Riyadh with a 525 m2 built-up area and proposed that the EUI is about 228 kWh/m2. On the other hand, electricity bills and a survey study carried out by (Esmaeil et al., 2019) found that the EUI for a 533 m2 villa is about 84.2 kWh/m2 in the same climate region in the KSA. Although the build-up areas for the two studies are quite close, there was, however, a significant difference in EUI. However, the difference between simulation-based results and the other-based results may be due to the difference in consideration of essential parameters. For example, a real case of electricity intake in the KSA house or the running time of the appliances did not precisely define A/C units especially.
Energy efficiency measures
External walls insulation element
Several exterior wall insulation scenarios for both locations were simulated. Figure 13 illustrates the energy savings of increasing thermal resistance value.
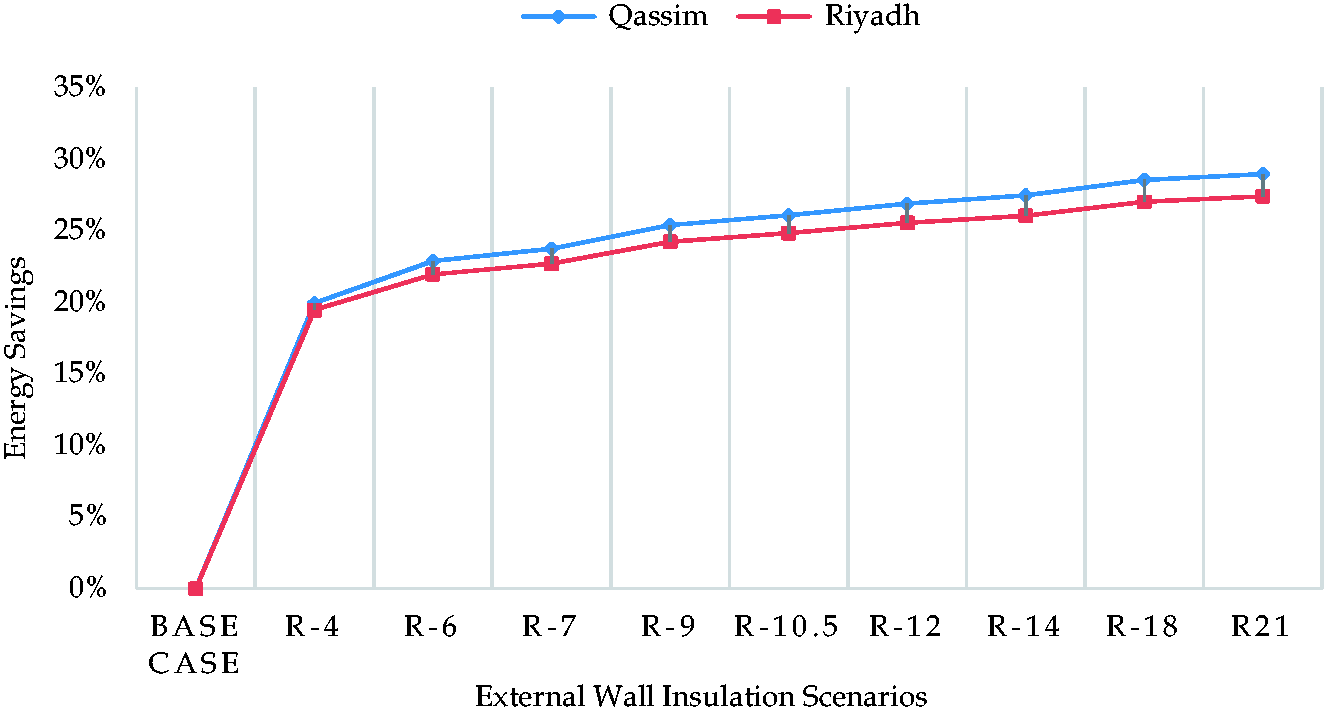
Energy savings from different wall insulations.
The results characterized energy savings when the exterior walls were changed by adding various types and thickness of insulation material by keeping other factors the same. However, the polyisocyanurate type has the highest energy savings per unit thickness compared to the polystyrene and polyurethane types. The reason behind this was polyisocyanurate that prevents more heat from inflowing into the building, thus lowering the cooling load compared to the other two types. For both Riyadh and Qassim, the last scenario, with 3 inches of polyisocyanurate (R-21), is the wall that provides the highest energy conservation of all wall construction scenarios. Energy conservation reaches up to 27.4 % and 28.9% for Riyadh and Qassim, respectively. In findings of study, Riyadh is displaying comparable rates for energy savings accomplished by enhancing the wall’s thermal resistance. However, results show higher energy preservation than the savings reported by (Alaidroos and Krarti, 2015) and (Wahl, 2017).
Moreover, SBC 602 states that the minimum thermal resistance requirements for an external, residential wall should less than 2.92 m²K/W. Scenario (R-14), represents the SBC 602 standardized external wall R-value, which can preserve energy by 26% and 27.5% for Riyadh and Qassim, respectively. It is safe to say that external walls with higher than the standardized R-value do not add considerably to the energy savings. However, the results show a significant and beneficial impact on energy conservation when considering R-4 or more rated insulation value compared with uninsulated walls for residential buildings in the above cities.
Roof insulation element
The energy savings due to increasing the thermal resistance value are illustrated in Figure 14. The highest energy savings achieved with the last scenario (R-21) for both Riyadh and Qassim by 14% and 13%, respectively. However, these results revealed a significant variation in energy conservations between the base case (uninsulated) and the first scenario with only R-4 insulation added to the roof construction. To conclude, increasing the resistance value of the roof does not affect energy consumption significantly, as shown in Figure 14. The polyisocyanurate type of insulation has the most considerable energy preservations per unit thickness compared to the polystyrene and polyurethane types. However, the energy savings has a minor significant change. For instance, in the Riyadh simulation, 1 inch of polyisocyanurate (R-7) added to the roof construction saves energy by 12.6%, while the polystyrene (R-4) and polyurethane (R-6) types save energy by 11.8% and 12.4%, respectively. These energy preservations are lower compared with the savings published by (Alaidroos and Krarti, 2015) and (Wahl, 2017), where preservations for Riyadh are up to 18% and 23.4% compared to an uninsulated roof.
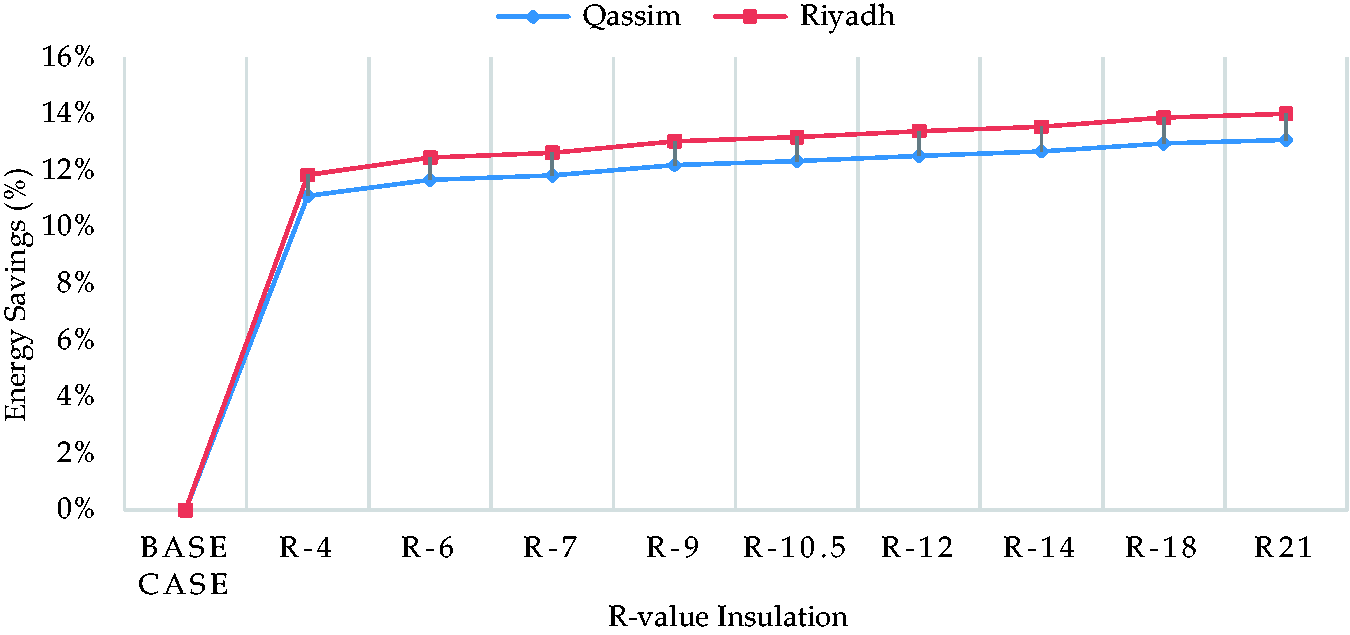
Energy savings from different roof insulations.
Regarding a residential roof, SBC 602 determines the minimum thermal resistance requirements for a residential roof. That should have no less than 5 m²K/W. The last scenario, with 3 inches of polyisocyanurate (R-21), represents a roof with a rated R-value of 4.5 m²K/W, which does not meet the minimum standardized R-value for residential roofs but is close. However, as shown earlier, it can conserve energy by 14% and 13% for Riyadh and Qassim, respectively. As shown in Figure 14, increasing the resistance value of the roof does not affect energy consumption significantly.
Perimeter ground insulation element
Different perimeter ground insulation scenarios for both locations are simulated. The findings show very low savings in energy consumption for vertical, horizontal, and full under-slab insulation boards. Moreover, all simulation Scenarios have preserved less than 1% energy, which makes perimeter insulation insignificant. A major reason behind the results is because the building is directly in contact with the earth as most residential buildings are in the KSA, thus not exposed to weather conditions.
Window types and window area size
The energy savings from different glazing types are shown in Figure 15. The simulation results point out that windows with low-emissivity (LoE), tinted double glazing and LoE, and clear triple glazing filled with argon provides the highest energy savings compared to other simulated types for both Riyadh and Qassim. The maximum savings were 6.43% and 6.0% for Riyadh and Qassim, respectively, for triple glazing. However, these results were very close to double glazing energy savings which were about 6.11% and 5.45% for Riyadh and Qassim, respectively. Riyadh’s savings from the glazing types were in line with the savings found by (Alaidroos and Krarti, 2015). The savings determined from this study compared with savings found by (Wahl, 2017) were much lower due to a difference in the WWR. The building under study and the building studied by (Alaidroos and Krarti, 2015) considers a WWR of around 13%, while the building studied by (Wahl, 2017) used a WWR of 28%. This ratio is more than double which may verify the outcomes and may indicate that the influence of the glazing type on the energy intake decreases with minimized WWR.
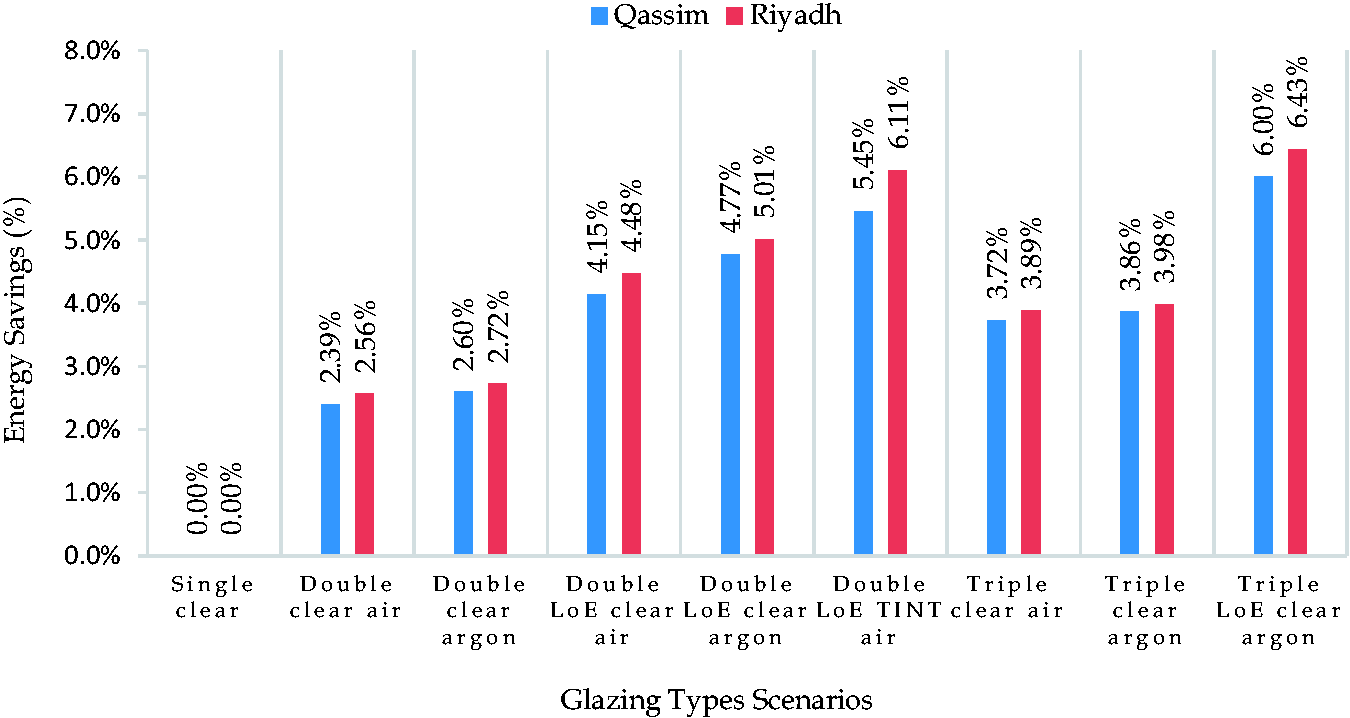
Energy savings from different glazing types for both locations.
The building understudy has a WWR of 13.3% in all directions. To study, how can the WWR affect the energy demand with the WWR simulated at 30%, 25%, 15%, 10%, 8%, 6%, 4%, and 2% for all façades. The results of energy savings are represented in Figure 16 and show that the WWR has a very low effect on energy demand. These results are similar to the results found by (Ahmed et al., 2019) that also showed minimal effect when using a lower WWR. On the other hand, the results found by (Wahl, 2017) show that reducing the WWR and modifying the window allocation can save energy up to 19% for Riyadh. However, it is hard to say why, because many factors are changed in this study. The amount of natural daylight within the building when lowering the WWR does not consider in the simulations.
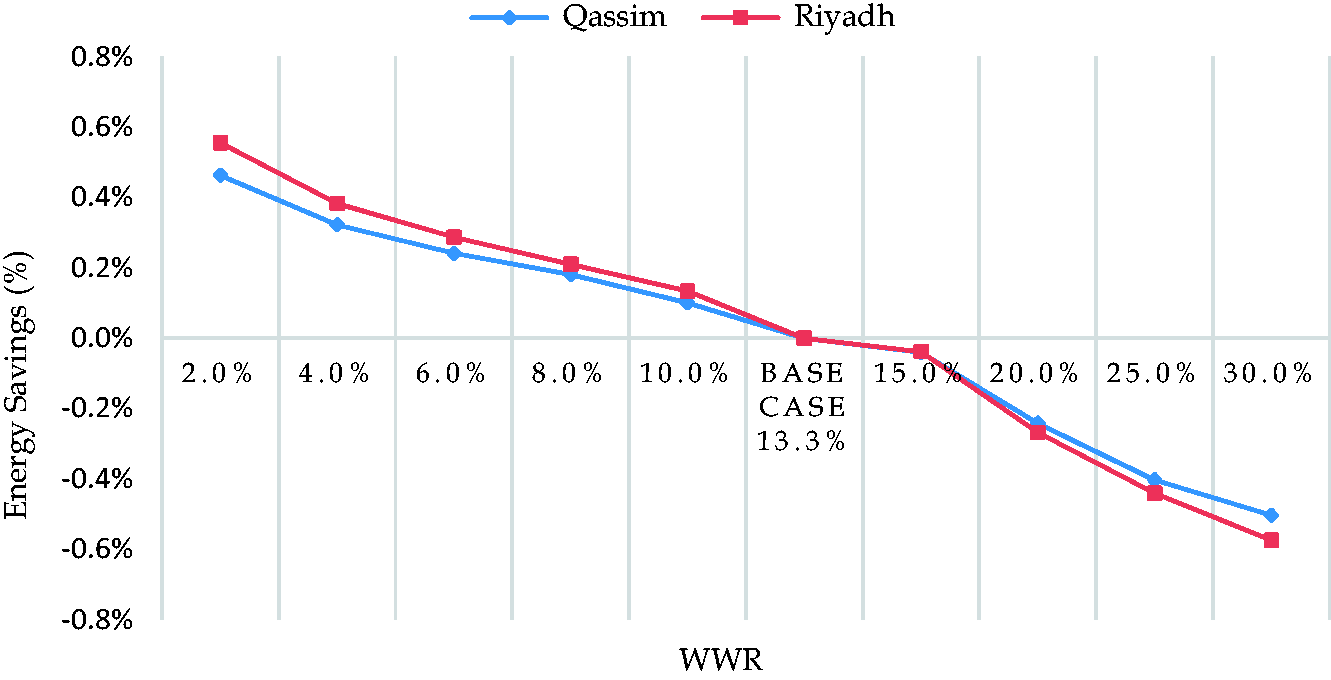
Energy savings from different WWR for both locations.
Shading and blinds
The results of energy savings are represented in Figure 17. Energy savings were given by increasing overhangs, For instance, an 80 cm overhang projection results in energy savings of 3.7% in Riyadh, while the same extension leads to 2.9% in Qassim. The maximum reduction in energy consumption was 4.1% when an overhang projection of 100 cm were considered for Riyadh. Energy savings represented in Figure 17 are in range with that presented by (Alaidroos and Krarti, 2015) and (Ahmed et al., 2019), who showed that overhangs of 100 cm can save energy by 6% and 3%, respectively for Riyadh. However, these results were lower than the results found by (Wahl, 2017), which showed a combination of shades and fines on all façades excluding the south causes energy savings of 8.4% for Riyadh. This result is rational as the base case considered in this study, the studies found by (Alaidroos and Krarti, 2015) and (Ahmed et al., 2019) have a lower WWR than the building used in the study by (Wahl, 2017). The use of fins in addition to overhangs may also be a reason for higher energy savings in that study.
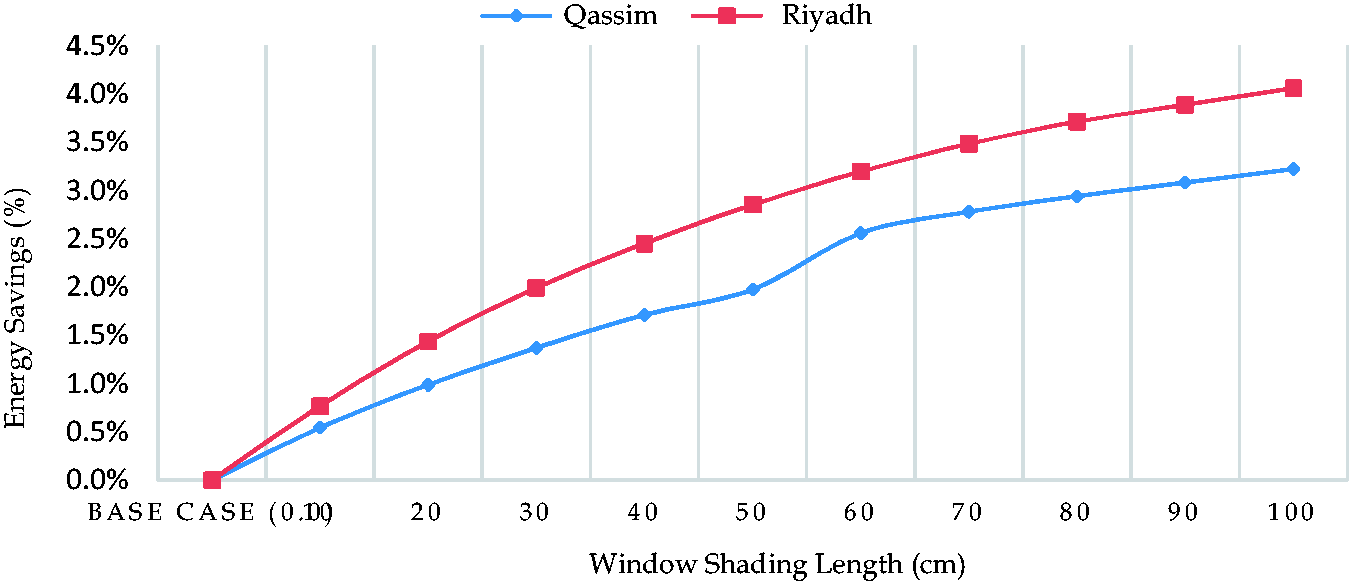
Energy savings from window shading for both locations.
Simulation of seven different blind types shows that blinds can save energy by 1 to 2.3% for Riyadh and by 0.8 to 1.7% for Qassim. A maximum energy savings can be reached when using opaque roller shades with medium or dark color.
Additional measures
Exterior surface color
A darker colour will admit and absorb great amount of solar radiation and therefore heat will transfer to the inside space, which mainly leads to additional cooling load. For instance, selecting a yellow or white finish colour instead of a dark colour can reduce energy consumption by almost 7 to 12% for Riyadh and by almost 6 to 10% for Qassim. In the case study, as shown in Figure 18, selecting a white finish colour instead of a medium-light colour for the base case reduced the energy consumption by 6.1% and 4.6% for Riyadh and Qassim, respectively. Energy savings for Riyadh represented in Figure 18 are in line with that presented by (Ahmed et al., 2019).
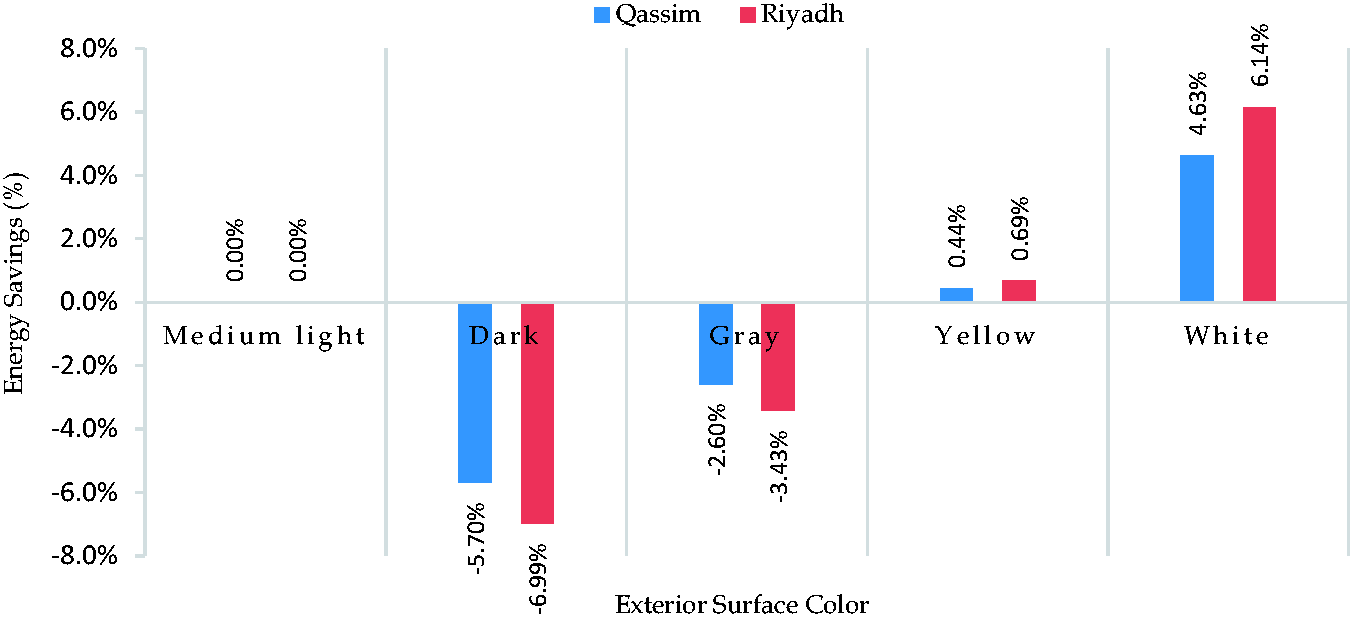
Energy savings from applying different wall colors for both locations.
Lighting and HVAC systems
As an efficient lighting system measure, the building being studied has an LED-type lighting system that corresponds to a lighting density of less than 2 W/m2. Although SBC 602 defines maximum standards for lighting density at 10 W/m2. Thus, the actual base case for lighting density is excellent. However, if the building used high energy-consuming lighting types like incandescent and fluorescent lamps which can correspond to 4 W/m2 and 2.4 W/m2 respectively, then using LED-type lighting can reduce total energy consumption by 12.9% and 7.9%, respectively.
Furthermore, adapting LED-type lighting systems may affect the consumption of an HVAC system (Deng et al., 2019), hence less efficient light bulbs contribute more heat to the surrounding, requiring more cooling load. Energy savings of about 9640 kWh per year from upgrading to an LED-type lighting system and 1540 kWh per year from the HVAC system are affected by the upgrade. A total savings of around 2012 SR per year resulted when the total initial investment was 1250 SR. SPBT for each appliance varies from 3 to 8 months. The building under study uses a window type A/C with an EER equal to 7.6. Results show the energy savings of upgrading to a split type A/C with a higher EER reduces total energy consumption by 33% in Riyadh and 32% in Qassim. Energy savings from upgrading the HVAC system were in line with that presented by (Ahmed et al., 2019), which by upgrading to a higher EER from 5.11 to 10.23 can reduce energy consumption by 35% in the KSA. Upgrading to a high-efficiency A/C type with 13.20 EER can save up to 3119 SR and 2831 SR per year for Riyadh and Qassim, respectively. While the total initial investment is 17,990 SR, the SBPT is around 5–6 years.
Summary of single measures and combining all efficient measures
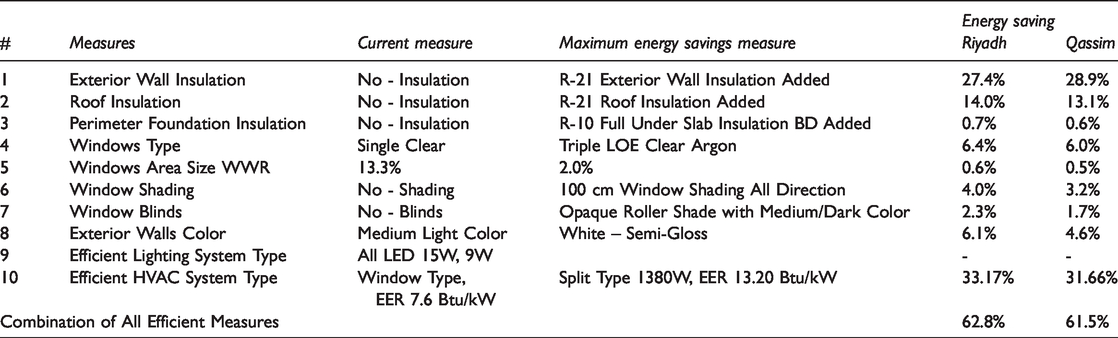
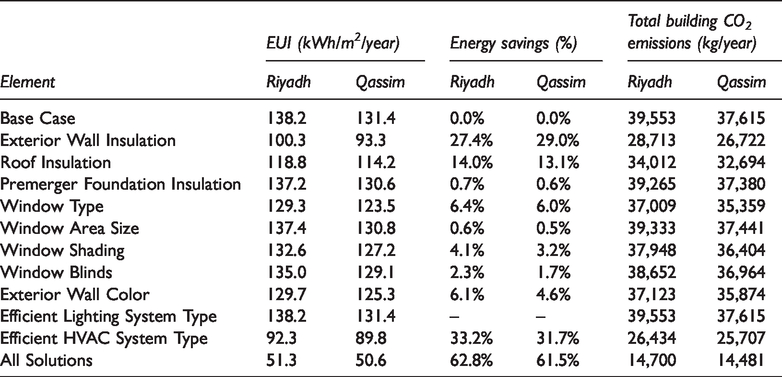
Table 7 shows all maximum energy-saving measures studied compared to the base case, in addition to energy savings from a combination of all efficient measures. The most impactful EE solutions are selecting an HVAC system with a high EER, R-21 exterior wall insulation, R-21 roof insulation, and triple LOE clear argon glazing with each dropping the energy intake by 33%, 27%, 14%, and 6%, respectively for Riyadh, and by 32%, 29%, 13%, and 6%, respectively for Qassim. The KSA is a territory with high solar radiation levels. Thus the total envelope R-Value, specified by the wall and roof section components, in addition to the glazing type, were the most impactful factors which determine the final energy consumption.
Summary of single measures and combining all efficient measures.
The influence on the energy intake of the building by all of the proposed EE solutions, compared to the base case building, can be seen in Figure 19. In contrast, the impact of each of the proposed EE solutions on energy intake can be seen in Figure 20. Generally, the trend of the curves is the same, with energy intake raising in the summer months and falling in the winter months. However, the overall intake for each EE solution varies. Seasons have apparent effects on energy savings. For example, by applying all stated EE solutions, the average energy savings in the summer months (May to October) can reach up to 68.6% and 66.2% for Riyadh and Qassim, respectively.
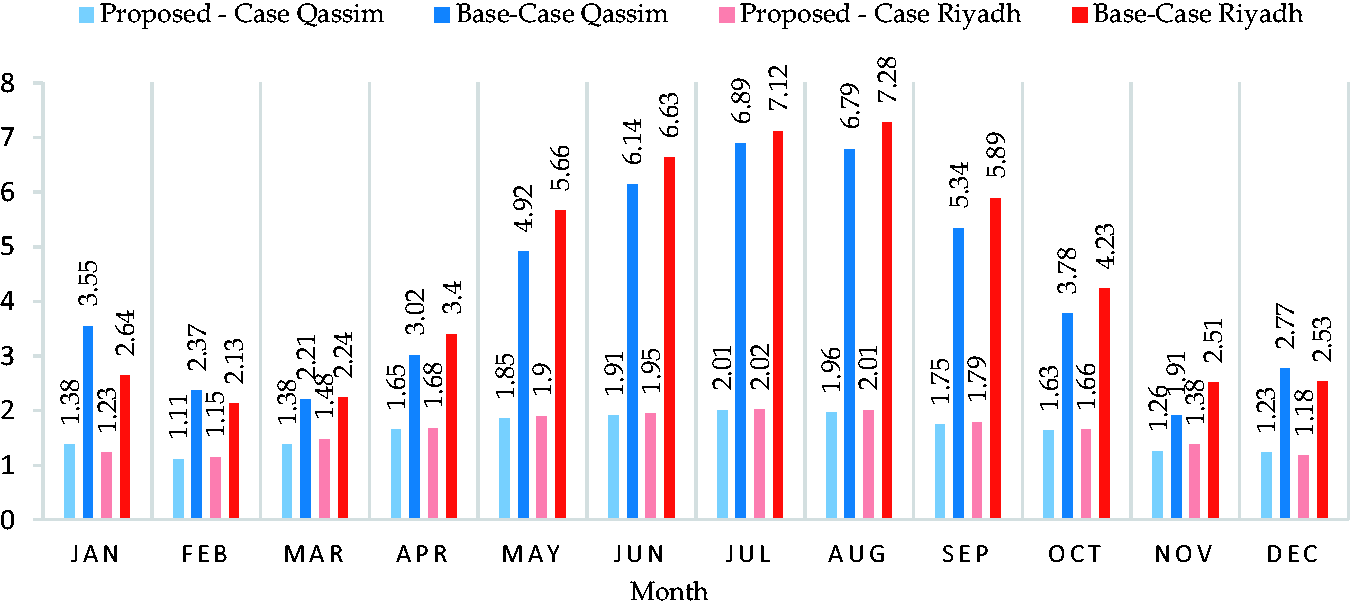
Monthly energy intake of the base case and proposed case for both locations.
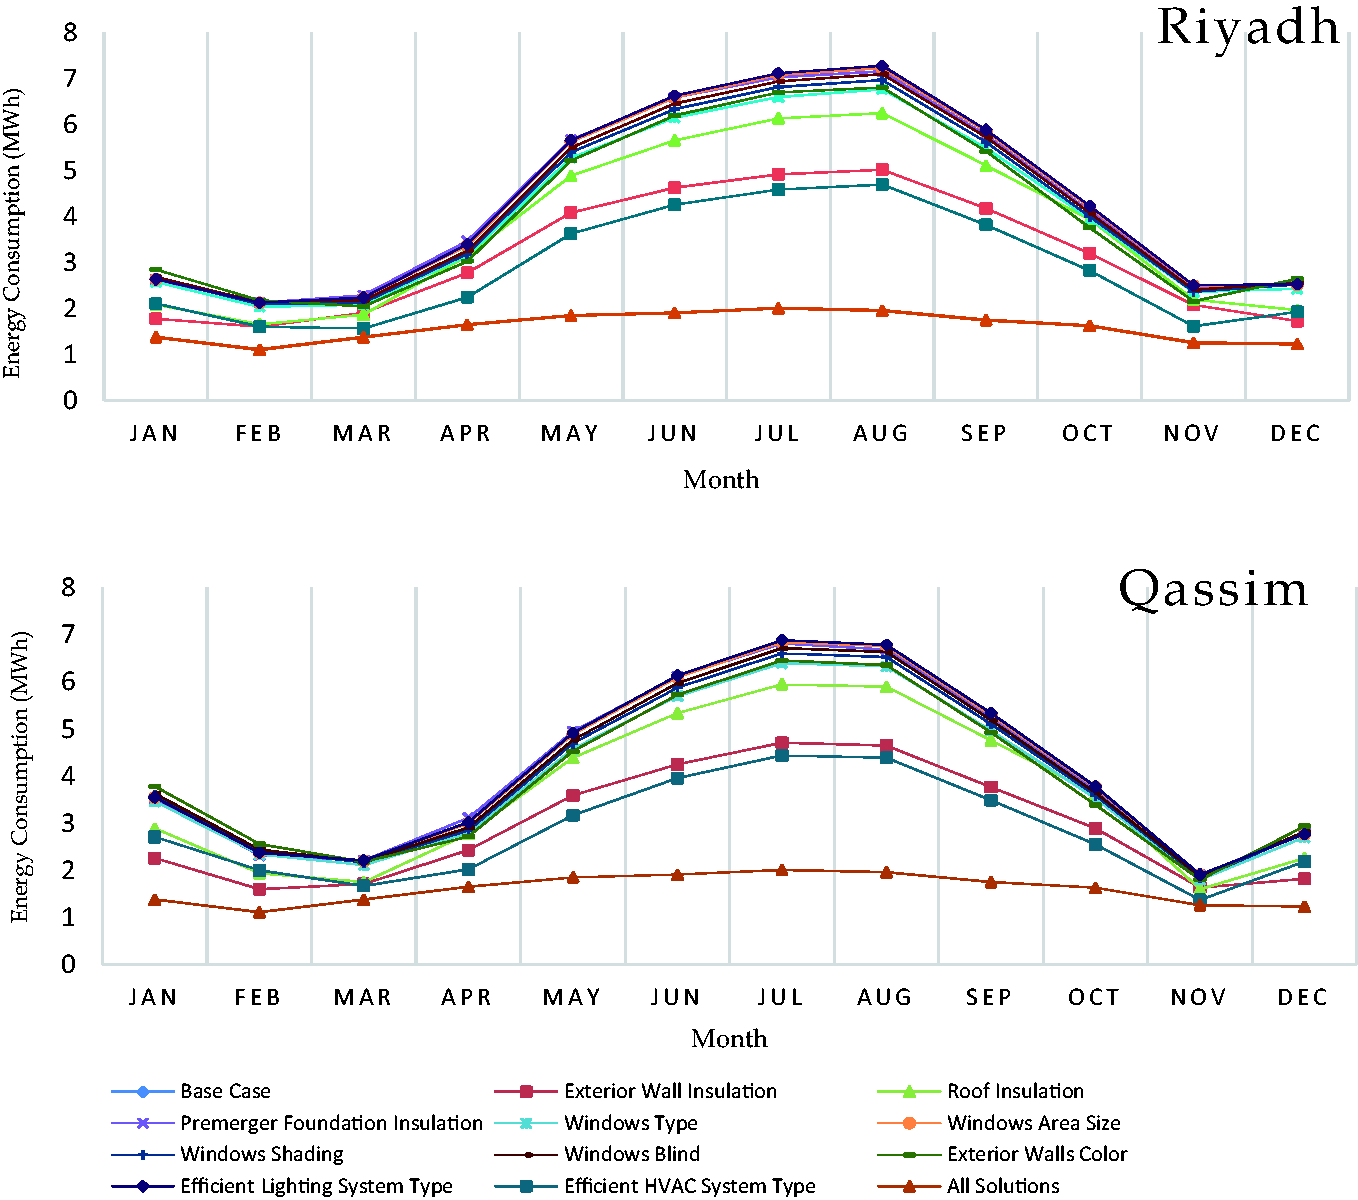
Energy intake of the Base Case and Each EE Solution for Both Locations.
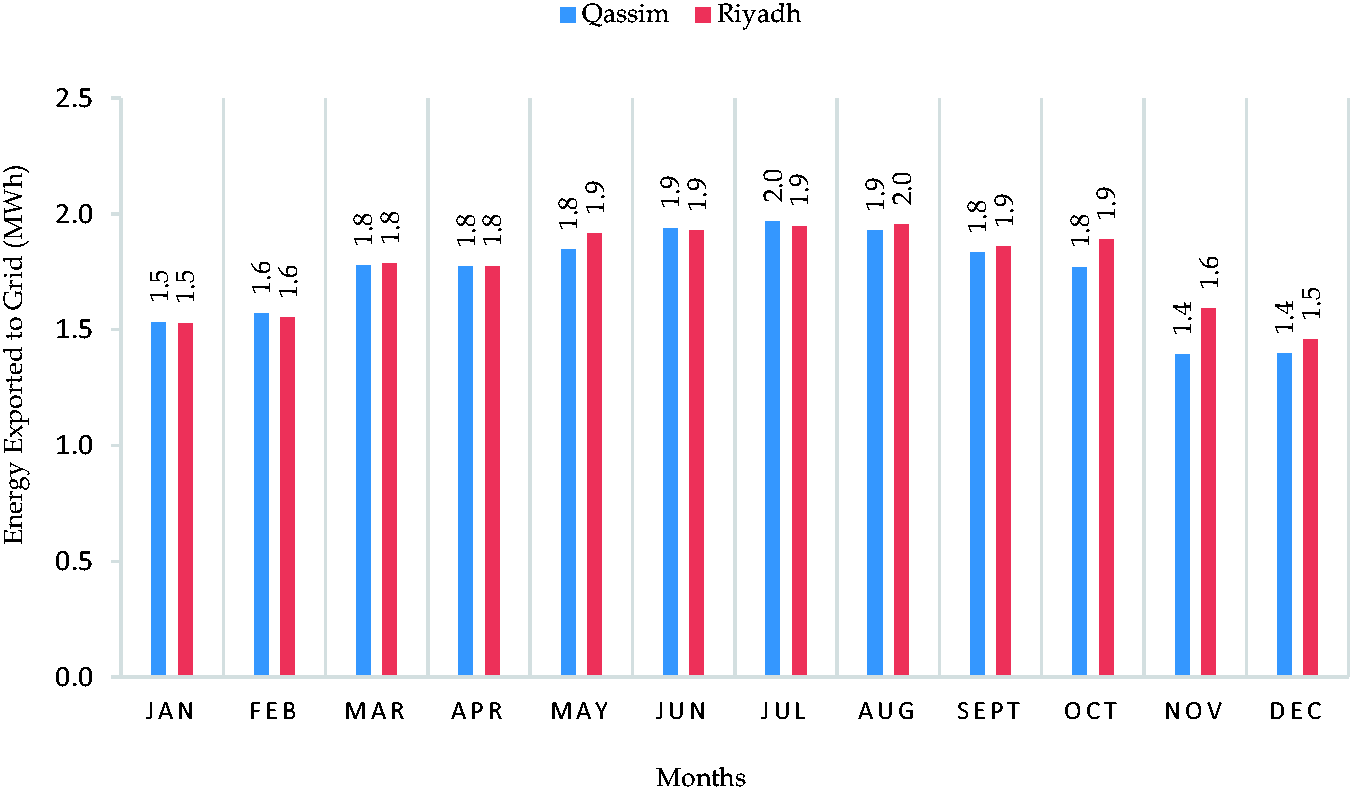
Monthly average of energy injected into the grid.
On the other hand, winter months (November to April) can reach an average energy savings of up to 47.1% for Riyadh and 47.8% for Qassim. This is understandable as a consequence of the high cooling load in the summer months. This is important to reduce the burden on the electrical net in the summer, especially since the efficiency of power stations in hot climates is low compared to cold weather. The EE residential building has a EUI of 51.38 and 50.61 kWh/m2/year for Riyadh and Qassim, respectively, as shown in Table 8, which is 62.8% and 61.5% less than the current typical house designs for Riyadh and Qassim, respectively. Therefore, it is conceivable to plan and construct homes that use less than half of the quantity of energy as the current base case home in the middle region of the KSA if a BPS design process is incorporated. These outcomes were in line with the results presented by (Ahmed et al., 2019), who found that in the same climate region, a EUI of 72.5 kWh/m2/year can be achieved if a BPS EE design process is incorporated, which corresponds to 51.3% less than a base case typical design.
Energy and environmental savings summary.
Environmental impacts
According to (IEA Statistics, 2015) and (Krarti et al., 2017), electricity-generating in the KSA has carbon emissions set to be 0.757 kgCO2/kWh. Table 8 provides an estimation for the yearly reduction of CO2 emissions for different EE measures considered in this evaluation for both Riyadh and Qassim. Hence, it is possible to design homes which avoid 25,071kg and 23,133kg of carbon dioxide per year for both Riyadh and Qassim, respectively. This value is considered to be more than half of the amount of current base case CO2 emissions if EE measures of the proposed BPS-based design process are installed.
PV system on roof
Technical analysis
The simulation results shown in Figure 21 illustrate the average monthly energy supplied to the grid, which collectively represents the total energy injected into the grid to about 21.177 and 20.726 MWh/year for Riyadh and Qassim, respectively. The overall energy injected to the grid during the project lifetime of (25 years) is 529.42 and 518.15 MWh for Riyadh and Qassim, respectively, assuming no energy yield degradation in the rated output power of PV modules. The simulated yearly YF are 1890.9 and 1850.5 (equation (3)) for Riyadh and Qassim, respectively. This means that under this region’s weather conditions, the PV system can produce its rated power for the corresponding YF times in one year. The monthly YF for Riyadh varied from130 to 174.4 and from 124.4 to 175.5 for Qassim, as shown in Figure 22. These results are in line with results found by other researchers for PV grid-connected systems in GCC; for instance, 2024.7 in the KSA (Almarshoud, 2017) (1MWp), 1696.6 in Oman (Kazem and Khatib, 2013) (1kWp), and 1861–1922.7 in Kuwait (100kWp) (Ali Hajiah et al., 2012).
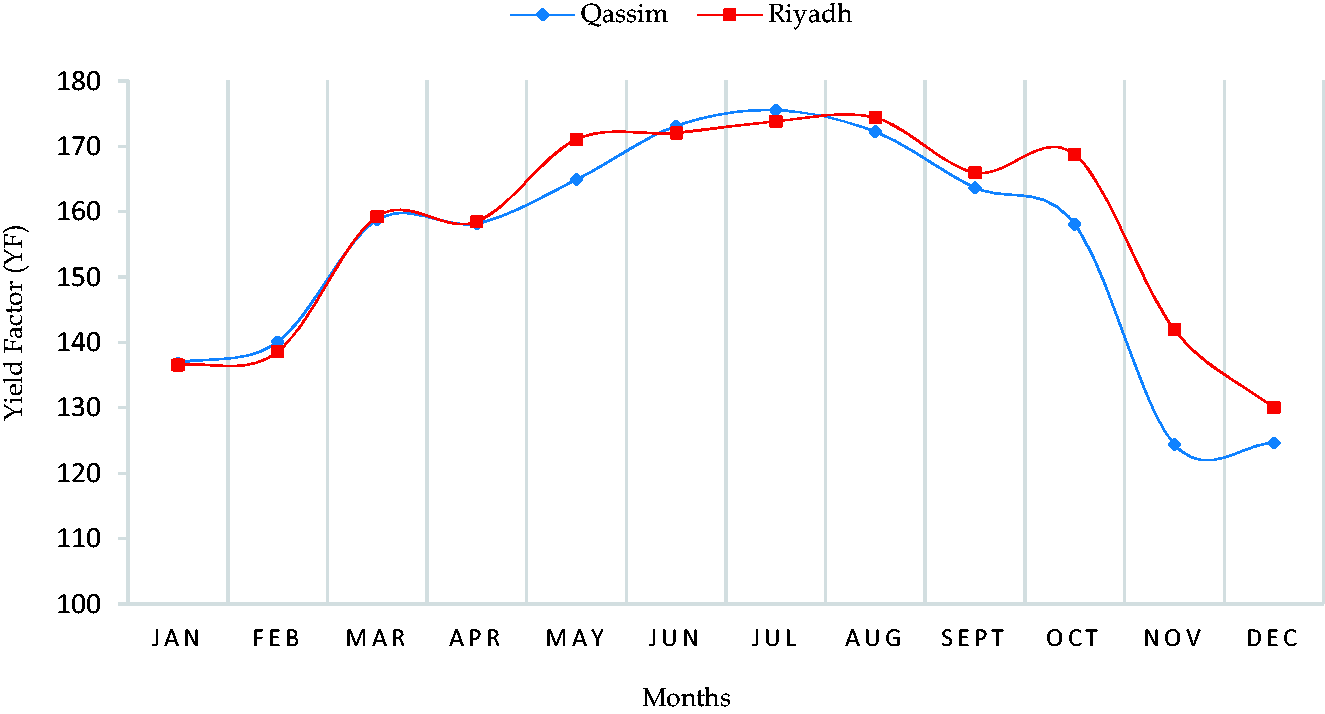
Monthly yield factor (YF).
The simulated CF is 21.5% for Riyadh and 21.1% for Qassim (equation (4)). These results are in line with results found by other researchers for PV grid-connected systems in GCC; for example, 23.1% in the KSA (Almarshoud, 2017) (1MWp), 19.64% in Oman (Kazem and Khatib, 2013) (1kWp), and 21.6–22.5 in Kuwait (Ali Hajiah et al., 2012) (100kWp). The simulated annual PR is 87.8% and 85.9% for Riyadh and Qassim, respectively (equation (5)). However, percentage varied from 81.8 to 91.7% for Riyadh and from 82.1 to 91.9% for Qassim, as shown in Figure 23. These results are similar but higher than the results found by (Khan et al., 2017), who stated that a typical performance ratio ranges between 75% and 84% in the KSA. However, performance ratio values have evolved from 70% – 80% in the 1990s to greater than 80% currently (Van Sark et al., 2012).
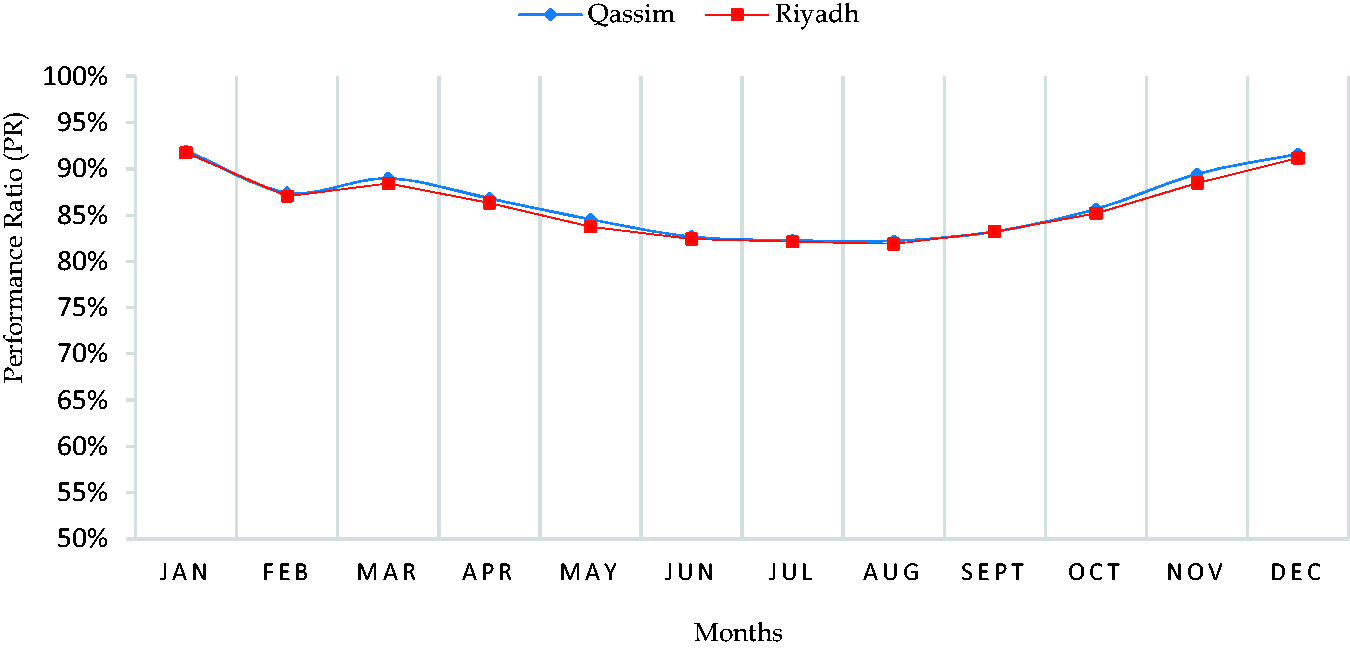
Monthly performance ratio (PR).
Economic analysis
The economic analysis outcomes in Table 9 indicate that the LCOE for the system under investigation was 0.1052 SR/kWh (0.0281 $/kWh) (equation (7)). These findings were encouraging compared to results found by other researchers for PV grid-connected systems in GCC; for example, 0.0359 $/kWh in the KSA (Almarshoud, 2017), (1MWp), 0.158 $/kWh in Oman (Kazem and Khatib, 2013) (1kWp), and 0.1 $/kWh in Kuwait (Ali Hajiah et al., 2012) (100kWp). According to (Almarshoud, 2017), in 2015, other countries reported a higher LCOE; for example, in ($/kWh); 0.051 – 0.09 in Brazil, 0.053 – 0.09 in China, 0.061 – 0.1 in France, 0.051 – 0.069 in Morocco, 0.049 – 0.076 in Spain, and 0.047 – 0.076 in the USA. SPBT is one of the most important indicators for an economic feasibility study. As shown earlier in equation (8), SPBT depends mainly on the price of exported electricity to the grid, which is set to 0.07 SR/kWh (0.019 $/kWh) as officially declared by (Electricity & Cogeneration Regulatory Authority (ECRA), 2019). Therefore, the number of years needed to offset the initial investment for our proposed PV system exceeds the life of the project (25 years), which results in a negative value of the IRR as shown in Figure 24. Negative IRR means the sum of post-investment cash flow is less than the initial investment. These findings confirm that the proposed on-roof PV system with the official export tariff for the residential sector is economically unviable.
LCOE analysis and detailed costs.
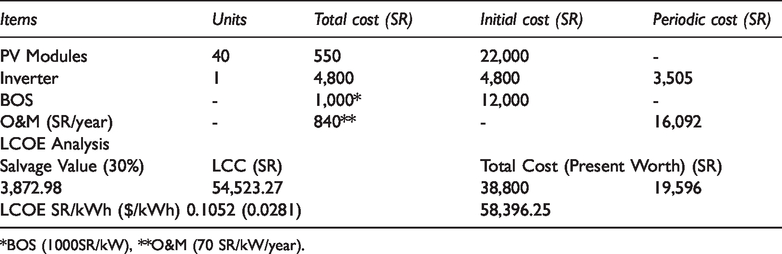
*BOS (1000SR/kW), **O&M (70 SR/kW/year).
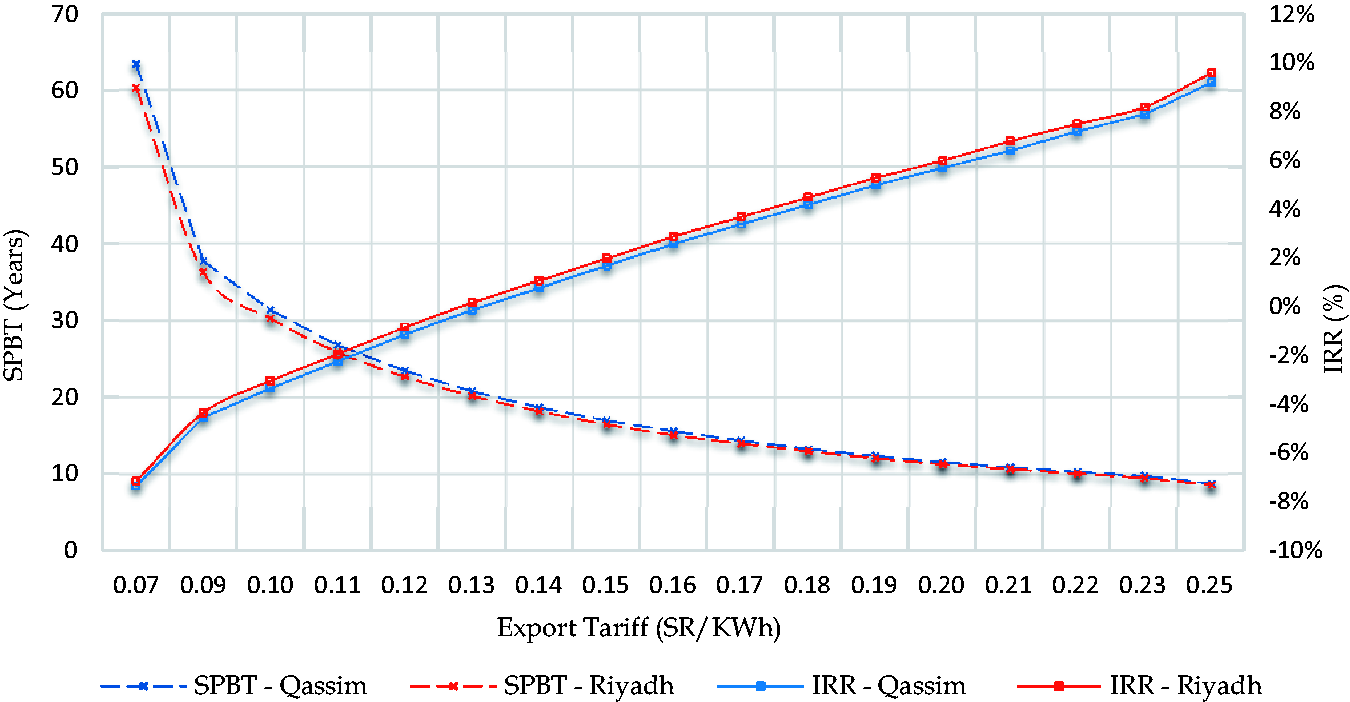
Effect of export tariff on economic indicators of the proposed on-roof PV system.
Therefore, different export tariffs should be looked at to determine if the government should consider increasing the export tariff as a PV incentive program and by how much. The SPBT is 13.42 years if the energy produced by the proposed on-roof PV system is exported to the grid at an export tariff of 0.18 SR/kWh, as shown in Figure 24, which is equivalent to the new tariff of the SEC for the residential sector. However, IRR is positive when the export tariff is 0.14 SR/kWh and above, which reflects the economic feasibility of the project. These results are in line with those found by(Almarshoud, 2017): 13.7 years at an export tariff of 0.18 SR/kWh. Also, these results are in line with the result found by (Abd-ur-Rehman et al., 2018) regarding SPBT and IRR.
Environmental effect
Building materials and photovoltaic systems have a great influence on carbon emission (Luo and Lu, 2020). Likewise, the estimated greenhouse gas (GHG) emission reduction result of utilizing the PV system for base case building in both Riyadh and Qassim, the middle region of the KSA, is about 16,030 and 15,689 kgCO2 per year, respectively. This quantity of GHG emissions is equivalent to about 36 to 37 barrels of crude oil.
Conclusions
To achieve controlled energy consumption in the residential sector, EE measures implementation on the building envelope is of utmost importance. In the research findings, Riyadh and Qassim showed relatively similar energy conservation when applying EE measures. This study also highlights the significance of a high-efficiency HVAC system and its effect on energy consumption along with envelope insulation. Furthermore, in the KSA, residential buildings have relatively high energy consumption by area. However, it lies between 131–138 kWh/m2/year in the current study. The research suggests the government should incorporate the BPS design process along with EE regulations to ensure energy-efficient homes to be green sector.
As far as EE measures for the building envelope are concerned, walls, roof, and windows should be considered first that make energy conservation possible. In Riyadh, EE measures are responsible for a reduction in energy consumption by 27% for walls, 14% for a roof, and 6% for window, and by 29%, 13%, and 6% for walls, roof, and windows respectively, for Qassim. However, the most impactful EE solution is selecting an HVAC system with a high EER, which can manage a reduction in energy intake by 33% and 32% for Riyadh, and Qassim, respectively. BPS based on EE design measures confirmed that SBC 602 made 62.8% and 61.5% reduction in energy intake for Riyadh and Qassim, respectively. These findings proposed the implementation of the SBC 602 for energy conservation to make residential area a green sector.
Furthermore, forty-two housing projects are containing 13,667 houses that are similar to the construction design of the case study building, 3354 of which are located in Riyadh and Qassim. These outcomes showed that use of the proposed BPS based on EE design measures of SBC 602 possesses a considerable potential to reduce energy intake. Moreover, in KSA, the solar energy on-roof PV system is investigated to fulfill partial energy needs in the residential buildings that may reduce GHG emissions. However, the findings outline the necessity for an incentive program to encourage and promote solar energy in residential buildings that can elevate the energy security and sustainability of the country.
The results are partially calculated and thoroughly compared with similar studies in the KSA, GCC, and other worldwide countries. This study was only valid for the KSA’s middle region climate, including regions with a similar climate. However, energy preservation varies with building designs. The margin of error is possible due to statements depending upon factors linked to occupants' behaviours.
Footnotes
Declaration of conflicting interests
The author(s) declared no potential conflicts of interest with respect to the research, authorship, and/or publication of this article.
Funding
The author(s) received no financial support for the research, authorship, and/or publication of this article.