
Abstract
One of the challenges in evaluating and estimating the gas storage and migration of coal has been the investigation of complex pore structures, especially in the nanoscale. The present study provides new insights into nanoscale pore types, and the genesis, classification, and structure characteristics of high-rank coal by investigating 10 anthracite coals in the Shanxi Formation and Taiyuan Formation of the Xinjing Coal Mine in the Qinshui Basin, North China. A series of experiments that combined the qualitative observation method of argon ion polishing technology in combination with field emission-scanning electron microscope and quantitative analysis methods of low-pressure N2 gas adsorption and mercury intrusion porosimetry were performed to characterize nanoscale pore structures and its influence on gas behavior. The results revealed that various types of nanoscale pores exist in the coal matrix. Descriptive classifications for nanoscale pores consist of three major groups (organic matter pores, mineral-related pores, and micro-fractures), and nine subtypes was summarized to correlate pores to the networks. Furthermore, mercury intrusion porosimetry, low-pressure N2 gas adsorption, and image processing were combined to determine the pore size distributions, indicating that pore sizes are bimodally distributed with two broad peaks. The major peak at approximately 20–400 nm was mostly associated with isolated microscopic organic constituents interparticle nanopores, while a minor but prominent peak at the macro-pore to micro-fracture scale was more associated with epigenetic pores, mineral-related pores, and micro-fractures. Furthermore, image processing also provides a specialized approach to reveal the structure and diameter of different types of nanoscale pores. The combination of quantitative test and qualitative observation indicate that different major pore types dominate each size range of reservoir space in coal. These results lead to a feasible assumption that the poor connectivity of nanoscale pores and lack of seepage channels between the nanoscale pores and fracture-cleat networks may have led to the low “micro-permeability” of the coal matrix, which affects the productivity of coalbed methane in high-rank coal.
Keywords
Introduction
Coalbed methane (CBM), which is an important type of unconventional gas resource, has recently received renewed interests due to its large reserves and good exploration potential (Lau et al., 2017; Moore, 2012). Unconventional reservoirs are characterized by very small porosity and large specific surface areas (Clarkson et al., 2012; Gan et al., 1972; Ge et al., 2016; Loucks et al., 2009, 2012; Mastalerz et al., 2013; Nelson, 2009). When evaluating CBM resource, micro-scale pore structure is usually taken into consideration as a critical parameter, which controls the storage capacity and migration efficiency of gas. Pore structure characterization, including morphology, pore size distribution (PSD), surface area, pore volume, and connectivity, has been greatly drawing the attention of geologists, and it is also a key challenge in reservoir studies. In particular, pores in high-rank coal are even smaller and predominantly exist in the nanoscale (Gan et al., 1972; Nelson, 2009; Wang et al., 2007; Yao et al., 2011). This tiny pore dimension has contributed to a practical “Bottle-Neck” problem in improving CBM productivity (Fu et al., 2004). This tiny pore dimension is responsible to the “Bottle-Neck” problem in CBM productivity, a phenomenon characterized by high gas content coupled with low productivity and rapid decline after the initial stage of gas production (Fu et al., 2004). In order to cope with these, a more accurate description on micro-structure is in need. Moreover, the threat of gas bursting out in high-rank coal mines, the CO2 geological storage technology of storing extra CO2 in deep coal seams, and the study of methane recovery have all placed new challenges in further investigating the nanoscale pore characteristics of coal (Gamson et al., 1996; Karacan et al., 2011; Liu et al., 2015; Okolo et al., 2015; Zhao et al., 2017a).
These pore structures are inherently heterogeneous and multiscale from nanometer to millimeter in coal seam. Pervious literatures have revealed that pores in the nanoscale (<1 μm) occupy a predominate volume in high-rank coal, providing a large surface area for absorbed gas and storage space for free gas (Mastalerz et al., 2013; Yao et al., 2011). In high-rank CBM reservoirs, adsorbed gas may account for more than 90% of the total gas content (Jarvie et al., 2007; Laubach et al., 1998; Matthews, 1996; Su et al., 2001). Therefore, the nanoscale pore system is one of the core elements of CBM accumulation, which should be a research priority (Karacan, 2003; Matthews, 1996; Niu et al., 2017). Numerous techniques are available to characterize the micron structure of pores. Low-pressure N2/CO2 adsorption, small angle X-ray scattering, and mercury intrusion porosimetry (MIP) have been commonly used to quantify surface areas, PSDs, and their topological correlation (Fu et al., 2017; Krooss et al., 2002; Zhang et al., 2010; Radlinski et al., 2004; Sing, 1985; Kuila and Prasad, 2013; Okolo et al., 2015; Pan et al., 2016; Patrick et al., 2004; Thommes, 2010). The morphology, connectivity, and diameters of pores can also be observed directly through an electron microscope. Micron scale pores have been identified by scanning electron microscope (SEM) and distinguished as primary pores, metamorphic pores, epigenetic pores, mineral pores, etc. (Gan, 1972; Zhang, 2001). Molecular pores were depicted using an atomic force microscope with an extremely high resolution (Pan et al., 2015; Yao et al., 2011). However, studies on nanopores in high-rank coal between the micron scale and molecular scale are relatively rare, and the descriptive classifications of nanoscale pores have not been summarized at present. Moreover, the combination of qualitative and quantitative tests needs to be further strengthened. Hence, determining a suitable method for the direct observation and morphological study of the nanoscale structure of coal has become a hot spot in the study of coal reservoirs (Yao et al., 2011; Zhao et al., 2017a; Zhang, 2001). Coal is richer in organic matter (OM), when compared with shale and tight sandstone, making it delicate in texture and more difficult to polish. However, argon ion polishing (AIP) technology in combination with field emission-SEM (AIP-FESEM) has been recently successfully applied in shale samples, which inspires that this method could be applied to coal as a new nanoscale observation alternative (Klaver et al., 2015; Loucks et al., 2009; Mastalerz et al., 2012). In this condition, pores between the molecular scale (<10 nm) and micron scale (>0.1 μm) are the major research targets.
The present study explored the use of AIP-FESEM in combination with MIP and low-pressure N2 gas adsorption (LP-N2GA) to have a deeper understanding of nanoscale pores and the pore network system in anthracite coals. The morphological properties, PSDs, genesis, connectivity, and network characteristics were studied using 10 samples obtained from the Permian Shanxi Formation and Taiyuan Formation in the Xinjing coal mine, Shanxi Province, North China. Argon Ion Source Milling tools were adopted to prepare the smooth and true-two-dimensional (2D) surfaces of coal samples and image nanoscale porosity down to 10 nm. MIP, LP-N2GA, and FESEM image processing were used to quantitatively study the pore volume, specific area of distribution, and PSD. The description and classification of nanopores were presented based on high-resolution FESEM images. As far as the investigators are concerned, the present study is perhaps the first to attempt to present the nanoscale pore classification for high-rank coal and investigate the pore system by correlating pore type and genesis to radius. Furthermore, a detailed study on nanoscale pore structure would lay a foundation for future investigations on gas behavior and the transportation of CBM and their controlling factors in high-rank coal.
Geological setting and samples
The studied samples were directly taken from the working faces in the Xinjing coal mine of the Shouyang–Yangquan monocline zone (Figure 1). The Xinjing coal mine is located at the northeastern margin of the Qinshui basin, which is the prospective exploration and exploitation target district of CBM resources in China (Su et al., 2005; Yao et al., 2008). The Qinshui basin is an important hydrocarbon basin that evolved from the Late Paleozoic Northern China’s Craton. The width of the basin is over 330 km, covering an overall area of approximately 23.5 × 10³ km2. It is surrounded by the uplifts of the Taihang Mountain and Huo Mountain in the east and west. To the north, it is adjacent to the Wutai Mountain, while to the south, it is adjacent to the Zhongtao Mountain (Cai et al., 2011). The whole basin is a large synclinorium with a bilateral symmetry, which consists of several secondary southwest-northeast (SW-NE) trending monoclines, such as the Majuntou and west-east (W-E) trending Taohe monocline. The geological structure of the studied area is relatively complicated due to the continuous interaction of two tectonic belts in the W-E and northnortheast-southsouthwest (NNE-SSW) directions. In addition, the magma intrusion on the bottom of the coal measure strata in middle-late Mesoic Era also helps to shape the tectonic structure.
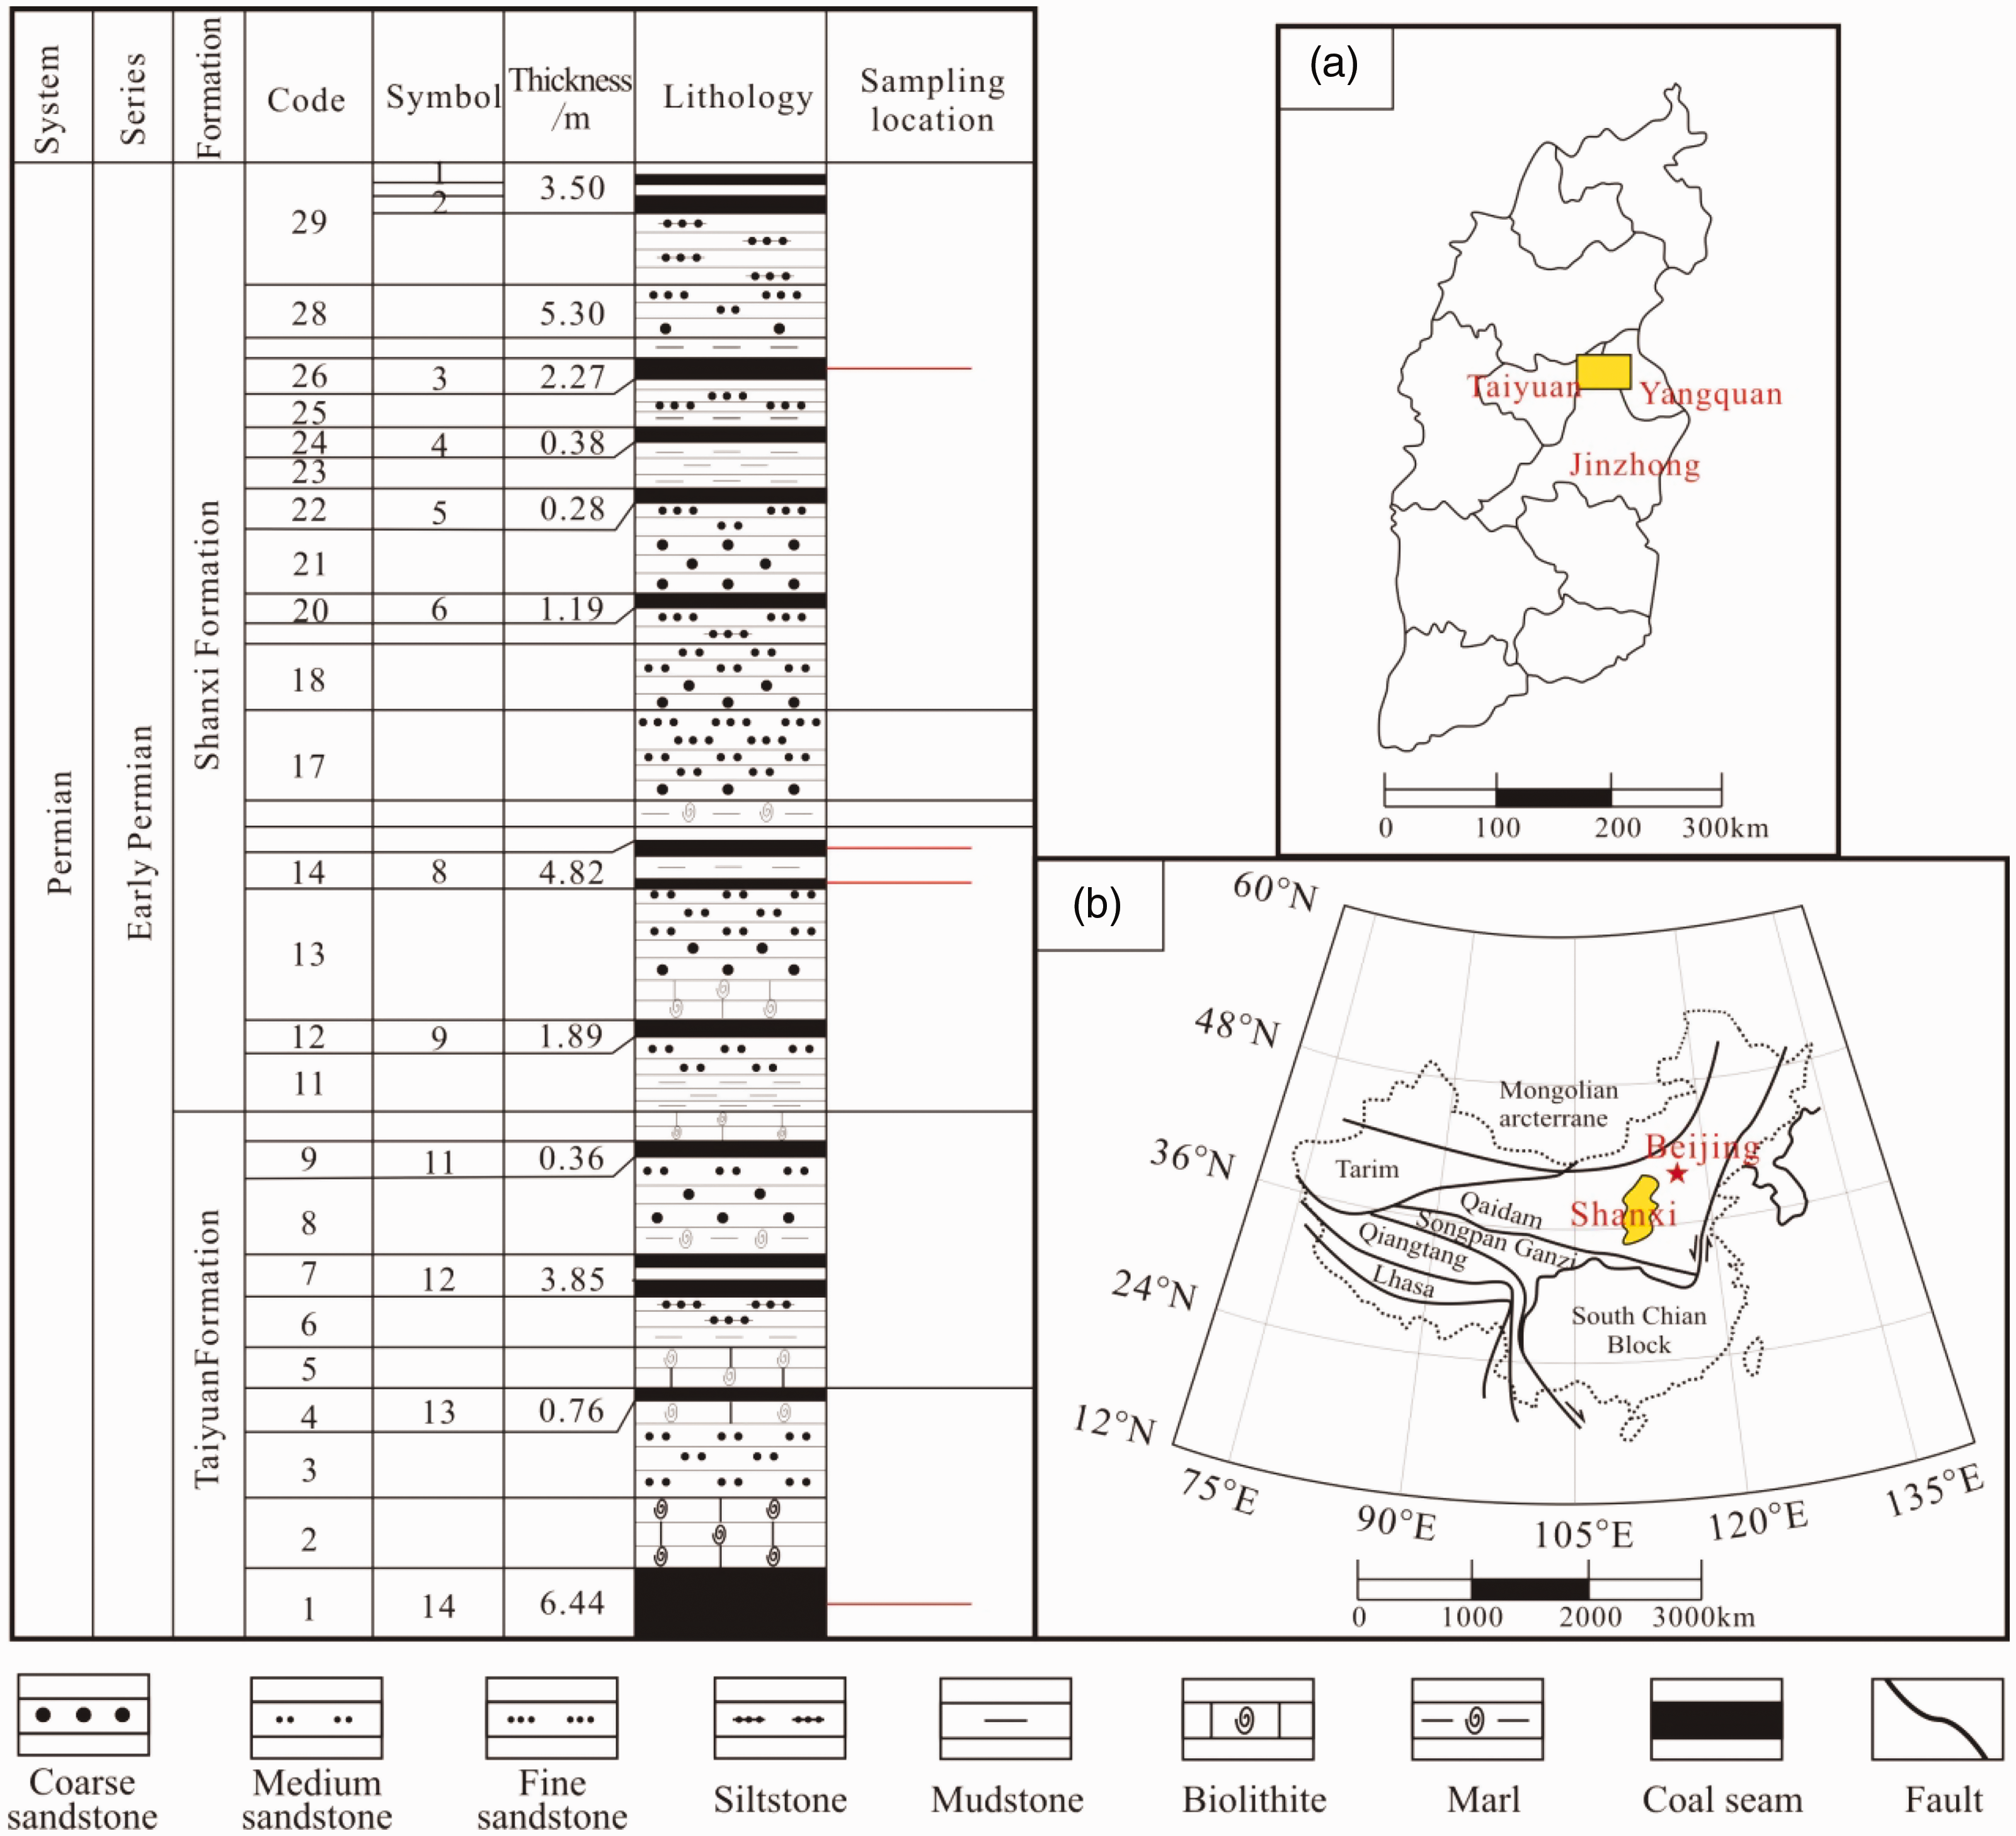
Geographic and stratigraphic locations of studied Early Permian coals in research area.
The North China Craton Basin was uplifted and eroded from Silurian to early Carboniferous and received sediments from the Pennsylvanian to Triassic time (Su et al., 2005). The cores from the Xinjing coal mine in the Yangquan area revealed that the Upper Palaeozoic strata in the studied area include the Carboniferous Benxi Formation and Taiyuan Formation as well as the Permian Shanxi, Shihezi, and Shiqianfeng Formation. The investigated samples originated from the Taiyuan formation and Shanxi Formation, both of which are coal bearing strata with an average thickness of 150 m (Lv et al., 2012). The Taiyuan Formation is deposited in a transgressive compound sedimentary system, which includes the barrier island in the epicontinental sea and carbonate platform. The Shanxi Formation deposited mainly in a terrestrial delta of a high-stand system tract. The coal-bearing sequence in those two formations is represented by sandstone, mudstone, limestone, and coal seam. There are 15 coal beds developed in the Taiyuan and Shanxi formations. Among these, the No. 3 and No. 15 coals are the major economic coal seams that are rather larger in thickness and have a more extensive distribution and more steady development. The analyzed coal samples from approximately 600 to 700 m in depth were the No. 3, No. 8, and No. 15 coal seams. All coal samples from the Shanxi and Taiyuan Formations were anthracites with high maturity.
The age, formation, and types of the tested 10 samples are shown in Table 1. Samples from Shanxi formation are labeled with SX, while samples from Taiyuan formation are labeled with TY. The petrologic characteristics are summarized in Table 2. According to International Organization for Standardization (ISO)-11760 (2018), the coal samples were all anthracites with mean maximum reflectance values (Ro,max) ranging from 2.20% to 3.41%, indicating a high metamorphic grade. All samples were vitrinite-rich. The average volume fraction (vol. %) of vitrinite was 91.33%, followed by inertinite, which had an average volume fraction of 5.71%. The contents of other maceral compositions were relatively low, and the average volume fraction (vol. %) of minerals ranges from 0.5% to 6.4%. As revealed by the proximate analysis results, the moisture contents of the samples varied from 0.76% to 1.37% (wt. %), the volatile contents varied from 2.39% to 5.48%, and the ash contents varied from 8.99% to 22.8%, respectively. All samples were tested by MIP, and six of which were selected for further investigations using AIP-FESEM and LP-N2GA.
Basic information of source, age, formation, type, and number of coal samples used.
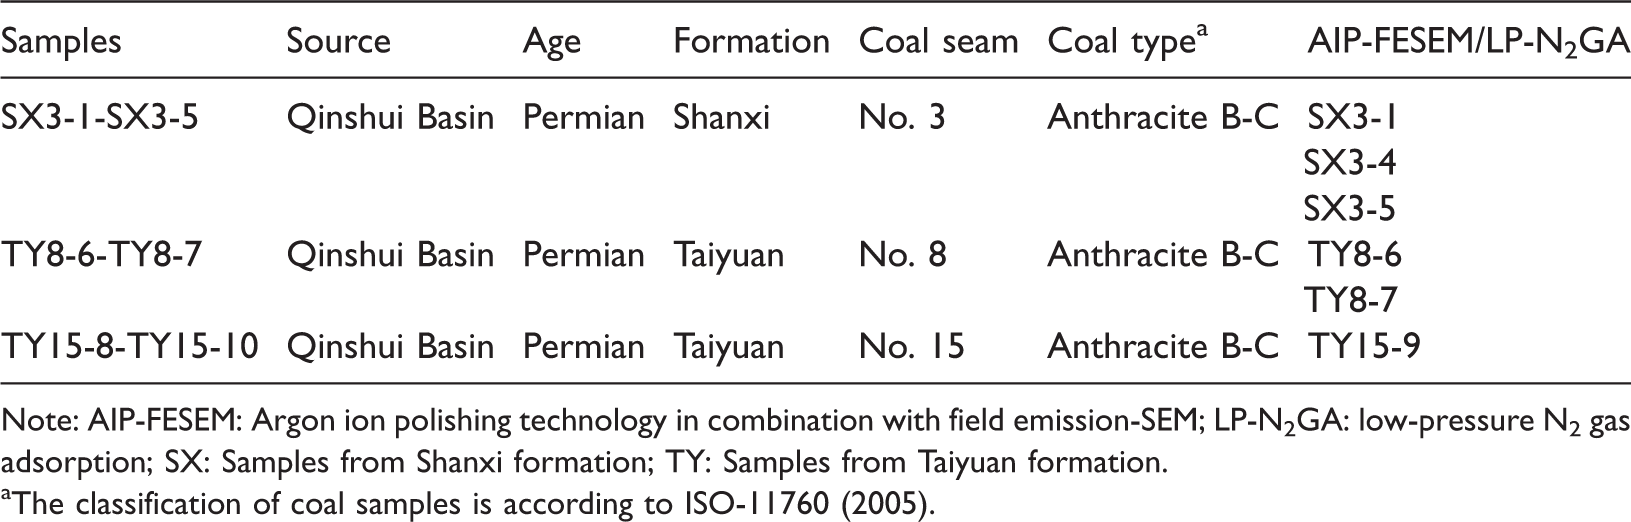
Note: AIP-FESEM: Argon ion polishing technology in combination with field emission-SEM; LP-N2GA: low-pressure N2 gas adsorption; SX: Samples from Shanxi formation; TY: Samples from Taiyuan formation.
aThe classification of coal samples is according to ISO-11760 (2005).
Proximate analysis and optical characteristics of coal samples used.
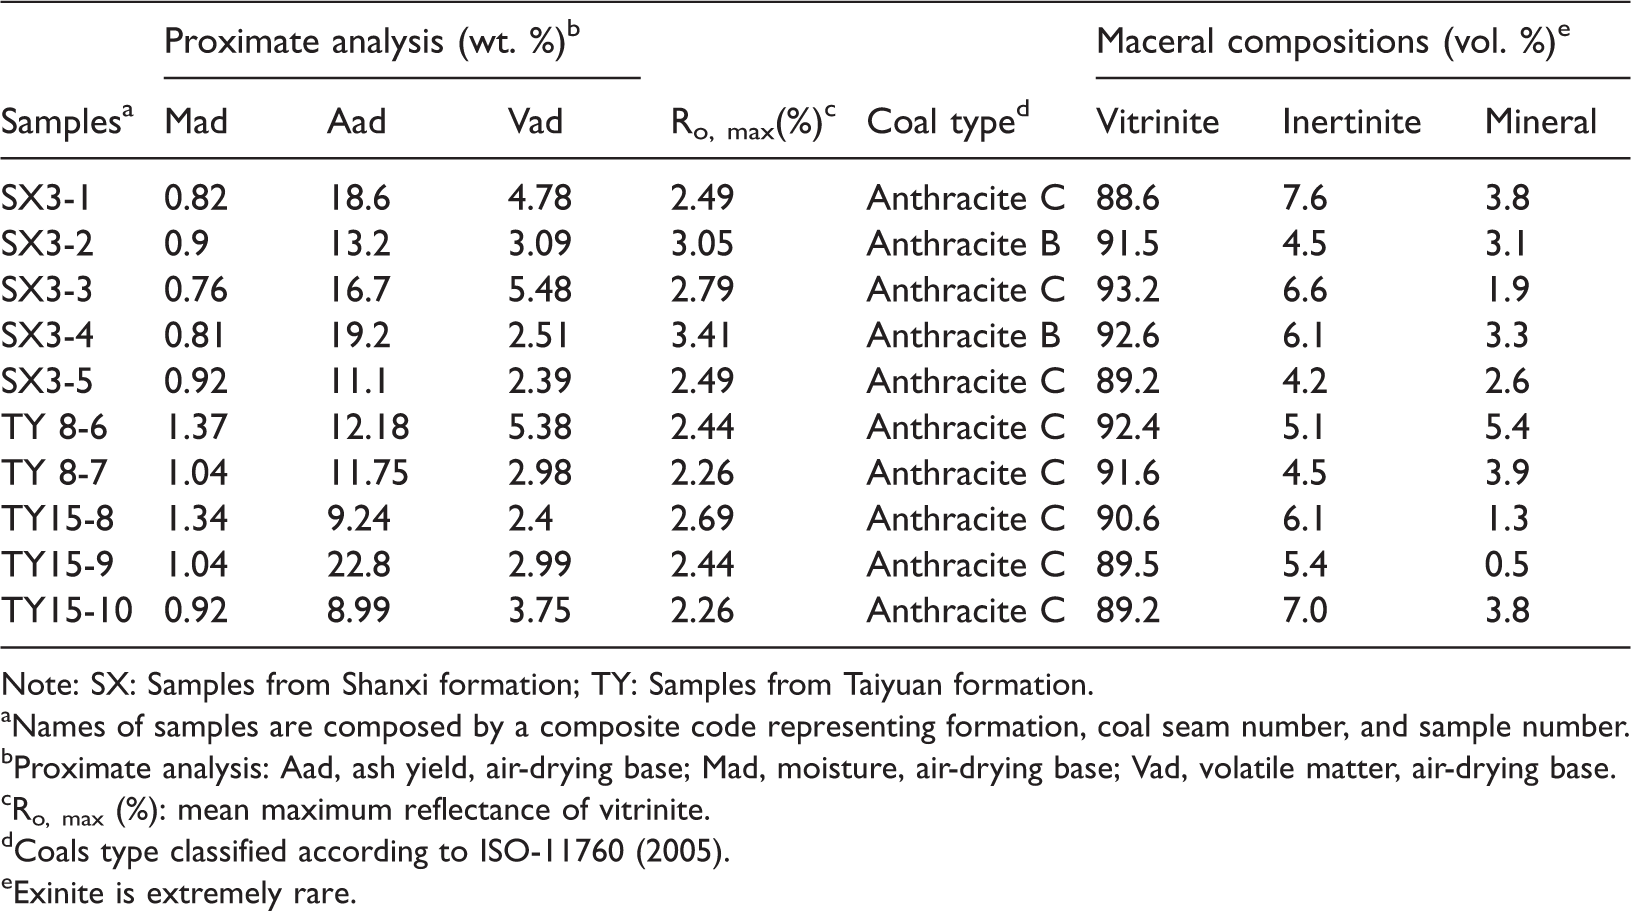
Note: SX: Samples from Shanxi formation; TY: Samples from Taiyuan formation.
aNames of samples are composed by a composite code representing formation, coal seam number, and sample number.
bProximate analysis: Aad, ash yield, air-drying base; Mad, moisture, air-drying base; Vad, volatile matter, air-drying base.
cRo, max (%): mean maximum reflectance of vitrinite.
dCoals type classified according to ISO-11760 (2005).
eExinite is extremely rare.
Experimental methods
Argon ion polishing and FESEM
SEM imaging is the most direct approach to describe pore morphology and structure (Nadeau and Hurst, 1991; Ziegler, 2006). However, the application of SEM imaging is limited due to poor sample surface condition and low resolution of the apparatus when studying unconventional reservoirs. Argon ion source milling tools can produce a damage-free and reproducible surface with extremely high surface quality (Desbois et al., 2009; Loucks et al., 2009), and FESEM, which has high resolution, makes it possible to investigate pore morphology with dimensions as small as 10 nm.
Six samples were selected and cut, forming a cuboid of 10 × 8 × 2 mm3. Then, a pre-polishing instrument was used to remove a damaged layer with a thickness of approximately 100 μm. A flat and prepared surface with a square of 16 mm2 was chosen as the target and was placed perpendicular to the bedding and shielding plate (the specific process of this preparation is illustrated in Figure 2). Using a stand-alone argon beam machine to bombard the selected flat surface protruding from the shielding plate, a cross section of approximately 2 mm2 was obtained. As shown in Figure 2, the margin of this polished section usually has a pseudo Gaussian shape. The energy-dispersive X-ray spectroscopy (EDS) analysis was carried out using SEM equipped with energy dispersive spectrometer. At least three points were collected to acquire reliable composition of the as-prepared sample.
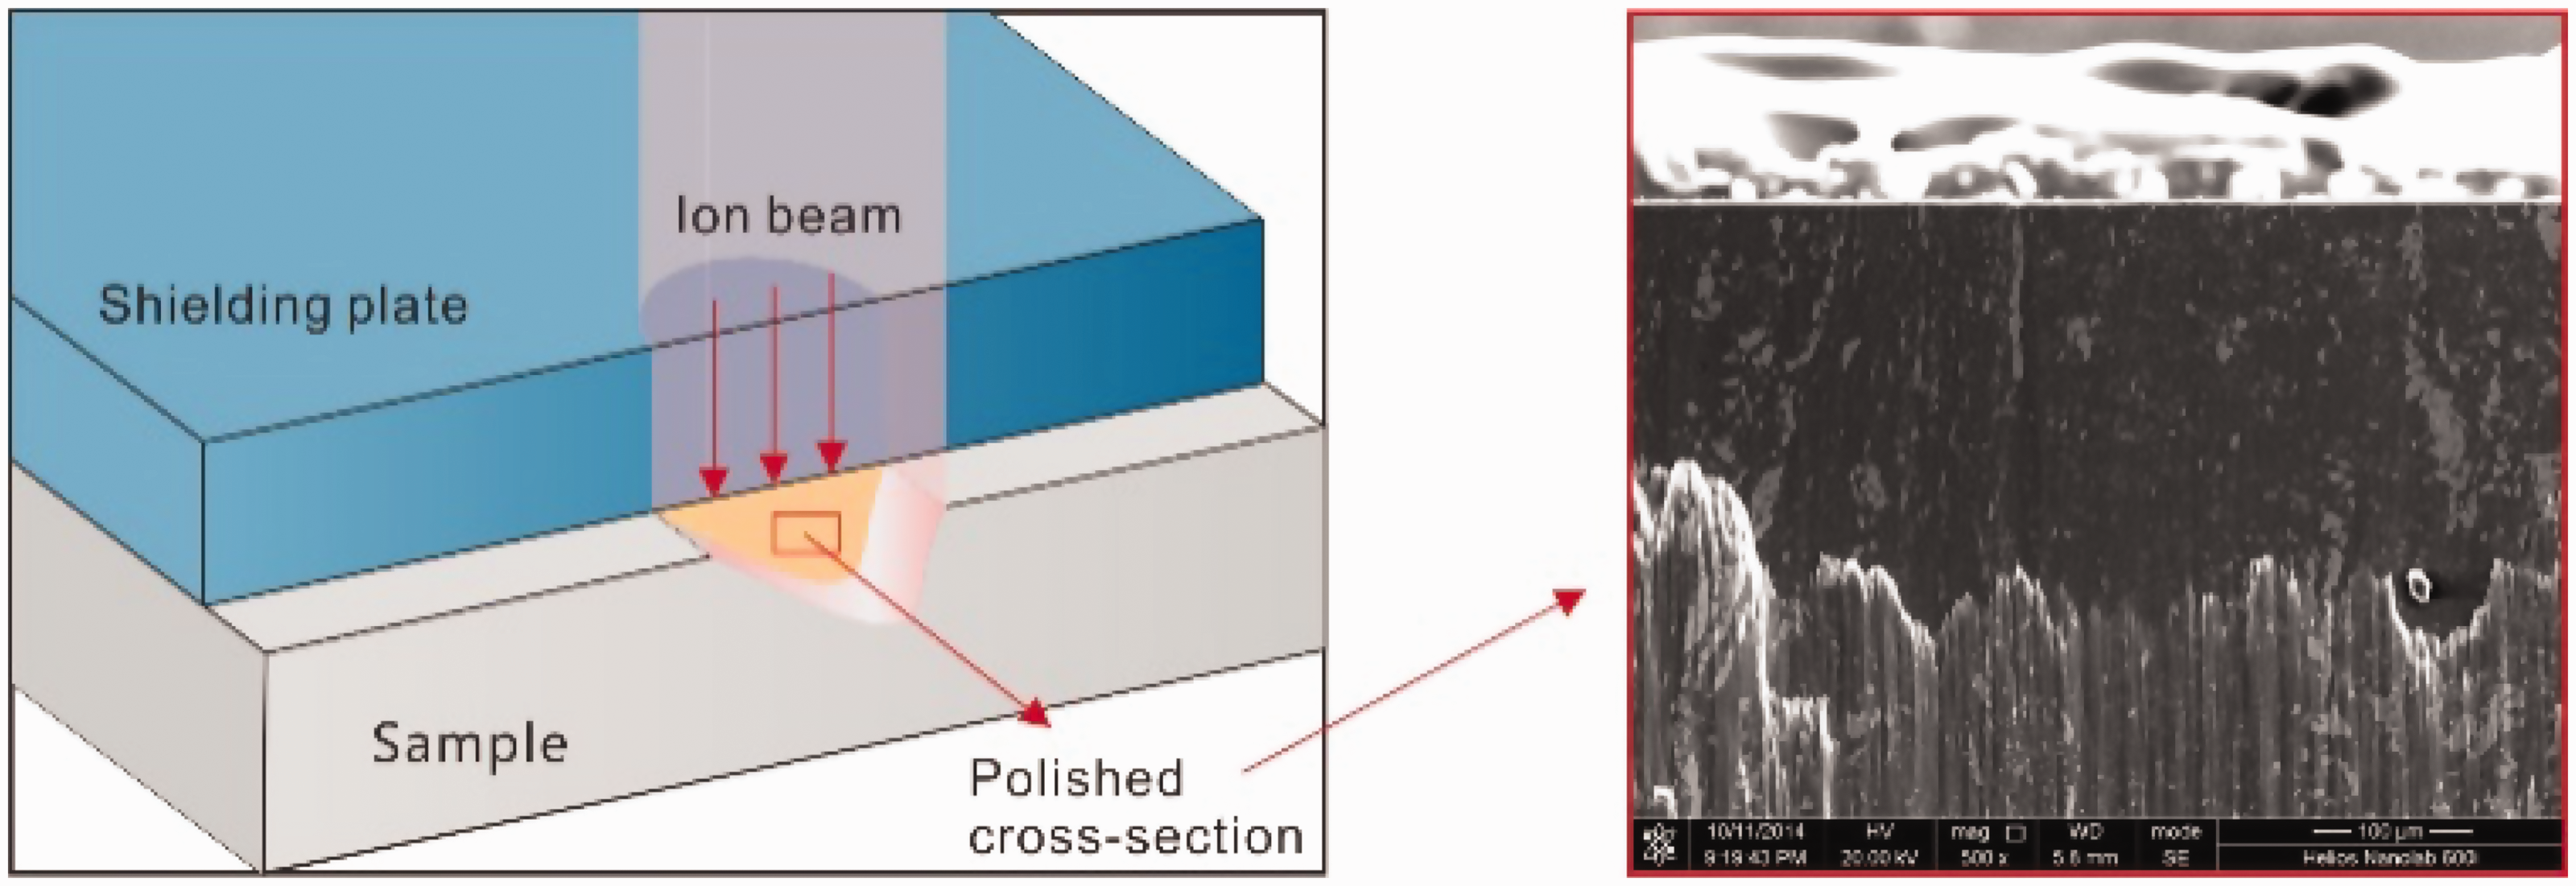
The principle of sample surface preparation and typical polished cross section of tested coal samples with OM, minerals, and pores can be differentiated by color.
The polished cross section was imaged using a focused ion dual beam SEM after being coated with a thin layer of gold. The electronic beam system of Helios Nanolab 600i used a Schottky vacancy field emission gun that carried a detector in draw tube to obtain an extremely distinct image with a resolution down to the sub-nanoscale. The S-4700 FESEM uses a cold cathode field emission gun in combination with a secondary electron (SE) detector. With even higher resolution compared with the former, it can characterize pore morphology and structure at a smaller scale. Every single image can be present in the Back-scattered Electron Detector or SE mode. The former is used for mineral identification in combination with EDS and facial rate statistical analysis, while the latter can provide detail information of the pore morphology.
Image processing was conducted on FESEM images. Firstly, the original images were transformed into binary images through grid sorting and segmentation. Then, pore areas in binary images were labeled, and regional information was collected. Structural parameters of 2D pore image including area, perimeter, length, and form factor were extracted by statistically analyzing the regional information of the pore area.
MIP and LP-N2GA measurements
MIP characterizes a material’s porosity by applying various levels of pressure to a sample immersed in mercury. The test was conducted using the AutoPore 9500, which has four low-pressure ports and two high-pressure ports for automatic pore structure studies from 3.6 nm to 105 µm. All coal samples were prepared by drying for 24 h, ensuring the elimination of the effect from bound water. The contact angle between the mercury phase and coal was 140°, and the Washburn equation was used to analyze the data.
LP-N2GA was carried out in China University of Mining & Technology using an Automated Pore Size Analyzer. The TriStar II can collect up to 1000 data points for measuring pores ranging from 3.5 Å to 5000 Å. Before the experiment, coal samples, weighing 2 g, were grounded into powder using 60–80 mesh, dried for 24 h at 120°C and outgassed under vacuum for 12 h. In order to describe these more properly, pores were classified into four pore-size types in the PSD study, according to a study conducted by Hodot (1966): macro-pores (>1000 nm), meso-pores (100–1000 nm), transitional pores (10–100 nm), and micro-pores (<10 nm).
Results and discussion
Morphological characteristics and description of pores
The material compositions in coals mainly consisted of OM, clay minerals, and granular minerals, such as quartz. As shown in the FESEM images (Figures 3 to 5), the color of gray represents OM, while the white to light–gray color indicates different minerals. The pores had a dark–gray to black color and were surrounded by bright artifacts derived from the coating process. As shown in the micrographs, the nanoscale pores were well developed, followed by micro-scale pores, while merely few micro-fractures (MFs) could be observed. A variety of matrix-related nanoscale pores were identified, which were divided into three types in order to characterize the nanoscale pore systems: OM nanopores, mineral-related pores and MFs.
OM pores
OM nanopores are well developed in high-rank coal (Figure 3). OM pores are considered as a common host for nanoscale pores, which forms during hydrocarbon generation in unconventional reservoirs. In the present study, three groups of OM nanopores (10 nm–10 μm) were further distinguished based on different morphological characteristics, spatial locations, and formation mechanisms: phyteral residual nanopores (OM-I), microscopic organic constituents interparticle nanopores (OM-II), and nanoscale thermal pores (OM-III).
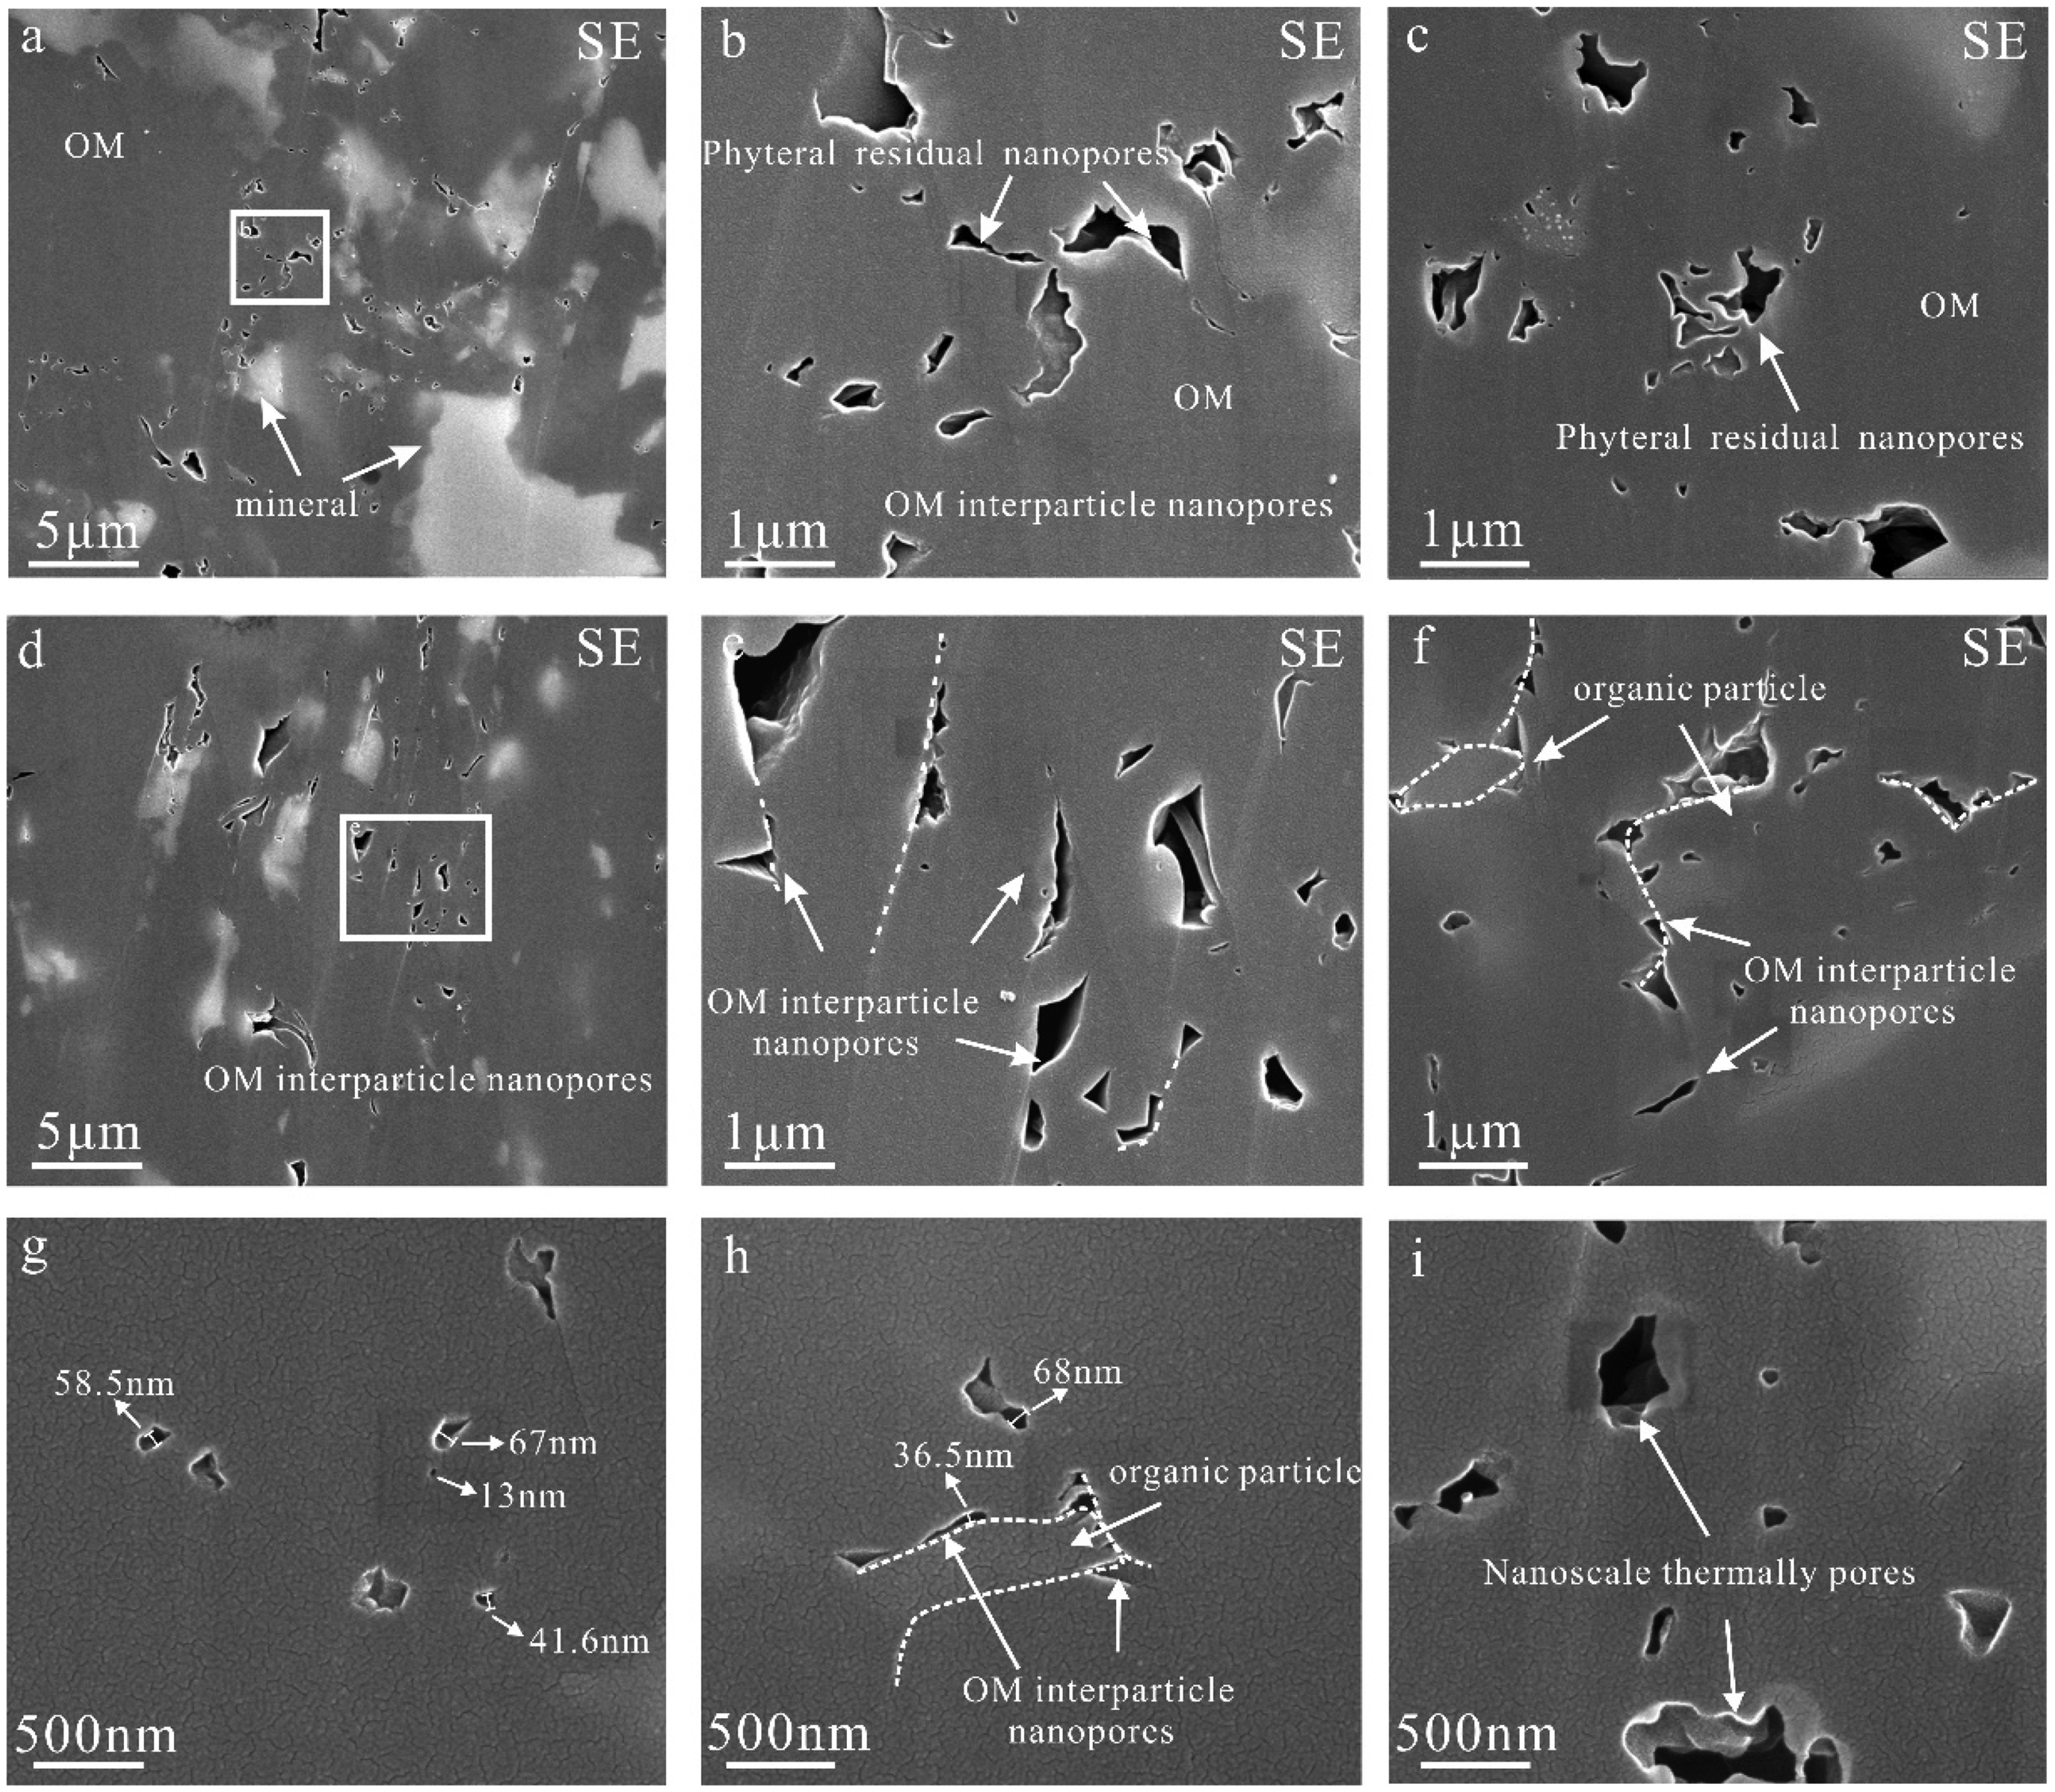
FESEM images (SE imaging) of nanopores in organic matrix of anthracite coals: (a to c) Phyteral residual nanopores, (d to h) interparticle nanopores between microscopic organic constituents, and (i) nanoscale thermally pores. Note that the highlighted areas were selected to make observation (corresponding to panel (b) and panel (e), respectively) at higher magnification. OM: organic matter; SE: secondary electron.
Phyteral residual nanopores (OM-I) were developed within the plant organic constituents with irregular morphology (Figure 3(a) to (c)). The shape of the inner surfaces of these phyteral residual nanopores was irregular and jagged.
OM interparticle nanopores (OM-II) are mainly presented in a place where microscopic organic constituents contact with diameters ranging between 10 nm and 3 μm but are more concerted within a diameter range of 10 nm to 200 nm. These usually form triangular, slit-shaped, and quadrilateral pore topographies with a rather simple inner surface structure (Figure 3(d) to (h)). Both OM-I and OM-II pores appeared isolated in 2D, showing relatively poor connectivity. Despite the similarity of appearance, OM-I and OM-II pores should be distinguished due to the different formation mechanisms.
Nanoscale thermal pores did not develop well in the nanoscale, when compared with micron scale (Figure 3(i)). It is easy to distinguish OM-III pores from OM-I and OM-II pores with a bigger pore size range, and spherical or ellipsoidal morphology, which may be the result of the huge gas pressure inside the pores. Based on the FESEM images, it was found that OM pores in the nanoscale were only partly created during hydrocarbon generation.
Pores with a diameter smaller than 10 nm are mainly metamorphic and intermolecular pores (Yao et al., 2011). However, the formation mechanisms of nanopores with diameters larger than 10 nm are different, when compared with molecular pores. Phyteral residual nanopores (OM-I) are the nanoscale residue original structure of plant tissues after the geological hydrocarbon generation process and forces of stress. OM interparticle nanopores (OM-II) are the results of micro-organic particle contacting and separation. Nanoscale thermal pores (OM-III) were formed in the process of gas generation inside of an OM.
Mineral-related pores
Mineral-related pores in the nanoscale have much lower quantity due to the low-mineral content in coal (Figure 4). Minerals in coal samples have been demonstrated to be quartz, clay and a small amount of pyrite, and heavy minerals, such as rutile, through EDS. Four groups of nanopores were identified based on the minerals and spatial locations: (1) M-I: pores at the mineralogical edge or on the contact points of several different material compositions (Figure 4(a)), (2) M-II: intragranular pores that developed within granular minerals (Figure 4(c)), (3) M-III: pores within clay mineral aggregates (Figure 4(d)), and (4) M-IV: pores between clay mineral particles (Figure 4(e)). M-I pores and M-II pores develop around or in granular minerals, such as quartz (Figure 4(a) to (c)). M-II pores usually develop in the intracrystalline of quartz with a circular or elliptical morphology, and an average diameter of <20 nm, and this might be intercepted fluid inclusions or growth defects of crystal (Figure 4(c)). Clay mineral pores are mostly correlated to the growth of authigenic minerals, such as kaolinite (Figure 4(c) to (e)). M-III pores are usually irregular shaped, while M-IV pores occur in lamellar cross sections that usually lay between two clay sheets with an elongated shape, and it is controlled by the orientation of clay sheets. In addition, M-I, M-III, and M-IV pores have a broad PSD that ranges from 10 nm to 5 μm, and better connectivity, when compared to isolated OM nanopores in the coal matrix and intraparticle M-II pores inside minerals.
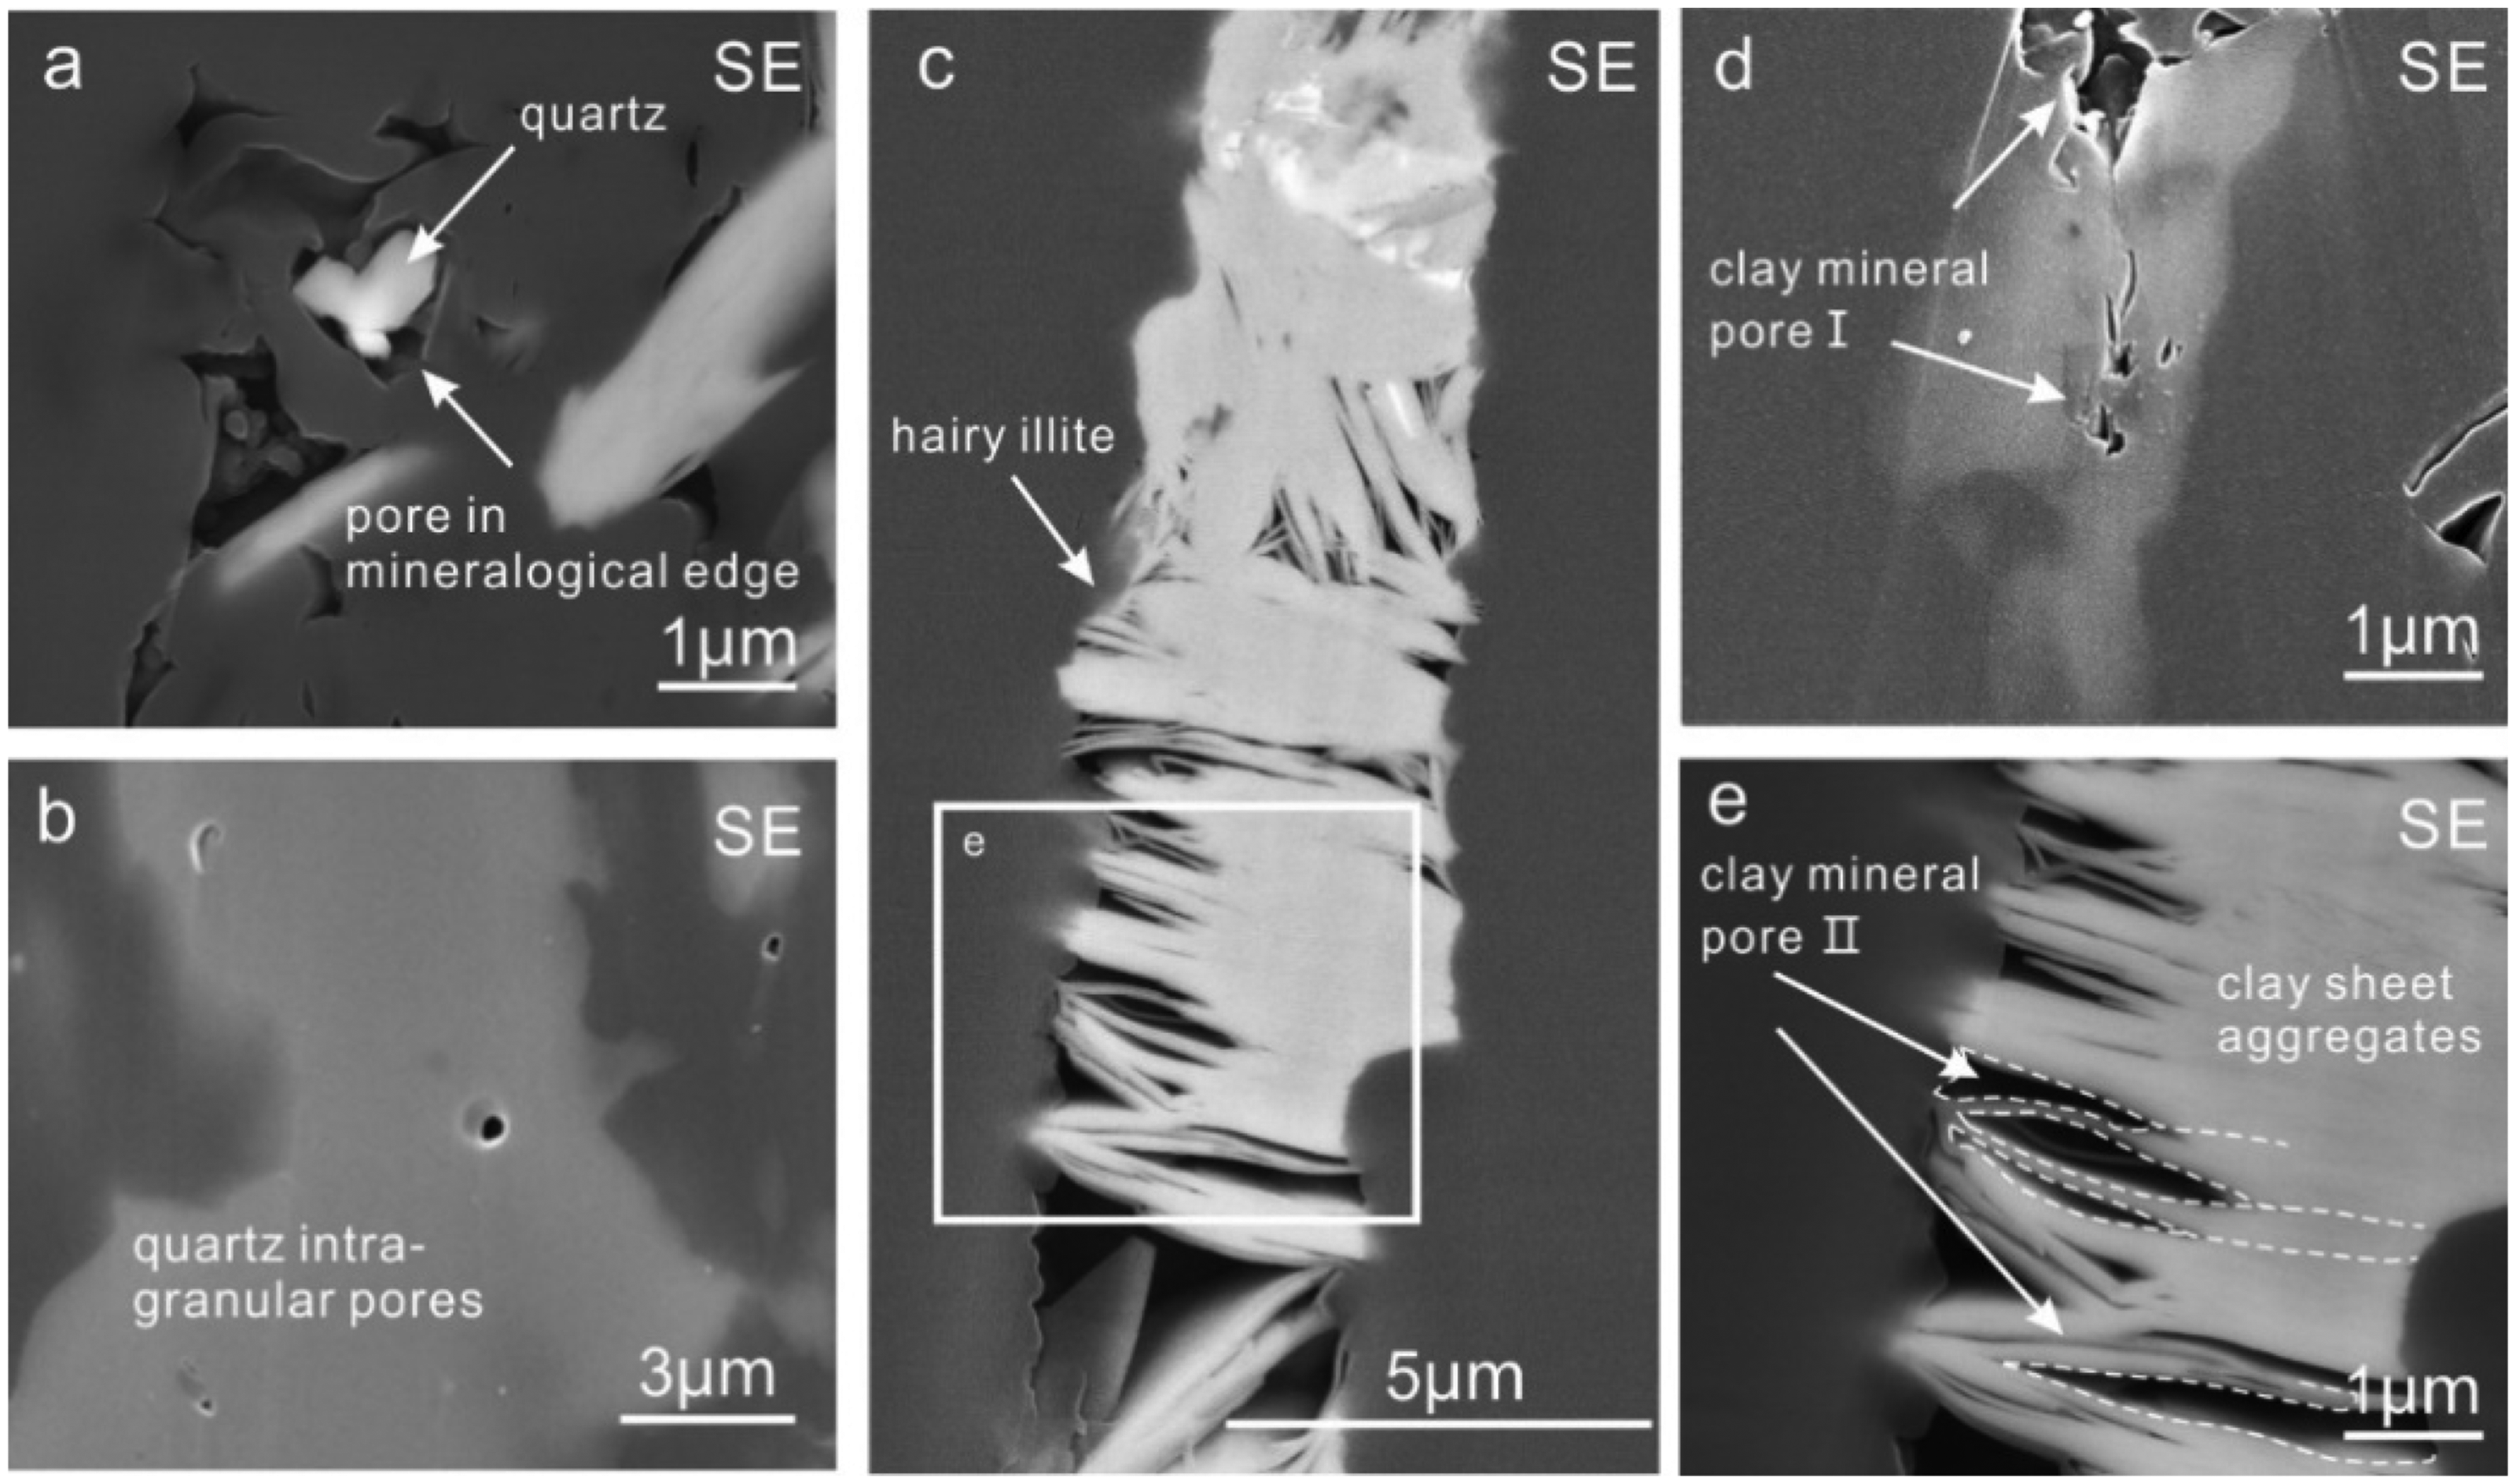
FESEM images (SE imaging) of mineral-related pores in anthracite coals: (a) pores in mineralogical edge, (b) quartz intragranular pores, (c) pores between clay sheets, (d) pores within clay mineral aggregate, and (e) pores between clay sheets. SE: secondary electron.
Micro-fractures
Few MFs are identified with a length of 5–20 μm and a width of 10 nm-3 μm. Two types of MFs with different geneses are distinguished by their appearance as follows: Fracture I (MF-I), expands along with the weak surface of the edge of minerals, connecting a series of pores in the mineralogical edge to form a continuous fracture (Figure 5(a) to (c)); fracture II (MF-II) mostly formed by stress in a larger scale (Figure 5(d) to (e)). Specifically, MF-I pores develop with more straight and smooth walls, while MF-II have a tearing morphology with jagged walls and zigzag margins. Fractures in the micro-scale, including cleats, fractures and cracks, were observed to have a relatively better development degree than MFs in the nanoscale (Figure 5(g) to (i)).
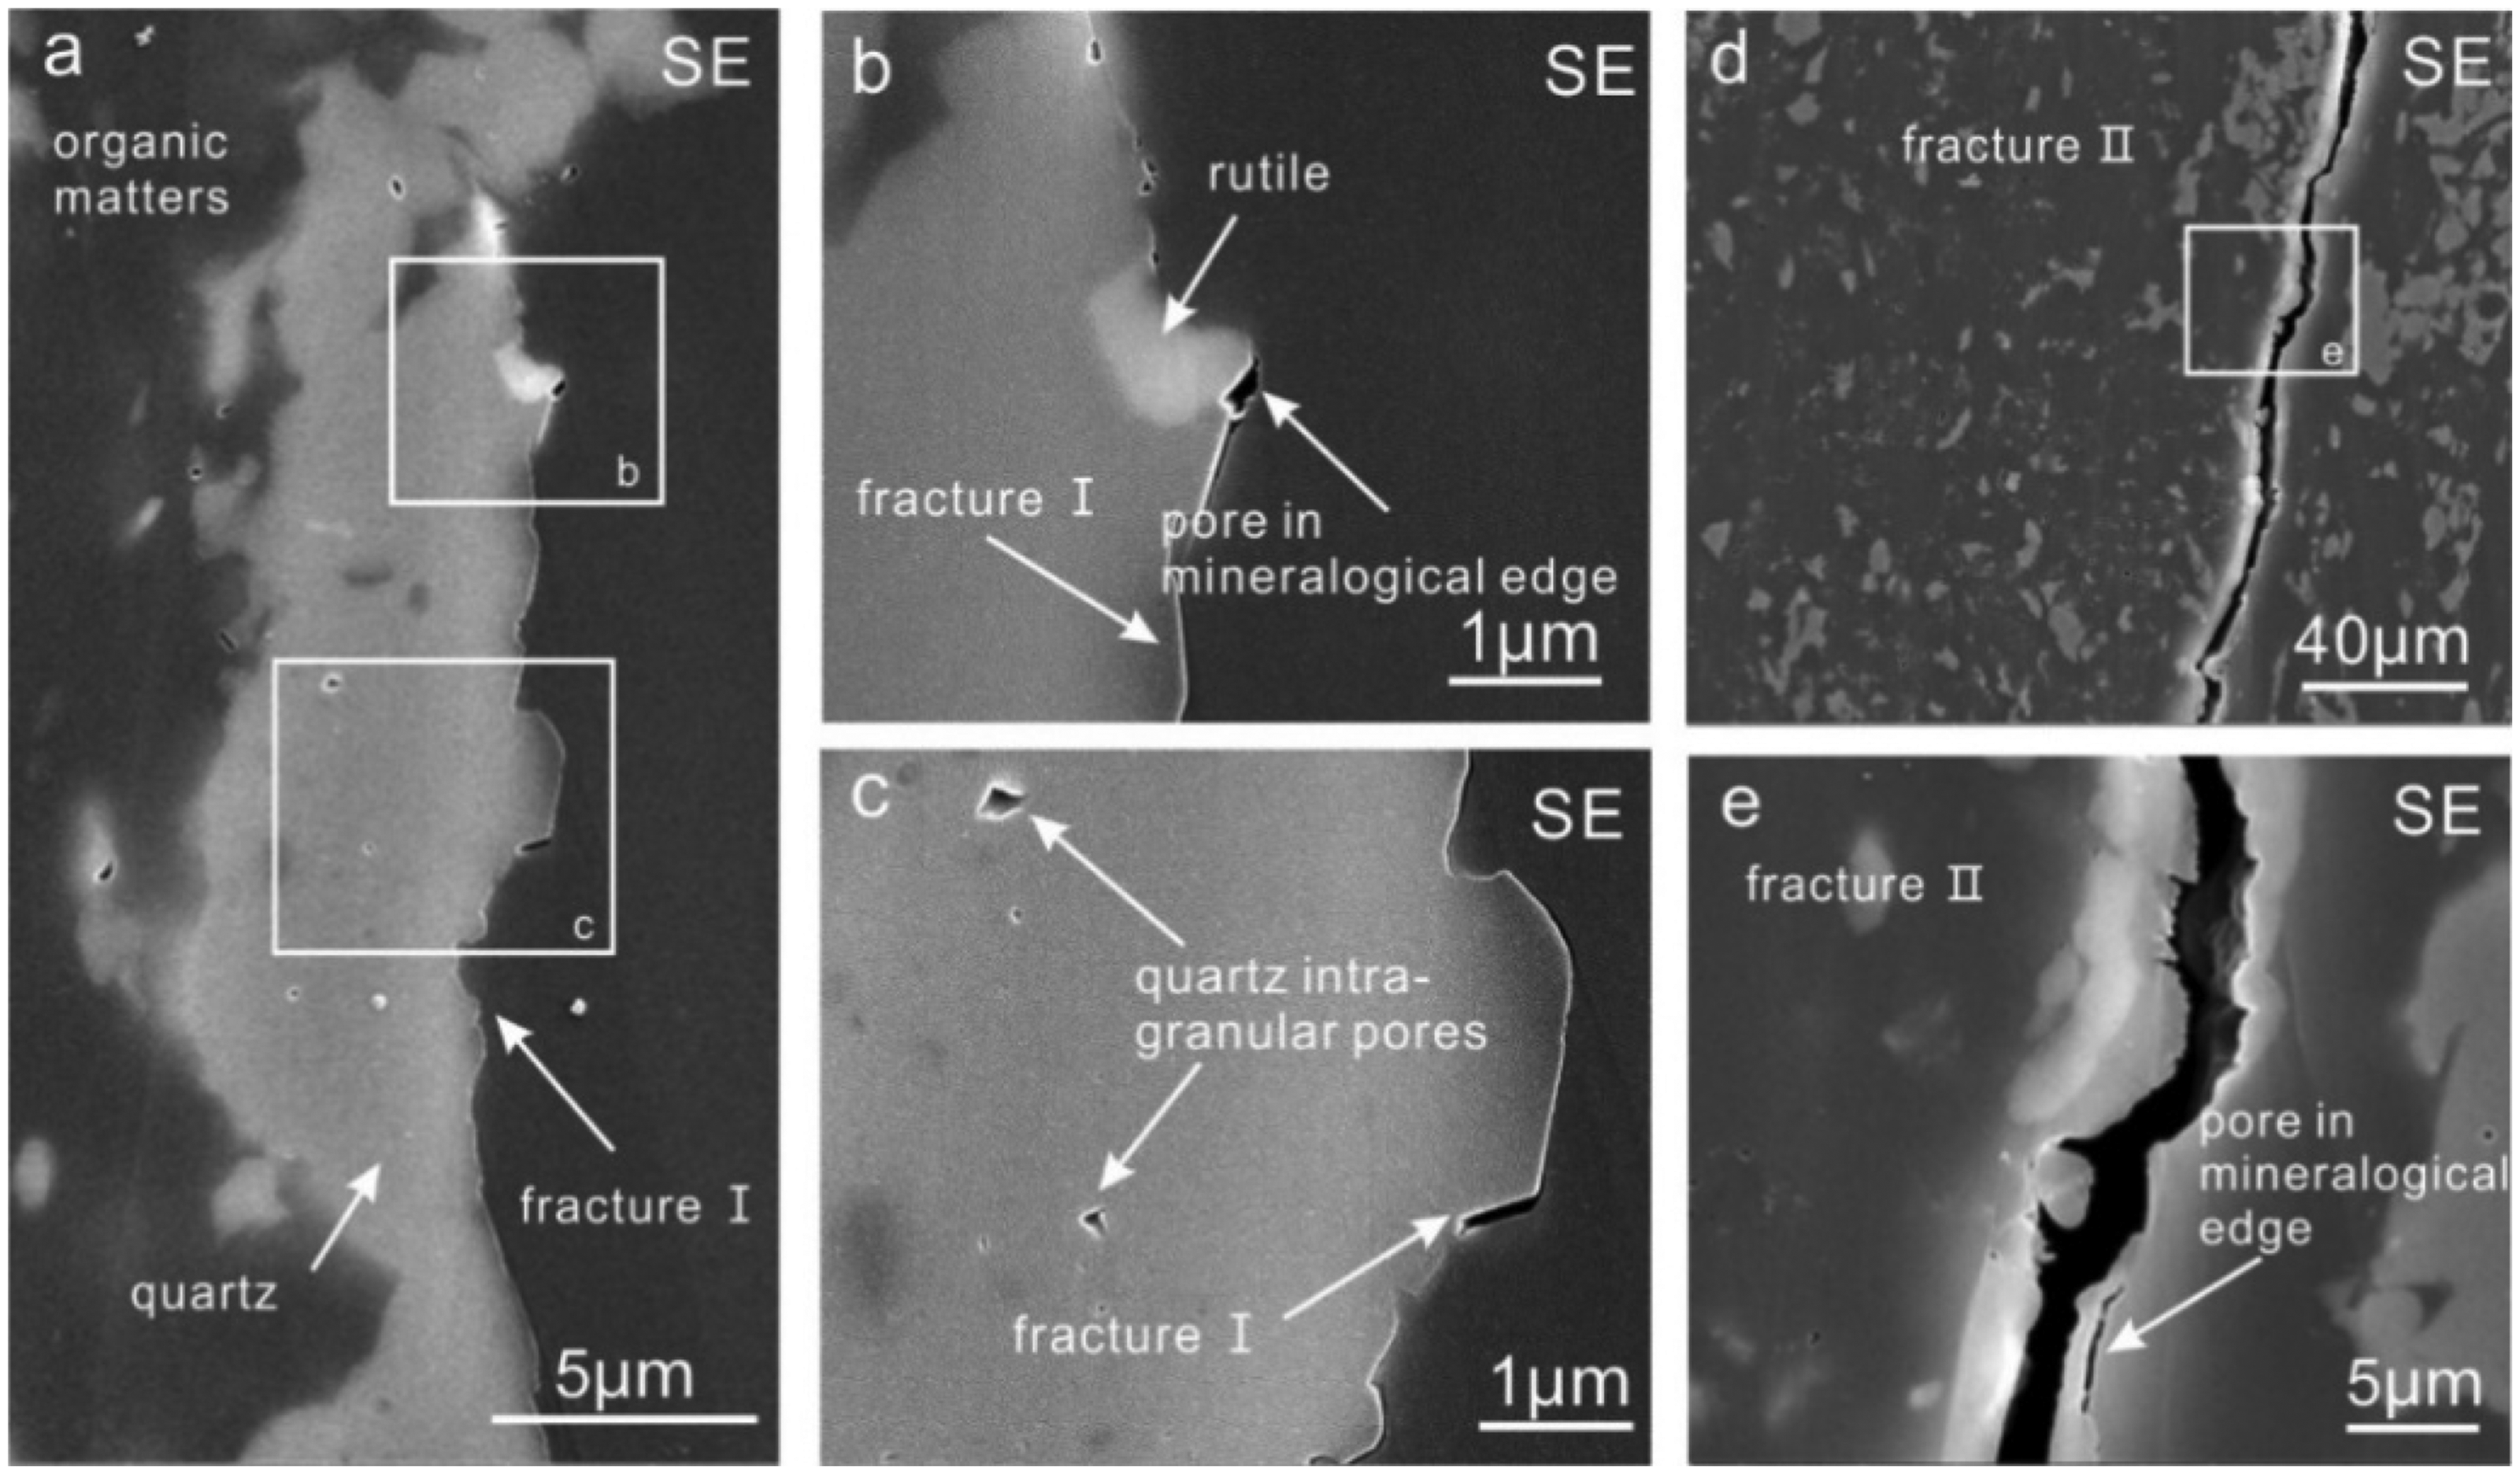
FESEM images (SE imaging) of micro-fractures: (a) quartz and related pores including pores on the mineralogical edge, intragranular pores, and micro-fractures (MF-I); (b to c) two typical areas were selected to make further observation at higher magnification; and (d to e) a typical micro-fracture (MF-II). SE: secondary electron.
Pores in the micron scale
Similar OM pore types were developed in the micron scale in different proportions (Figure 6). Thermal pores (gas pores; Figure 6(a) to (c)) and phyteral residual pores (Figure 6(d) to (f)) are also presented. Organic constituents interparticle pores in the micron scale can be observed in Figure 6(a), but this was not as prevalent as that in the nanoscale. Mineral-related pores (Figure 6(g)), MFs (Figure 6(h)), and fractures have bigger pore sizes (Figure 6(i)).
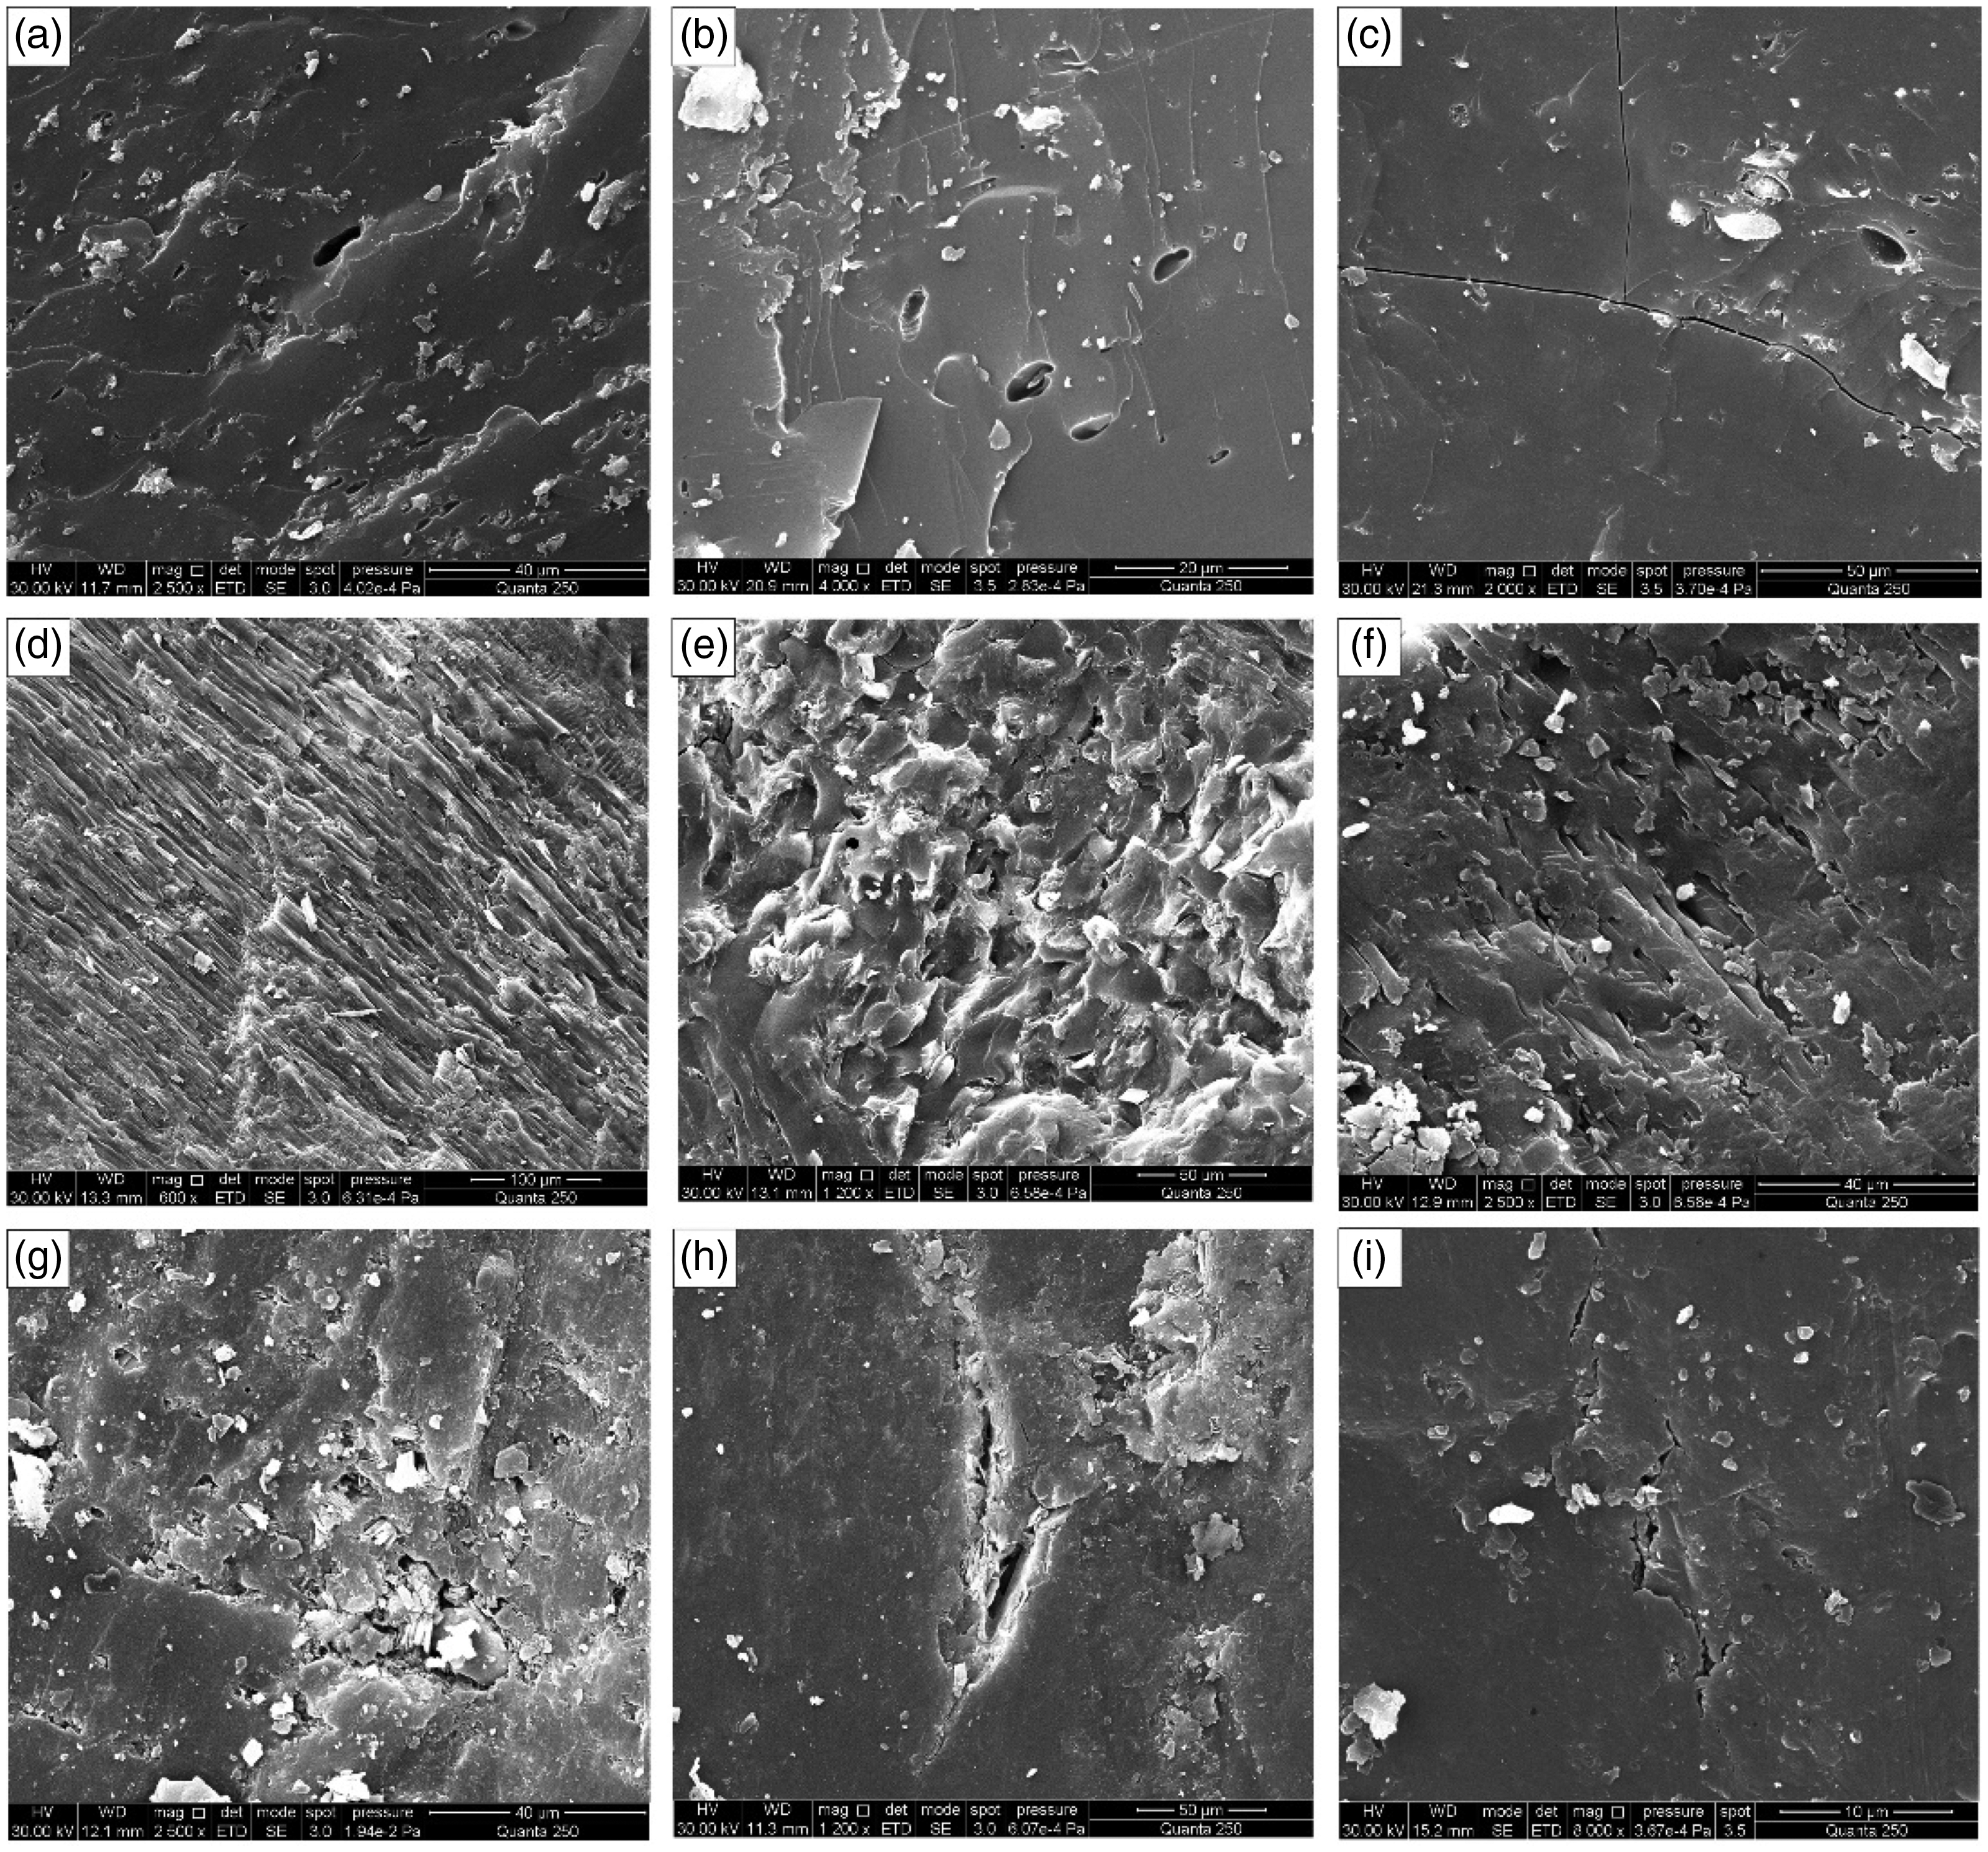
Micron scale pores in anthracite coals: (a to c) thermally pores developed in OM (note that some pores in (c) were filled with clay minerals, and some organic constituents interparticle pores in micron scale can be seen in (a)); (d to f) phyteral residual pores in micron scale (fusinite pores in panels (d to e); (g) pores in mineralogical edge; and (h to i) micro-fractures).
Pore structure characteristics
Pore structural quantification
Considering the broad pore size range, MIP analysis was used to quantitatively characterize the PSDs. The experimental results are presented in Table 3. The maximum intrusion volume of 10 coal samples varied from 0.039 cm3/g to 1.551 cm3/g, with an average of 0.1941 cm3/g. The average pore diameter was approximately 7.8 nm, and the specific surface area varied from 19.815 m2/g to 26.633 m2/g, with an average of 22.780 m2/g.
Basic parameters of pore structure resulted from MIP measurements.
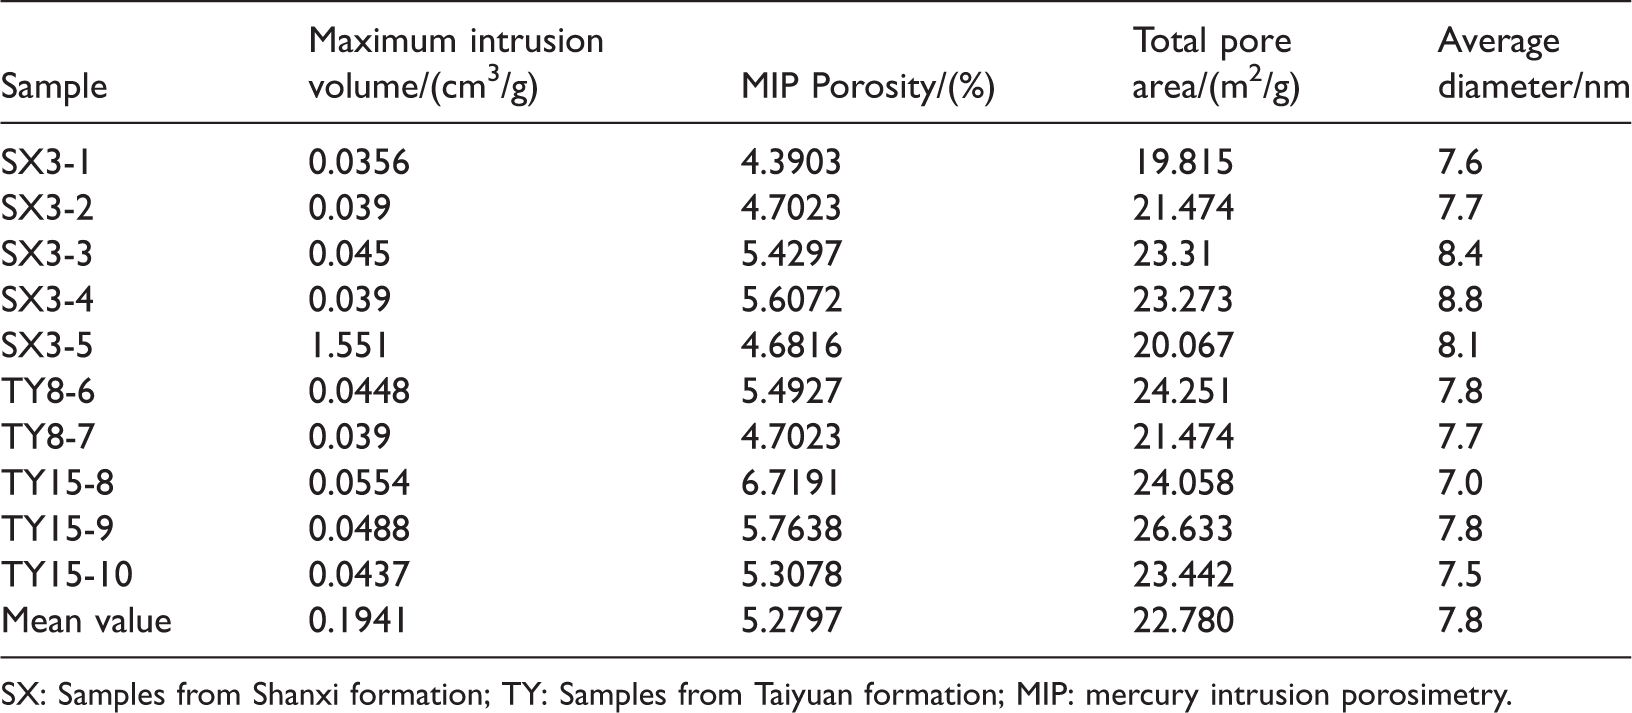
SX: Samples from Shanxi formation; TY: Samples from Taiyuan formation; MIP: mercury intrusion porosimetry.
Other structure features, such as pore shape and connectivity, were obtained by analyzing the shape of the isotherms and hysteresis loops between the adsorption and desorption curves. According to the classification of hysteresis loops by the International Union of Pure and Applied Chemistry, the adsorption and desorption curves were grouped into five types (Thommes et al., 2015), which represent the five different pore shapes (Figure 7). The N2 adsorption isotherms of samples are illustrated in Figure 8. As shown in Figure 8, the hysteresis loops of coal samples were noticeable, indicating that capillary condensation took place. The shapes of the hysteresis loops were similar to type B (Figure 7), which indicates that slit-shaped pores are a major component in the nanoscale pore system. It was suspected that these slit-shaped pores are correlated to OM-II pores and pores between OM and minerals with elongated shape based on FESEM images (Figures 3 and 5). Molecular pores usually have an elongated shape, which also contribute to form type B hysteresis loops. In addition, similar to the classification reported by Yao et al. (2008), these samples can be further divided into two groups, since the desorption isotherm can be interpreted as two stages. The isotherms of group A samples were reversible at low relative pressure (P < 0.5) but exhibited a sharp rise at higher relative pressure (Figure 8(a)). The adsorption and desorption isotherms of group B samples were reversible at the whole range and were more horizontal (Figure 8(b)).
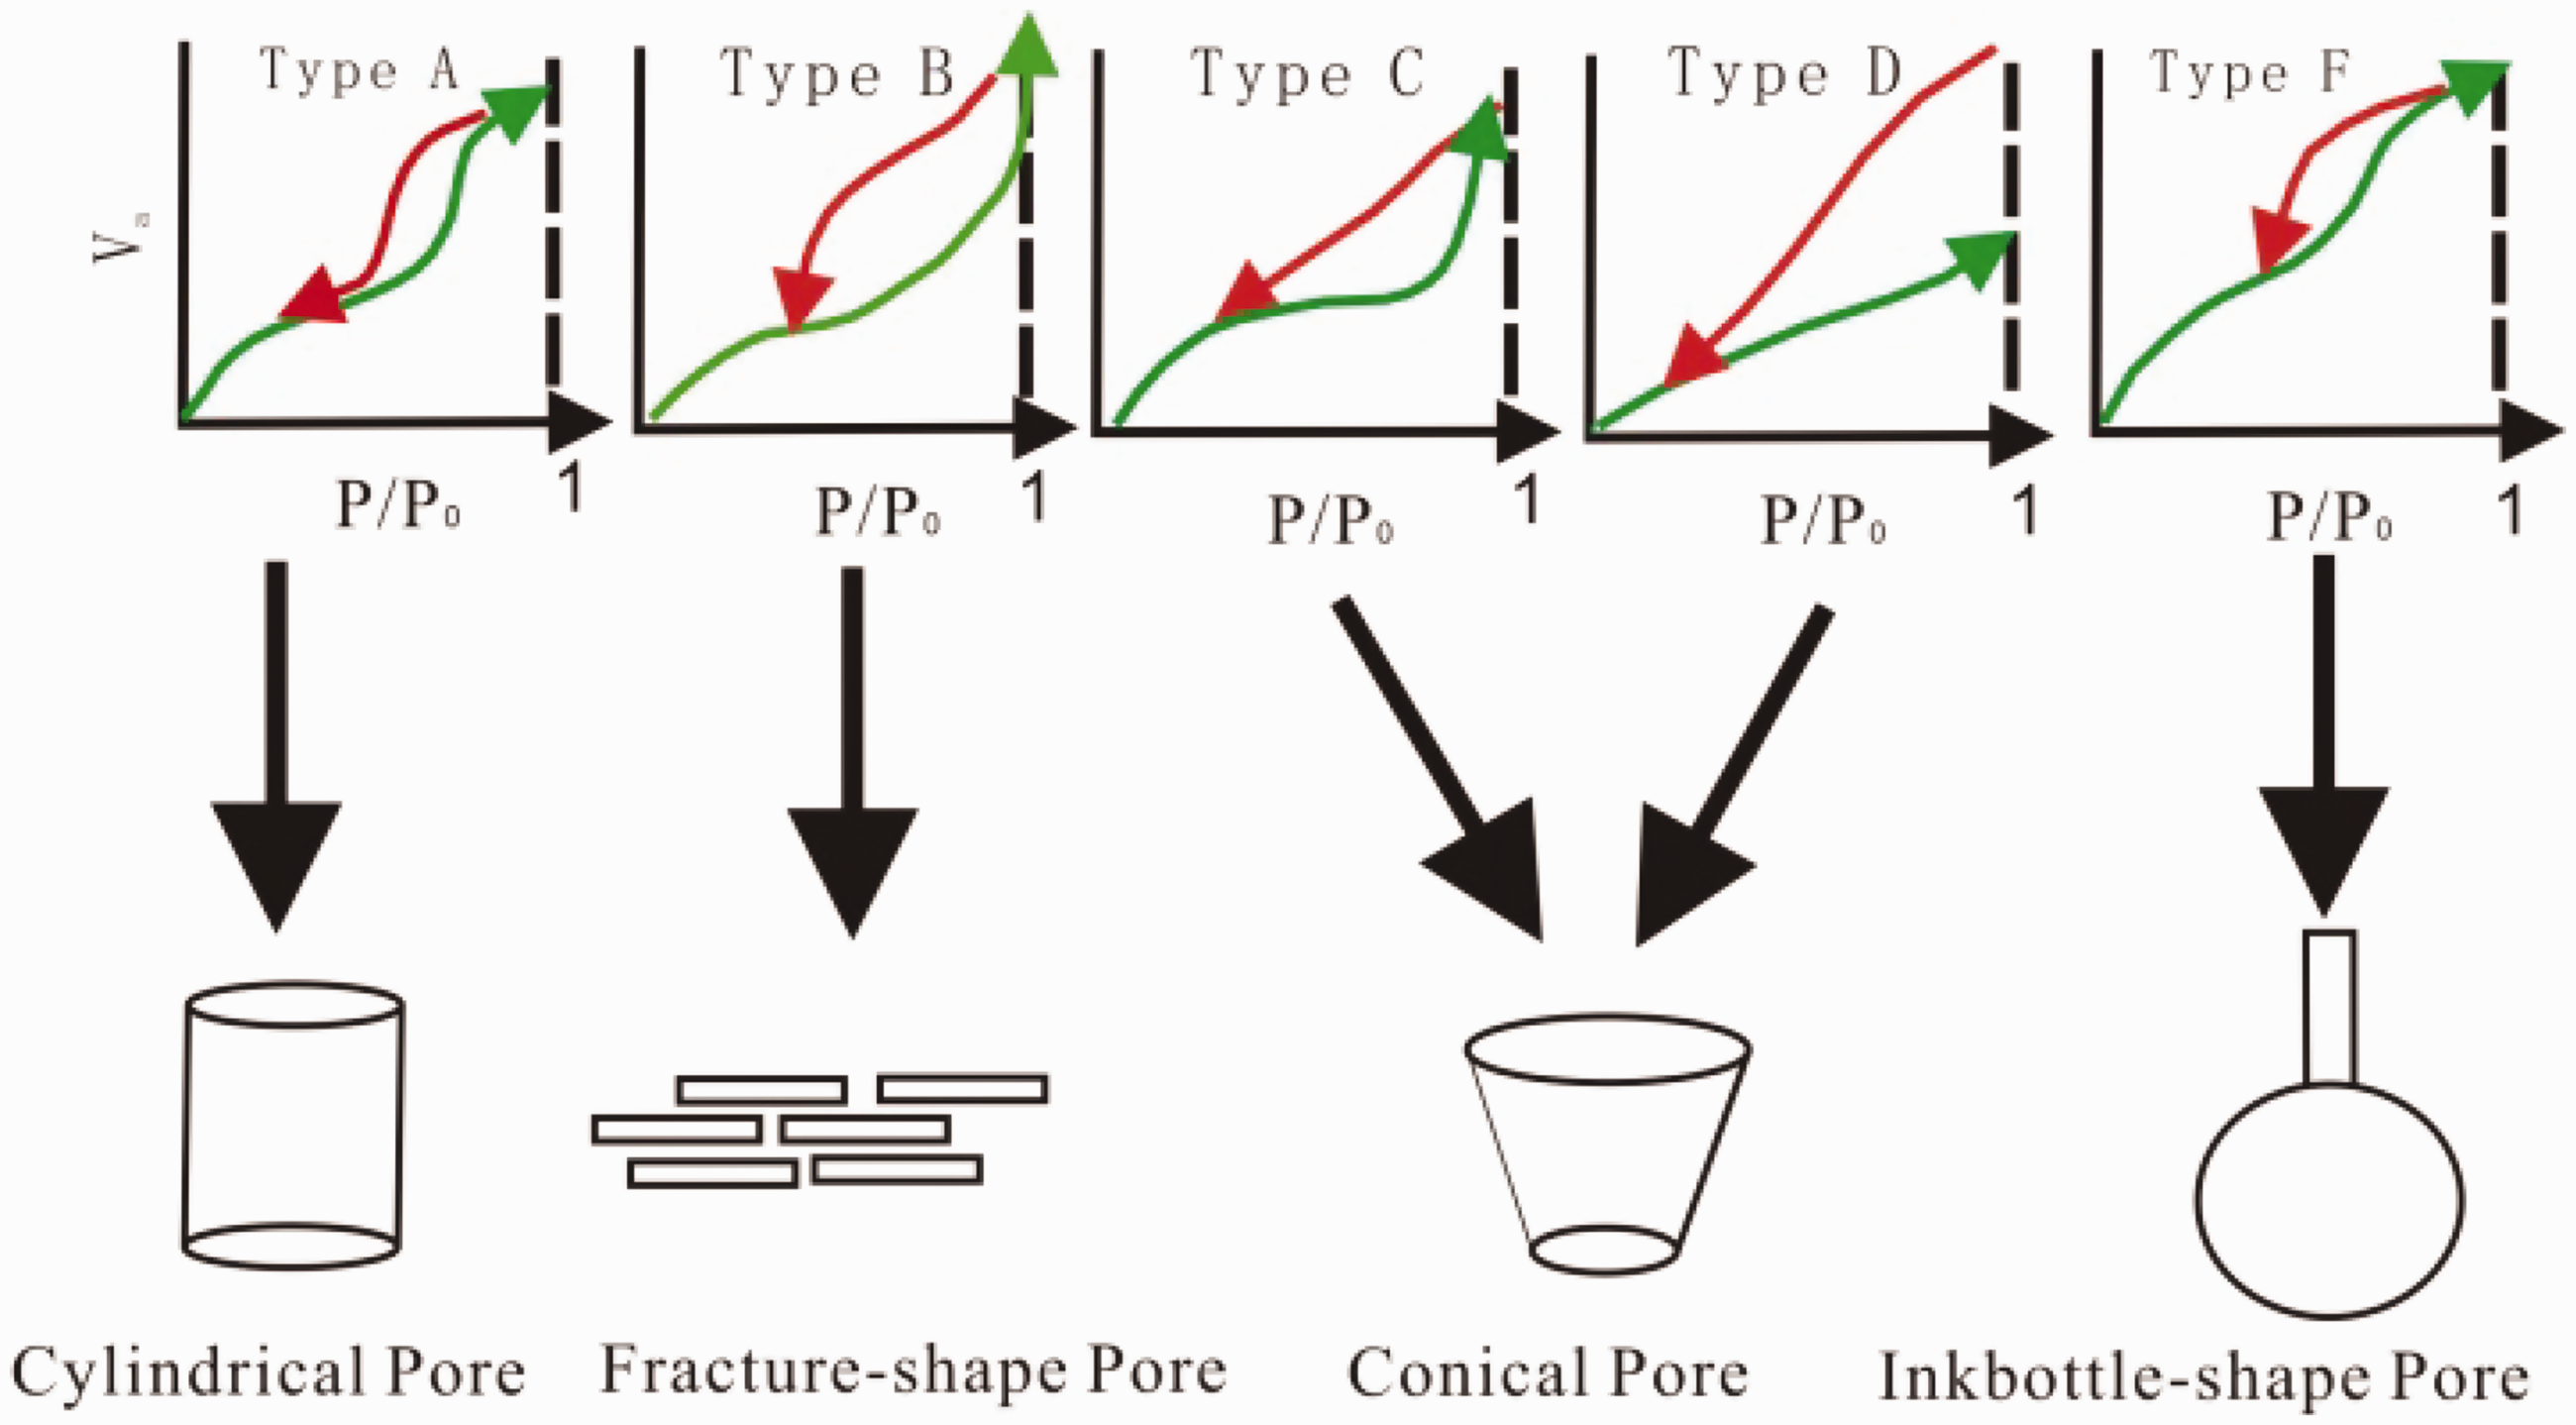
The classification of hysteresis loops between adsorption and desorption curves and the corresponding pore shapes.
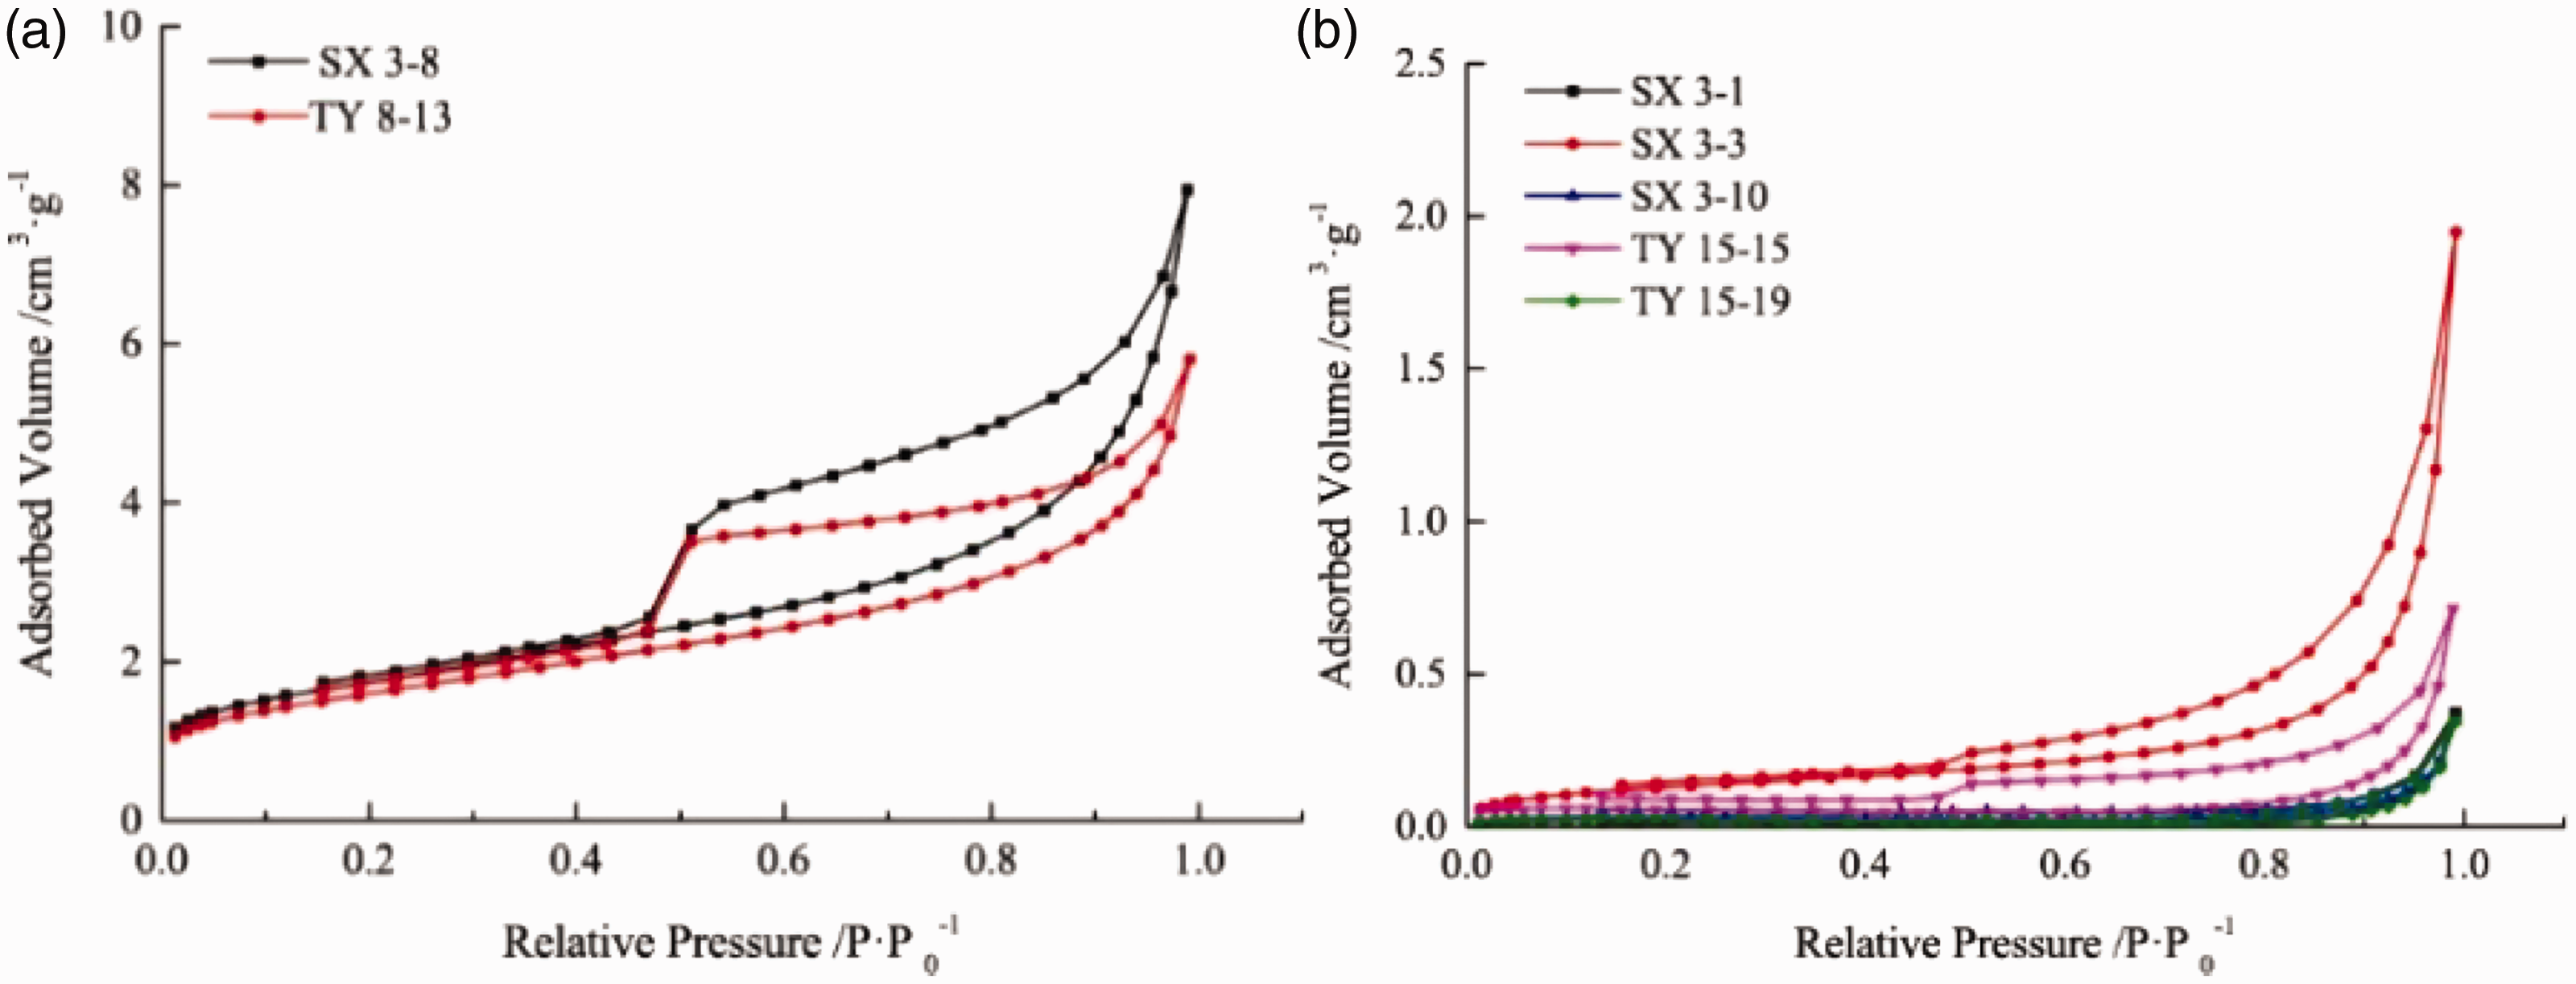
The adsorption and desorption curves obtained from LP-N2GA measurements of anthracite coals: (a to b) two different groups based on the shape of hysteresis loops. SX: Samples from Shanxi formation; TY: Samples from Taiyuan formation.
PSDs using MIP and LP-N2GA
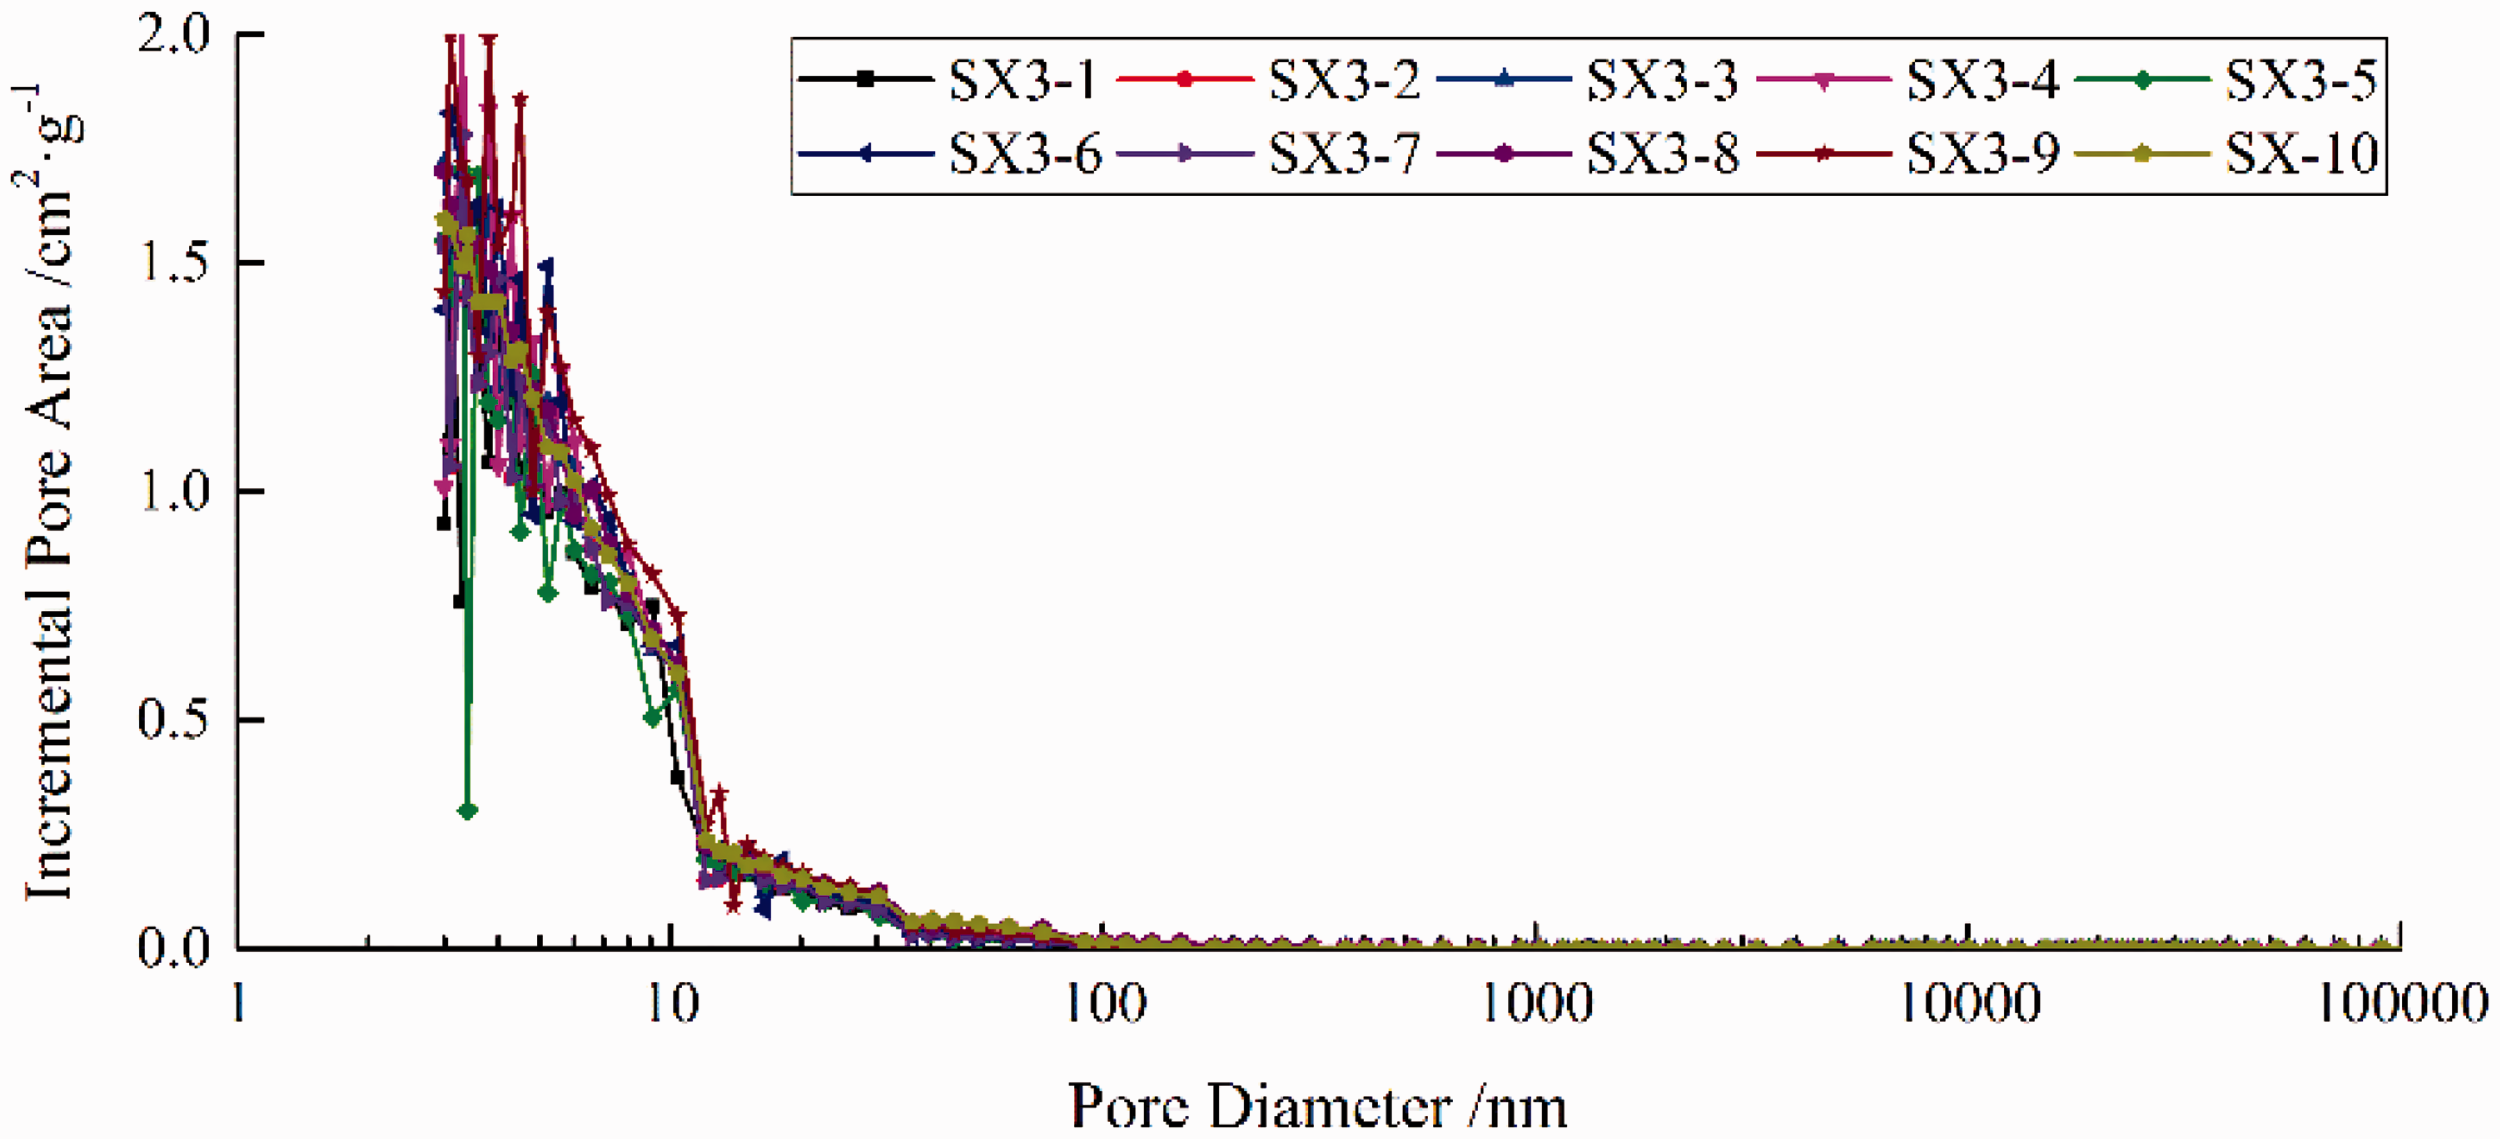
PSD is one of the critical characteristics of pores in coal, since it has a profound influence on the behavior of CBM. The incremental intrusion plots of MIP show that the pore volumes are mostly concentrated in the nanopore range of <100 nm (Figure 9). Most of the samples display multimodal PSDs, representing the pore volume of nanopores and MFs (Figure 9). Pores <10 nm contribute to the major specific surface area in the tested samples (Figure 10).
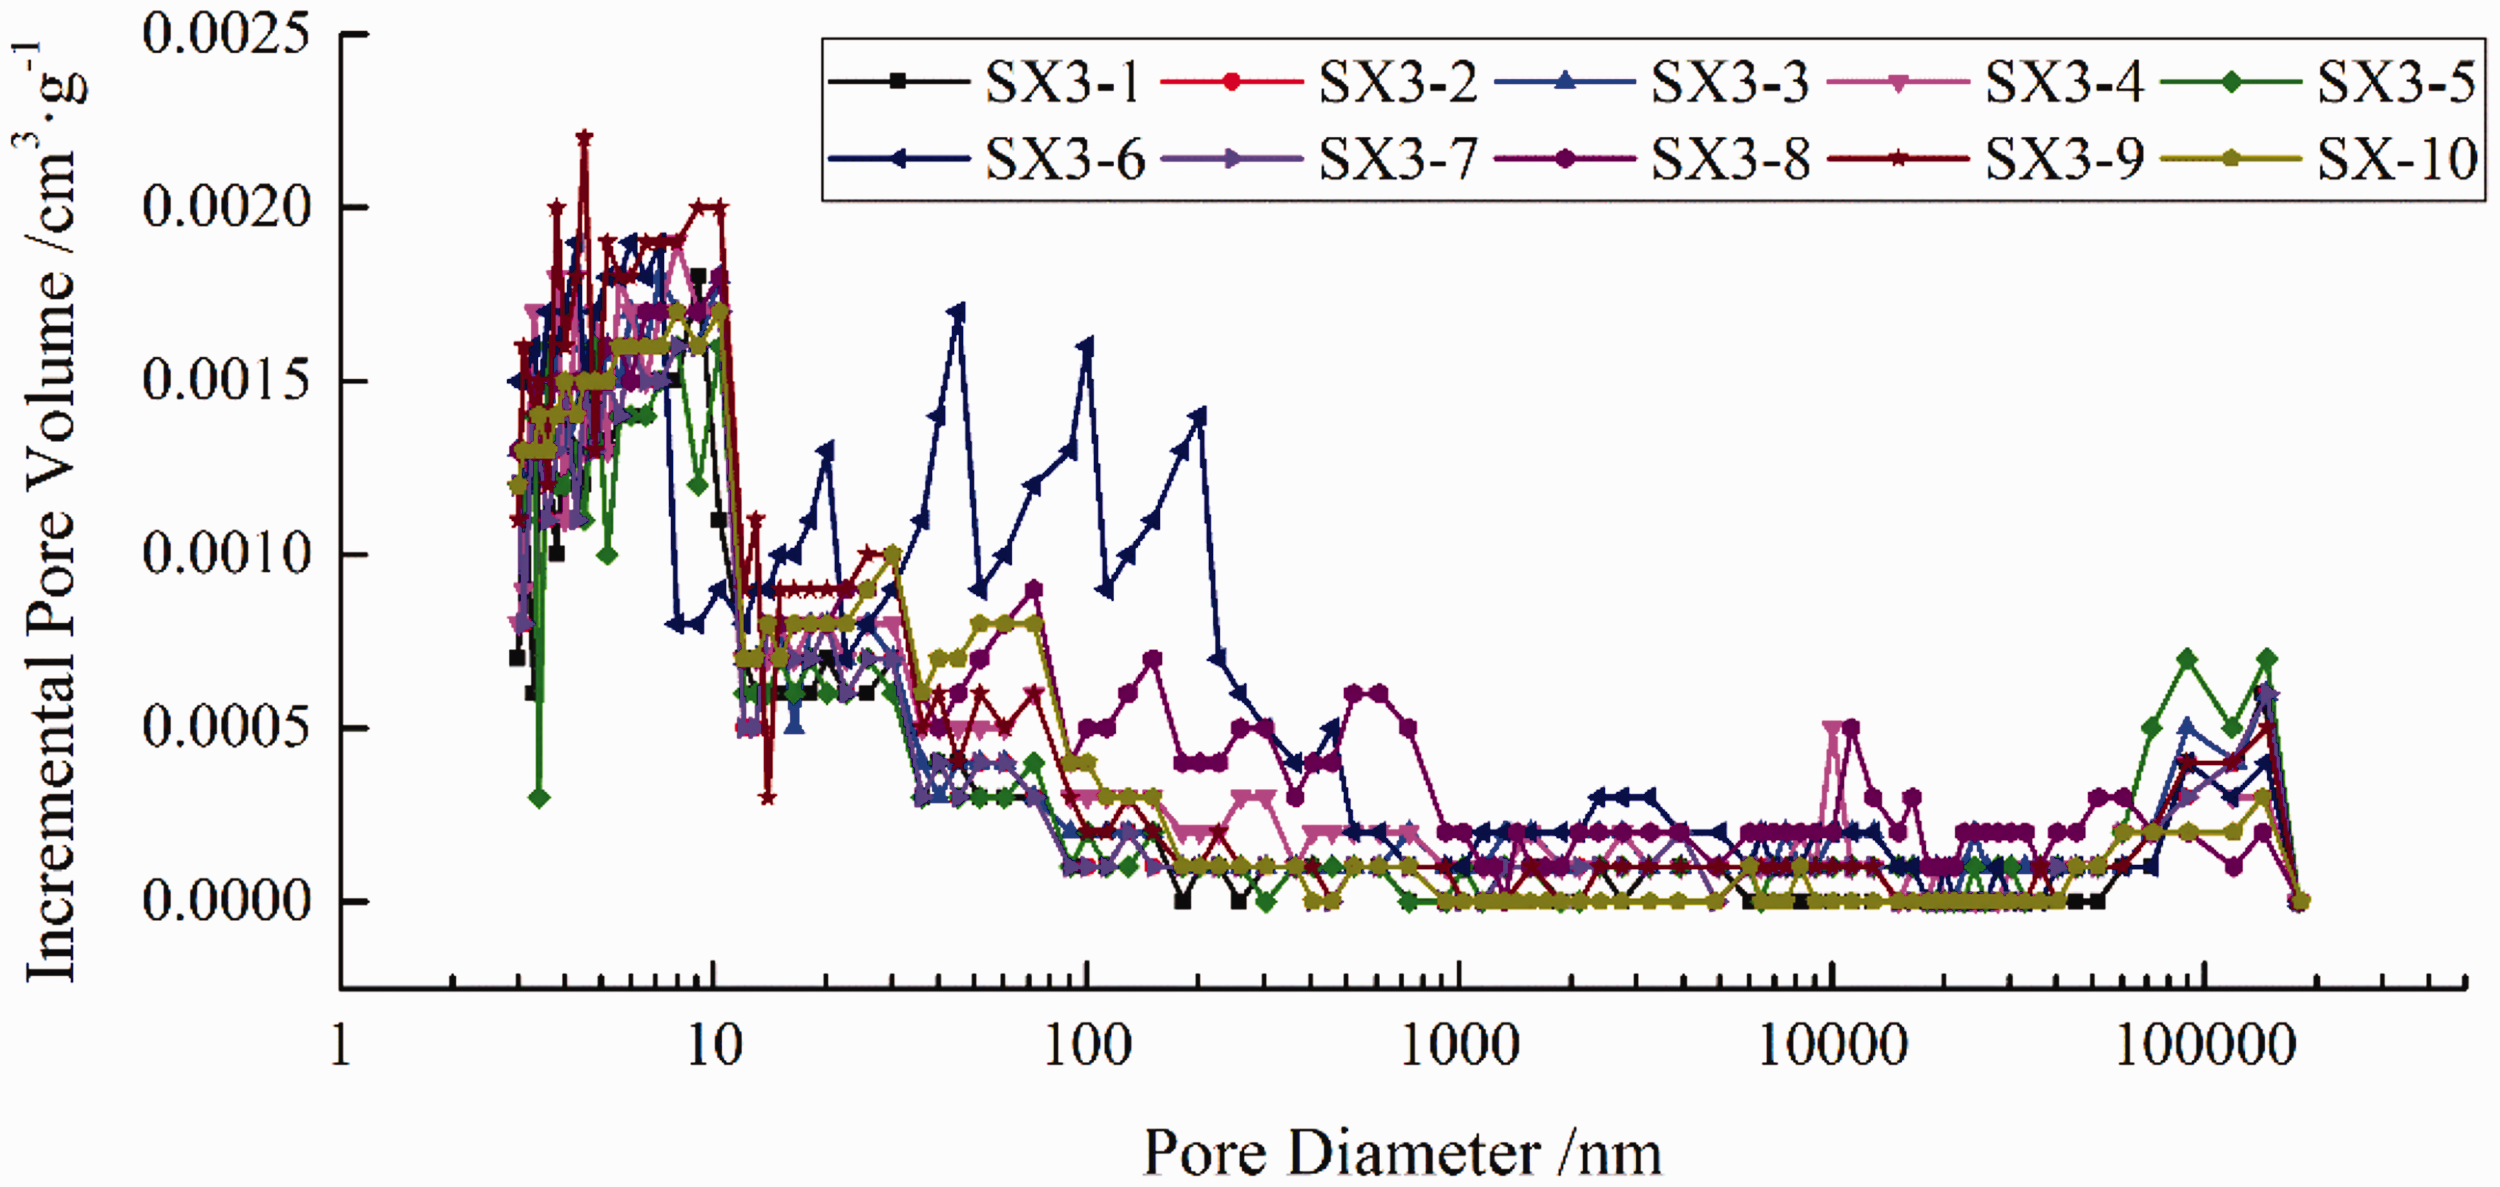
Pore size distributions by MIP measurements of tested coal samples. SX: Samples from Shanxi formation.
Specific surface area distributions by MIP measurements of tested coal samples. SX: Samples from Shanxi formation.
LP-N2GA is used for nanopores smaller than 100 nm in which the range of the MIP method is not suitable (Nie et al., 2015; Okolo et al., 2015). Data from LP-N2GA were interpreted using Brunauer-Emmett-Teller (BET) equation for specific surface area analysis and the Barrett-Joyner-Halenda (BJH) model for PSD analysis. The BET-specific surface area varied from 0.0679 m2/g to 0.1781 m2/g, while the BJH pore volume varied from 0.000499 cm3/g to 0.001119 cm3/g (Table 4). Furthermore, the average pore diameter varied from 6.0028 nm to 31.5852 nm. The parameters calculated above were not consistent with the MIP results (Table 3). The PSDs, which are interpreted using BJH model through the desorption branch of isotherms, are presented in Figure 11. All tested samples have a similar bimodal PSD with two major peaks at approximately 20 nm and 40 nm, respectively, suggesting that micro-pores and transitional pores occupy a predominant position in the nanoscale reservoir space.
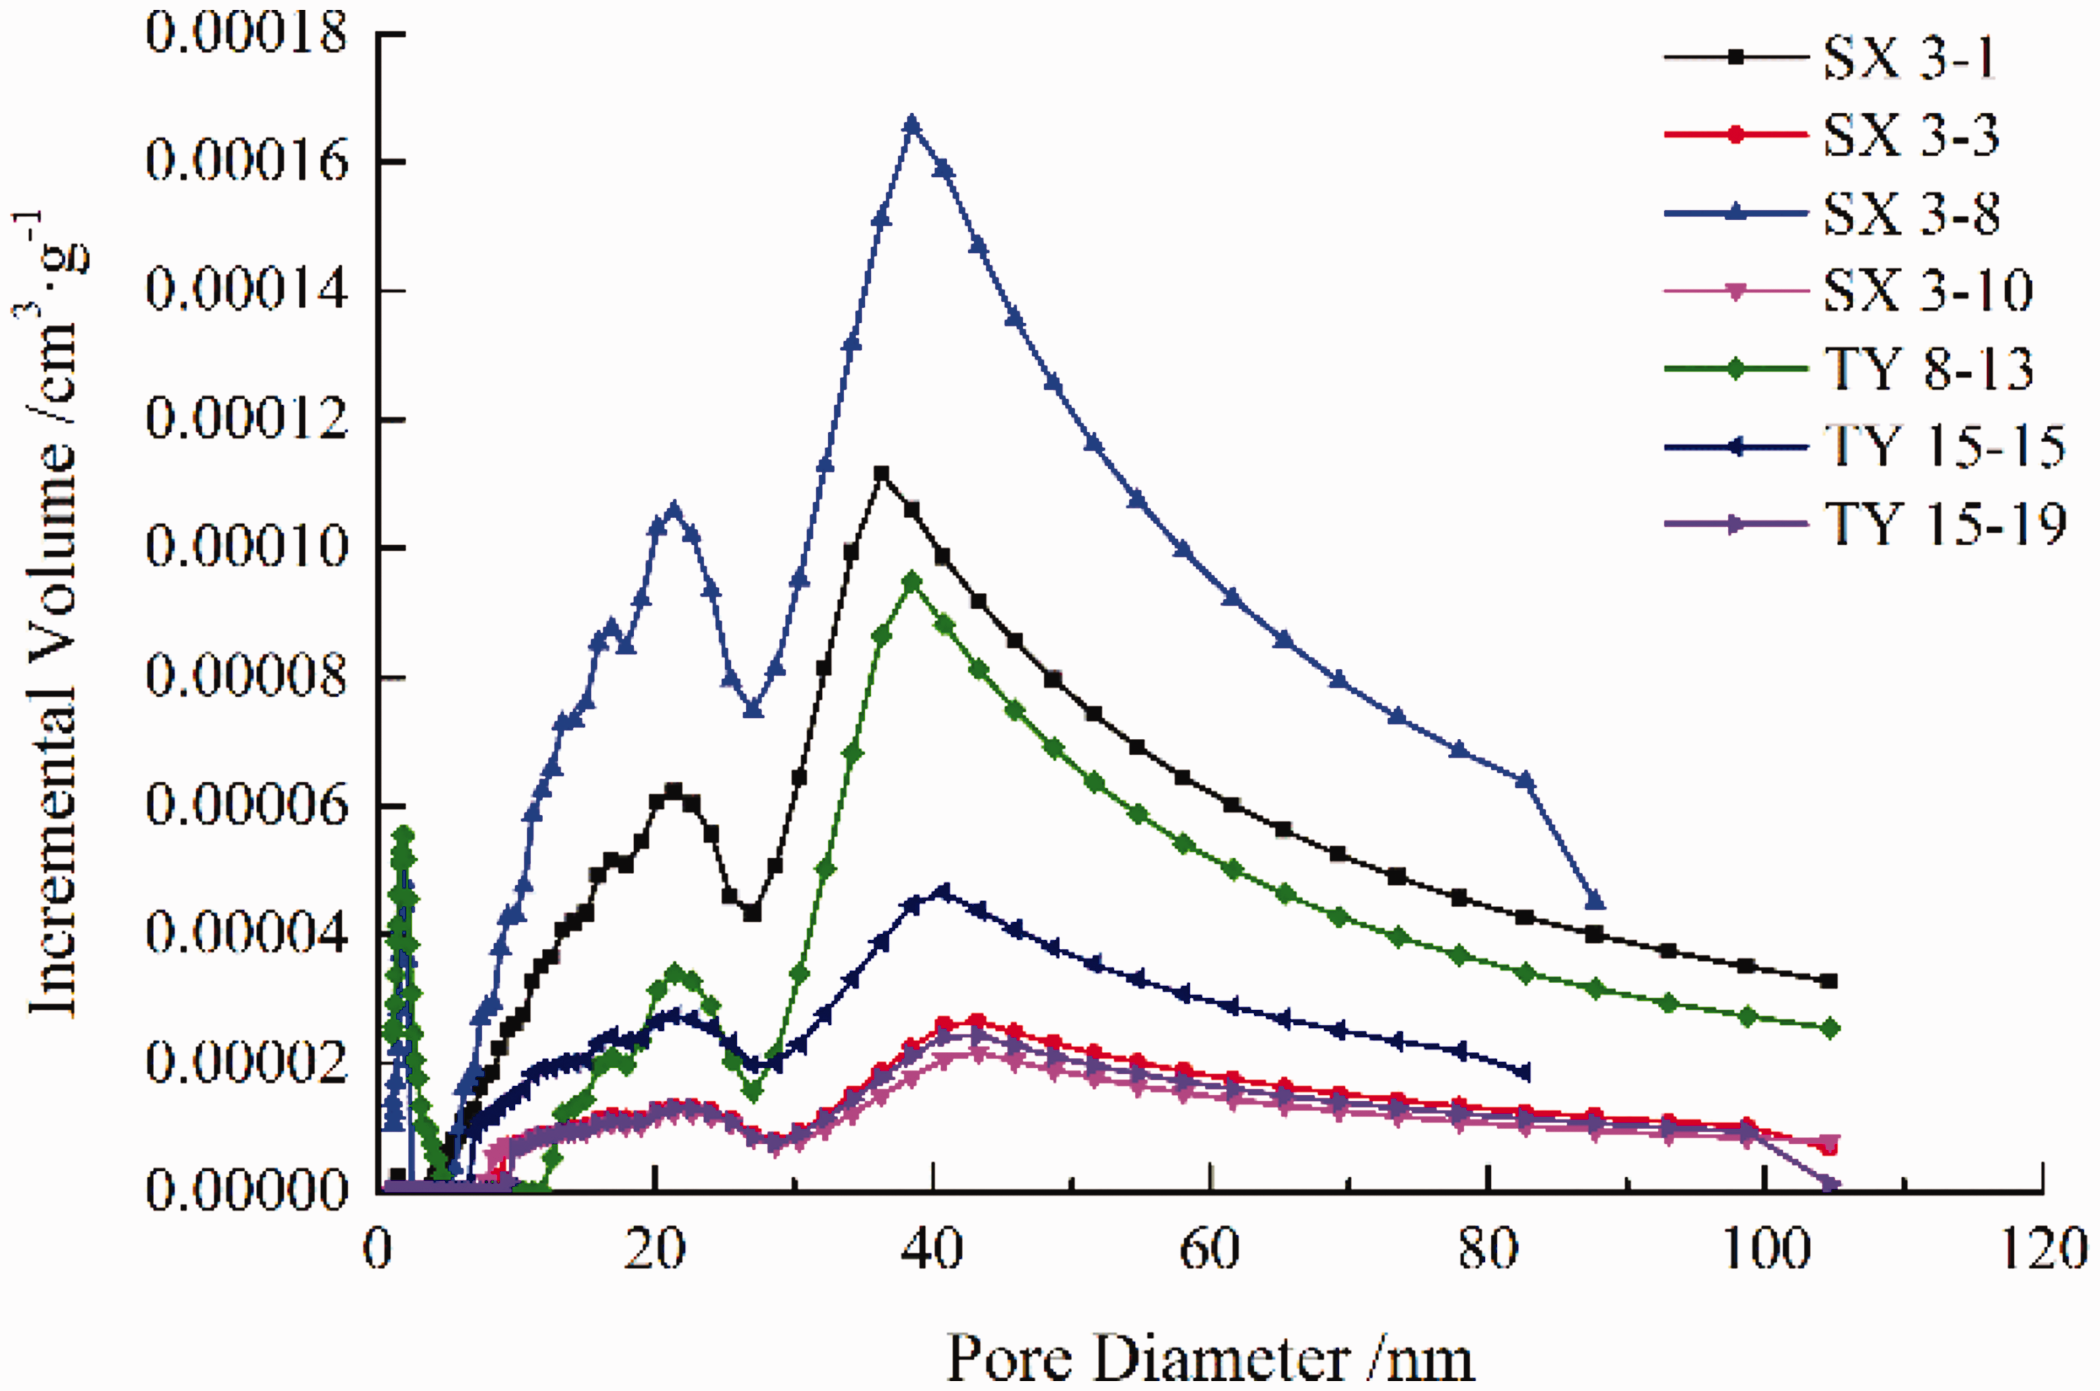
The nanoscale pore size distributions by LP-N2GA. SX: Samples from Shanxi formation; TY: Samples from Taiyuan formation.
The pore structure characteristics by low-pressure N2 gas adsorption.
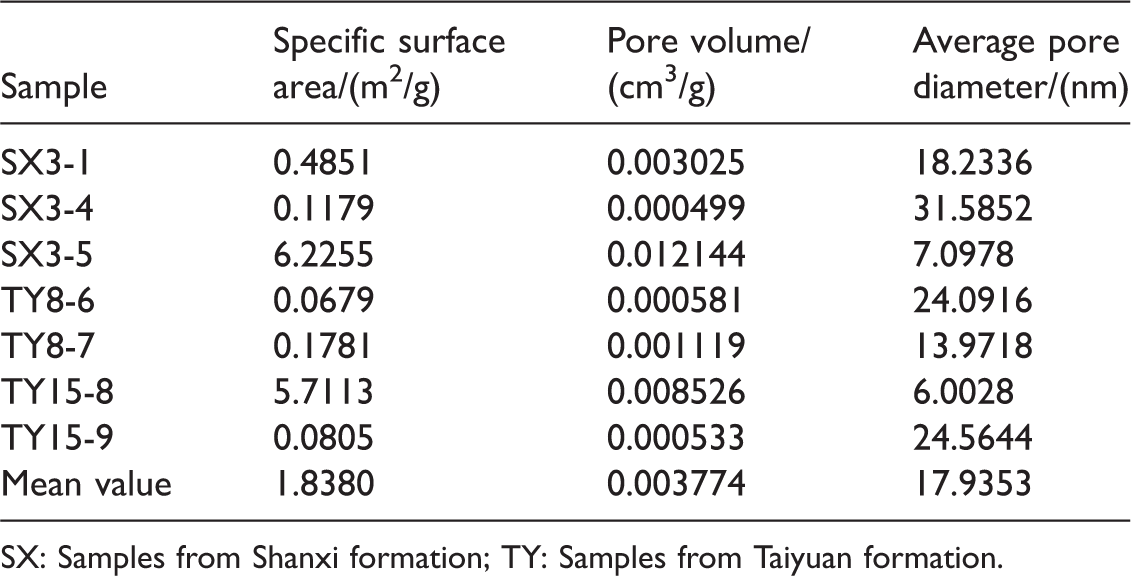
SX: Samples from Shanxi formation; TY: Samples from Taiyuan formation.
The significant differences in the pore volume distributions should not be ignored. On the pore size range of 10 nm–100 nm, the MIP curves dramatically rose up to approximately 8 nm (Figure 9), while the LP-N2GA curves exhibited two peaks at approximately 40 nm and 20 nm, respectively (Figure 11). MIP was historically used to study the pore-throat characteristics of conventional reservoirs. However, extremely high pressures would lead to a certain degree of error for unconventional reservoirs (Kuila and Prasad, 2013). Considering the limitation of LP-N2GA to measure meso- and micro-pores and the limitation of MIP to measure nanopores, the combination of MIP and LP-N2GA may provide more accurate PSD information for the tested samples (Kuila and Prasad, 2013; Okolo et al., 2015; Wang, 2015). A comparison of PSDs between LP-N2GA and MIP suggests that the deviation may be induced for 20%–25% of the whole pore volume through the compressibility effect under high pressure, and LP-N2GA may underestimate the porosity. Thus, pores of <30 nm should have a better development degree, while the pore volume of pores >30 nm should be induced.
PSDs using image processing
Considering the limitation of MIP and LP-N2GA, image processing was conducted using FESEM images. The quantification of nanopores in coal remains a challenge due to the small size. The image processing enables information extraction and the statistical quantification of nanoscale pores. Gridding statistics from the image processing are widely used for studying nanopores in unconventional reservoirs (Jiao et al., 2014; Loucks et al., 2009). In this study, pores are investigated automatically using Matlab software after the processing steps of grid sorting, segmentation, and statistical analysis (Figure 12). A variety of structural parameters were measured for each of the numbered pores on binary FESEM images, including area, perimeter, major axis length, minor axis length, and form factor.
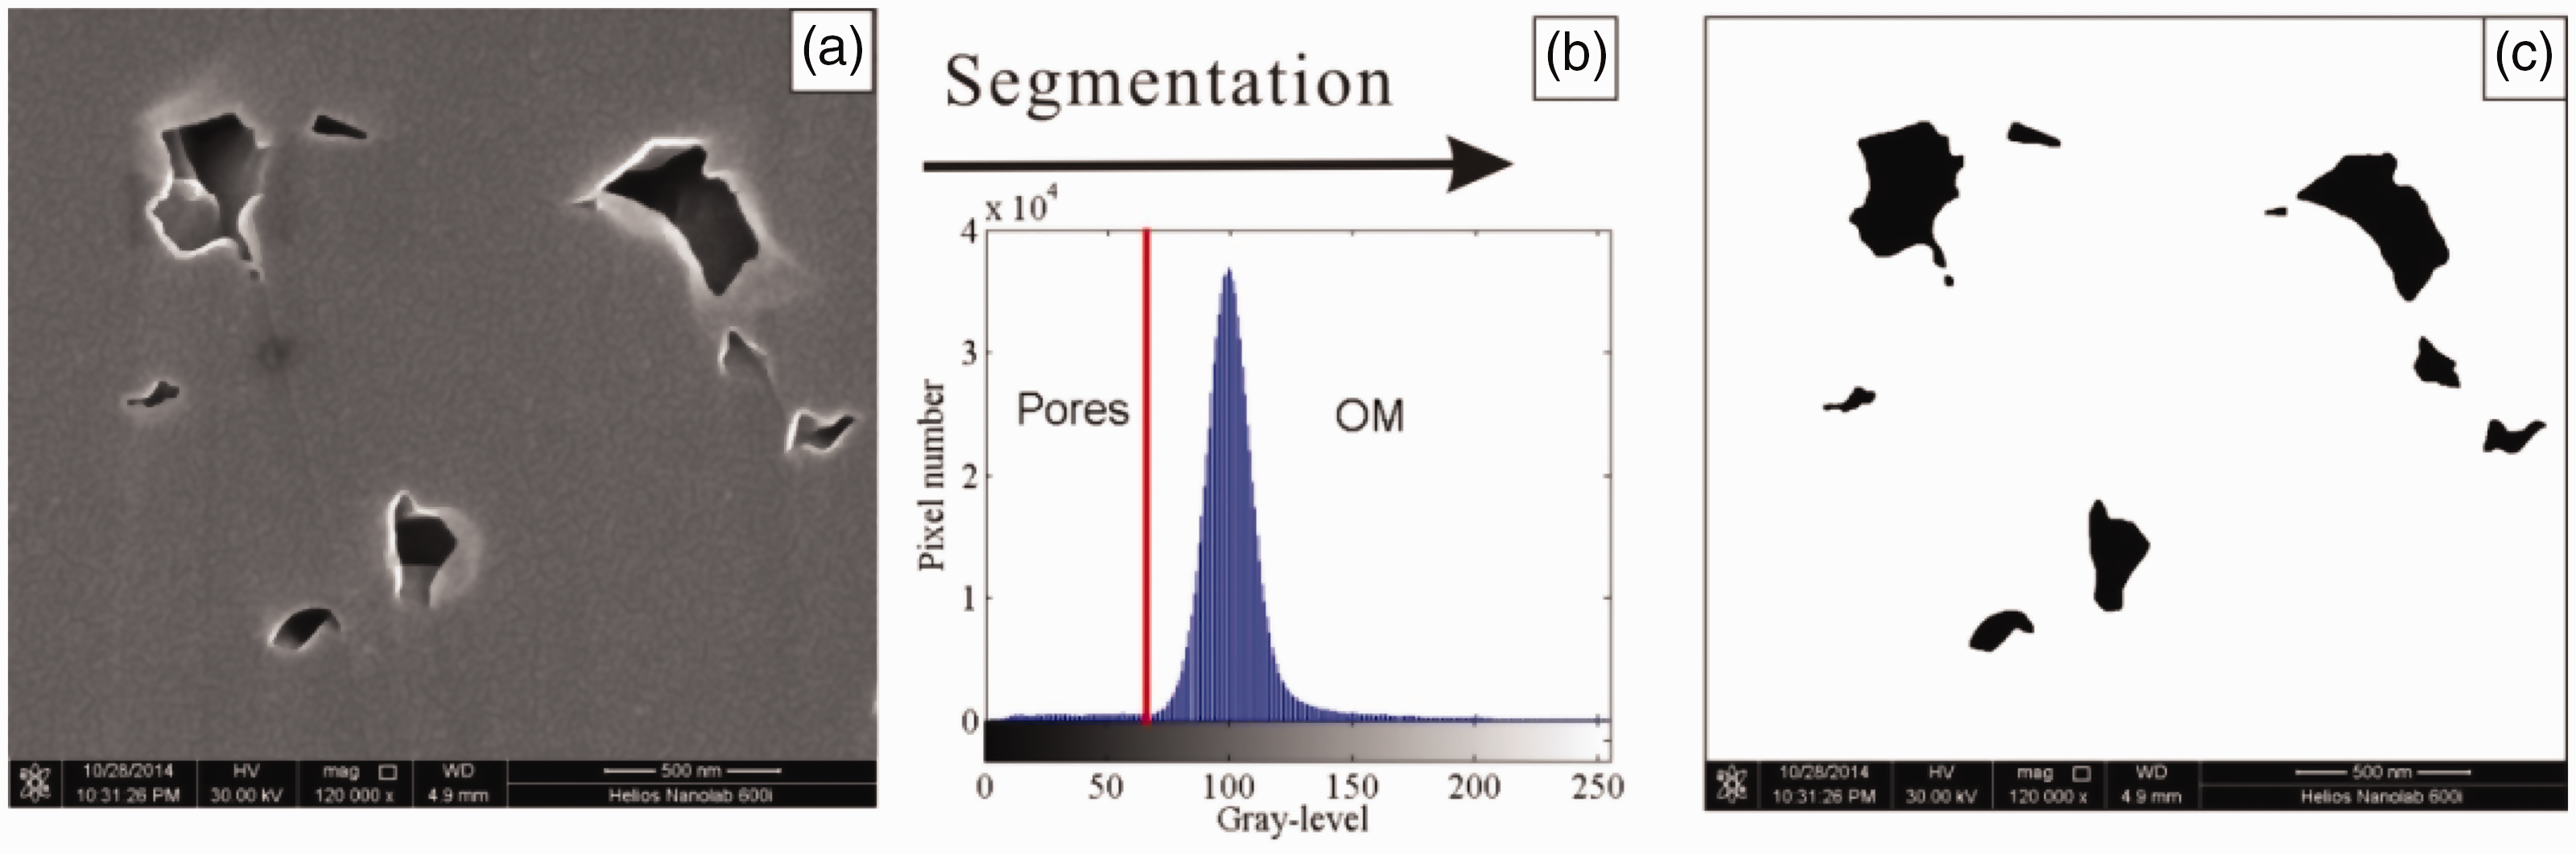
Image processing steps from original FESEM image to binary image. OM: organic matter.
A typical image processing result is shown in Figure 12. The original image was converted to binary image through segmentation, with a threshold value of 64. The length of major and minor axis represents the length and width of a pore, respectively, in which the width was used to represent the size of a pore. The form factor parameter as used to measure the irregularity of the pore structure, which describes the shape features of circularity and pore edge roughness, with a value ranging between 0.785 for a square and 1 for a circle. The parameter of the form factor (ff) is defined as follows

In the equation, S represents for pore area and C represents the perimeter of a pore (Sezer et al., 2008).
The value of major axis length is commonly more than twice bigger than minor axis length showing the roundness of nanopores is relatively low, and the pore shape is complex (Figure 13). Form factor parameter reflects the complexity of pore shape (Jiao et al., 2014). Among the 10 pores in Figure 13, the value of form factor ranges from 0.45 to 0.97 with an average of 0.61. The value of form factor of nanopores in tested high-rank coal samples is relatively lower than OM nanopores in high maturity shale reflecting the complex pore morphological characteristics in coal (Jiao et al., 2014).
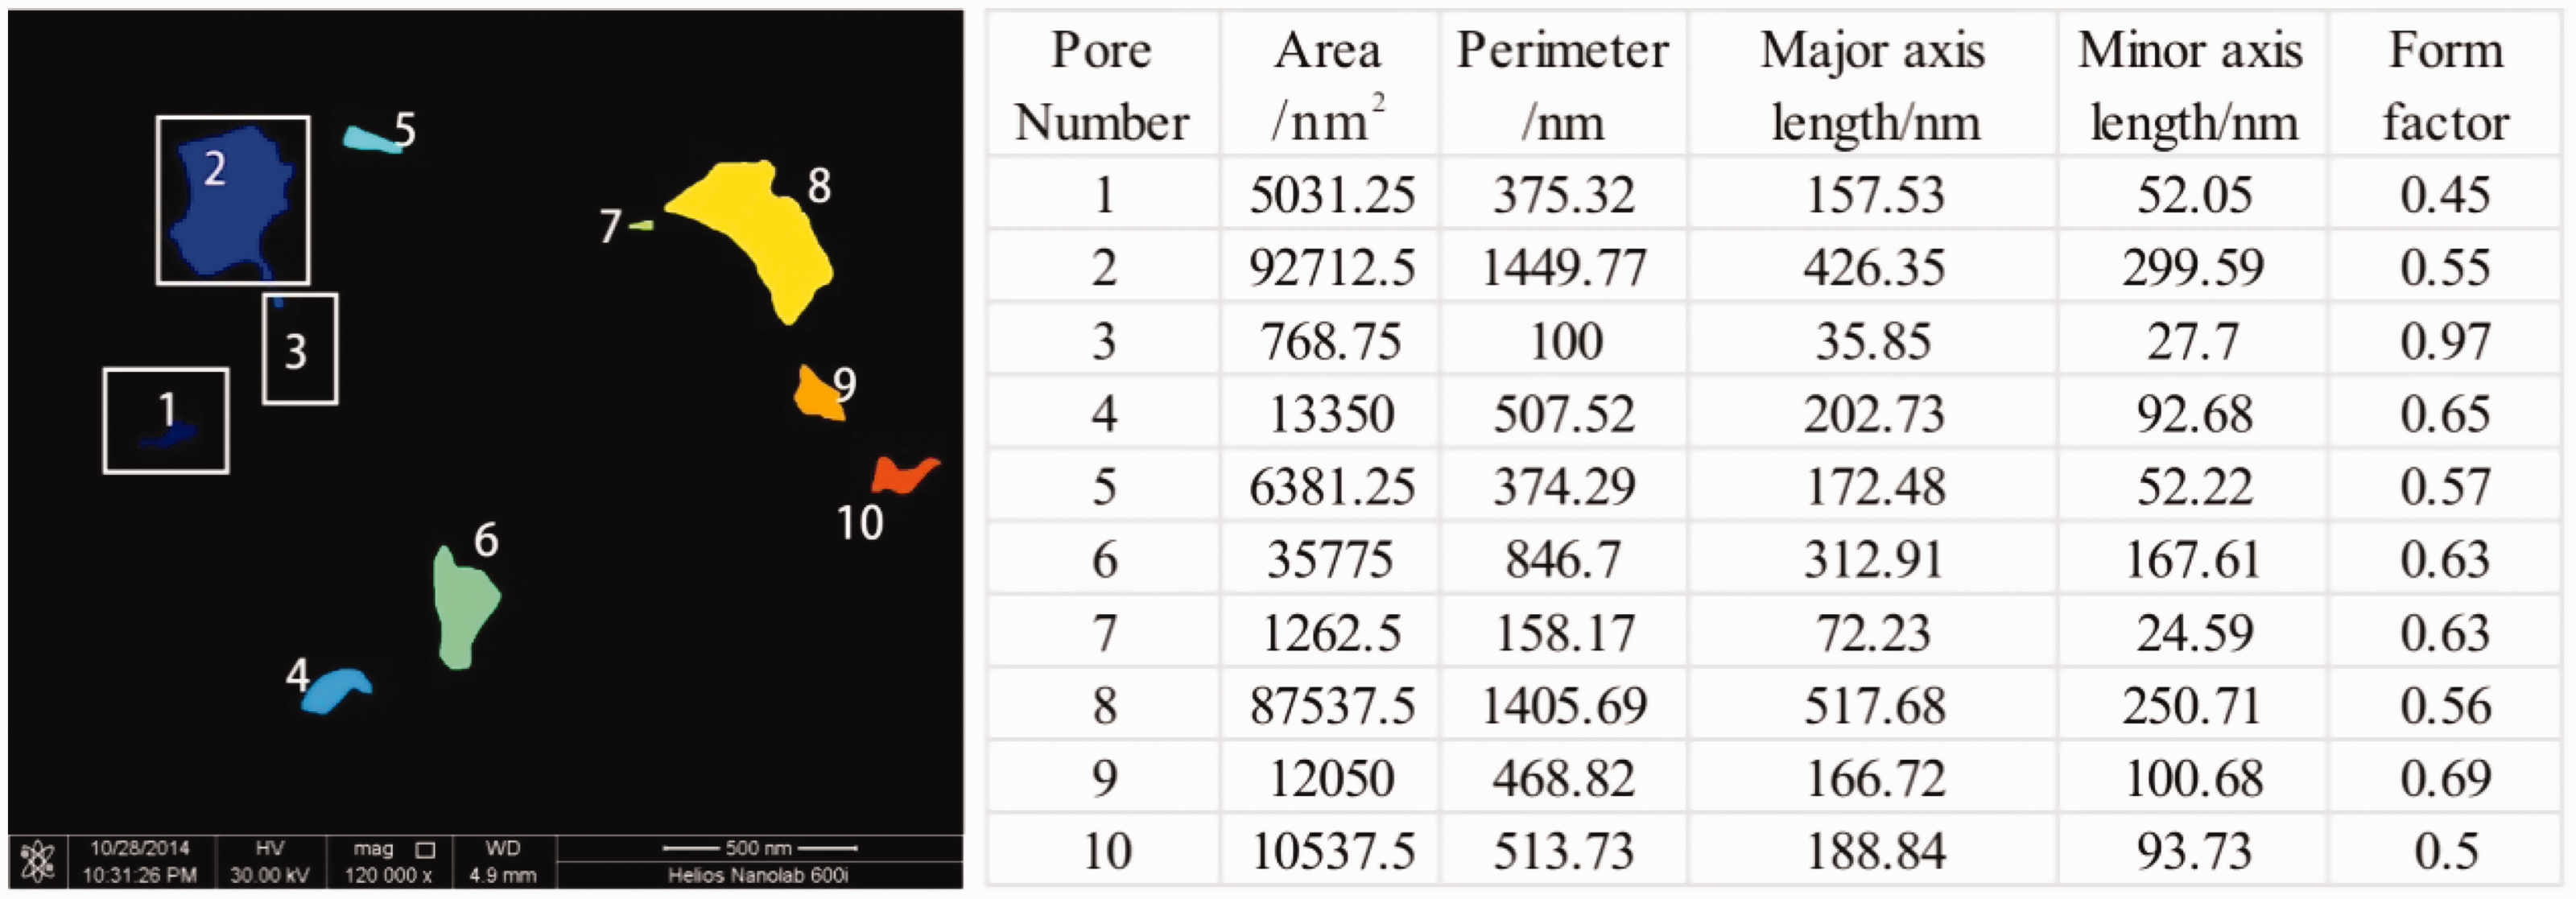
Image processing and statistical analysis of nanopores using FESEM images.
Using the FESEM images of six samples (Figure 14(a)), the PSDs and quantities of different pore types were extracted (Figure 14(b) and (c)). The FESEM images show that OM-II pores were the most abundant type, in which pores of 10–150 nm were well developed, while pores of >200 nm were less developed with a relatively small quantity (Figure 14). Although MFs in the coal matrix are not well developed, fractures and cleats with larger diameters (5000–10,000 nm) have a certain development degree that occupies a relatively larger volume when compared with macro-pores and MFs. These features from the image processing provide direct proof of the bimodal PSD, which have relatively good consistency with PSD features using MIP and LP-N2GA.
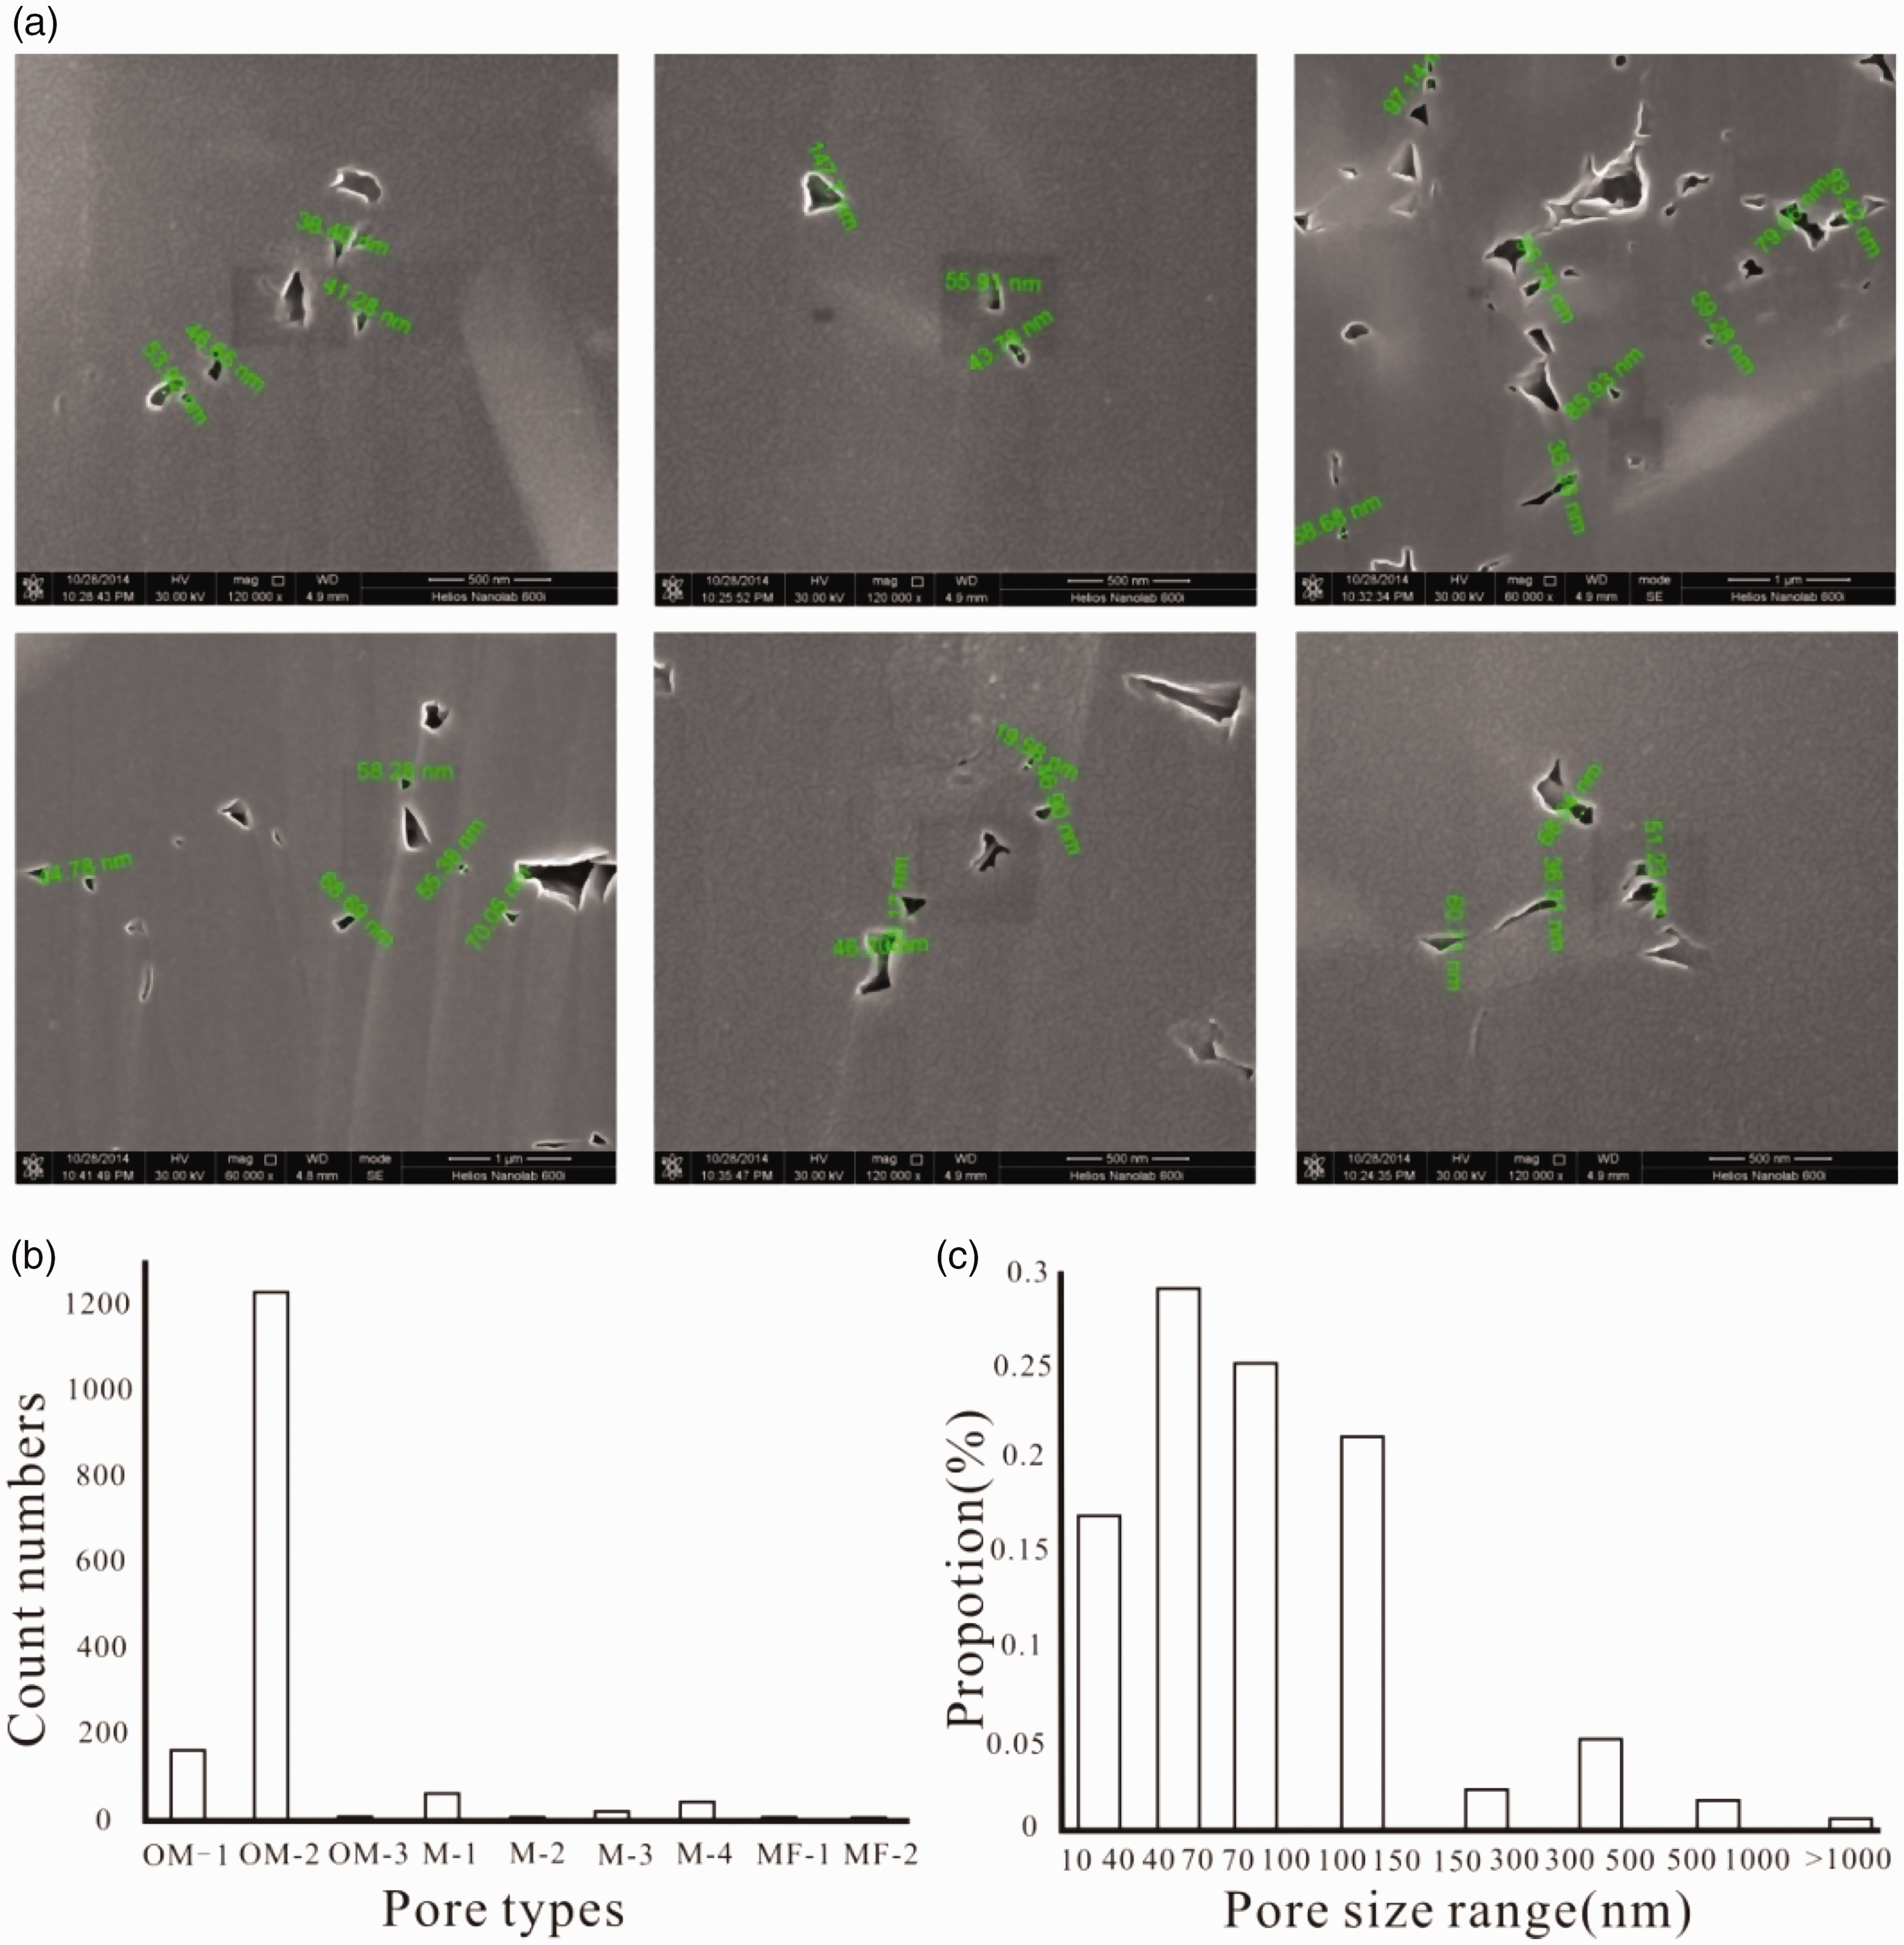
The statistics of classified nanoscale pores by FESEM image processing. (a) Representative FESEM images (secondary electron imaging); (b) the counted number of different pores; and (c) the proportions of pores in size ranges of 10–40 nm, 40–70 nm, 70–100 nm, 100–150 nm, 150–300 nm, 300–500 nm, 500–1000 nm, and >1000 nm, respectively, are shown. OM: organic matter; MF: micro-fracture.
Descriptive classification of nanopores in anthracite coals
A descriptive classification is useful to correlate pores to pore networks. As presented in Table 5, researchers have proposed several classifications based on pore size (Hodot, 1966), fractal characteristics (Su et al., 2005; Yao et al., 2008), formation mechanisms (Su, 2001; Xue et al., 2012), and micron scale morphological characteristics (Cai et al., 2014; Gan, 1972; Hao, 1987; Lawrie et al., 1997; Li et al., 2017; Liu et al., 2015; Su, 2001; Yao, 2011; Zhang et al., 2018). However, none of these is specialized to aim at nanoscale classification. Loucks et al. (2012) presented a descriptive approach to group matrix-related pores in shale into three major categories, including interparticle pores, intraparticle pores, and OM pores. High-rank coal seams are significantly different with shale in material composition and micro-structure. Thus, for easier description and a better understanding of pore networks, a specialized classification for coal pores, particularly for nanoscale pores, is in need.
Classifications of pores in coal using direct observation methods.
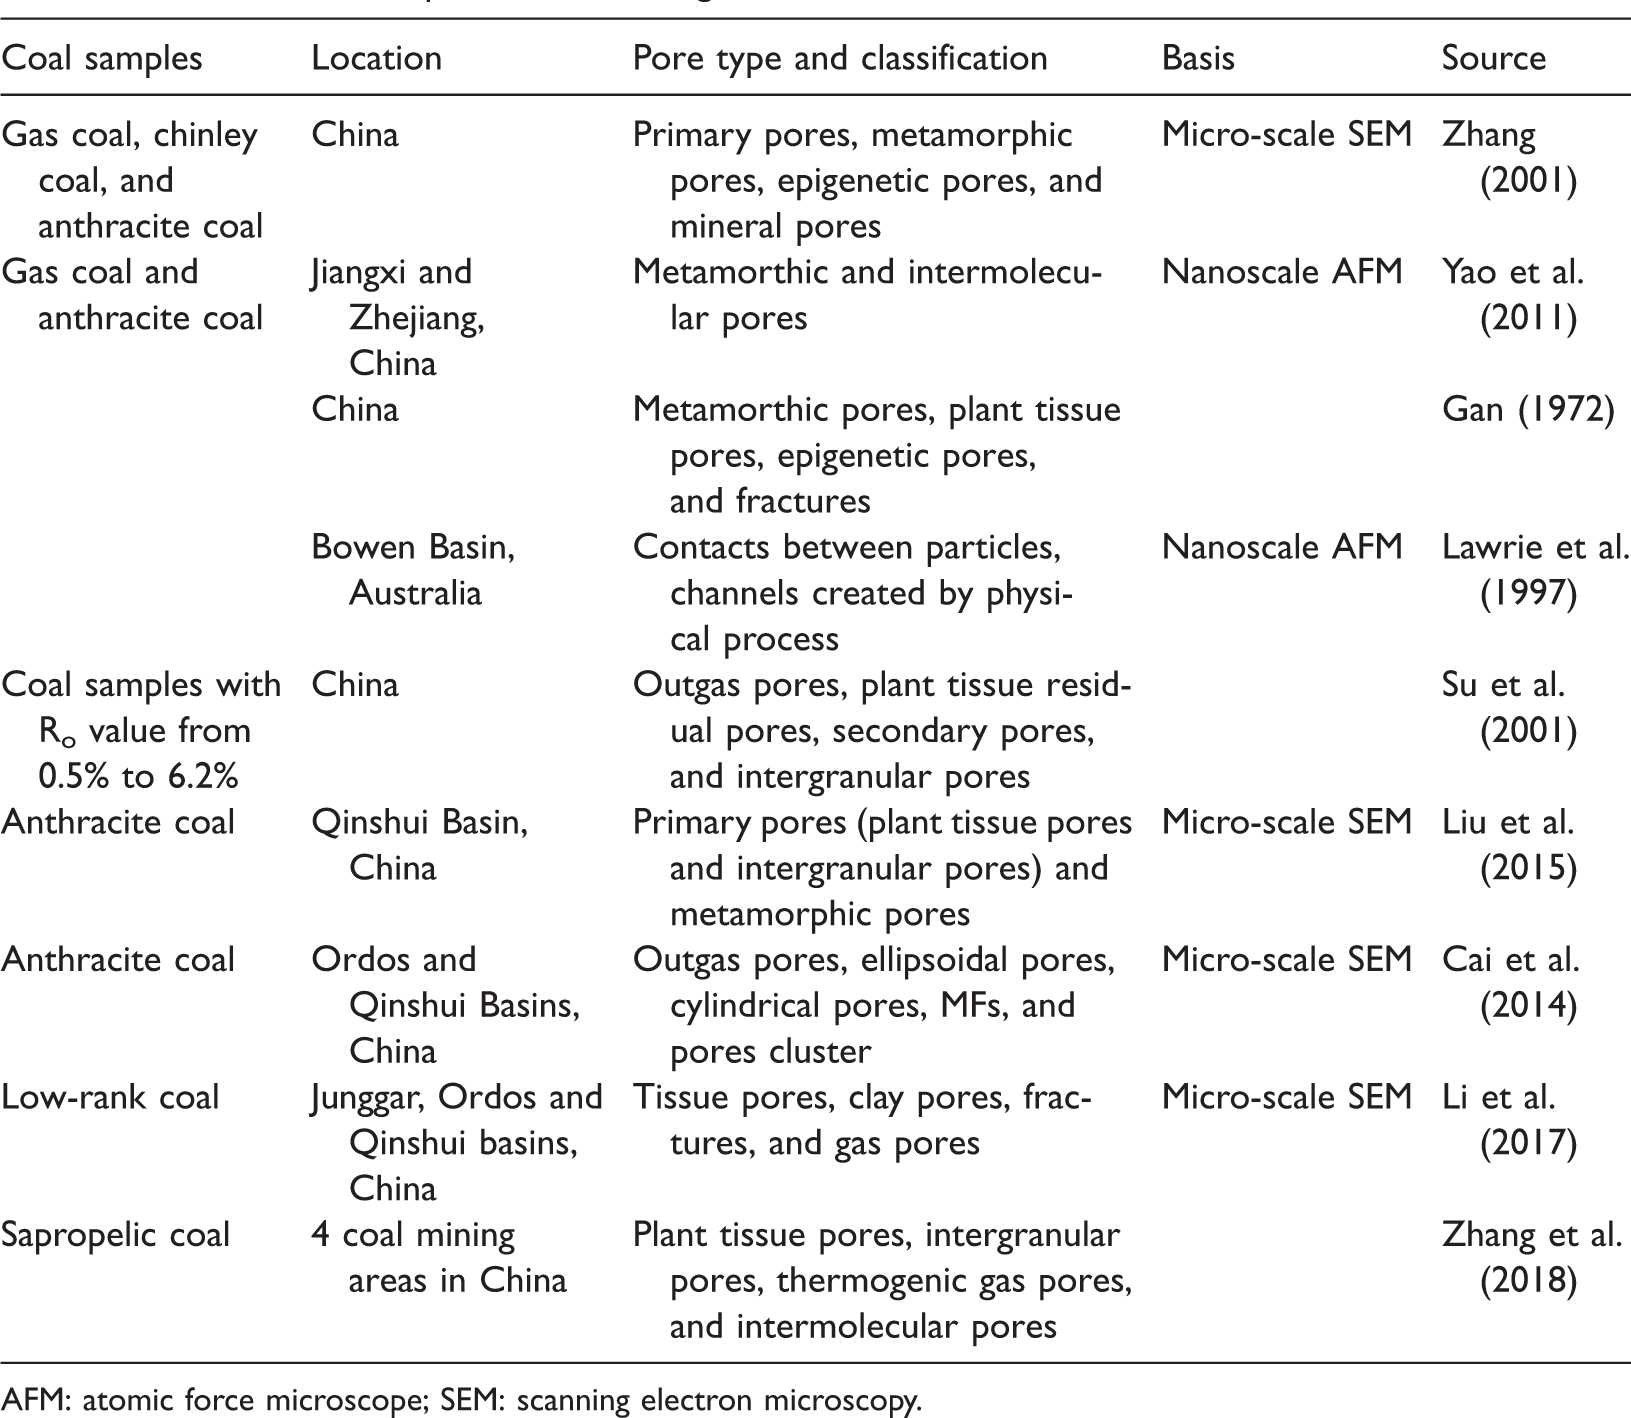
AFM: atomic force microscope; SEM: scanning electron microscopy.
The nanoscale pore types and representative images are shown in Figure 15. A new nanoscale descriptive classification with well-defined names, descriptions, shapes, and connectivity characteristics is presented in Table 6. Note that the connectivity characteristics are important to the pore volume evolution during coalification (Niu et al., 2017). The nanoscale reservoir space is composed of nanopores and MFs (MF-I and MF-II). OM nanopores have a genetic relationship with the original structure (OM-I), deformation (OM-II), and thermal evolution of organic particles (OM-III). Both OM-I and OM-II pores have been observed to be relatively isolated and distributed with poor connectivity in 2D. OM-III pores are rare or absent in the nanoscale. In part 4.3, the descriptions on different pore types have some repetitions with part 4.1.
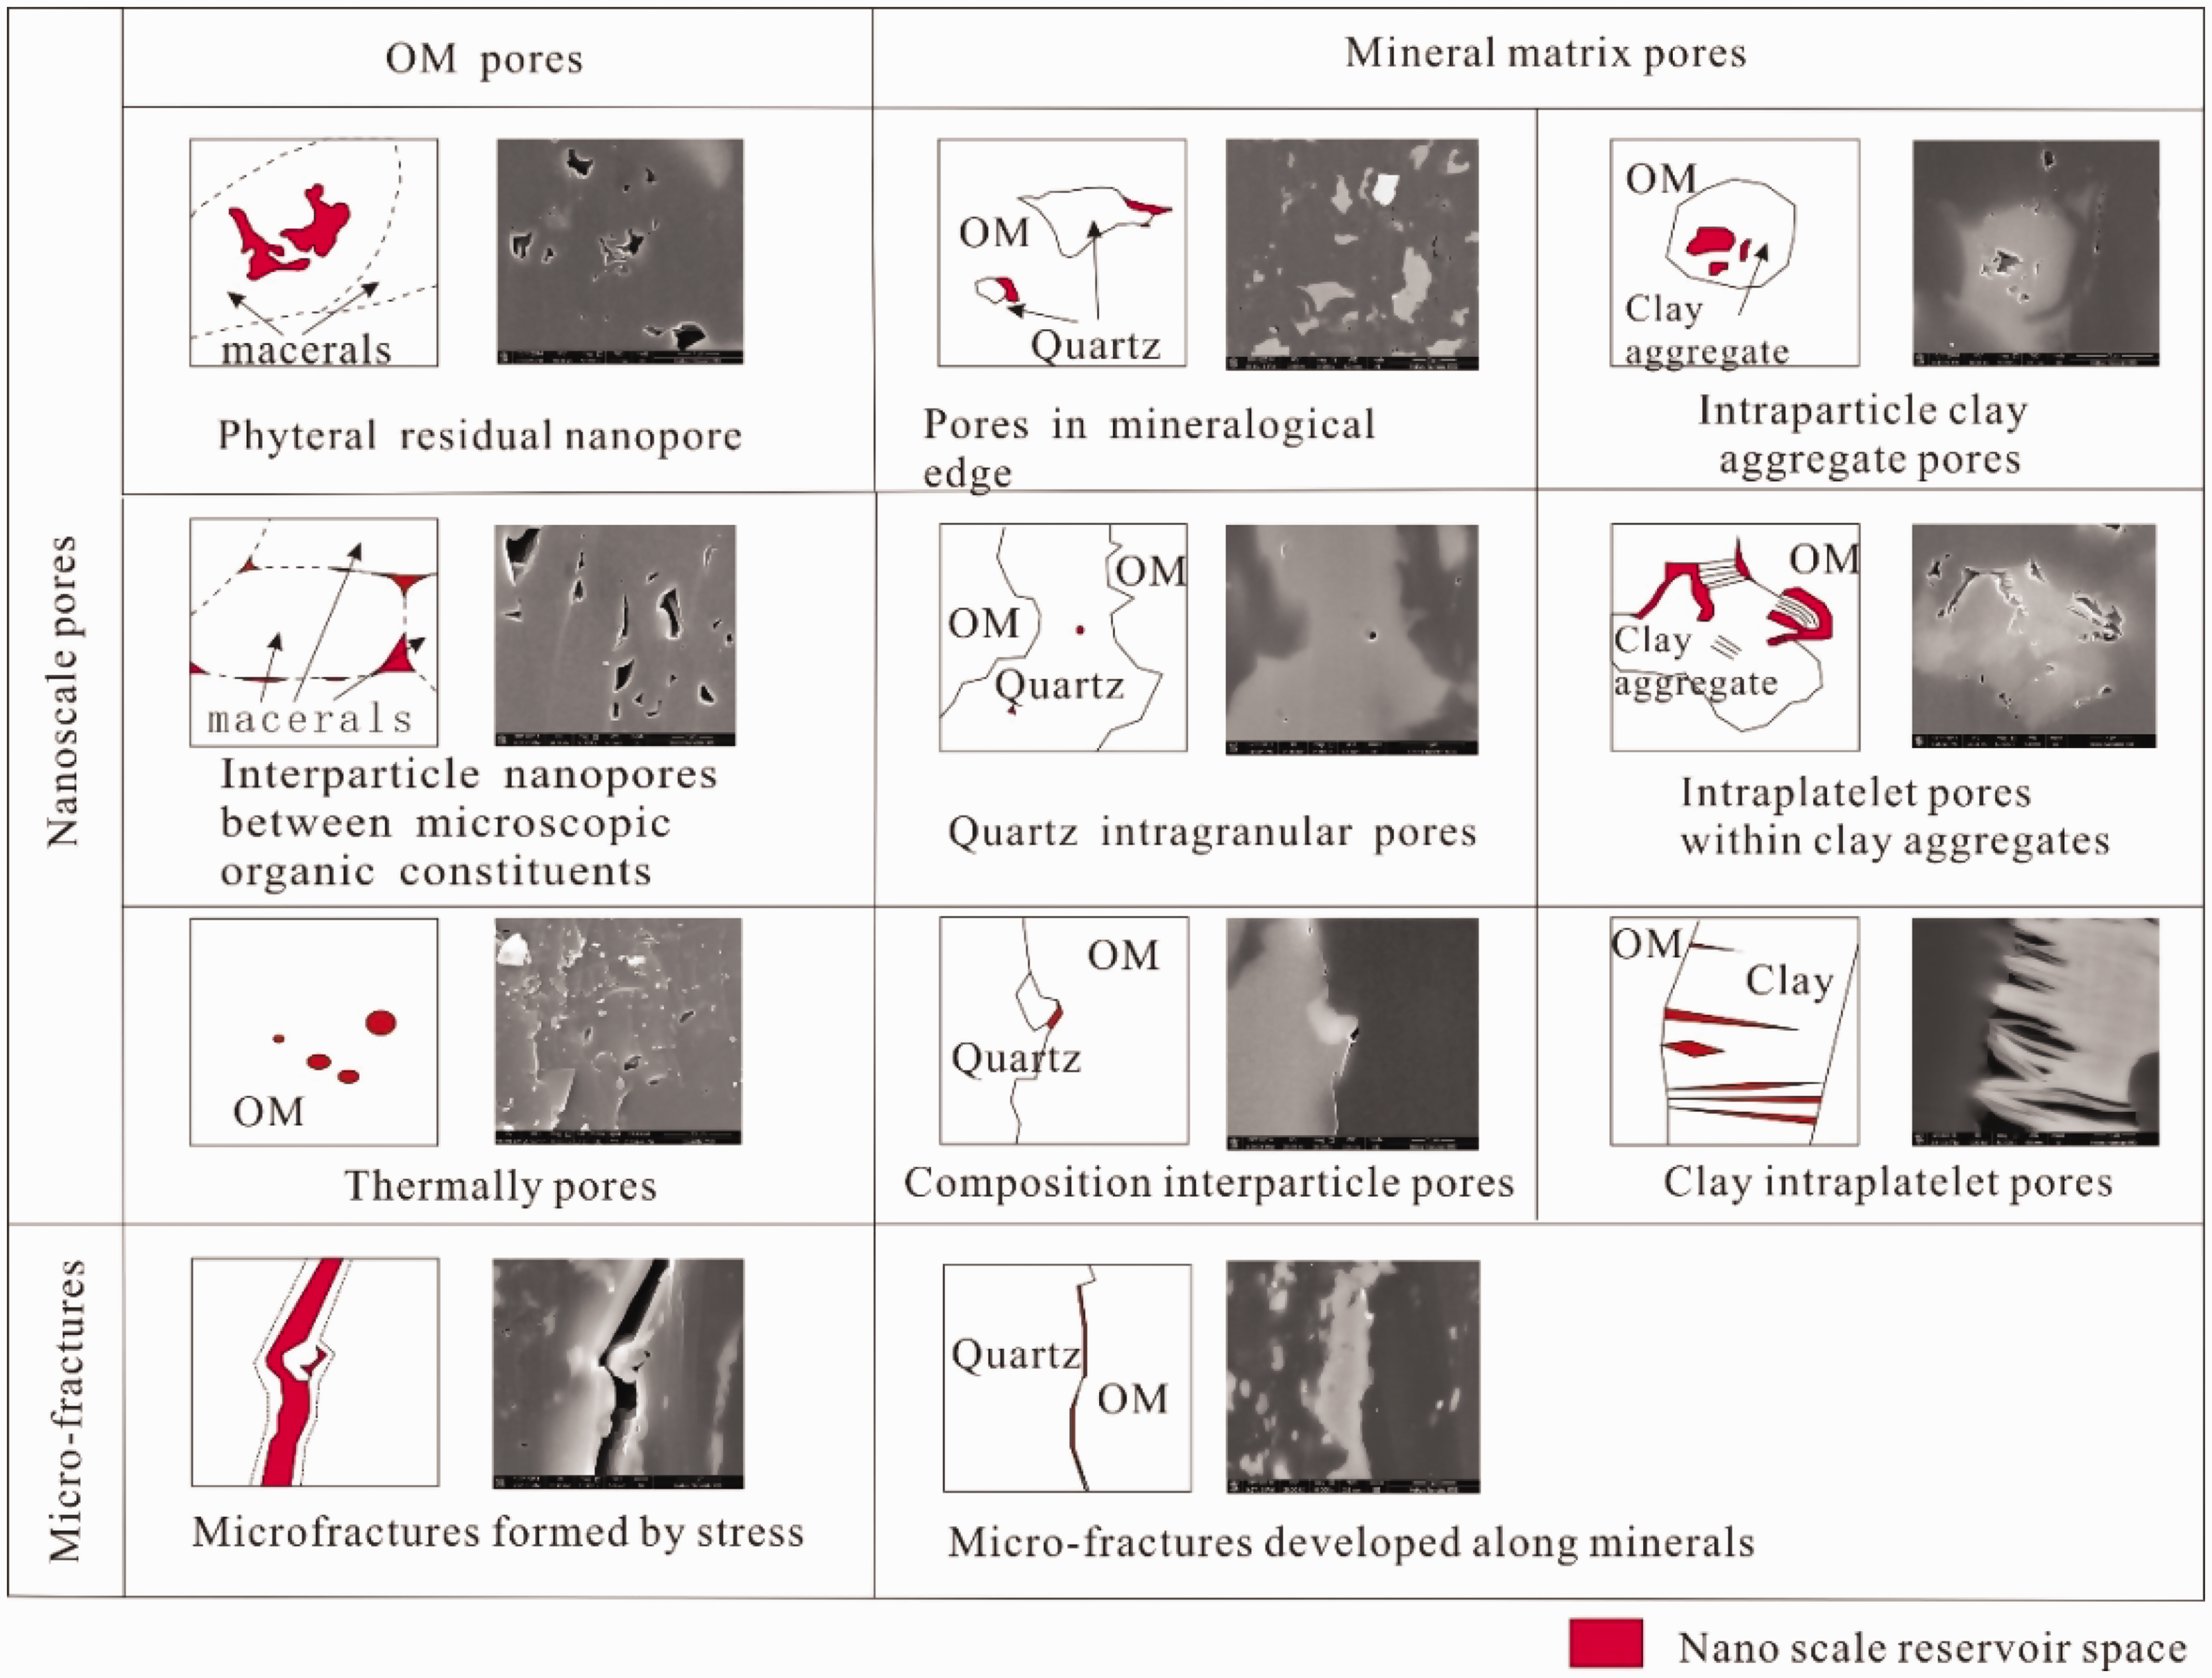
The nanoscale pore types in anthracite coals. OM: organic matter.
The descriptive classification of nanopores in anthracite coals.
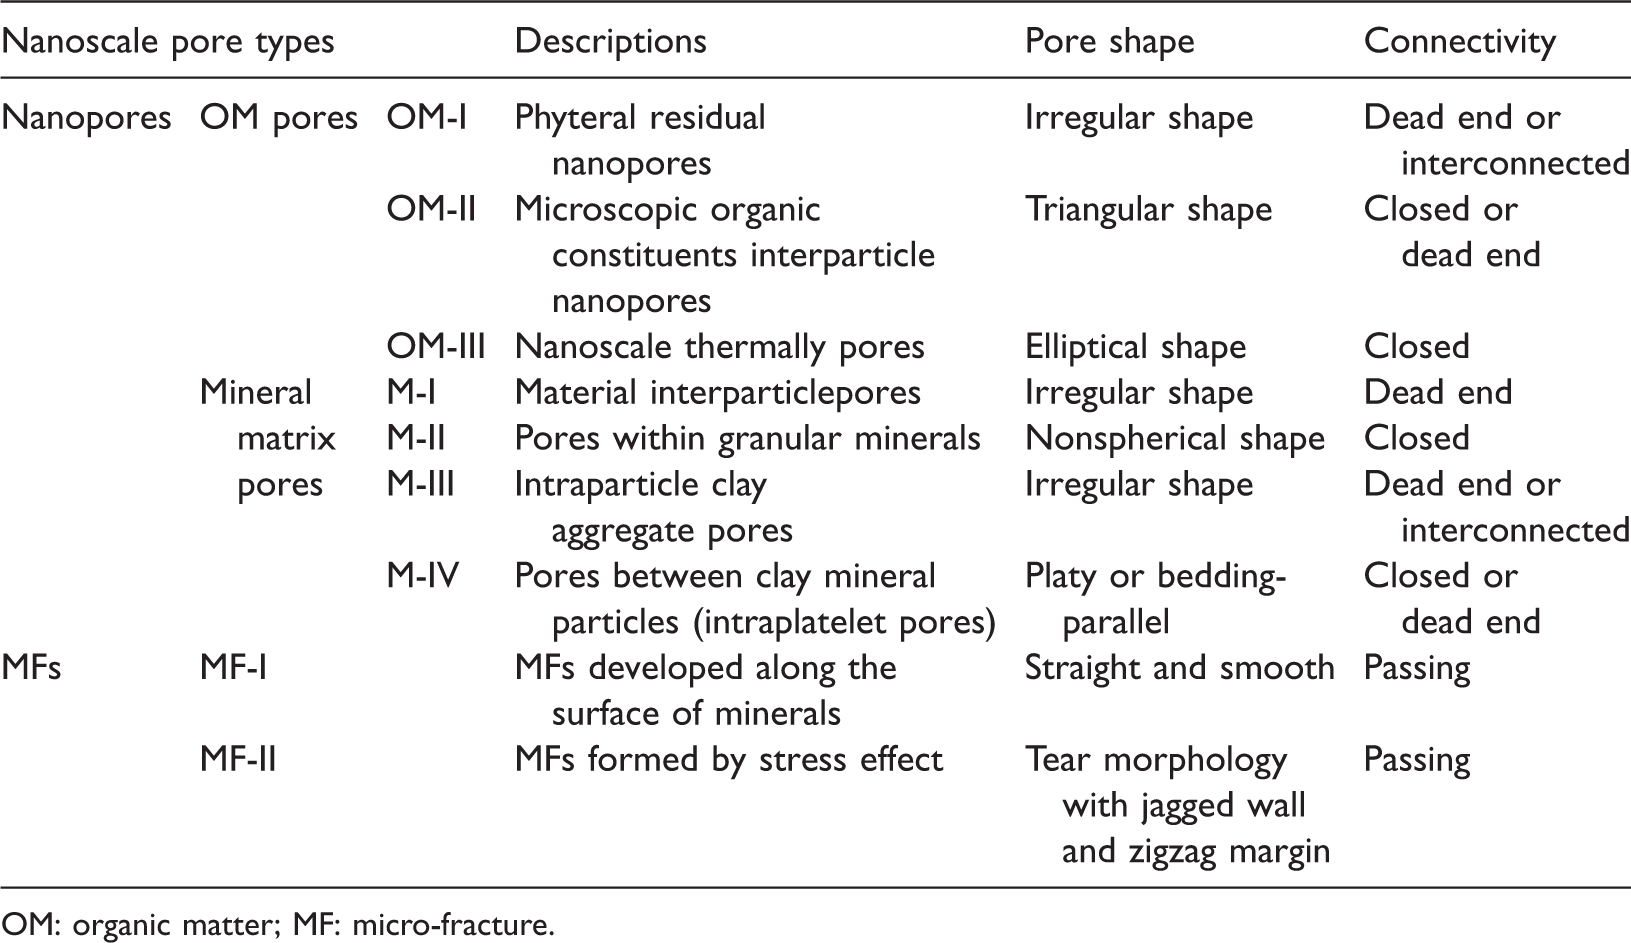
OM: organic matter; MF: micro-fracture.
Mineral pores are subdivided into four types: M-I pores, M-II pores, M-III pores, and M-IV pores. M-I and M-II pores are correlated with brittle minerals, such as quartz, while M-III and M-IV pores are correlated with clay minerals. Different types of mineral-related pores have significantly different shapes and connectivity characteristics. Compared with nanopores, MFs are developed with a larger size and better connectivity.
Discussions
Pore networks and quantitative characterization of nanopores
The types, proportions, and other structure features of the micro-reservoir space in the pore network vary greatly in different scales due to the different genesis and impact factors of pores. The quantitative characterization of pores in different scales helps to provide more accurate information and a deeper understanding of the pore network. Researchers have attempted to conduct a quantitative characterization through micro computed topography (micro-CT), gas adsorption, MIP, or image processing. However, most of the results were focused on micron scale pores or were unable to differentiate various pore types. The present study attempted to correlate pore type and genesis to radius and summarize the pore network characteristics by combining the quantitative test and qualitative observation.
As presented in Figure 16, one or more major pore types dominate each size range of the reservoir space in coal. In the molecular scale (<10 nm), the metamorphic and intermolecular pores are the predominant types, which are mostly smaller than 10 nm (Figure 16(a)), providing these reservoirs with a large specific surface area and strong adsorption capacity. Pores with diameters between 10 nm and 300 nm often fall into OM-I and OM-II pores, especially OM-II pores that develop at contact points of organic particles with regular geometry (Figure 16(b)). OM nanopores in coal are more spatially distributed, when compared with OM nanopores concentrated in OM inorganic rich shale (Loucks et al., 2012). The meso-porosity of high-rank coal is limited, especially in a pore size range of 300–1000 nm. The general pore types between 300 nm and 1000 nm are thermally epigenetic pores, phyteral residual pores, and mineral-related pores (Figure 16(c)). Among these, thermally epigenetic pores are comparatively more developed. Most pores with a diameter larger than 1000 nm are MFs and mineral-related pores with better connectivity (Figure 16(d)). The length of MFs, fractures, and cleats are usually larger than 10 μm (Figure 16(e)). Note that MFs and fractures can be distinguished by developmental scale and genesis. MFs usually have a length in micron scale and formed by the open of mechanical weak surfaces between different components, while fractures have a length in mm scale and mostly formed by tectonic stress.
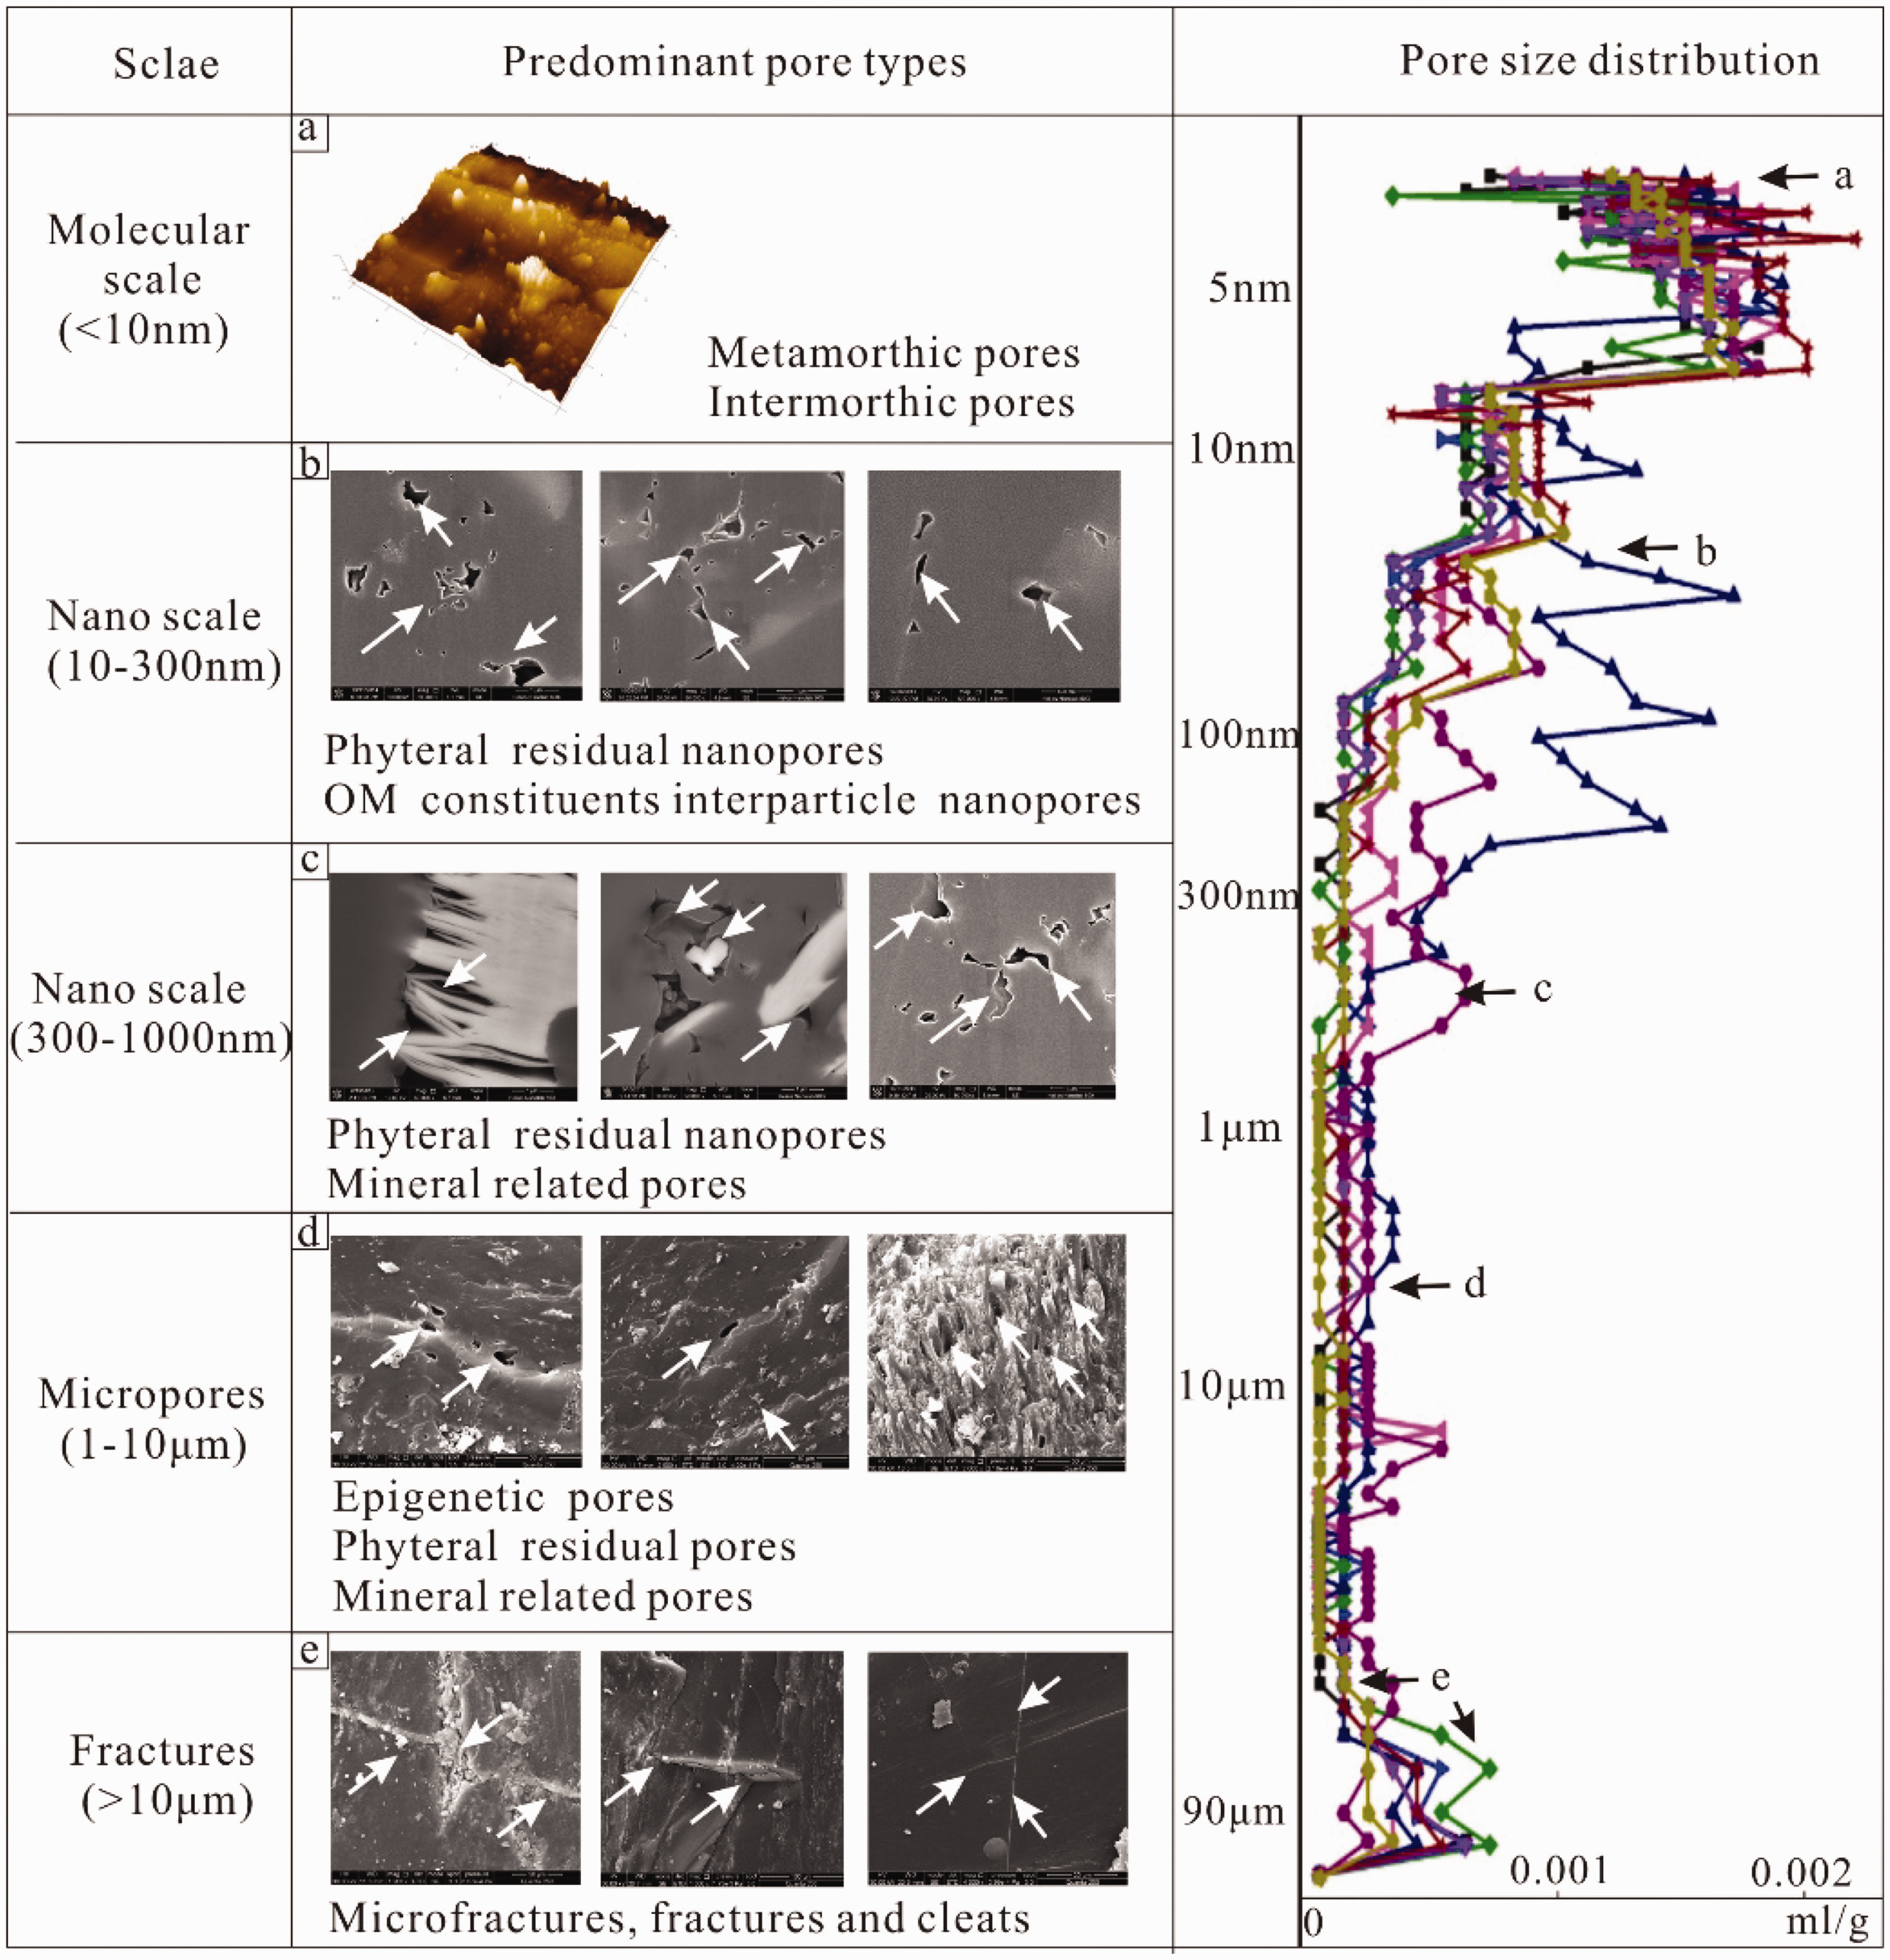
Predominant pore types of different scale in anthracite coal. OM: organic matter.
Molecular scale pores, nanoscale pores, micro-scale pores, and the MF scale reservoir space are connected with each other in various degrees. As a result, these play different roles in the process of gas accumulation and migration. Nanoscale OM pores and micro-scale epigenetic pores are poorly connected and spatially isolated distributed, providing the reservoir with a strong gas storage capacity, but relatively poor migration capacity, thereby leading to the problem of low micro-permeability in the coal matrix. In contrast, although less developed compared with OM pores, MFs and mineral-related pores have a larger pore size and better connectivity, providing seepage channels from nanoscale pores in the coal matrix to artificial cracks and drill holes.
The correlation of nanopores and micro-permeability
The initial CBM productivity is mainly influenced by macro-scale permeability, which is greatly determined by the closure degree of MFs, cleats, and cracks (Keshavarz et al., 2014). However, pore networks control long-term CBM productivity by determining the gas release ability in the coal matrix. Thus, the connectivity from nanopores to MFs and the full-scale characteristics of pore networks are the key influencing parameters of the “Bottle-Neck” problem during CBM exploitation (Fu et al., 2004).
Researchers have described the interconnectivity of pores and pore system characteristics to better understand the micro-seepage channels and gas transportation in coal (Figure 17(a) and (b)). For example, Gamson et al. (1996) described the micro-structure with increasing magnification from macro- to micro-scale (Figure 17(a)). Nie et al. (2015) described the micro-reservoir space, which consisted of passing, interconnected, dead-end, and closed pores (Figure 17(b)). However, these micro-structures were described without detailed nanoscale characteristics. Based on the qualitative and quantitative study, a more detailed micro-structure from the fracture-scale, macro-scale, and nanoscale to the molecular scale of high-rank coal is presented in Figure 17(c).
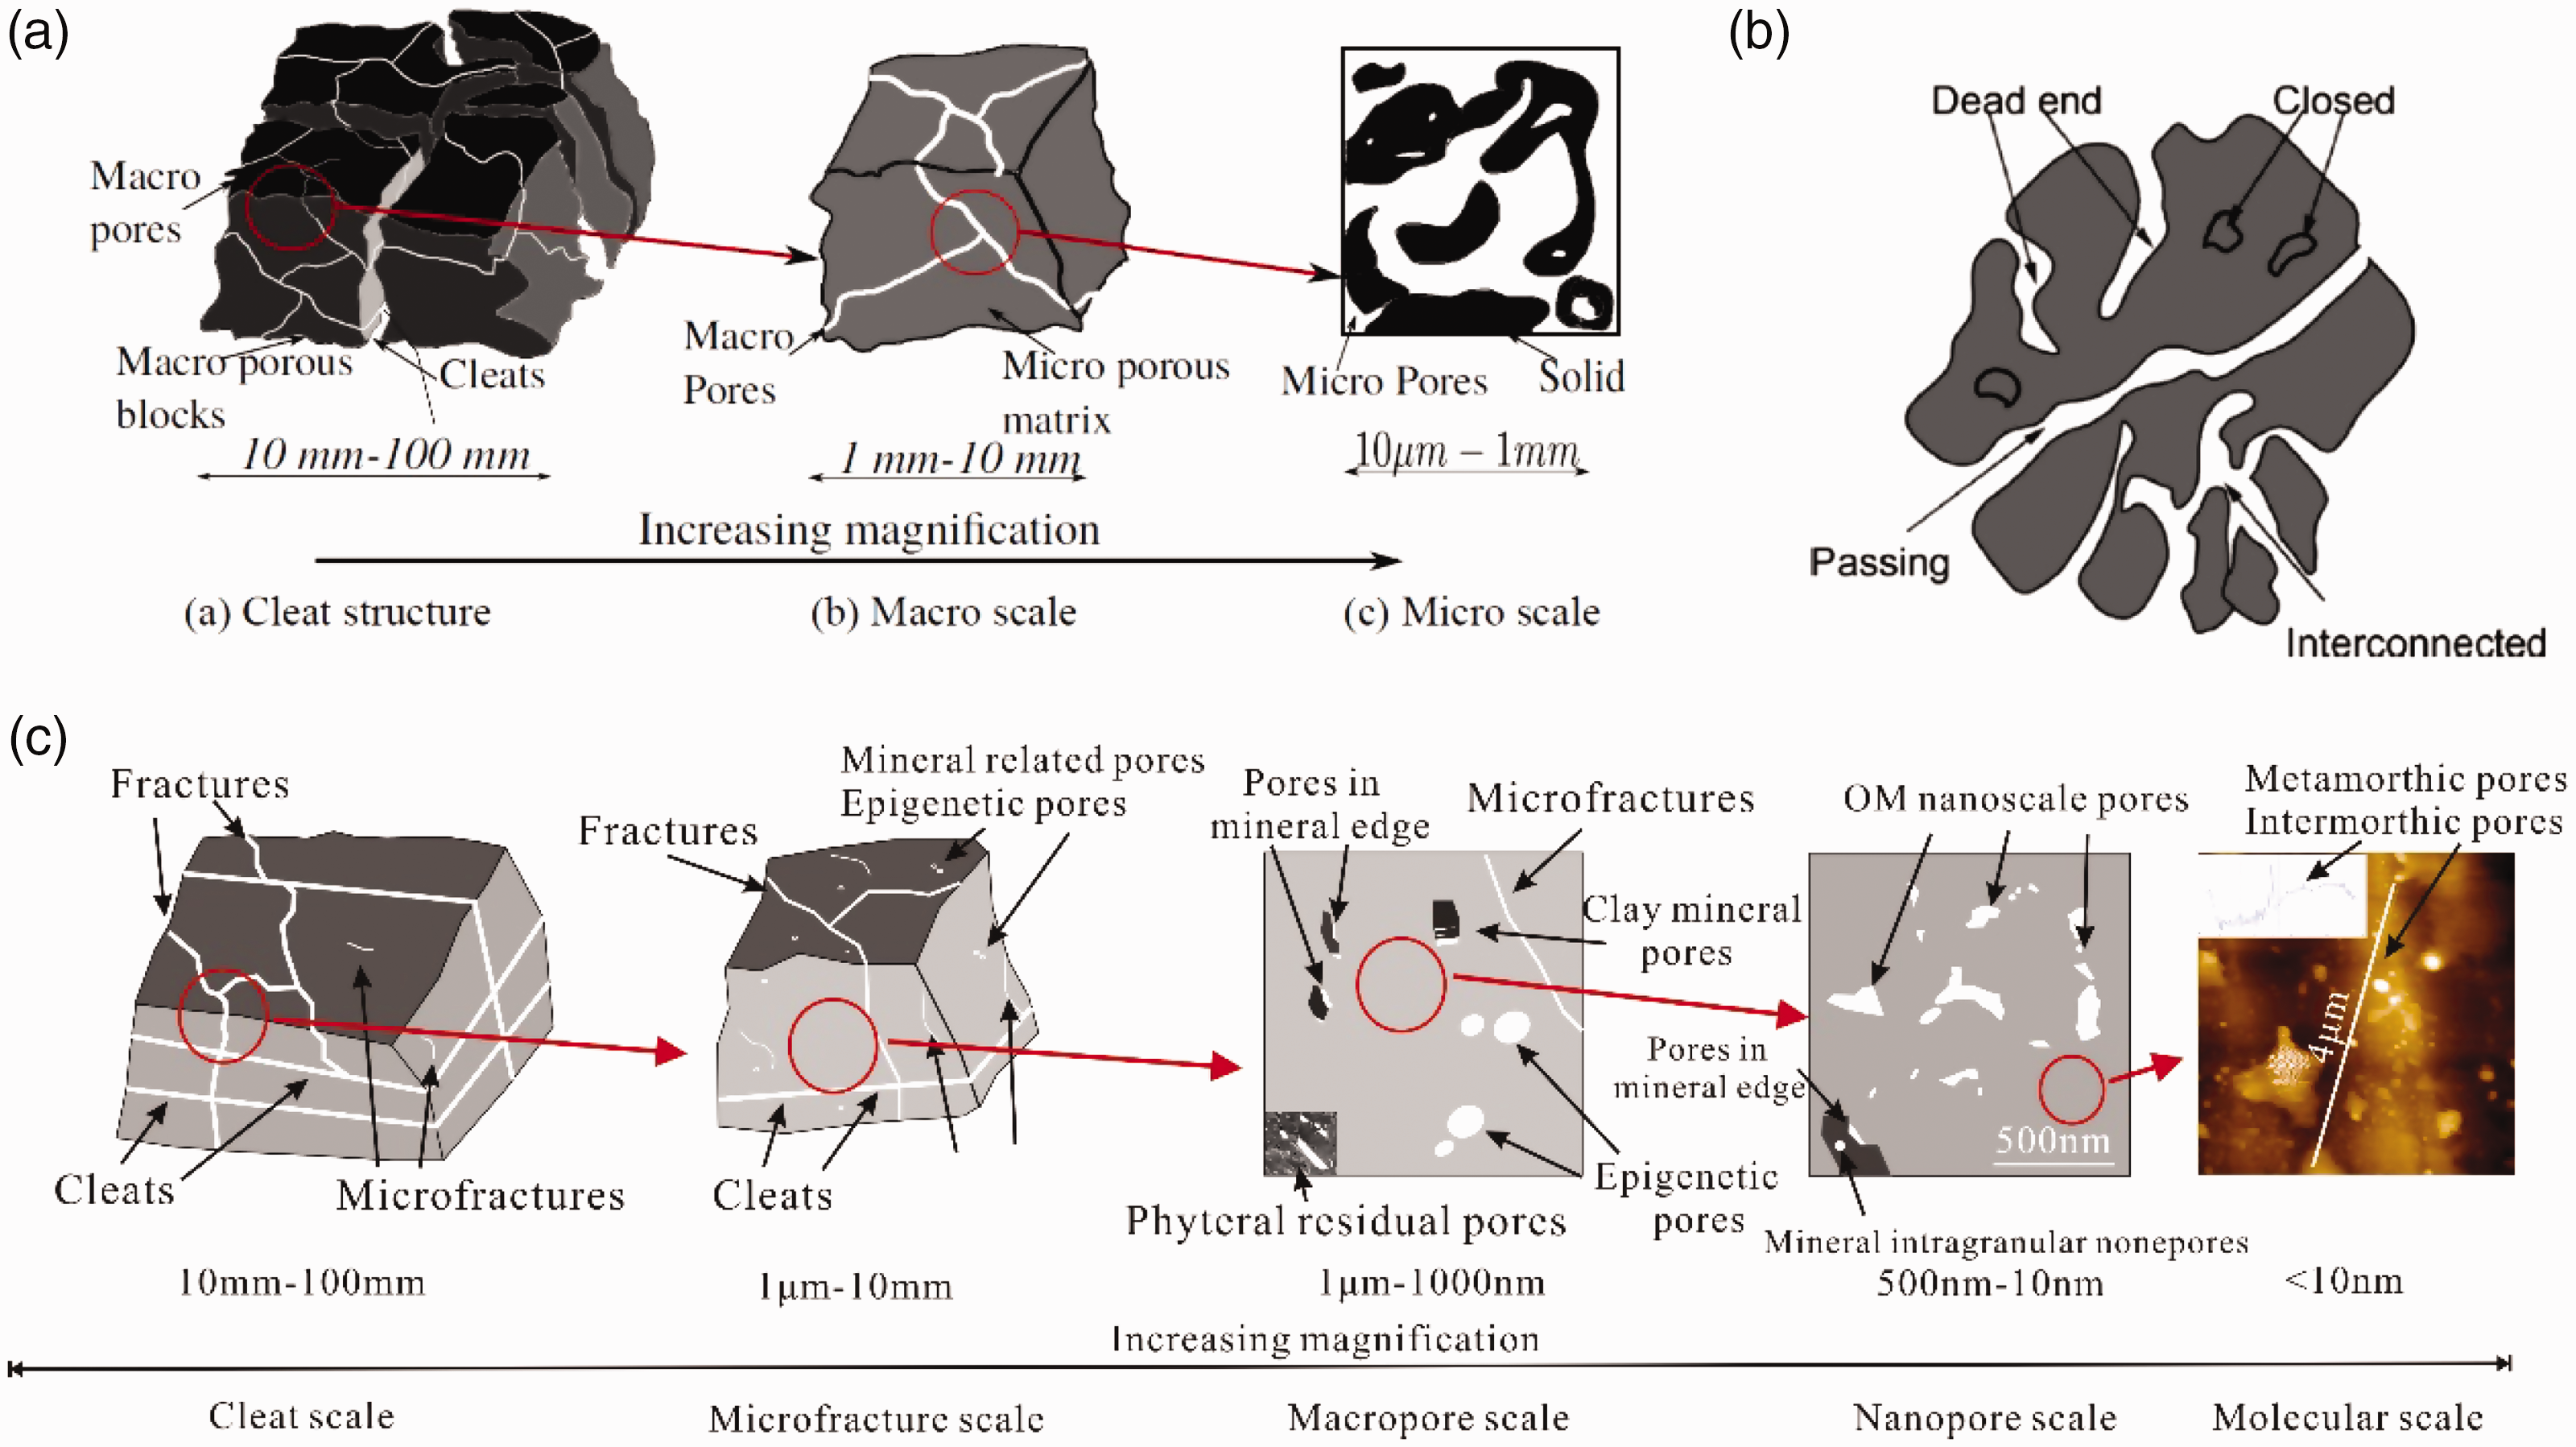
Microscopic pore structure in coal: (a) pore structure from cleat scale to micro-scale according to Gamson et al. (1996); (b) the connectivity of different pores according to Nie et al. (2015); and (c) the microscopic pore structure, major pore types, and corresponding gas transportation in high-rank coal from cleat scale, micro-fracture scale, macro-pore scale, nanopore scale to molecular scale. OM: organic matter.
The micro-structure characteristics, including PSD, pore type, spatial distribution and connectivity, have significant influence on the gas release ability of the coal matrix. At first, methane desorbs from the surface of macro-molecules with decreasing pressure (Stage A) and gathers in the molecular and nanoscale pores (Stage B), which are mostly OM pores. In the micro-regions, where OM pores are well developed or connected by MFs or mineral-related pores, methane is transported by these channels to cleats and fractures (Stage C-I) and subsequently to artificial fractures and cracks (Stage D). In porous regions of the coal matrix, methane was desorbed and transported through molecular pores to porous regions (Stage C-II) and released to macro-pores, MFs, fractures, and cleats (Stage D).
Pore structure and properties are important influencing factors of gas storage and flow in coal (Cai et al., 2014, 2016; Pan et al., 2010). Pore networks have a dual pore system of nanopores and macro-pores-MFs in the tested samples. Nanoscale pores are well developed with major genetic types of isolated OM nanopores, indicating a relatively good storage capacity (Firouzi et al., 2014; Ross and Bustin, 2009). Macro-pores are mainly mineral-related pores and gas pores, which form seepage channels in coal with MFs (Liu et al., 2015). However, the meso-porosity is limited, according to MIP, LP-N2GA, and image processing, revealing the lack of seepage channels between nanoscale pores and fracture-cleat networks in high-rank coal, reducing the micro-scale permeability in the coal matrix (Cai et al., 2016).
The seepage ability from nanoscale pores to MFs is named as “micro-permeability” in the present study, which was defined as a parameter that depicts the mass transfer efficiency in Stages B to D. This measures the process from molecular pores to OM nanopores and subsequently to mineral-related pores and MFs. However, there is no suitable method for testing micro-permeability at present. Describing the micro-structure of coal can provide an indirect basis for evaluating micro-permeability. Based on the nanoscale pore network characteristics, a feasible assumption was proposed that the micro-structure contributes to the low “micro-permeability” of high-rank coal. Specifically, it is reduced by the poor connectivity of nanopores and the lack of seepage channels between the nanoscale reservoir space and MFs. Thus, these nanoscale connectivity characteristics are the key to evaluate the efficiency of “micro-permeability,” which affects the total productivity of CBM in high-rank coal and results in low long-term productivity. “Micro-permeability” will be one of the key factors for the quantitative characterization and evaluation of gas release and the seepage ability of high-rank coal reservoirs.
As indicated by Fu et al. (2004), the special structure in high-rank coal leads to the good storage capacity and poor connectivity of reservoirs. In high-rank coal, the pores are well developed, but the connectivity between pores is relatively low. When mining gases from the high-rank coal reservoirs, gases from the isolated pores are transported in a low efficiency after the release of gases from the fractures, MFs, and connected pores. Thus, the special pore structure makes a predominant contribution to the good storage capacity and poor “micro-permeability” in high-rank coal in China (Fu et al., 2004), which influences the transportation of gas in the coal matrix and affects the gas production efficiency and total productivity of CBM. Although the application of AIP-FESEM, MIP, and LP-N2GA provides a first step and basis in relating pore characteristics to micro-scale reservoir properties, the impact of nanoscale structures on reservoir properties, the evaluation workflow of “micro-permeability,” and the approach to improve the “micro-permeability” of high-rank coal reservoirs remain as questions that are worthy to be further studied. Permeability test on high-rank coal samples after reduction (as small as MF scale) might be possible to minimize the influence of cracks and fractures on the measure of micro-permeability to a certain extent. Simulations based on natural structure characteristics will be helpful to further reveal the influence of pore structure on “micro-permeability.”
Conclusion
The nanoscale pore structure was investigated by AIP-FESEM, MIP, and LP-N2GA using 10 high-rank coal samples. A variety of nanoscale pores was identified with different genesis and morphological characteristics, proposing that poor micro-permeability in high-rank coal may derive from the special micro-structure. Specifically, the following conclusions could be drawn:
Images of the nanoscale pores with high resolution were provided by AIP-FESEM. A descriptive classification was presented to correlate nanoscale pores to networks with three major pore types of OM pores, mineral-related pores, and MFs. OM pores contain phyteral residual nanopores (OM-I), microscopic organic constituent interparticle nanopores (OM-II), and nanoscale thermal pores (OM-III). Mineral-related pores in the nanoscale were further divided into four types, including pores in the mineralogical edge (M-I), granular minerals intraparticle pores (M-II), clay aggregate intraparticle pores (M-III), and clay minerals intraplatelet pores (M-IV). MFs can be divided into MF-I and MF-II, indicating the different genesis of nanoscale pores in high-rank coal. MIP and LP-N2GA were conducted to reveal the PSDs and shape features. These results show that the PSDs of high-rank coal are bimodal distributed and had two broad peaks. The specific surface area was concentrated at <10 nm. FESEM image processing provides a direct proof of the bimodal PSD, and the major peak at approximately 10–150 nm. The quantitative test and qualitative observation were combined to provide new insights of the nanoscale pore system. A major peak at approximately 20–400 nm was mostly associated with isolated OM-II pores with polygonal or triangular shape, while a minor but prominent peak at the macro-pore to MF scale was more associated with thermally epigenetic pores, mineral-related pores, and MFs. A descriptive classification for nanoscale pores that consist of three major groups, and nine subtypes was summarized to correlate pores to networks. The OM nanopore was the predominant pore type with relatively poor connectivity. Mineral-related pores have a larger pore size but have lower quantity with better connectivity when compared to OM pores. Furthermore, these can easily form seepage channels. OM-II pores with polygonal or triangular shapes were the major contributors to the nanoscale reservoir space in coal samples. Pore networks have a dual pore system of nanopores and macro-pores-MFs with limited meso-porosity in high-rank coal. The seepage ability from nanoscale pores to MFs is named as “micro-permeability,” which is a key evaluation parameter for the gas release and seepage ability in the coal matrix. This is defined as a parameter that depicts the mass transfer efficiency from molecular and nanoscale pores to mineral-related pores and MFs. The special pore structure made a predominant contribution to good storage capacity and poor “micro-permeability,” which influences the transportation of gas in the coal matrix and affects the gas production efficiency, total productivity and long-term capacity of CBM.
Footnotes
Acknowledgements
The author Difei Zhao thanks to the China Scholarship Council (CSC) for providing the CSC scholarship for occupational training at the University of Queensland. Special thanks are given to Editor Prof. Yuzhuang Sun, Associate Editor Cunliang Zhao, and the reviewers for the valuable comments on the manuscript.
Declaration of conflicting interests
The author(s) declared no potential conflicts of interest with respect to the research, authorship, and/or publication of this article.
Funding
The author(s) disclosed receipt of the following financial support for the research, authorship, and/or publication of this article: This work was supported by National Natural Science Foundation of China (No. 41772130), Coal-Based Key Scientific Research Project of in Shanxi Province (MQ201402), Scientific Research Foundation of Key Laboratory of Coalbed Methane Resources and Reservoir Formation Process, Ministry of Education (China University of Mining and Technology) (No. 2015–007), and Scientific Innovation Training Program of School of Resources and Geosciences, China University of Mining and Technology (CSA201705).