
Abstract
The variation of coal rank in the Anyang-Hebi (Anhe) coalfield has the phenomenon of anti-Hilt law, which makes the coalfield distinctive for coalbed methane exploration research. The methane adsorption characteristics and influencing factors of the medium-to-high rank coal samples of the Shanxi Formation in this coalfield were analyzed. The results indicate that the Langmuir volume (VL) of coals in the shallow western part of the Anhe coalfield is generally higher than that in the deep eastern part. The coal rank and the coal macerals are the dominant factors that influence the methane adsorption capacity of coals in this anti-Hilt law area. The methane adsorption capacity, represented by VL, first increases and then decreases with the coal rank, and the highest VL value corresponds to the maximum vitrinite reflectance of ∼2.1%. The adsorption capacity has a positive correlation with the vitrinite and the moisture content, a negative relationship with the inertinite content. In general, the adsorption capacity of coal samples shows a “V-shaped” change with the ash yield, and the lowest VL value corresponds to the ash yield of ∼9%. A prediction model of the gas content of the Anhe coalfield was proposed based on changes of the methane adsorption capacity and principal component analysis. Areas with a critical depth ranging from 400 m to 700 m are suggested to be methane enrichment regions for coalbed methane exploration in the Anhe coalfield.
Keywords
Introduction
Coalbed methane (CBM) is a type of unconventional natural gas, which is characterized by self-generation and self-accumulation in coals. The occurrence types of CBM include adsorption gas, a small amount of free gas, and dissolved gas (Rogers et al., 1994). The adsorption characteristics of methane in coal are key factors in both affecting the gas content of coal and determining the recovery of CBM (He et al., 2016; Li et al., 2016; Perera et al., 2012).
The methane adsorption characteristics are influenced by the internal factors of coal and external factors (Rogers et al., 1994). Internal factors include coal rank, ash yield, moisture content, coal macerals, and pore structure (Chalmers and Bustin, 2007; Crosdale et al., 2008; Gensterblum et al., 2016; Li et al., 2016). External factors include temperature, pressure, and coal particle size (Gensterblum et al., 2016; Krooss et al., 2002; Pan et al., 2012; Perera et al., 2012).
The coal rank has an important effect on the methane adsorption capacity (Hou et al., 2017; Laxminarayana and Crosdale, 1999). A number of studies on the medium-to-high rank coals have shown that the methane adsorption capacity increases with the coal rank (Bustin and Clarkson, 1998; Cheng et al., 2017; Yao and Liu, 2007), while other studies proposed that there is an U-shaped correlation between the methane adsorption capacity and the coal rank (Laxminarayana and Crosdale, 1999). The coal macerals also have influences on the methane adsorption capacity, and the different maceral groups, such as vitrinite, inertinite, and liptinite, show different behaviors in influencing the methane adsorption capacity (Rogers et al., 1994). Most studies found that the adsorption capacity displays a positive relationship with the vitrinite content, a negative correlation with the inertinite content (Clarkson and Bustin, 1996; Hildenbrand et al., 2006; Yao and Liu, 2007), although some studies demonstrated that there is no significant relationship between the methane adsorption capacity and organic macerals (Bustin and Clarkson, 1998; Faiz et al., 2007; Olajossy, 2013). In addition, the existence of moisture and ash may reduce the storage space of methane, and thus lead to a decrease in the methane adsorption (Gensterblum et al., 2013; Laxminarayana and Crosdale, 2002; Levy et al., 1997; Suuberg et al., 2002). In spite of this, there are some other studies which have argued that the methane adsorption capacity has a positive correlation with the moisture content (Mastalerz et al., 2004).
The correlation between the coal rank and the burial depth in the Anyang-Hebi (Anhe) coalfield has the phenomenon of anti-Hilt law, that is, the vitrinite reflectance decreases with the burial depth. The methane adsorption characteristics of coals in the areas conformed to the Hilt law have been documented in many studies (Hildenbrand et al., 2006; Lamberson and Bustin, 1993; Mastalerz et al., 2004), while there were fewer researches on methane adsorption characteristics in the anti-Hilt law regions. In this case, the methane adsorption capacity may have a different scenario, and its relationship with the coal burial depth and thus with the coal rank, maceral composition, moisture content, and ash yield may have a different behavior from the area conformed to the Hilt law.
In this paper, the methane adsorption characteristics and influencing factors of the middle to high-rank coals in the Anhe coalfield were studied. In particular, the influence of the coal rank, maceral composition, moisture content, and ash yield on the methane adsorption capacity was investigated. A model for the prediction of the gas content of coals in the Anhe coalfield was proposed based on principal component analysis (PCA).
Geological setting
The Anhe coalfield is one of the strategic replacement areas of CBM exploration and development in northern China (Shao et al., 2015), covers an area of approximately 900 km2, and contains abundant CBM resources (1115.7 × 108 m3, Liu et al., 2008; Wang, 2009). It comprises the Anyang and Hebi mining areas, including Zhujiao mine, Hongling mine, Dazhong mine, Shuangquan mine field, Anlin mine, Longshan mine, Hebi ninth mine, Hebi fourth mine, Hebi third mine, Hebi fifth mine, Hebi sixth mine, Hebi eighth mine, and Hebi 10th mine, from north to south (Figure 1). The Anhe coalfield has a NW–SE strike, dipping toward east with a dip angle of ∼20°. The secondary structure in this area is dominated by faults and folds, which can be subdivided into four groups based on their directions: NNE, NE, EW, and NW (Figure 2(a)). The Carboniferous–Permian (coal-bearing strata) is up to 827.2 m thick and includes 31 layers of coal. The total thickness of the coal seams is 15.12 m. Among them, the Taiyuan and Shanxi formations are the main coal-bearing strata containing nine and five coal seams, respectively (Liu et al., 2008). Furthermore, the Shanxi Formation is covered by the Lower Shihezi Formation, and the thickness of which is less than 300 m based on the analysis of 25 boreholes. The sandstones at the bottom of the Lower Shihezi Formation are the overburden rocks of the Shanxi Formation. In the Anhe coalfield, the No. 21 coal seam of the Shanxi Formation is the target horizon for CBM exploration due to its large thickness (average, 6.95 m) and continuous lateral distribution. In general, the thickness of No. 21 coals in the northwest is larger than that in the southeast (Wang, 2009). As shown in Figure 3, the depositional environment of the Shanxi Formation was dominated by a delta where the inter-distributary bay is believed to be the major coal-forming environment (Shao et al., 2014).
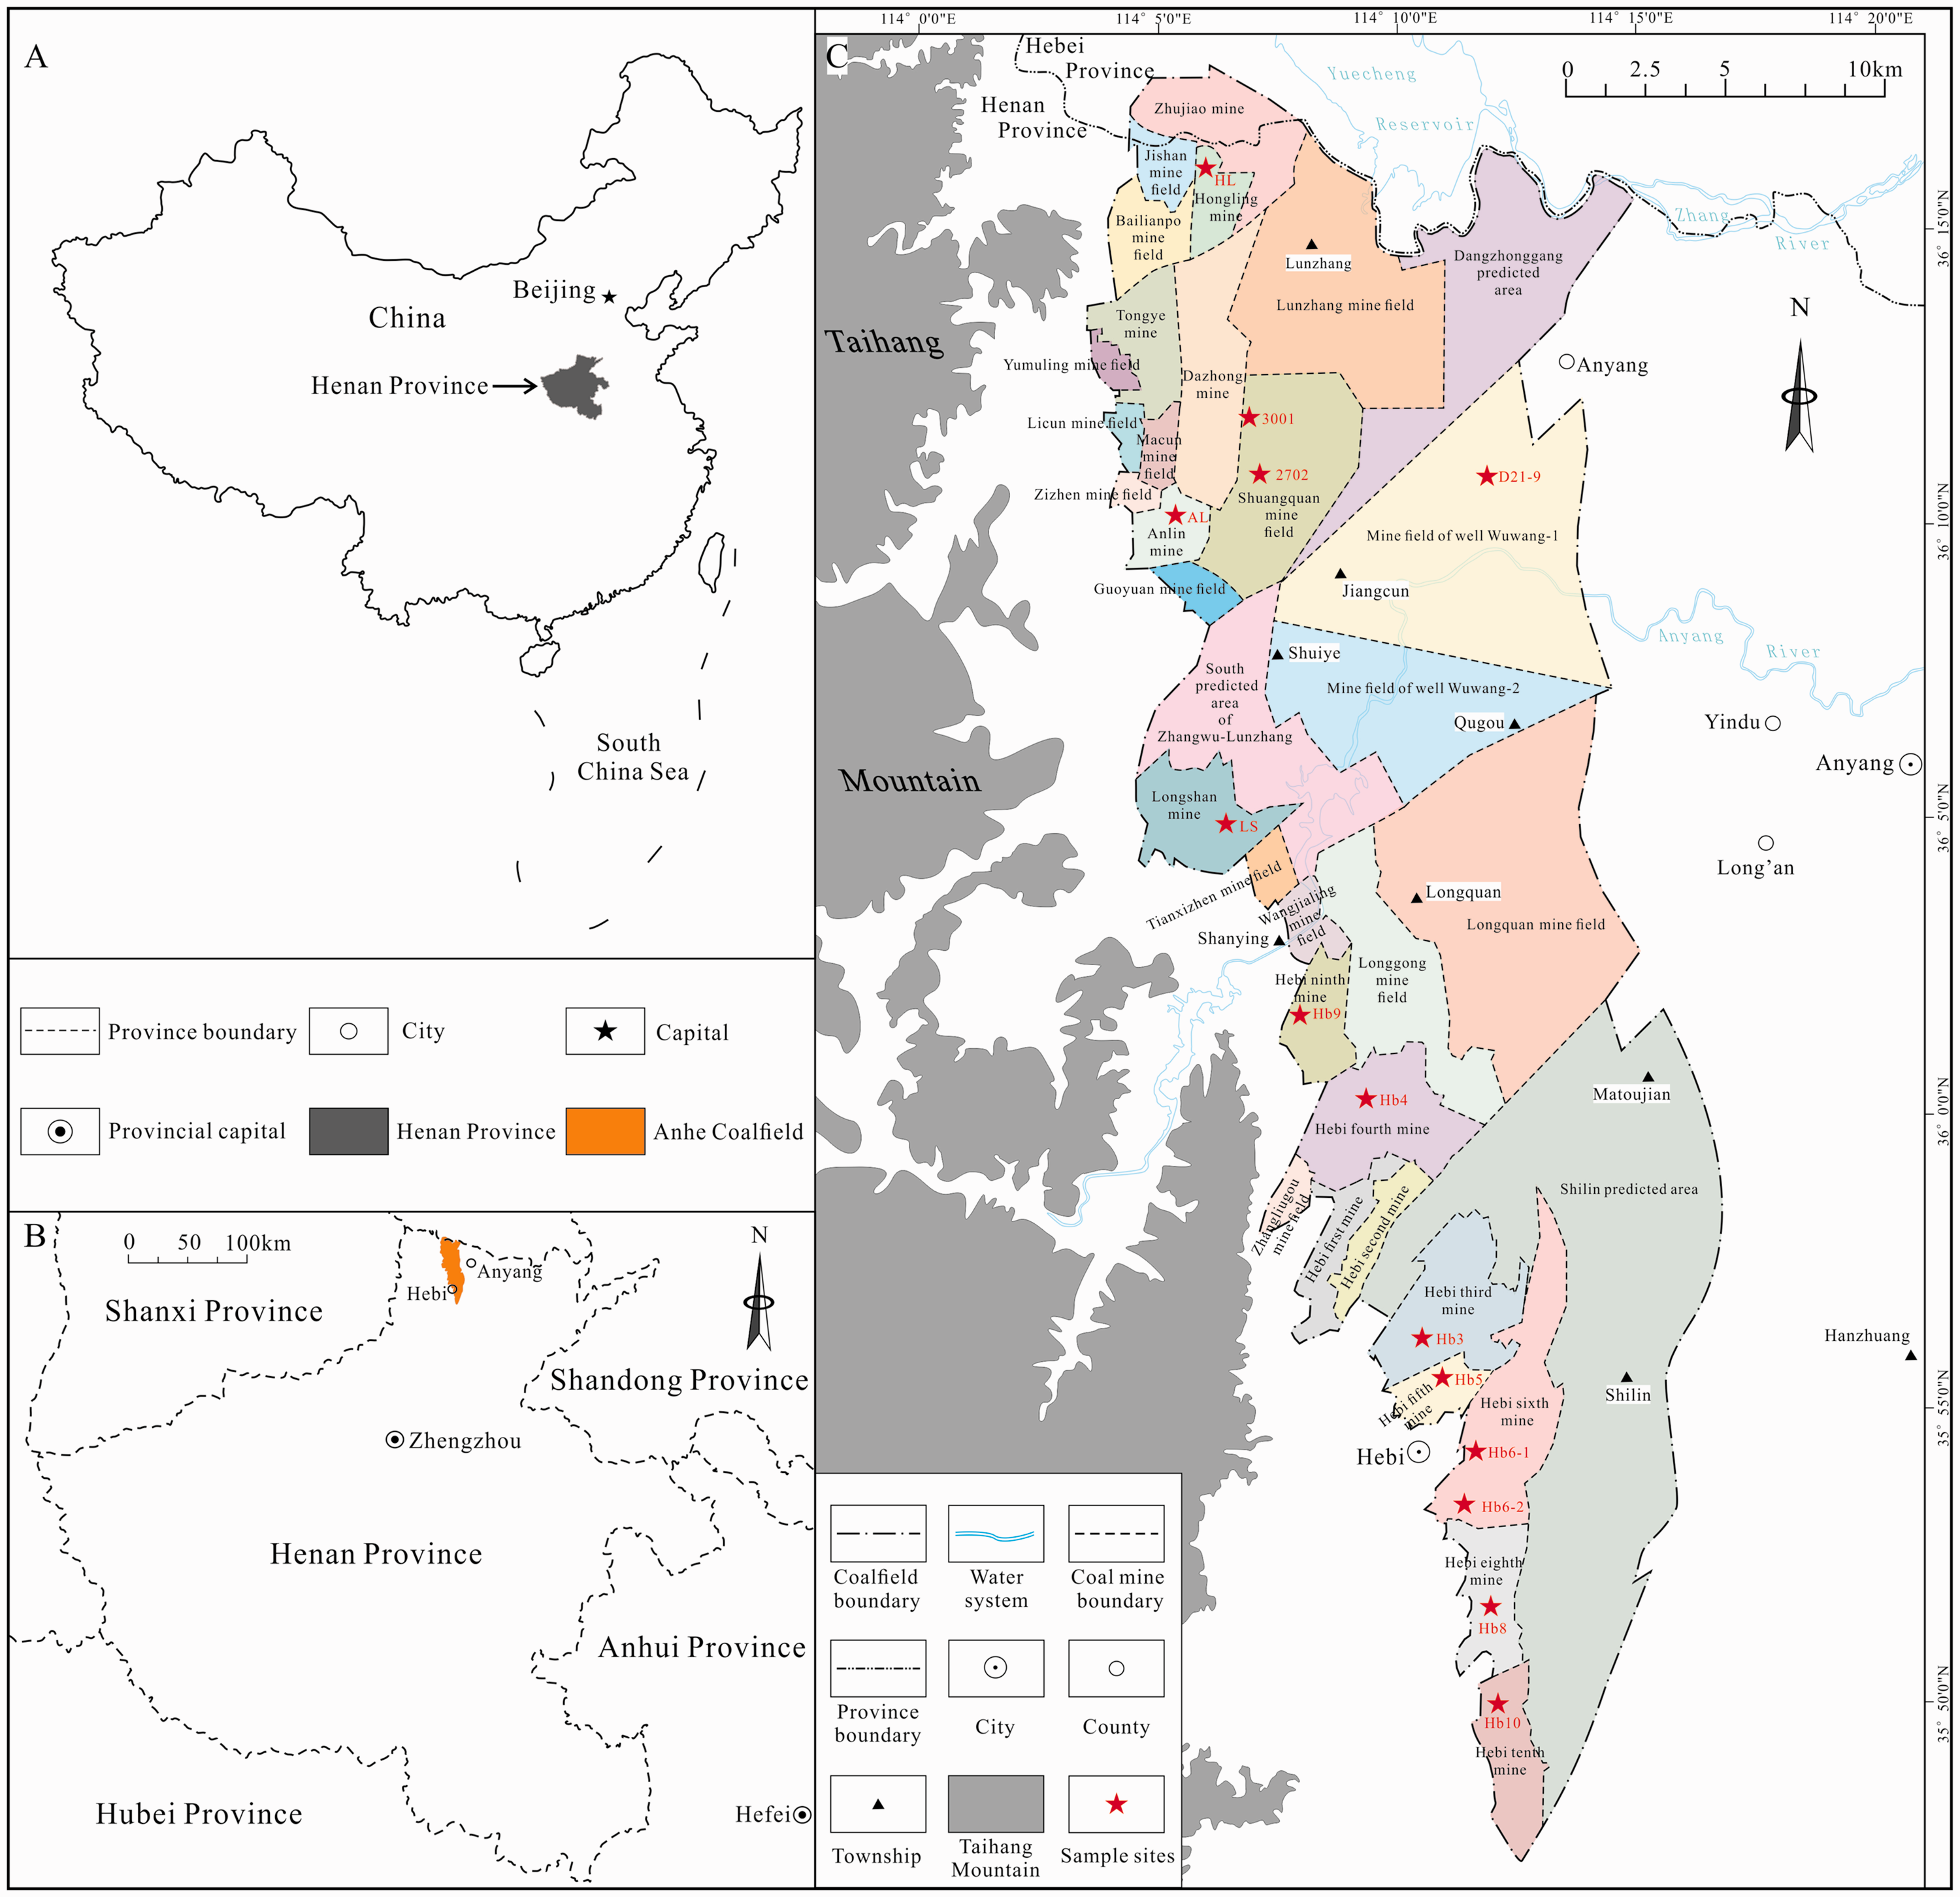
Location of the Anhe coalfield and sample sites in the study area. (a) Location of the Henan Province; (b) location of the Anhe coalfield. The Anhe coalfield is located in the eastern Taihang Mountains in the northern Henan Province; (c) distribution of mine fields in the study area. The Anhe coalfield consists of dozens of coal mines and prediction areas.
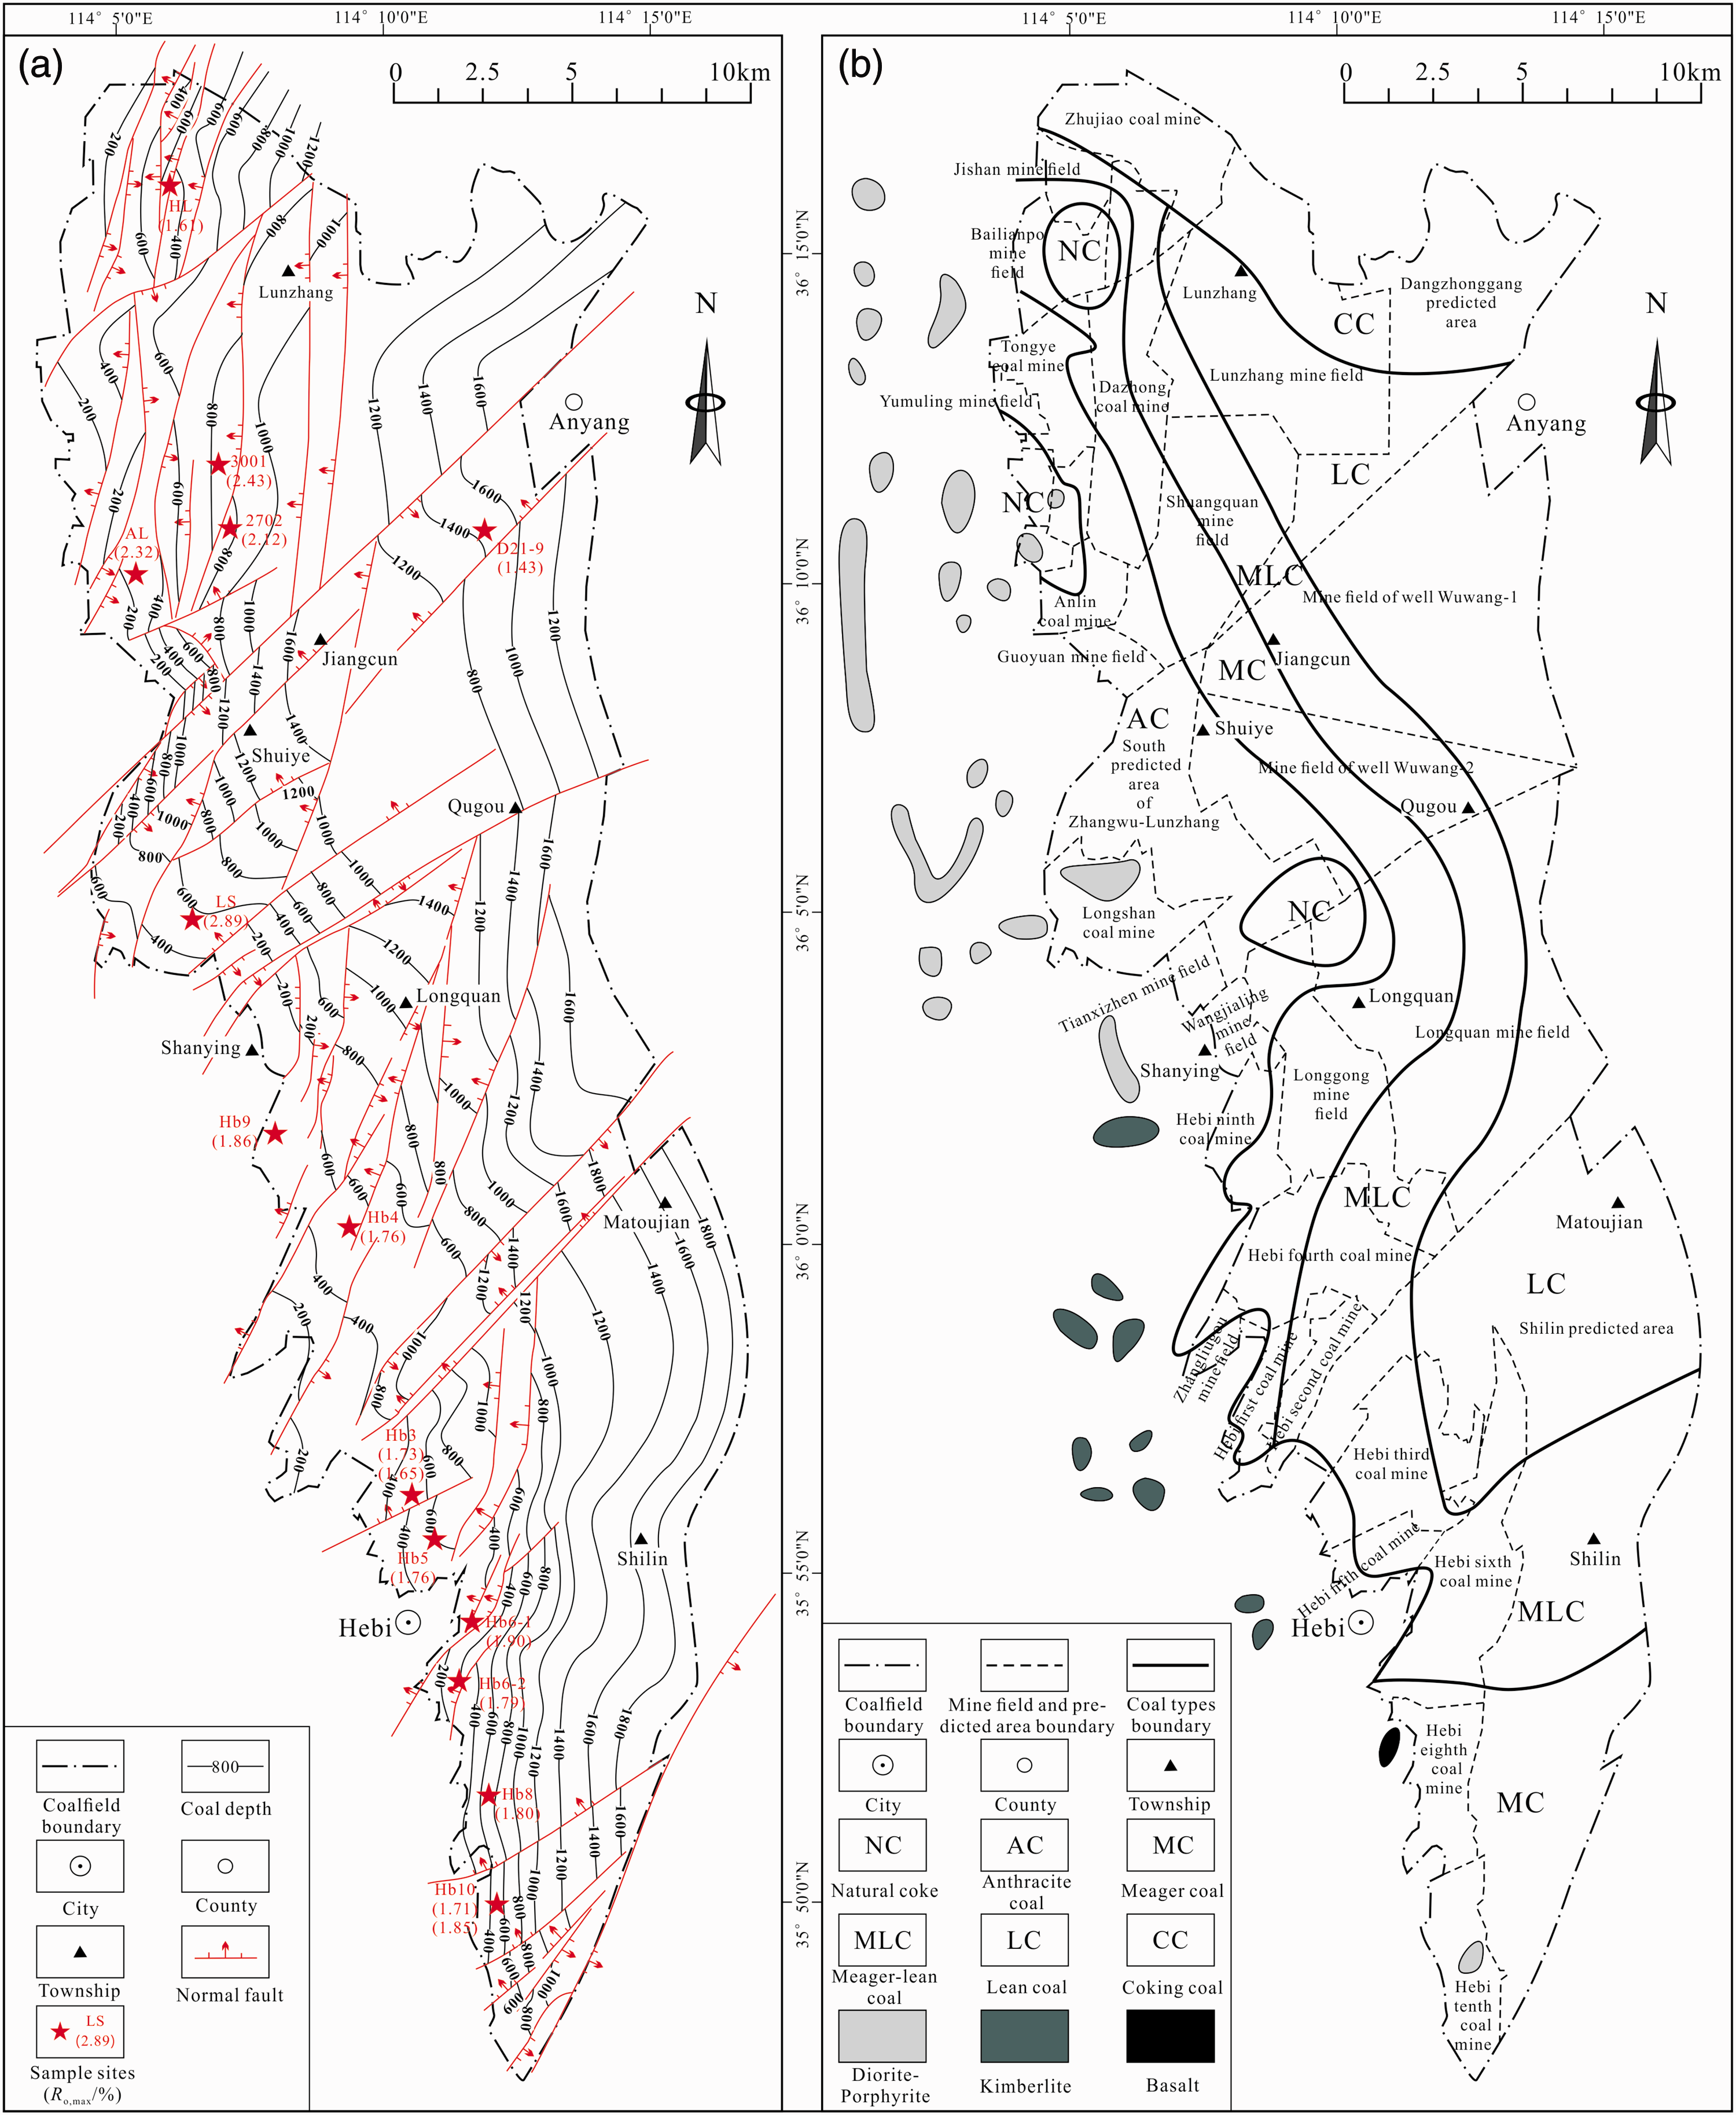
(a) Burial depth isoline of the No. 21 coal seam in the Anhe coalfield. The burial depth of the No. 21 coal seam ranges from 200 m to 1800 m, and increases from west to east in general. The depth of coals sampled for this research varies between 303.85 m and 1422.70 m. (b) The distribution of magmatite and coal types in the Anhe coalfield. The mines in the west part are dominated by natural coke, anthracite, and meager coals, and the mines in the east part are dominated by meager-lean coals and lean coals. Generally, the coal types are distributed in band with an east–west direction. However, the coal types in some coal mines (including Hongling, Anlin, and Longshan) show significant ring distributions due to the Yanshanian large-scale magmatism. From inside to outside, the coal types are natural coke, anthracite coal, and meager coal, etc.
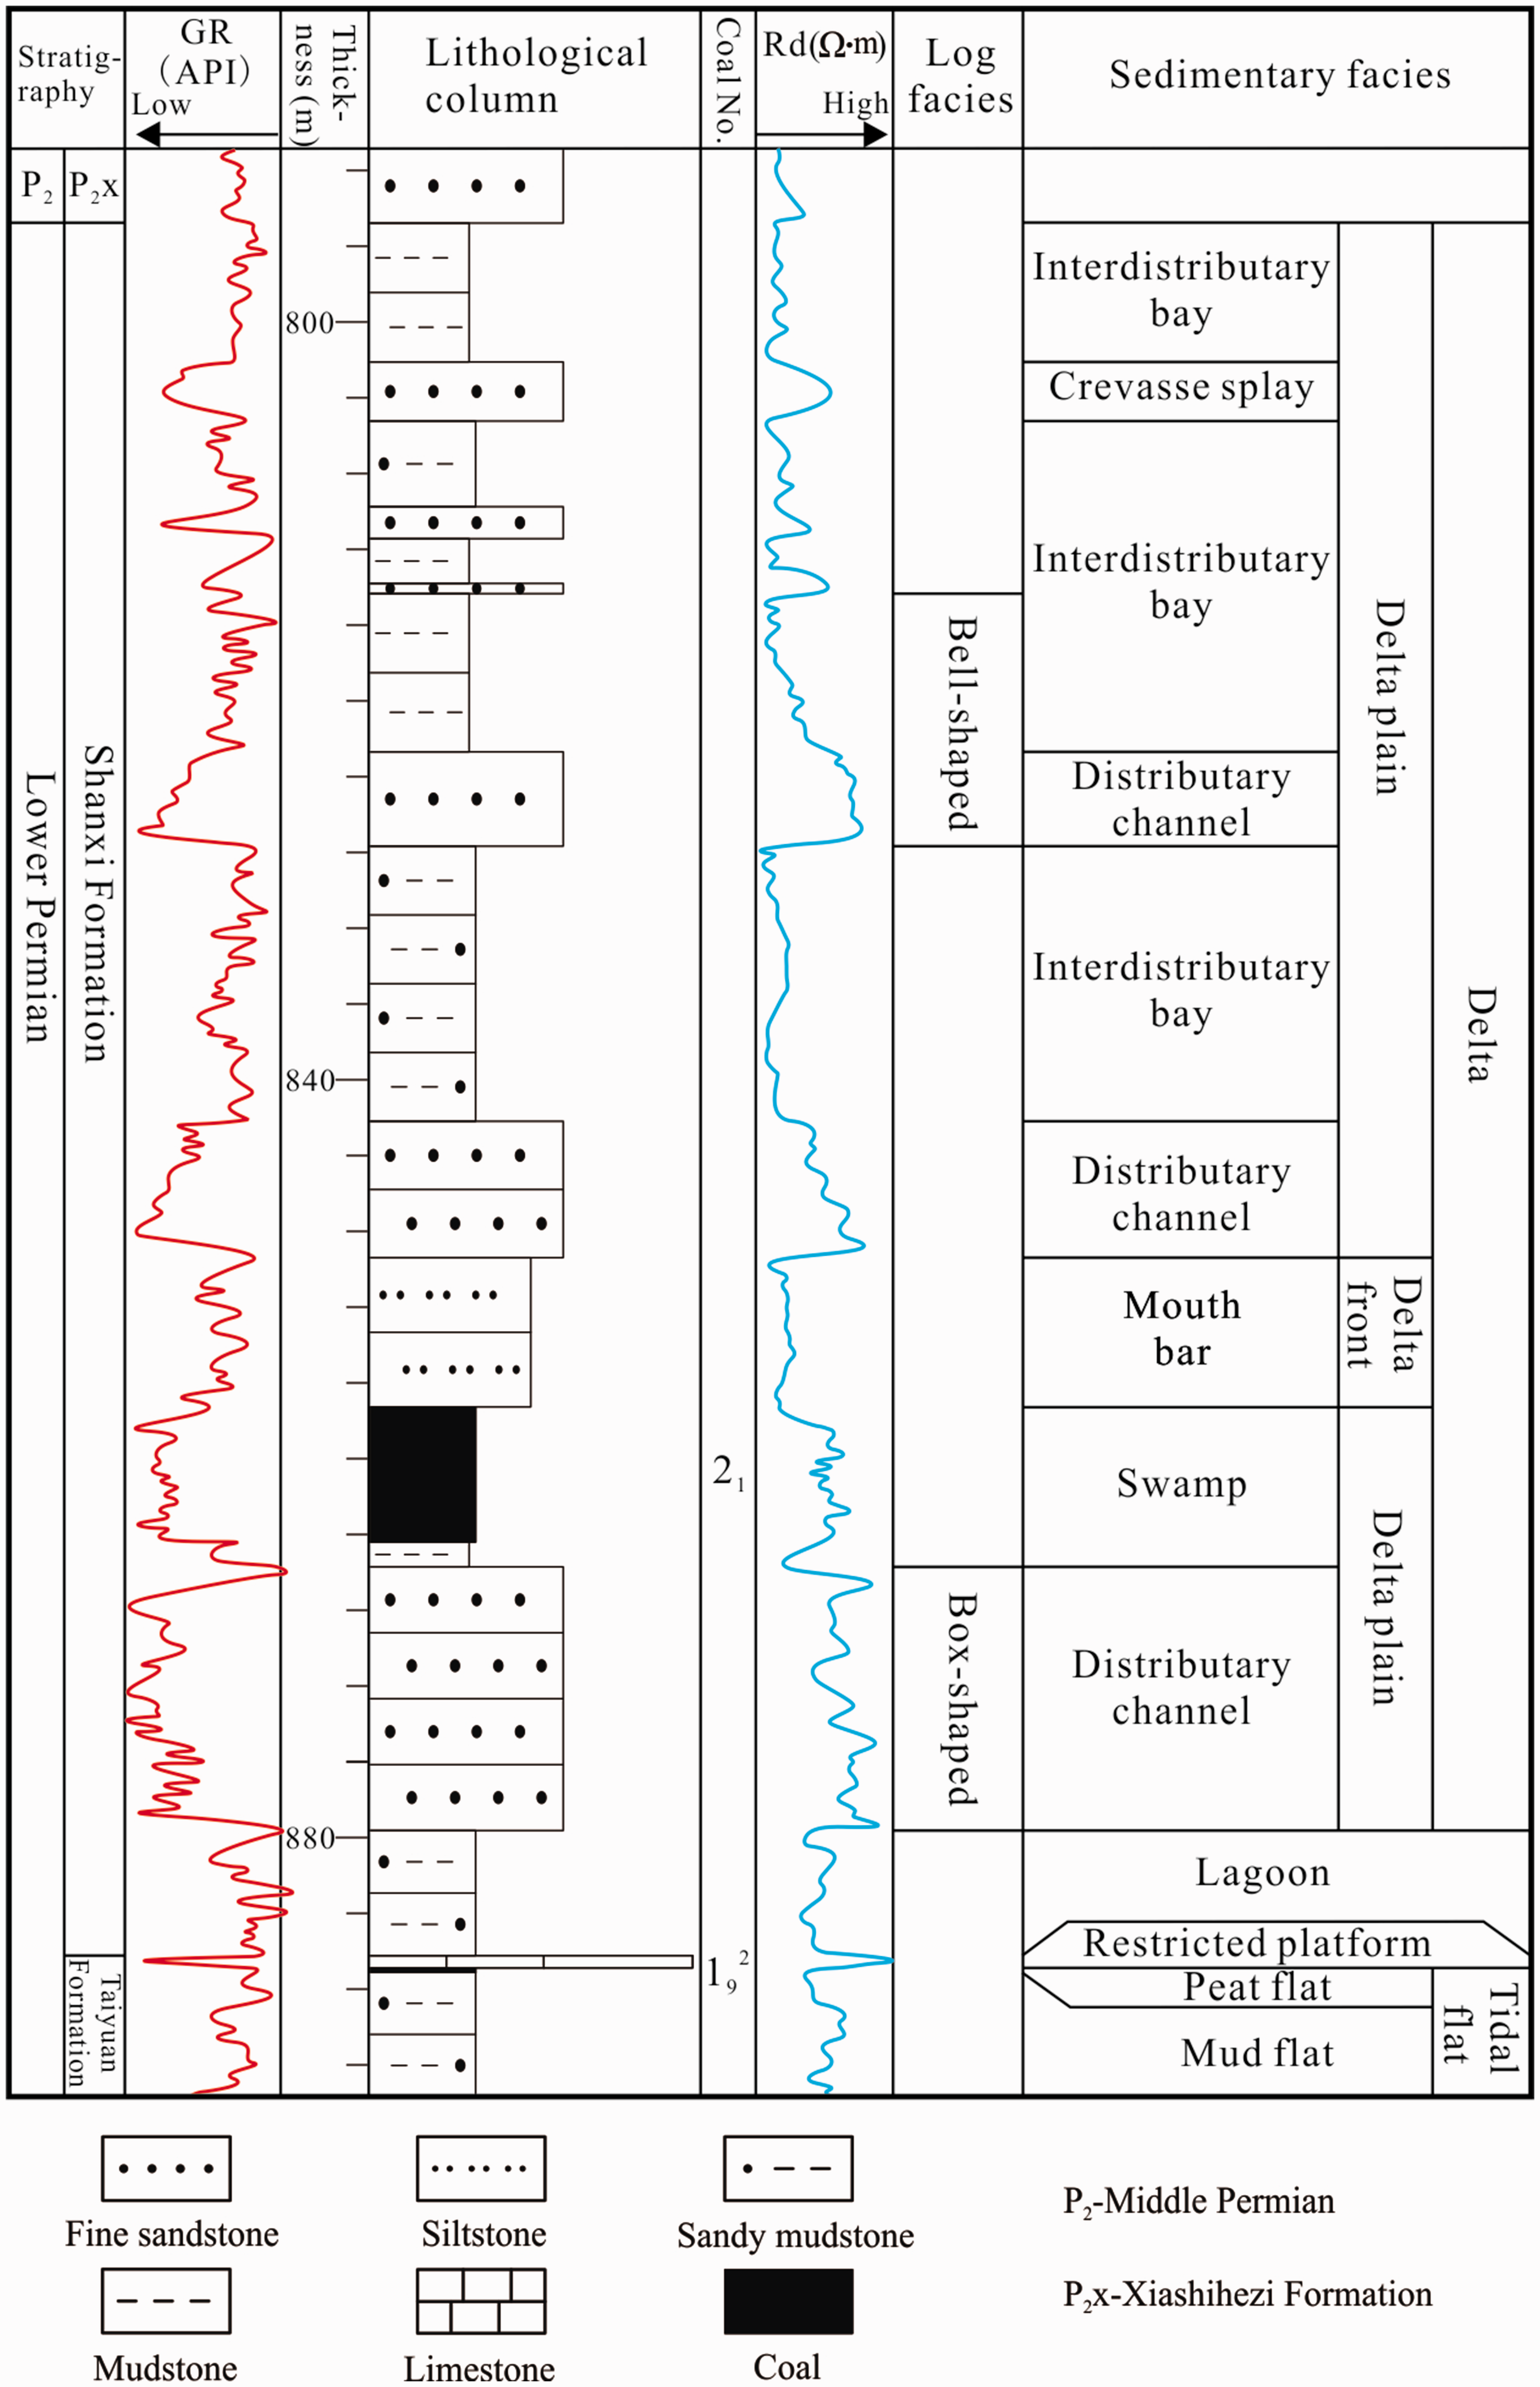
Columnar section showing the lithology and sedimentary facies of the Shanxi formation in the early Permian in the Anhe coalfield (borehole LG 1505). The No. 21 coal seam is distributed stably in the study area, and the swamp of the inter-distributary bay is believed to be the major coal-forming environment.
The phenomenon of anti-Hilt law in the Anhe coalfield was caused by magmatic and tectonic activity. The No. 21 coal seam underwent the regional magmatic thermal metamorphism due to the Yanshanian large-scale magmatism (Wang, 2009), and the magmatic activity can improve the degree of coal metamorphism (Salmachi et al., 2016). In general, the western part of the Anhe coalfield has the higher coal rank than the eastern part because of its closer distance to magmatic intrusions in the west (Figure 2(b)). During the Himalayan orogeny, the Taihang Mountain strongly uplifted and the North China Plain to the east relatively subsided (Liu et al., 2008), which caused the larger burial depth in the east than that in the west. For these reasons, a negative correlation between coal rank and the coal burial depth exists in the Anhe coalfield, signifying an Anti-Hilt law phenomenon (Figure 2(a) and 2(b)). In this research, the burial depth of the No. 21 coal seam varies between 303.85 m and 1422.70 m.
Sampling and experimental methods
Sampling
A total of 13 coal samples were collected from the primary mineable coal seams in seven coal mines and three borehole cores, and the locations of these coal mines and boreholes are shown in Figure 1. The sampled mines and boreholes included Hongling mine (HL), Anlin mine (AL), Hebi Fourth mine (Hb4), Hebi Fifth mine (Hb5), Hebi Sixth mine (Hb6–1, Hb6–2), Hebi Eighth mine (Hb8), Hebi Ninth mine (Hb9), 2702 borehole core (2702), 3001 borehole core (3001), and D21–9 borehole core (D21–9-1, D21–9-2, D21–9-3).
All coal samples were used for proximate analysis, maceral determination, and methane isothermal adsorption experiment, in which seven samples were used for low-temperature nitrogen adsorption/desorption experiment.
Experimental methods
Proximate analysis, maximum vitrinite reflectance measurement, and maceral determination
The Chinese National Standard GB/T 30732–2014 was applied in the proximate analysis, including analysis of moisture content, ash yield, and volatile content by instrumental method. Based on the standards GB/T 6948–1998 and GB/T 8899–1998, the maximum vitrinite reflectance (Ro,max) measurements and maceral analyses (500 points for each polished briquette) were performed by oil immersion in reflected light using a Leitz MPV-3 optical microscope.
Low-temperature nitrogen adsorption/desorption experiment
The low-temperature nitrogen adsorption/desorption experiments were used to characterize the pore structures in coal, and the experiments were performed following the Chinese Oil and Gas Industry Standard SY/T 6154–1995. All coal samples were prepared by crushing and sieving to obtain the particle size fraction of 0.23–0.45 mm. Subsequently, the samples were outgassed at 105°C overnight under vacuum to a final pressure of 0.25 Pa and the N2 adsorption isotherms were measured for the relative pressure (P/P0) ranging from 0.01 to 0.995 at 77 K.
Methane isothermal adsorption experiment
The methane isothermal adsorption experiment is commonly used in obtaining the methane adsorption capacity, and this experiment was performed following the Chinese Standard GB/T 19560–2008. All samples were prepared by sieving to a size range of 0.18–0.25 mm, and about 90–120 g of each sample was then weighed for moisture-equilibrium treatment. After this pretreatment, the IS-100 high pressure isothermal adsorption apparatus was used to test the methane adsorption parameters of the samples at 30°C and a maximum equilibrium pressure of 10 MPa.
Principal component analysis (PCA)
The PCA is a multivariate statistical method, which can achieve dimension reduction of the problem while retaining information about the original parameters (Abdi and Williams, 2010; Tesch and Otto, 1995). The complexity of the problem is effectively simplified and the main contradiction is captured with this approach. The PCA can be explained with the geometric rotation of the coordinate system. The principal components are illustrated based on conversion relations between the original and new coordinate systems. The axis direction is the orientation of the largest variation of the original data in the new coordinate system (Abdi and Williams, 2010).
The detailed steps of the PCA method using the SPSS 19.0 software are as follows:
First of all, establish the original variable matrix
Secondly, normalize the data. Due to the large differences in the sizes, dimensions, and evaluation standards of the indexes, the factors need to be normalized to achieve good comparability. Here, we adopted range normalization

Thirdly, calculate the correlation coefficient matrix
Results
Results of coal proximate analysis, maximum vitrinite reflectance, and coal petrology
For the proximate analysis, the variation characteristics of the moisture content and the ash yield of the coals in the Anhe coalfield were analyzed.
Moisture associated with a CBM project involves three forms: inherent moisture, adherent moisture, and chemically bound moisture (Rogers et al., 1994). In this paper, the moisture was determined using air dried basis on weight percent, and expressed in Mad with the value equal to inherent moisture. The moisture content of coals in the Anhe coalfield ranges from 0.42% to 2.68% with an average of 1.16% (Table 1), and the coals in the shallow west part have a higher moisture content (average; 1.22%) than that of coals in the deep eastern Anhe coalfield (average; 0.87%). Ash is not an inherent component of coal but the remaining residue after full combustion of coal, and almost all of it comes from minerals. Usually, the ash yield is proportional to the mineral content (Rogers et al., 1994). The ash yield of coals in the Anhe coalfield varies from 3.84% to 18.68% with an average of 10.94%. The ash yield of coals in the shallow west part is higher than that of coals in the deep east part. In particular, the ash yield ranges between 3.84% and 18.68% with an average of 11.34% in the western area, while the ash yield varies from 7.90% to 9.76% with an average of 8.95% in the east (Table 1).
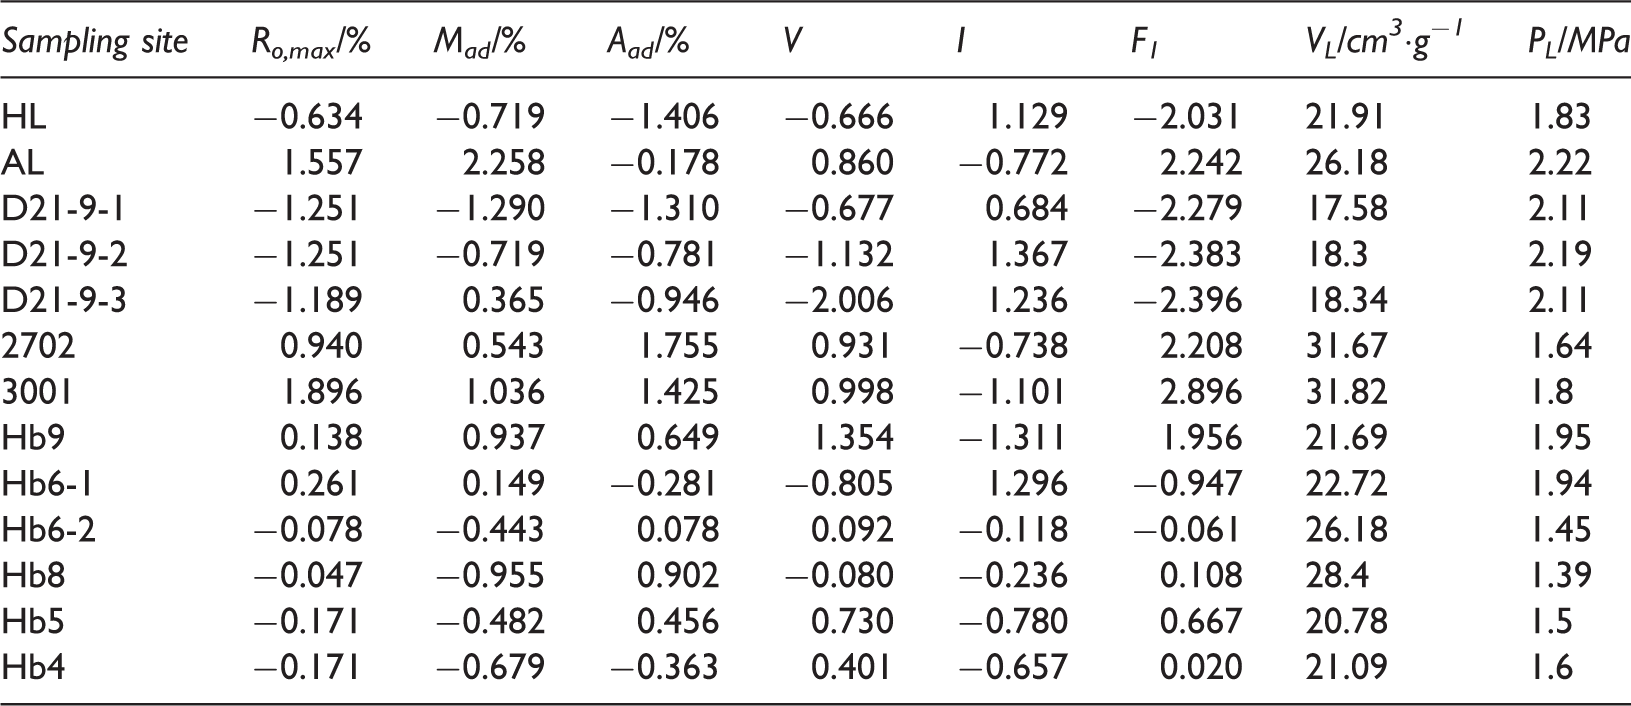
Data of maximum vitrinite reflectance, proximate analysis, coal macerals, and methane isothermal adsorption (30°C) of coal samples in the Anhe coalfield.
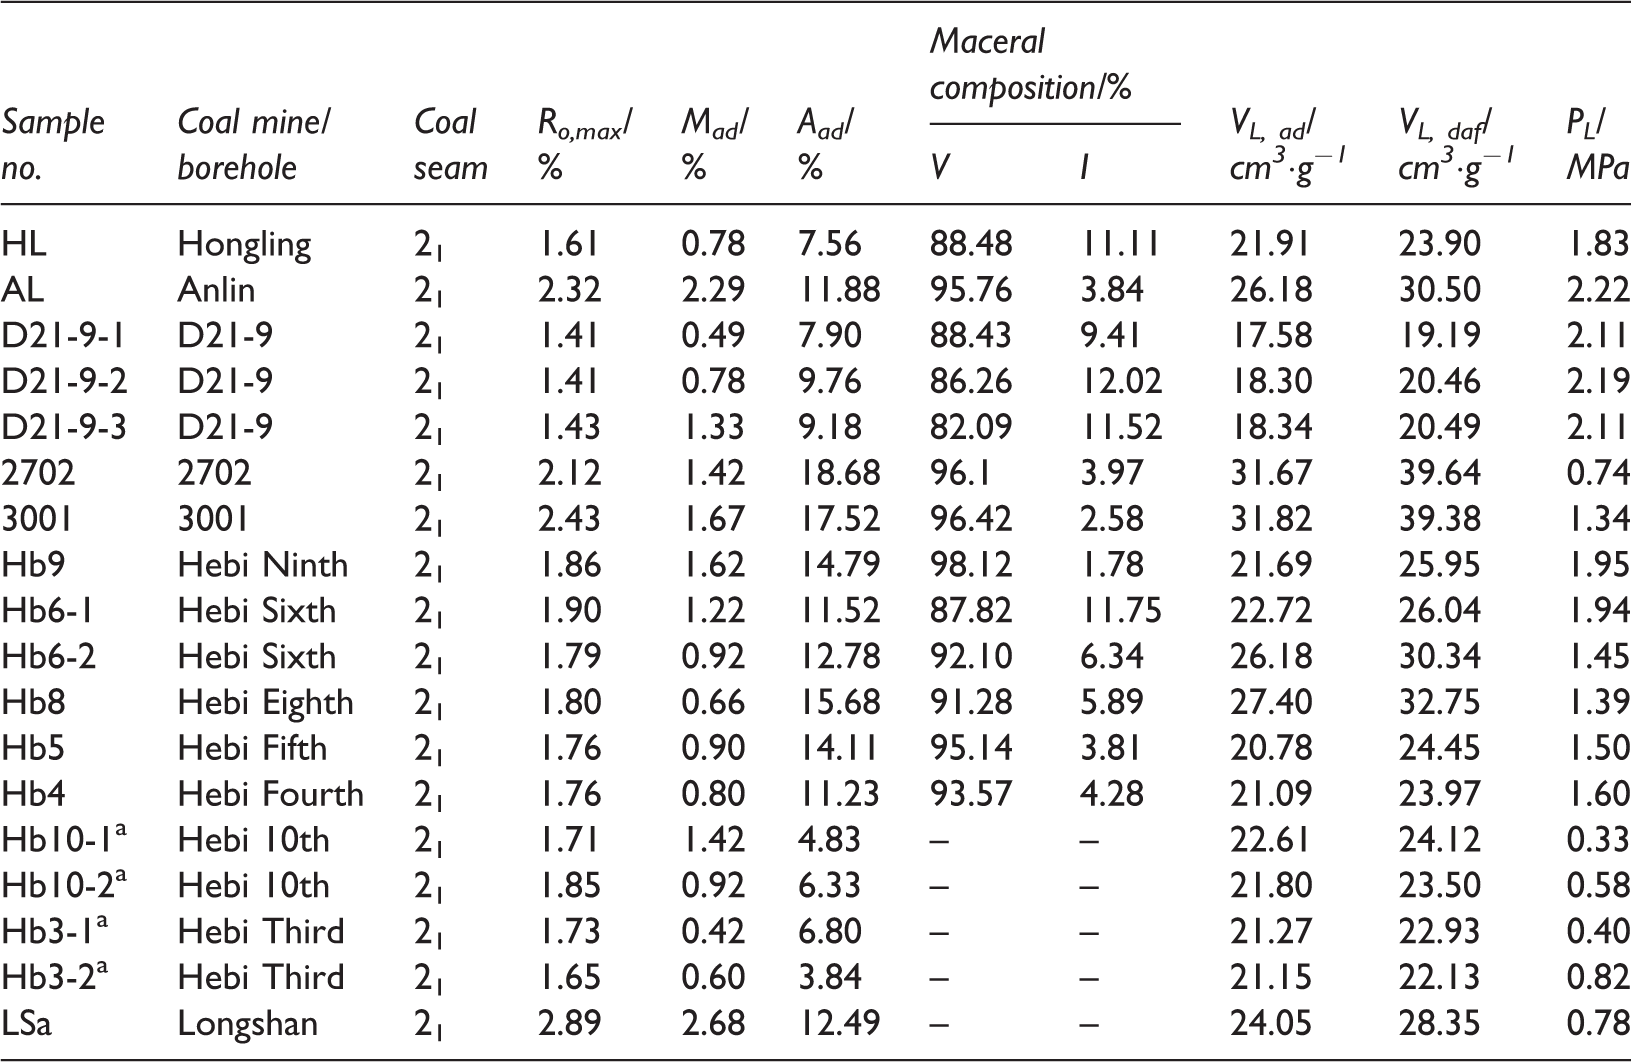
–: no data; Ro,max: maximum vitrinite reflectance; Mad: moisture content; Aad: ash yield; ad: air dried basis; V: vitrinite; I: inertinite; PL: Langmuir pressure; VL, ad: Langmuir volume on air dried basis; VL, daf: Langmuir volume on dry ash-free basis.
aExperimental data from Yao and Liu (2007).
The maximum vitrinite reflectance (Ro,max) can characterize the rank of the bituminous and anthracite coals (Rogers et al., 1994). In the Anhe coalfield, the Ro,max values for all samples vary from 1.41% to 2.89% (average; 1.86%), indicating that the coals belong to the medium-to-high rank coals. The Ro,max values of coals in the shallow west part (average; 1.95%) are higher than that of coals in the deep east part (average; 1.42%).
Vitrinite is formed partly from lignin, cellulose, and woody parts of the plant, while inertinite is the oxidized or charcoaled cell walls or trunks of plants (Stach et al., 1982). Microscopically, the coals in the Anhe coalfield are mainly composed of vitrinite and inertinite, and liptinite has not been identified (Table 1). The vitrinite content of the coals ranges from 82.09% to 98.12% with an average of 91.66%, and the coals in the shallow western Anhe coalfield have more vitrinite content (average; 93.48%) than that of coals in the deep east part (average; 85.59%). The inertinite content of coals varies from 1.78% to 12.02% (average; 6.79%), and the coals in the shallow western parts have less inertinite content (average; 5.34%) than that of coals in the deep east (average; 10.98%).
Results of the low-temperature nitrogen adsorption/desorption experiment
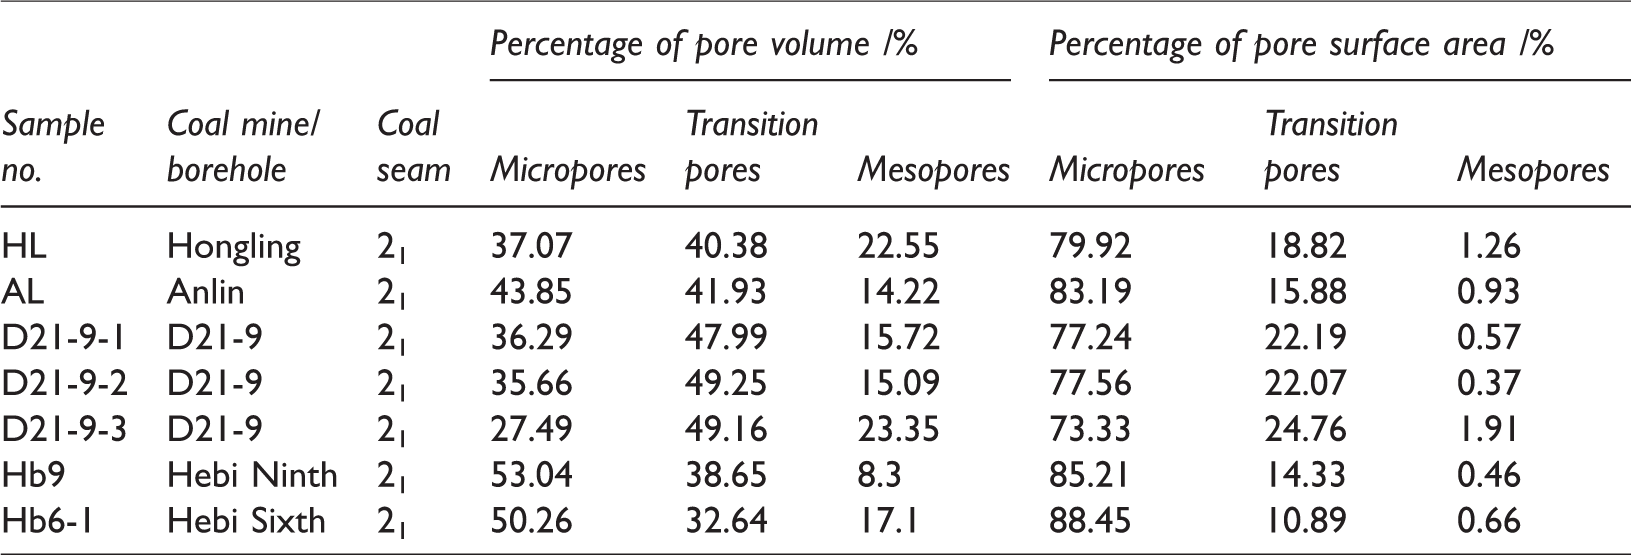
Based on sizes, the pores in coals are subdivided into four categories: micropores (<10 nm in size), transition pores (10–100 nm), mesopores (100–1000 nm), and macropores (>1000 nm; Hodot, 1966). Based on the contribution to CBM storage capacity and recoverability, the pores in coals can be subdivided into adsorption pores with pore diameters <100 nm and seepage pores with pore diameters >100 nm (Cai et al., 2013). In this paper, the pore structures in coals were characterized through the low-temperature nitrogen adsorption/desorption experiments, and the experimental results include the percentage of pores volume and the percentage of pores surface area in coals.
The percentage of adsorption-pores (including micropores and transition pores) volume in coals ranges from 76.65% to 91.69% with an average of 83.38% (Table 2), and the coals in the shallow west have higher percentage of adsorption-pores volume (average; 84.46%) than that of coals in the deep east (average; 81.95%). Furthermore, the percentage of adsorption-pores surface area in coals varies from 98.09% to 99.63% with an average of 99.12% (Table 2). The coal samples in the shallow west have similar percentage of adsorption-pores surface area (average; 99.17%) with that of coals in the deep east (average; 99.05%).
Results of nitrogen isothermal adsorption of coal samples in the Anhe coalfield.
Results of the methane isothermal adsorption experiment
Generally, the parameters of Langmuir volume (VL) and Langmuir pressure (PL) were used to evaluate the isothermal adsorption characteristics. The methane adsorption capacity of coals can be assessed using VL, where VL is the maximum monolayer volumetric capacity per unit weight of solid. PL is defined as the pressure that gives a gas content equal to one-half of the monolayer capacity, which can represent the methane desorption capacity of coals (Rogers et al., 1994). Based on the VL range, the coal reservoirs can be subdivided into five types: coals extremely rich in methane (VL ≥ 20 cm3·g−1), coals rich in methane (15 ≤ VL < 20 cm3·g−1), coals relatively rich in methane (8 ≤ VL < 15 cm3·g−1), coals fairly rich in methane (4 ≤ VL < 8 cm3·g−1), and coals poorly rich in methane (VL < 4 cm3·g−1) (Yu et al., 2008). The methane isothermal adsorption experiment was used to characterize the methane adsorption capacity of coals, and the experimental results include the VL and PL.
In the Anhe coalfield, the VL, ad (air dried basis) values of the coals ranges from 17.58 cm3·g−1 to 31.82 cm3·g−1 with an average of 23.14 cm3·g−1 (Table 1). Therefore, the coals can be classified as “rich” to “extremely rich” in methane. The methane adsorption capacity of coals in the shallow western Anhe coalfield (average VL, ad; 24.15 cm3·g−1) is greater than that of coals in the deep eastern parts (average VL, ad; 18.07 cm3·g−1). Due to the closer distance to magmatic intrusions, the VL, ad values of coals in the AL mine and LS mine reach 26.18 cm3·g−1 and 24.05 cm3·g−1, respectively.
The PL values vary from 0.33 MPa to 2.22 MPa with an average of 1.40 MPa, which indicates that it is easier for the coal reservoir to adsorb methane in the low-pressure area than in the high-pressure area (Rogers et al., 1994). The PL values of coals in the deep east (average PL; 2.14 MPa) are greater than that of coals in the shallow west (average PL; 1.26 MPa).
The experimental curves of methane isothermal adsorption are shown in Figure 4. When the pressure (P) is below 2 MPa, the methane adsorption content (V) rapidly increases with the pressure, while the V slowly increases when the P is higher than 2 MPa.
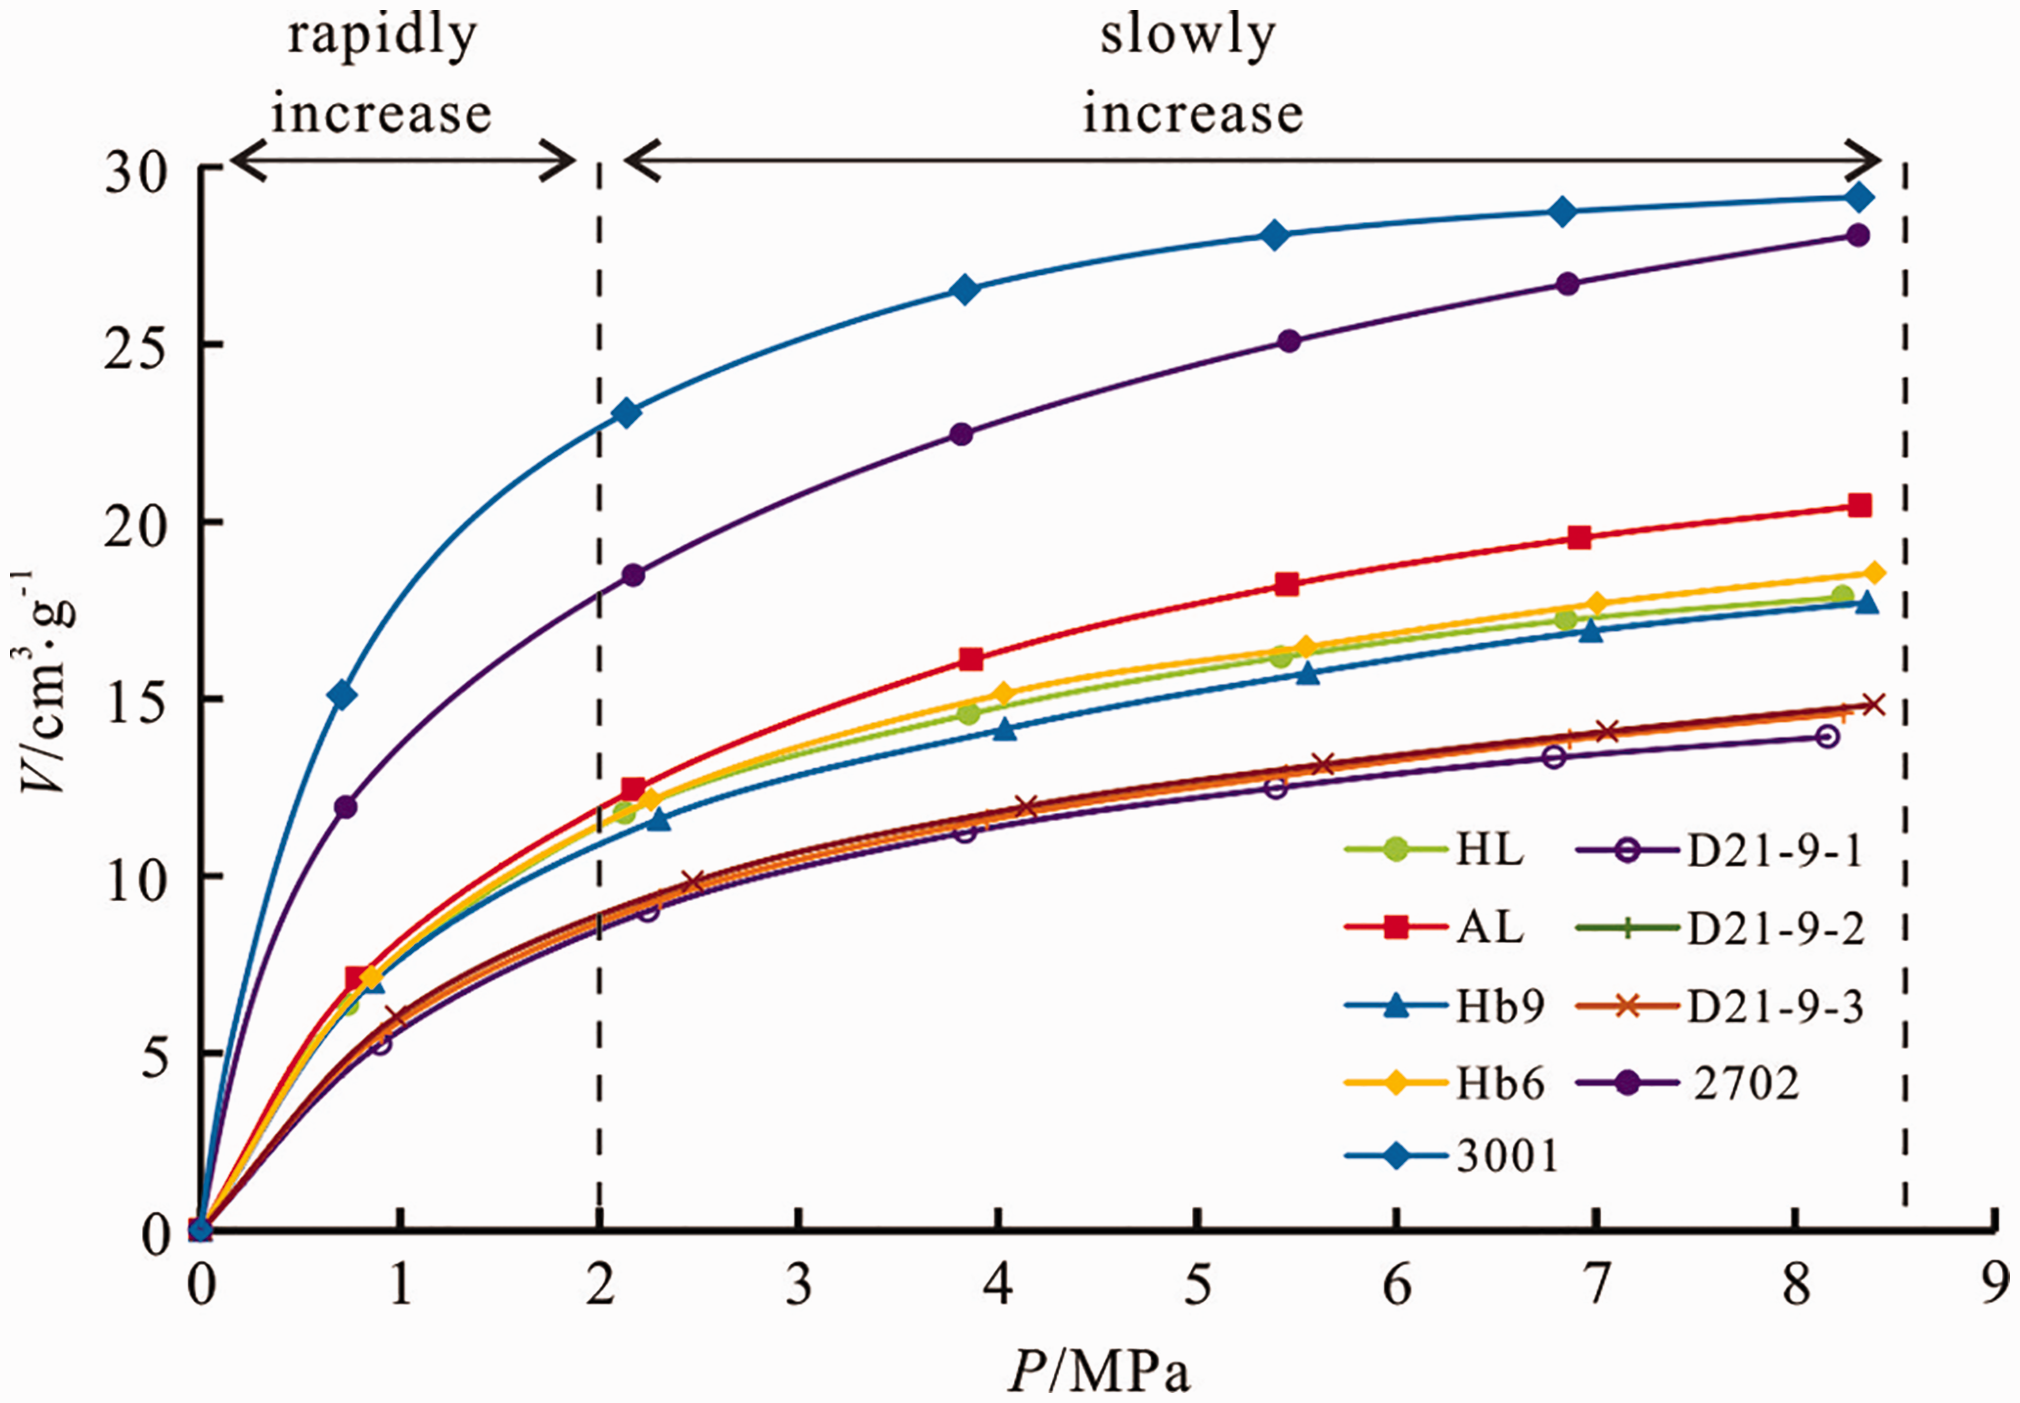
Experimental CH4 isothermal adsorption curves for coals in the Anhe coalfield. The methane adsorption content of coals increases rapidly with the pressure when P < 2 MPa, while increases slowly when P > 2 MPa.
Discussion
Influencing factors on the methane adsorption capacity of coals
Influence of the coal rank on the methane adsorption capacity
To eliminate the influences of moisture and ash on methane adsorption capacity, the dry ash-free basis index expressed in VL, daf was adopted to analyze the limit monolayer adsorption capacity. Equation (2) was used to transform index VL, ad into VL, daf based on the Chinese National Standard GB/T 483–2007

The third important coalification occurs at Ro,max of 1.3%∼2.1% during coal metamorphism, and the third coalification jump point corresponds to Ro,max of ∼2.1% (Yao et al., 2011). During the third important coalification (P1 in Figure 5), adsorption-pores develop rapidly and account for more proportion in coals. Compared with mesopores and macropores, adsorption-pores contribute more to the increase of the specific surface area and methane adsorption space of coals (Mardon et al., 2014; Zhang and Yang, 1999). This is the main reason for increasing methane adsorption capacity in the P1 phase for thermally metamorphosed coals. The methane adsorption capacity of coal samples in the Anhe coalfield first increases and then decreases with the Ro,max, and the highest VL, daf value corresponds to an Ro,max of ∼2.1% (Figure 5). For the altered coals whose Ro,max values have been elevated up to 1.61–2.89% due to the influence of igneous intrusion in the shallow west, their pore characteristics are similar to the thermally metamorphosed coals with same rank. As shown in Figure 6, the coal rank displays positive relationships with the percentage of adsorption-pores surface area/volume when Ro,max <2.1%. Therefore, the adsorption capacity increases with the coal rank due to the increase of adsorption-pores by the intrusion.
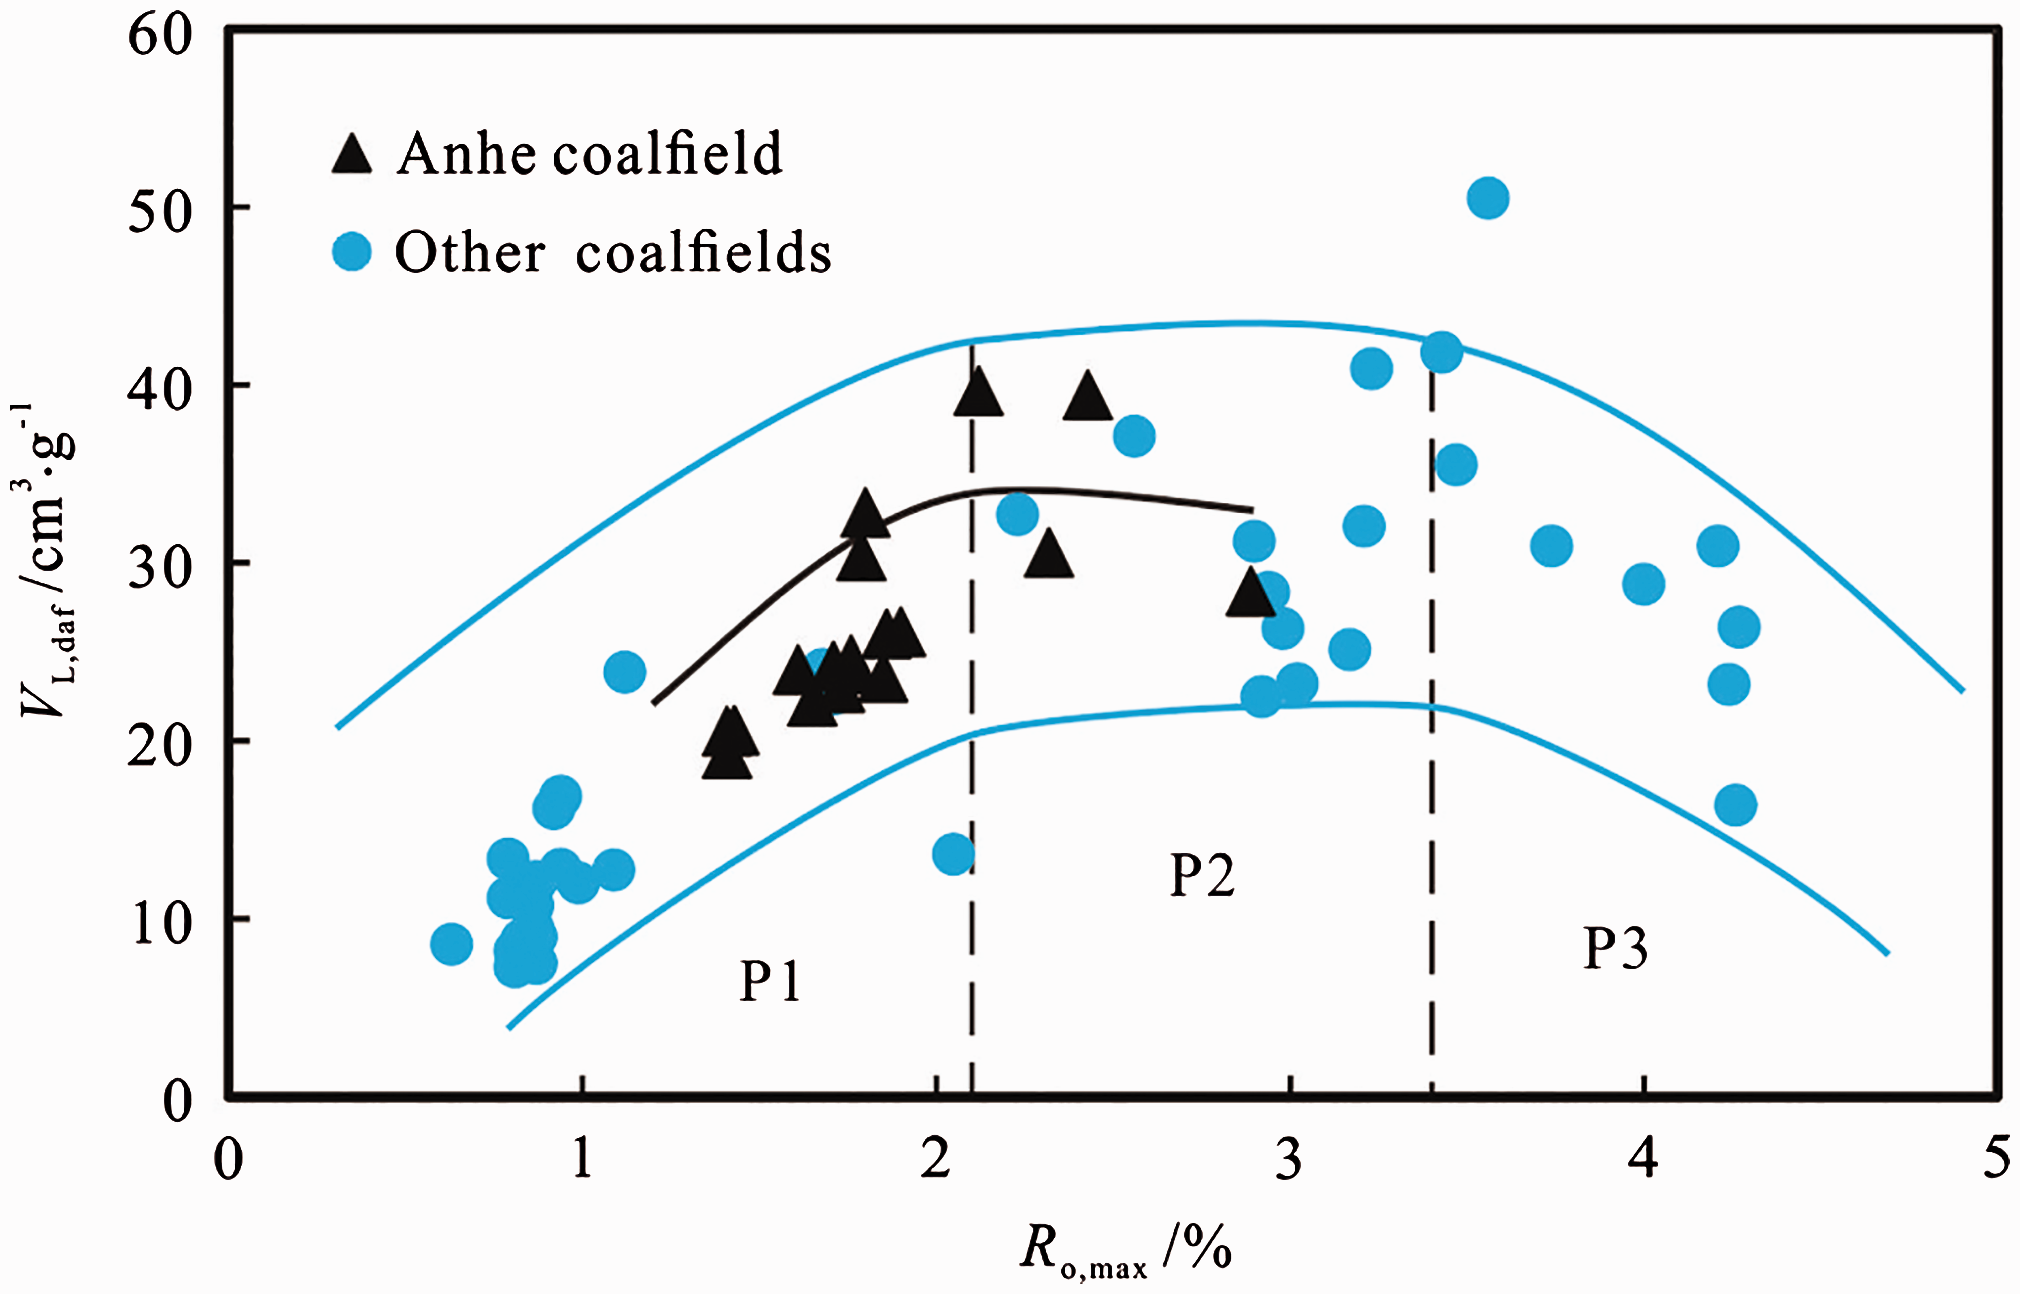
Relationship between Ro,max and VL, daf of coals in the Anhe coalfield and other coalfields. The methane adsorption capacity first increases and then decreases with the coal rank, and the highest VL, daf value corresponds to an Ro,max of ∼2.1%. For unaltered coals (normal geothermal metamorphic coals), the VL, daf shows an inverse U-shaped correlation with the coal rank. The correlation comprises three typical phases including rapid increasing (P1), steady state (P2), and rapid decreasing (P3) phases. Data of other coalfields are from Yao and Liu (2007) and Yu et al. (2014), and the experimental methods of these data are consistent with this paper. Other coalfields include Huaibei coalfield, Huainan coalfield, Datong coalfield, Qinshui basin, Pingdingshan coalfield, Jiaozuo coalfield, Yongxia coalfield, and Xinggong coalfield.
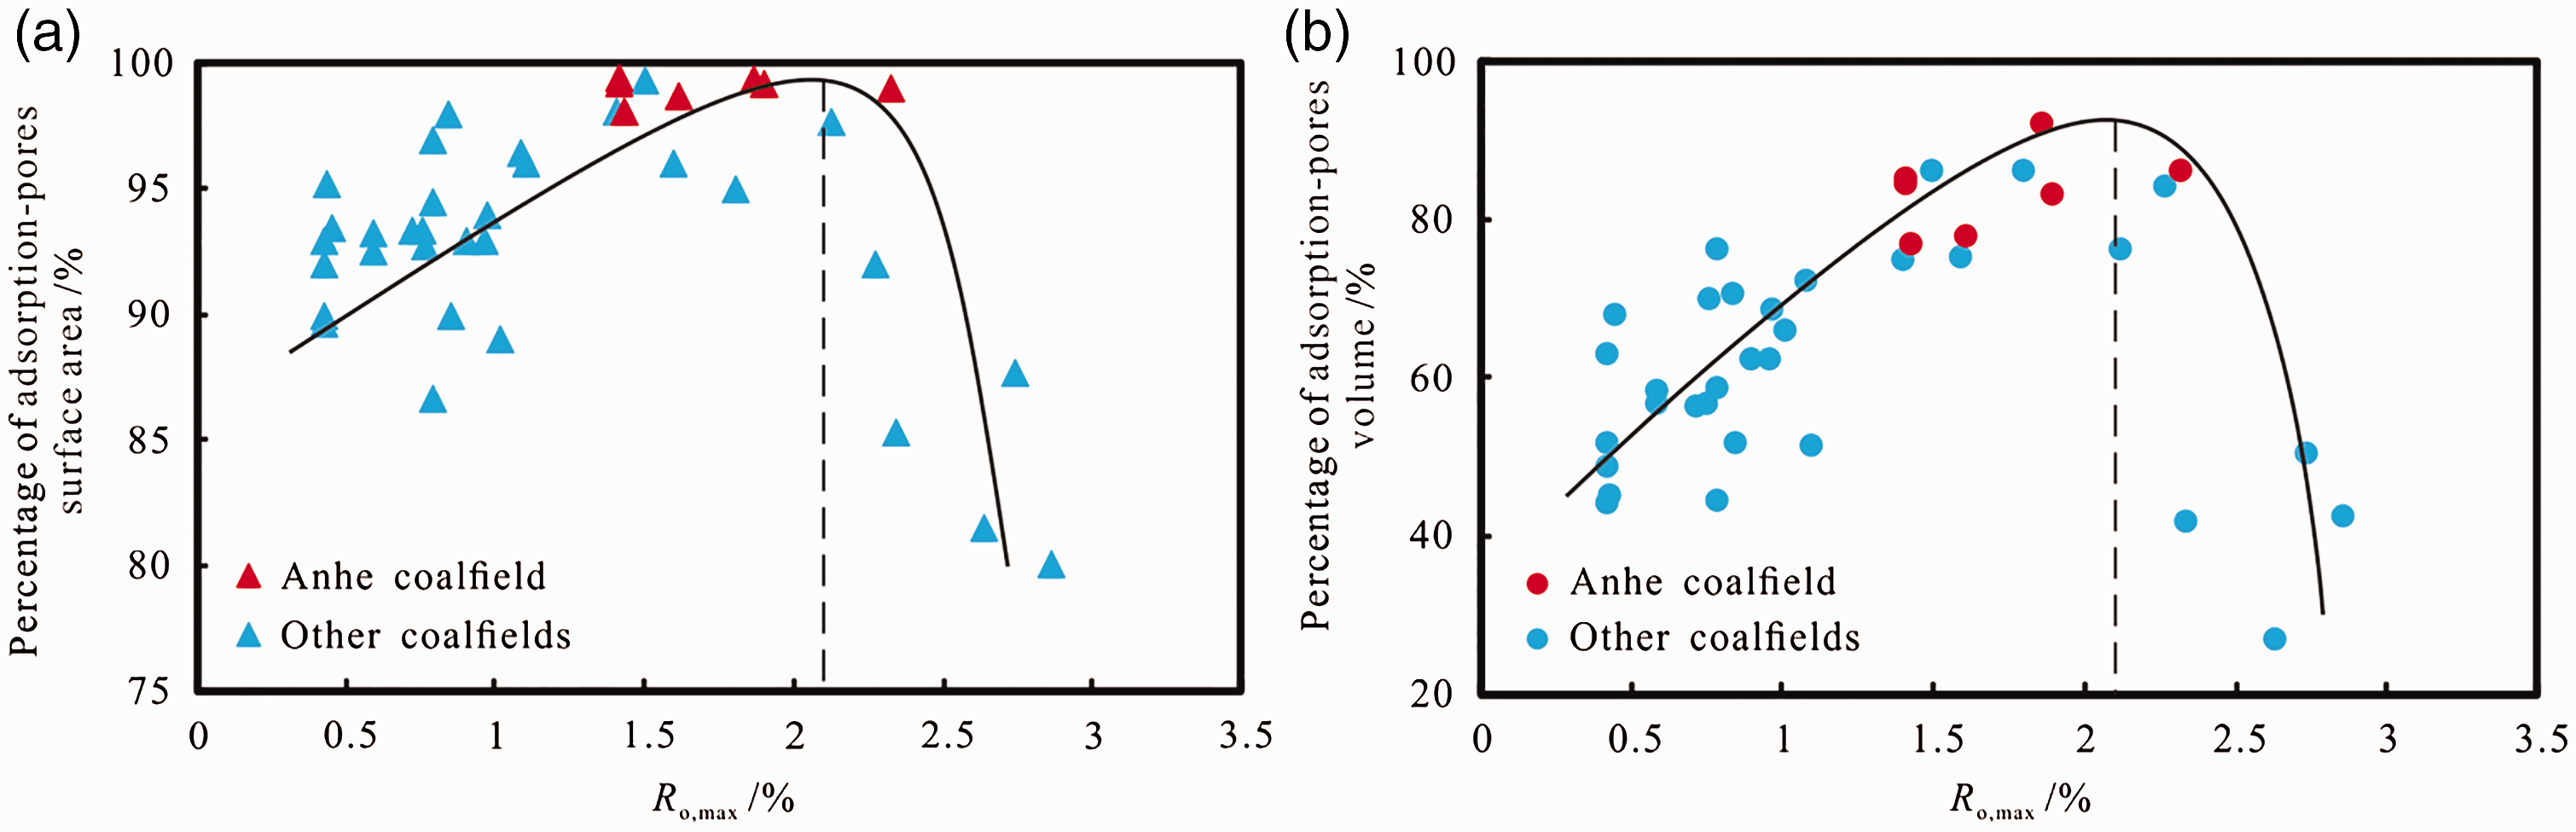
Relationship between Ro,max and the percentage of adsorption-pores surface area/volume of coals in the Anhe coalfield and other coalfields. The coal rank shows positive relationships with the percentage of adsorption-pores surface area/volume when Ro,max < 2.1%, and displays negative relationships with the percentage of adsorption-pores surface area/volume when Ro,max > 2.1%. Other coalfields include Huaibei coalfield, Huainan coalfield, Junggar basin, Qinshui basin, and Huanglong coalfield. Data of other coalfields are from Meng et al. (2015), Luo et al. (2016), Xu et al. (2016), Lin et al. (2017), and previous research project, and the experimental methods of these data are consistent with this paper.
The fourth important coalification occurs at Ro,max of 2.1–3.4% with the fourth coalification jump point of ∼3.4% Ro,max (Yao et al., 2011). The adsorption-pores contents have reached the maximum during this stage (P2), and thus the methane adsorption capacity may not distinctly increase/decrease with coal rank (Figure 5). For altered coals, there is a low proportion of adsorption pores but a high proportion of mesopores and macropores when compared with thermally metamorphosed coals with same rank. As shown in Figure 6, the coal rank has negative relationships with the percentage of adsorption-pores surface area/volume when Ro,max > 2.1%. Therefore, this may be the origin of the reduction in adsorption capacity by intrusion.
Influence of coal macerals on the methane adsorption capacity
In the Anhe coalfield, the VL, ad displays a positive correlation with the vitrinite content (Figure 7(a)), and a negative correlation with the inertinite content (Figure 7(b)), indicating that the methane adsorption capacity was mainly contributed by vitrinite macerals. It is known that different macerals have different effects on the pore structure of coals (Rogers et al., 1994). In particular, the development of the cell structure in vitrinite is generally inferior to inertinite. The vitrinite, however, as the product of gelification and bituminization of humic substances, has a higher proportion of adsorption-pores volume and surface area than the inertinite with equivalent amount (Busch et al., 2004; Lamberson and Bustin, 1993). Therefore, the reason for the positive correlation between the methane adsorption capacity and the vitrinite content can be attributed to the increase of the adsorption pores in coals.
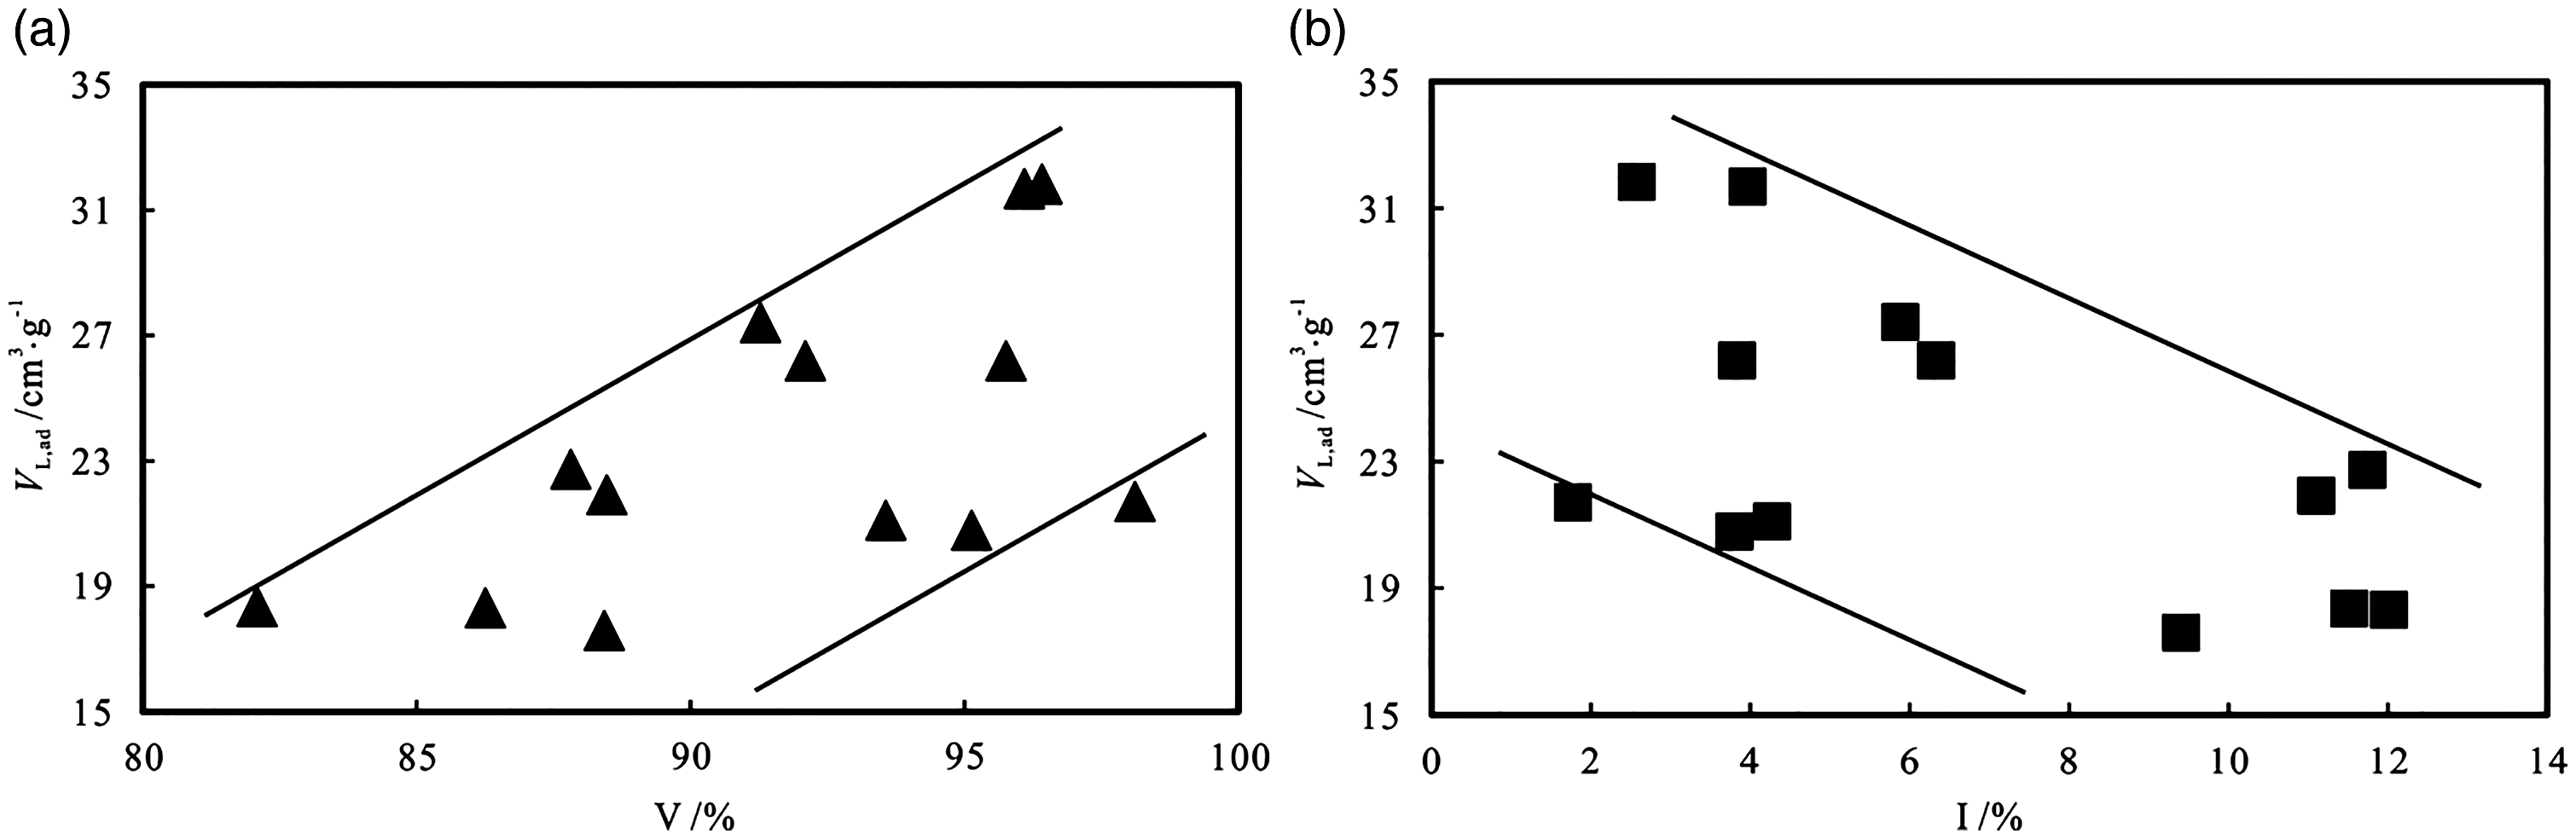
Relationship between the VL, ad and vitrinite, inertinite contents of coals in the Anhe coalfield. (a) The methane adsorption capacity has a positive correlation with the vitrinite content because of the increase of the adsorption pores and metamorphism degree; (b) the methane adsorption capacity shows a negative correlation with the inertinite content due to the decreasing proportions of adsorption-pores volume and surface area in coals.
Influence of the moisture content on the methane adsorption capacity
Relationships between coal moisture and methane adsorption capacity can be obtained based on the analysis of the experimental data of the methane isothermal adsorption and the proximate analysis.
There is a positive correlation between the moisture content of coals and the Ro,max values (Figure 8). This result is consistent with previous study (Zhang and Yang, 1999), in which the moisture content of coals showed first decreasing and then increasing with the coal rank, and the lowest moisture content corresponds to the Ro,max value of ∼1.2% (Figure 8). Furthermore, when the Ro,max is higher than 1.2%, the organic matrix of the coals condenses with increasing coal rank (Zhang and Yang, 1999). Therefore, the amount of adsorbed moisture in the coals increases with increasing shrinkage stress and development of microcracks. Previous studies proposed that the existence of moisture may reduce the storage space of methane, and thus reduce the methane adsorption capacity of coals (Gensterblum et al., 2013; Suuberg et al., 2002). The moisture content of coals in this paper varies in a small range compared to other coalfields, and the methane adsorption capacity of coals displays a positive trend with the moisture content (Figure 9).
Influence of the ash yield on the methane adsorption capacity
The methane adsorption capacity of coal samples shows a “V-shaped” change with the ash yield for the coals in the Anhe coalfield. The methane adsorption capacity and the ash yield show a negative relationship when the ash yield is lower than 9%, and a positive correlation when the ash yield is higher than 9% (Figure 10). In the Anhe coalfield, the coals have similar metamorphism degree when Aad <9%. It is basically consistent with previous studies that the existence of ash reduces the storage space of methane, and thus leads to a reduction of the methane adsorption (Cheng et al., 2017; Laxminarayana and Crosdale, 2002). When Aad > 9%, the Ro,max values of the coal samples marked with red color in Figure 10 are significantly higher than those of the samples marked with blue color. Based on the data from nitrogen isothermal adsorption experiments, the percentages of the adsorption-pores volume in coals sampled from AL, Hb9, and Hb6 (marked with red color) are 85.78%, 91.69%, and 82.90% (average; 86.79%), respectively. Meanwhile, the percentages of the adsorption-pores volume in coals sampled from borehole D21–9 (marked with blue color) with an ash yield of ∼9% are 84.28%, 84.91%, and 76.65%, respectively, with an average of 81.95%, which is lower than that of the coal samples with higher ash yield. Therefore, the methane adsorption capacity is mainly controlled by the negative influence of ash when Aad <9%, and is controlled by the coal rank when Aad > 9%.
Dominant influencing factors on the methane adsorption capacity
In the Anhe coalfield, coal rank and coal macerals are the dominant factors that influence the methane adsorption capacity of the coals. Previous studies suggested that the development of adsorption pores in coals directly affects the adsorption capacity (Faiz et al., 2007; Hou et al., 2017; Rogers et al., 1994). Therefore, the coal rank significantly influences the development of adsorption pores in coals, and thus has a dominant effect on the methane adsorption capacity (Figures 5 and 6). Furthermore, both the moisture content and the ash yield regularly change with the coal rank, which indicates that the coal rank is the most dominant factor that influences the methane adsorption capacity rather than other factors (Figures 8 and 10). Vitrinite macerals, as the secondly dominant factor, also have important influences on the methane adsorption capacity due to the development of adsorption pores in organic macerals (Figure 7).
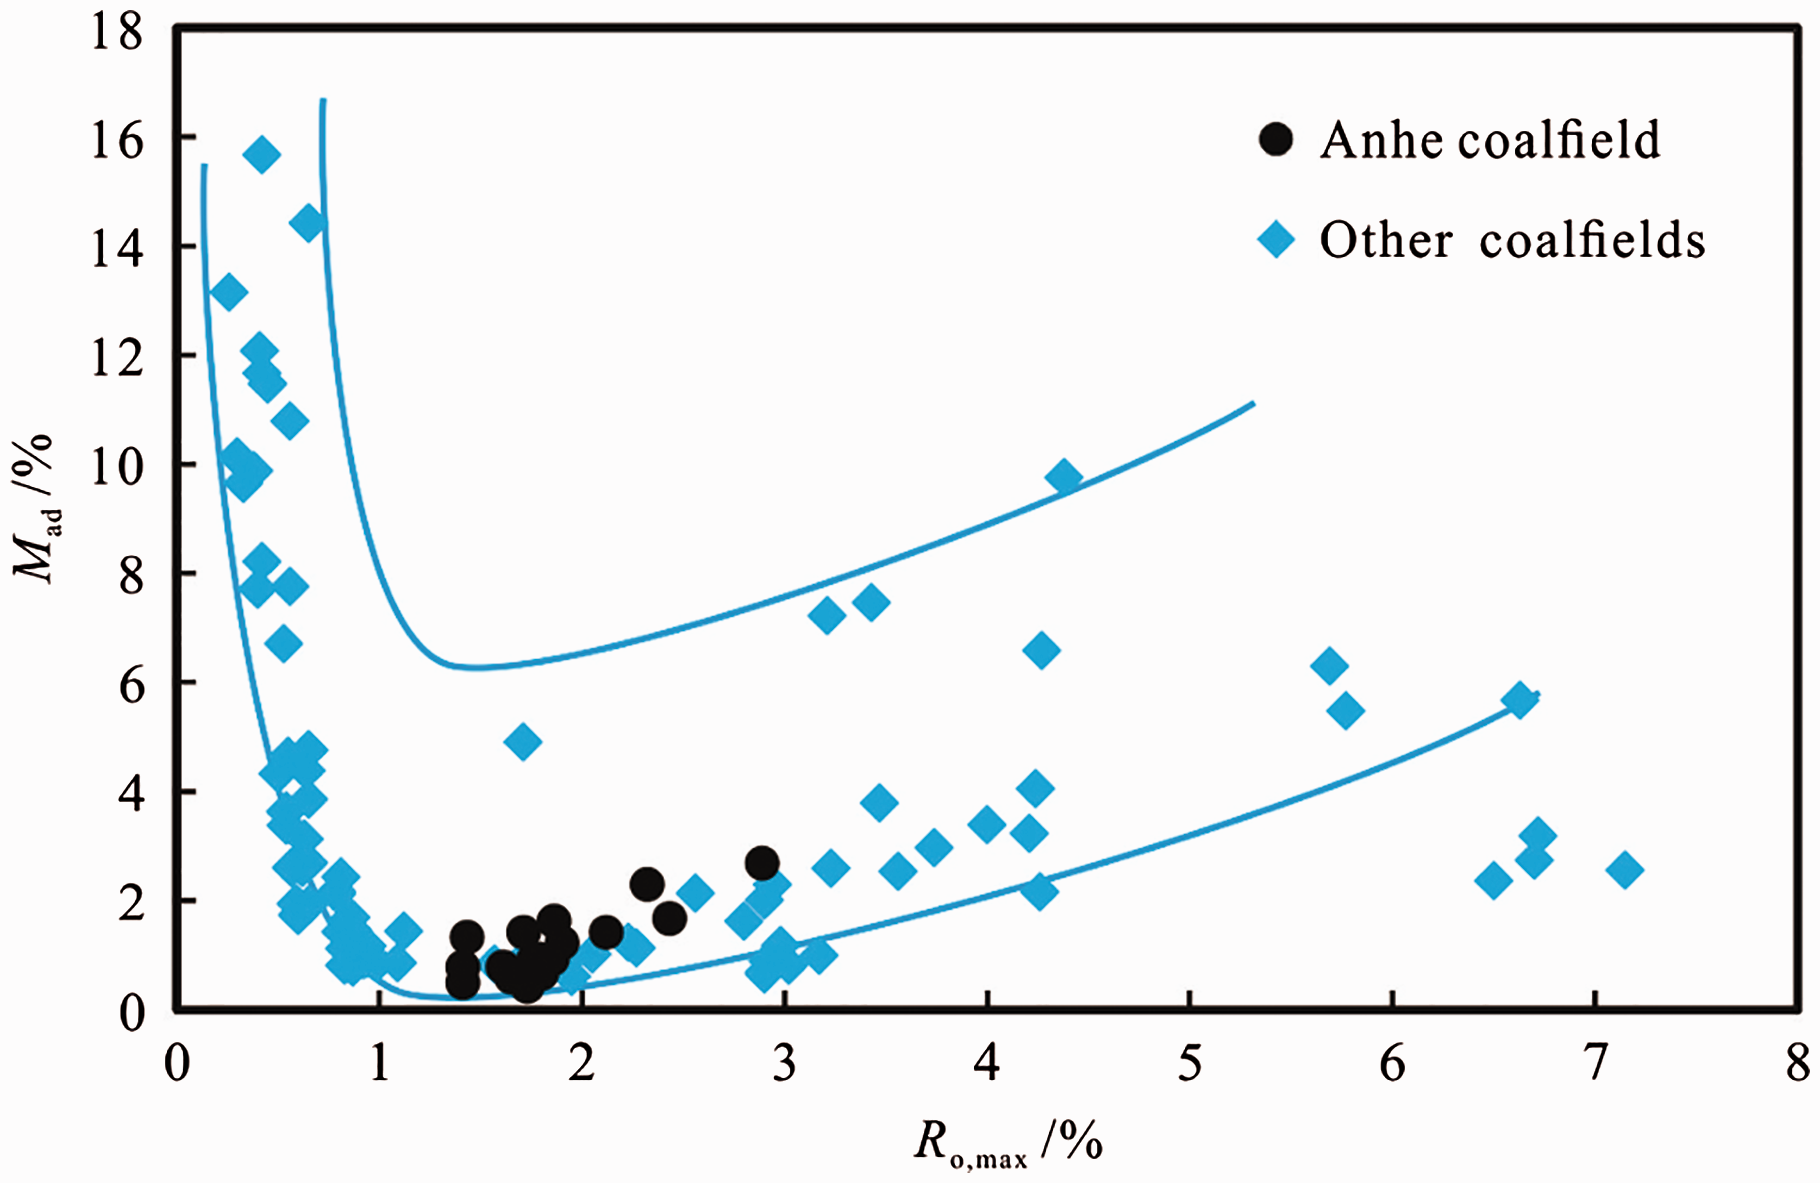
Relationship between Mad and Ro,max of coals in the Anhe coalfield and other coalfields. For other coalfields, the moisture content of coals first decreases and then increases with the coal rank. The moisture content and coal rank show a positive correlation in the Anhe coalfield. Data of other coalfields are from Yao and Liu (2007), Yao et al. (2011), Yu et al. (2014), and Li et al. (2016), and the experimental methods of these data are consistent with this paper. Other coalfields include Huaibei coalfield, Huainan coalfield, Handan coalfield, Hongyang coalfield, Datong coalfield, Qinshui basin, Pingdingshan coalfield, Jiaozuo coalfield, Yongxia coalfield, Xinggong coalfield, Hailar basin, Zhaotong basin, Junggar basin, Ili basin, Turpan-Hami basin, Wanquan basin, Tiefa basin, and Fukang mining area.
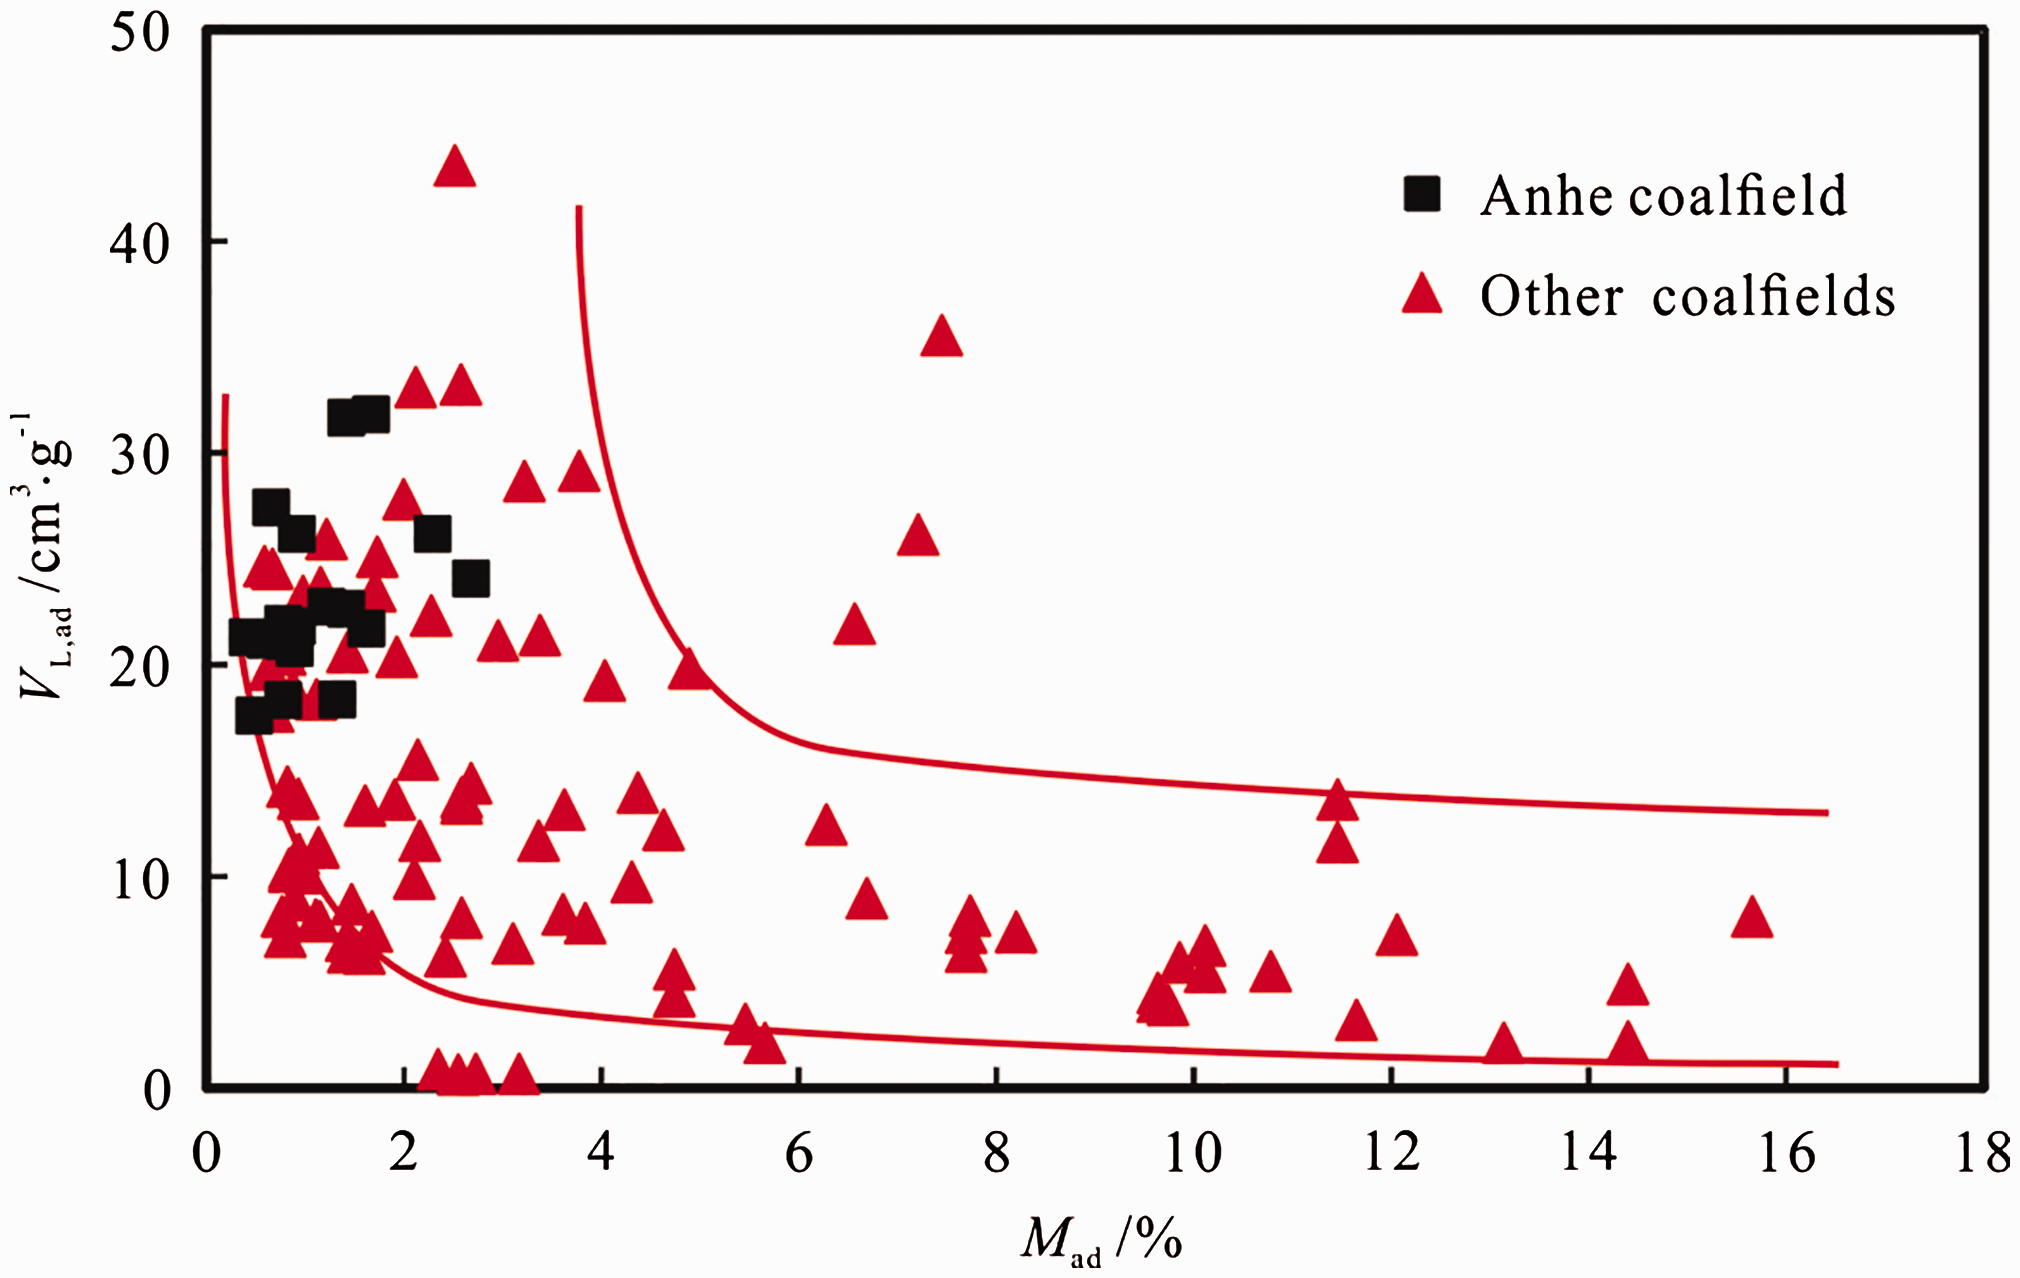
Relationship between VL, ad and Mad of coals in the Anhe coalfield. For other coalfields, the methane adsorption capacity of coals decreases with the moisture content. There is a positive correlation between the adsorption capacity and the moisture content of coals in the Anhe coalfield. Other coalfields include Huaibei coalfield, Huainan coalfield, Handan coalfield, Hongyang coalfield, Datong coalfield, Qinshui basin, Pingdingshan coalfield, Jiaozuo coalfield, Yongxia coalfield, Xinggong coalfield, Hailar basin, Zhaotong basin, Junggar basin, Ili basin, Turpan-Hami basin, Wanquan basin, Tiefa basin, and Fukang mining area. Data of other coalfields are from Yao and Liu (2007), Yao et al. (2011), Yu et al. (2014), and Li et al. (2016), and the experimental methods of these data are consistent with this paper.
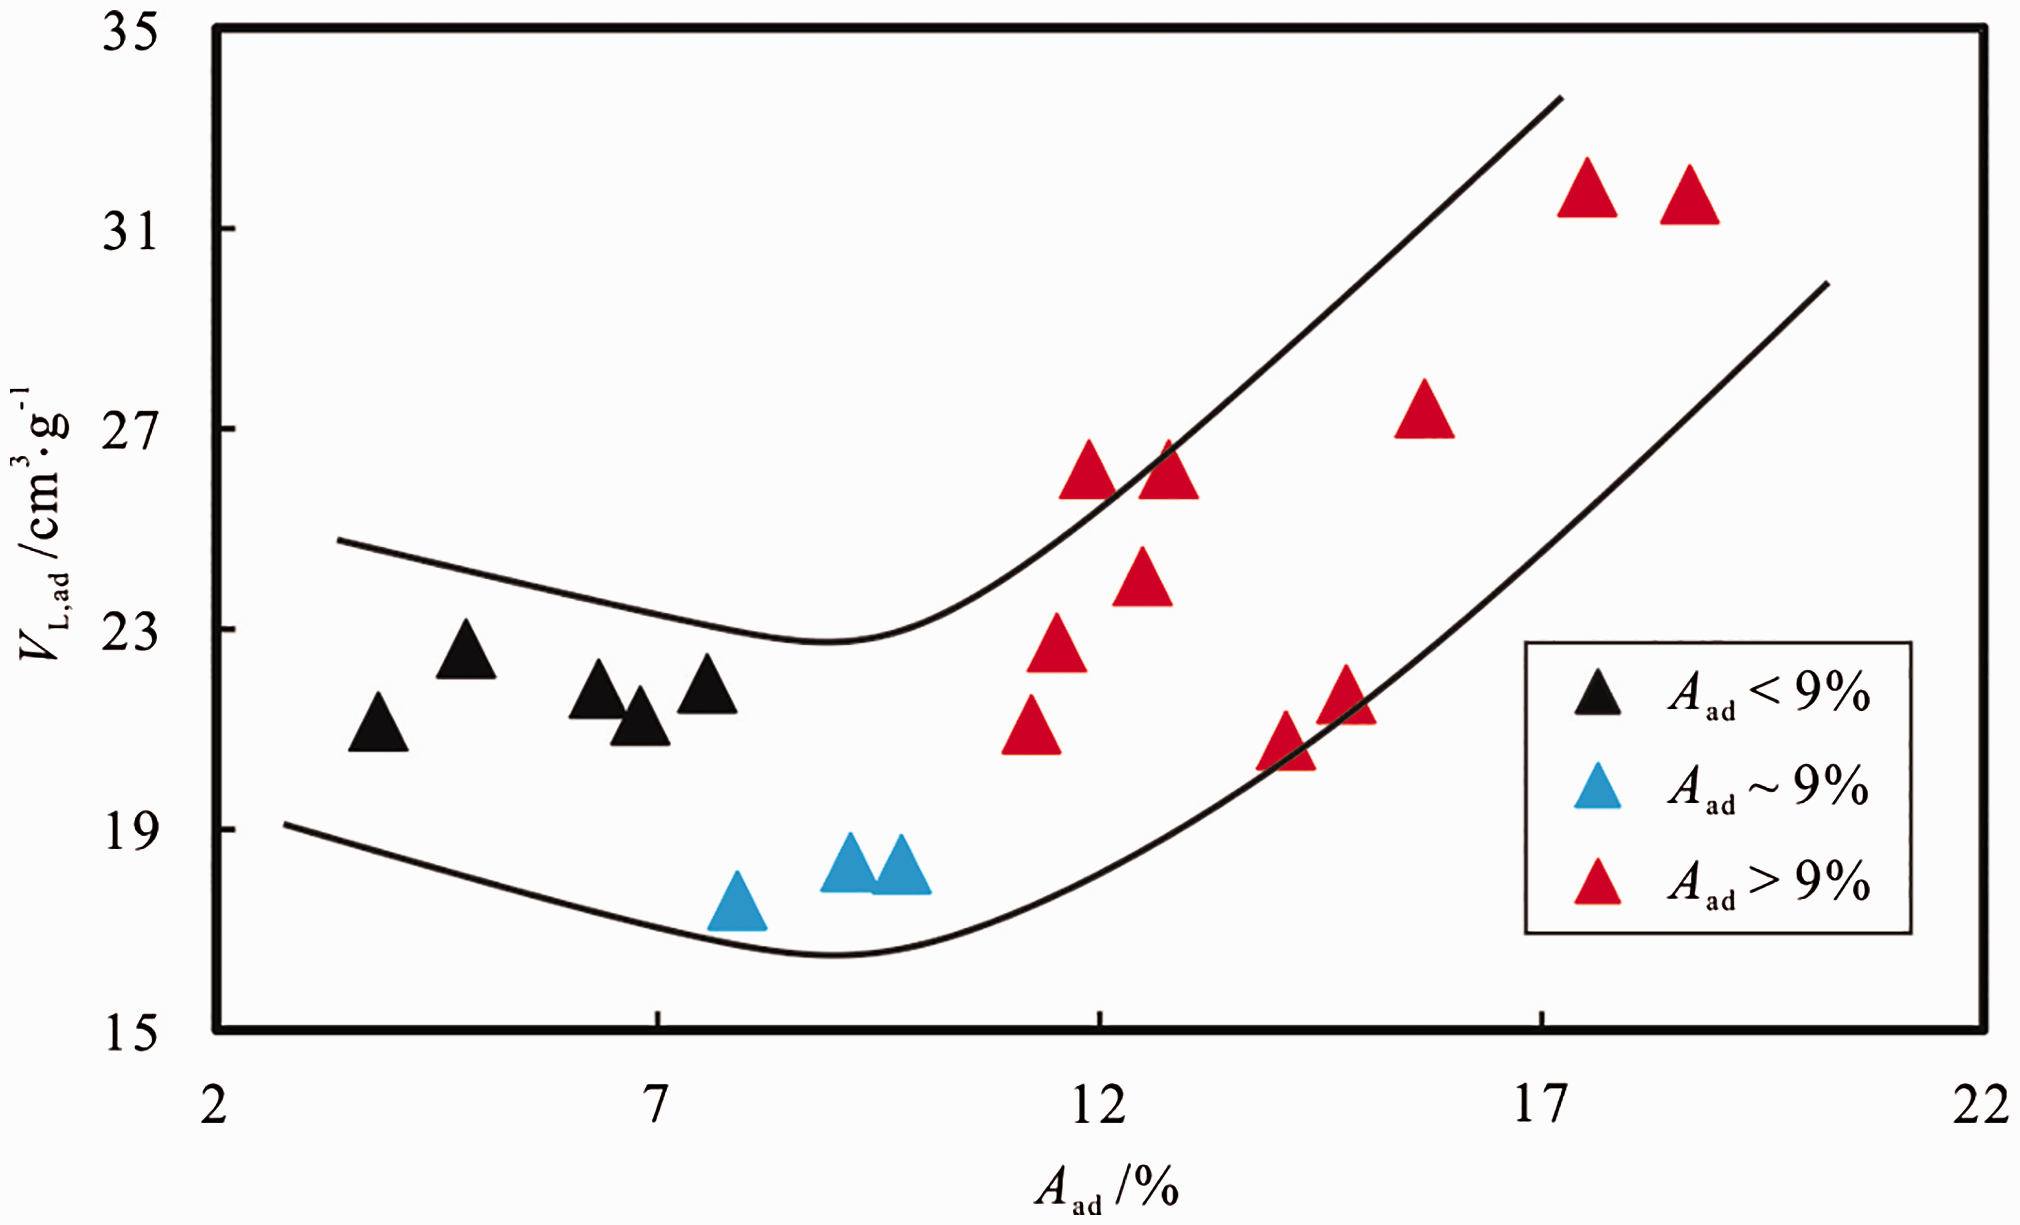
Relationship between VL, ad and Aad of coals in the Anhe coalfield. The methane adsorption capacity first decreases and then increases with the ash yield, and the lowest VL, ad value corresponds to an ash yield of ∼9%. The Ro,max values of the coal samples marked with red color are significantly higher than those of the samples marked with blue color.
Prediction model of the gas content and its case study
Prediction model of the gas content
The methane adsorption capacity has an important influence on the gas content in coals (Perera et al., 2012). Maximum vitrinite reflectance (Ro,max), moisture content (Mad), ash yield (Aad), vitrinite content (V), and inertinite content (I) are considered to be the factors that significantly influence the methane adsorption capacity (Mardon et al., 2014). Therefore, the correlations between these five factors were analyzed (Table 3). The results show that some of the information for the variables overlaps due to their strong correlations. Therefore, it is necessary to carry out PCA to minimize the loss of original index information while reducing the analysis indexes (Abdi and Williams, 2010).
Correlative coefficient matrix of the five indexes.
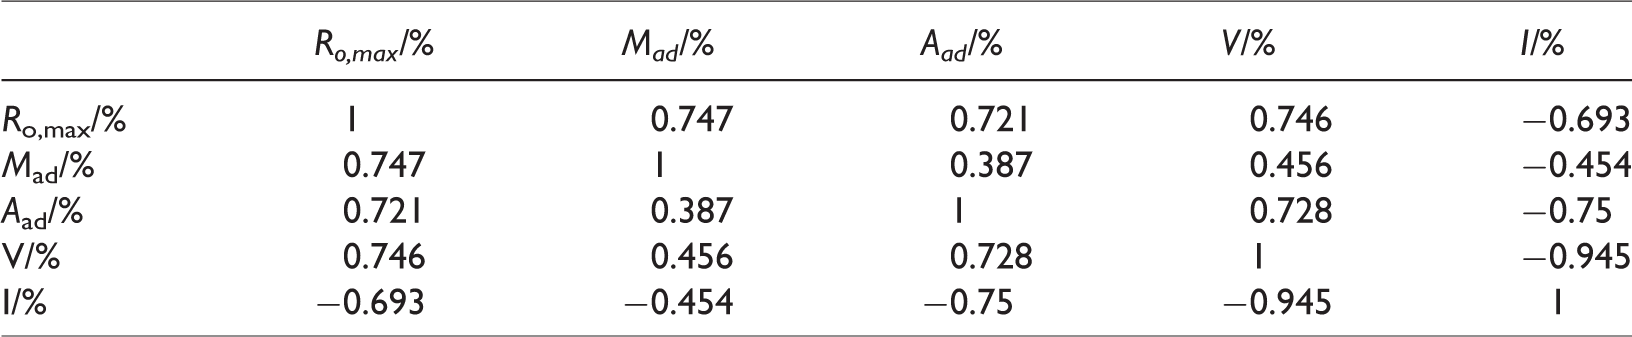
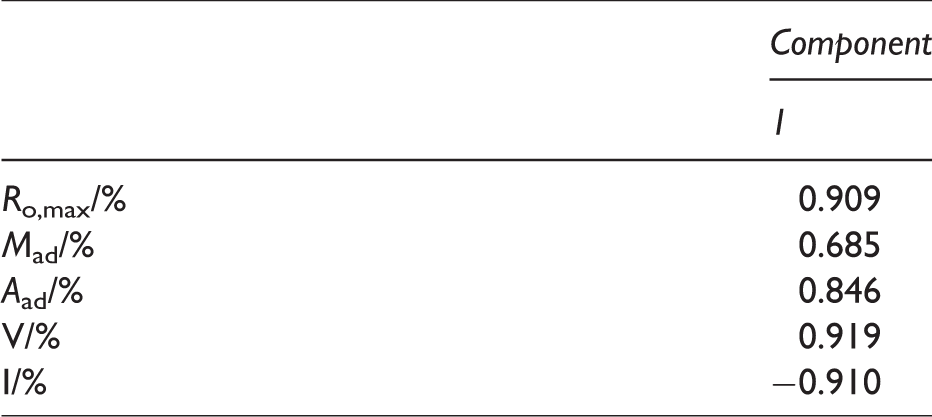
Table 4 shows that the variance of the first principal component is greater than 1, and contains most of the index information. Therefore, the principal component F1 is extracted. The load matrix of the first principal component is shown in Table 5, and the coefficients of F1 are the values that the load vectors of the principal component divided by the square root of the variance of the principal component. The following equation was obtained

Results of variance decomposition and principal component analysis.
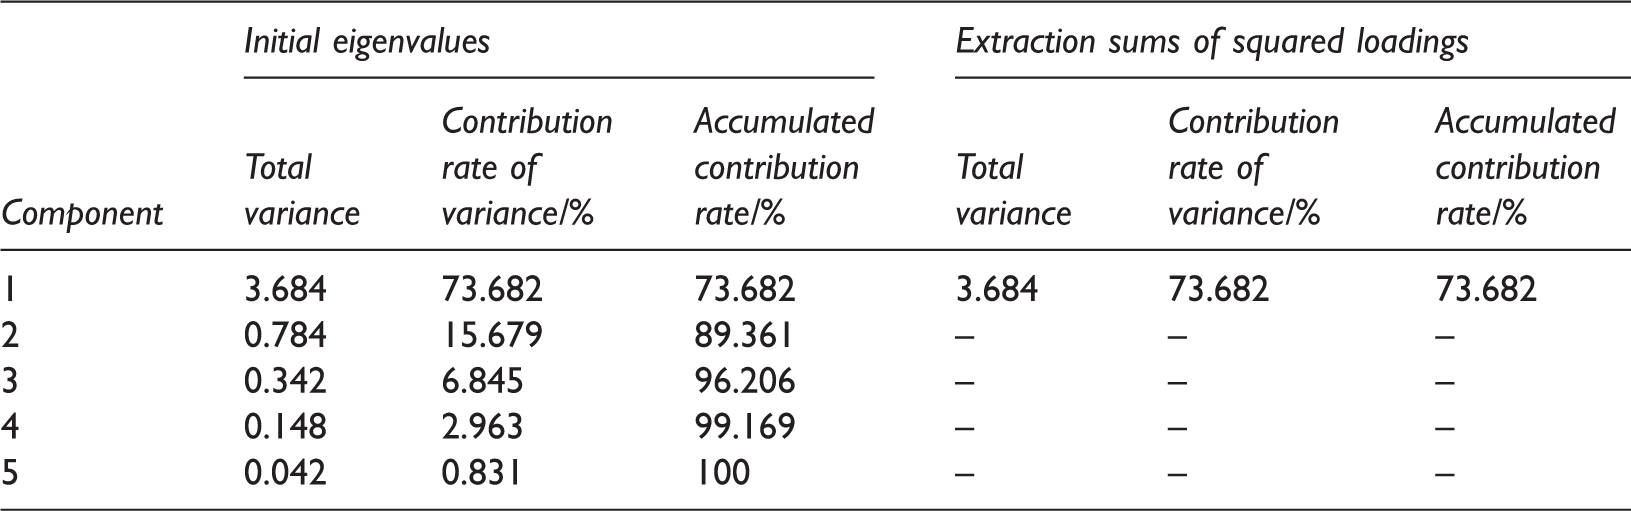
Extraction method: Principal component analysis.
Load matrix of the principal component.
The correlation between VL (30°C), PL (30°C), and F1 was analyzed (Figure 11) based on the data in Table 6. The following functions were obtained


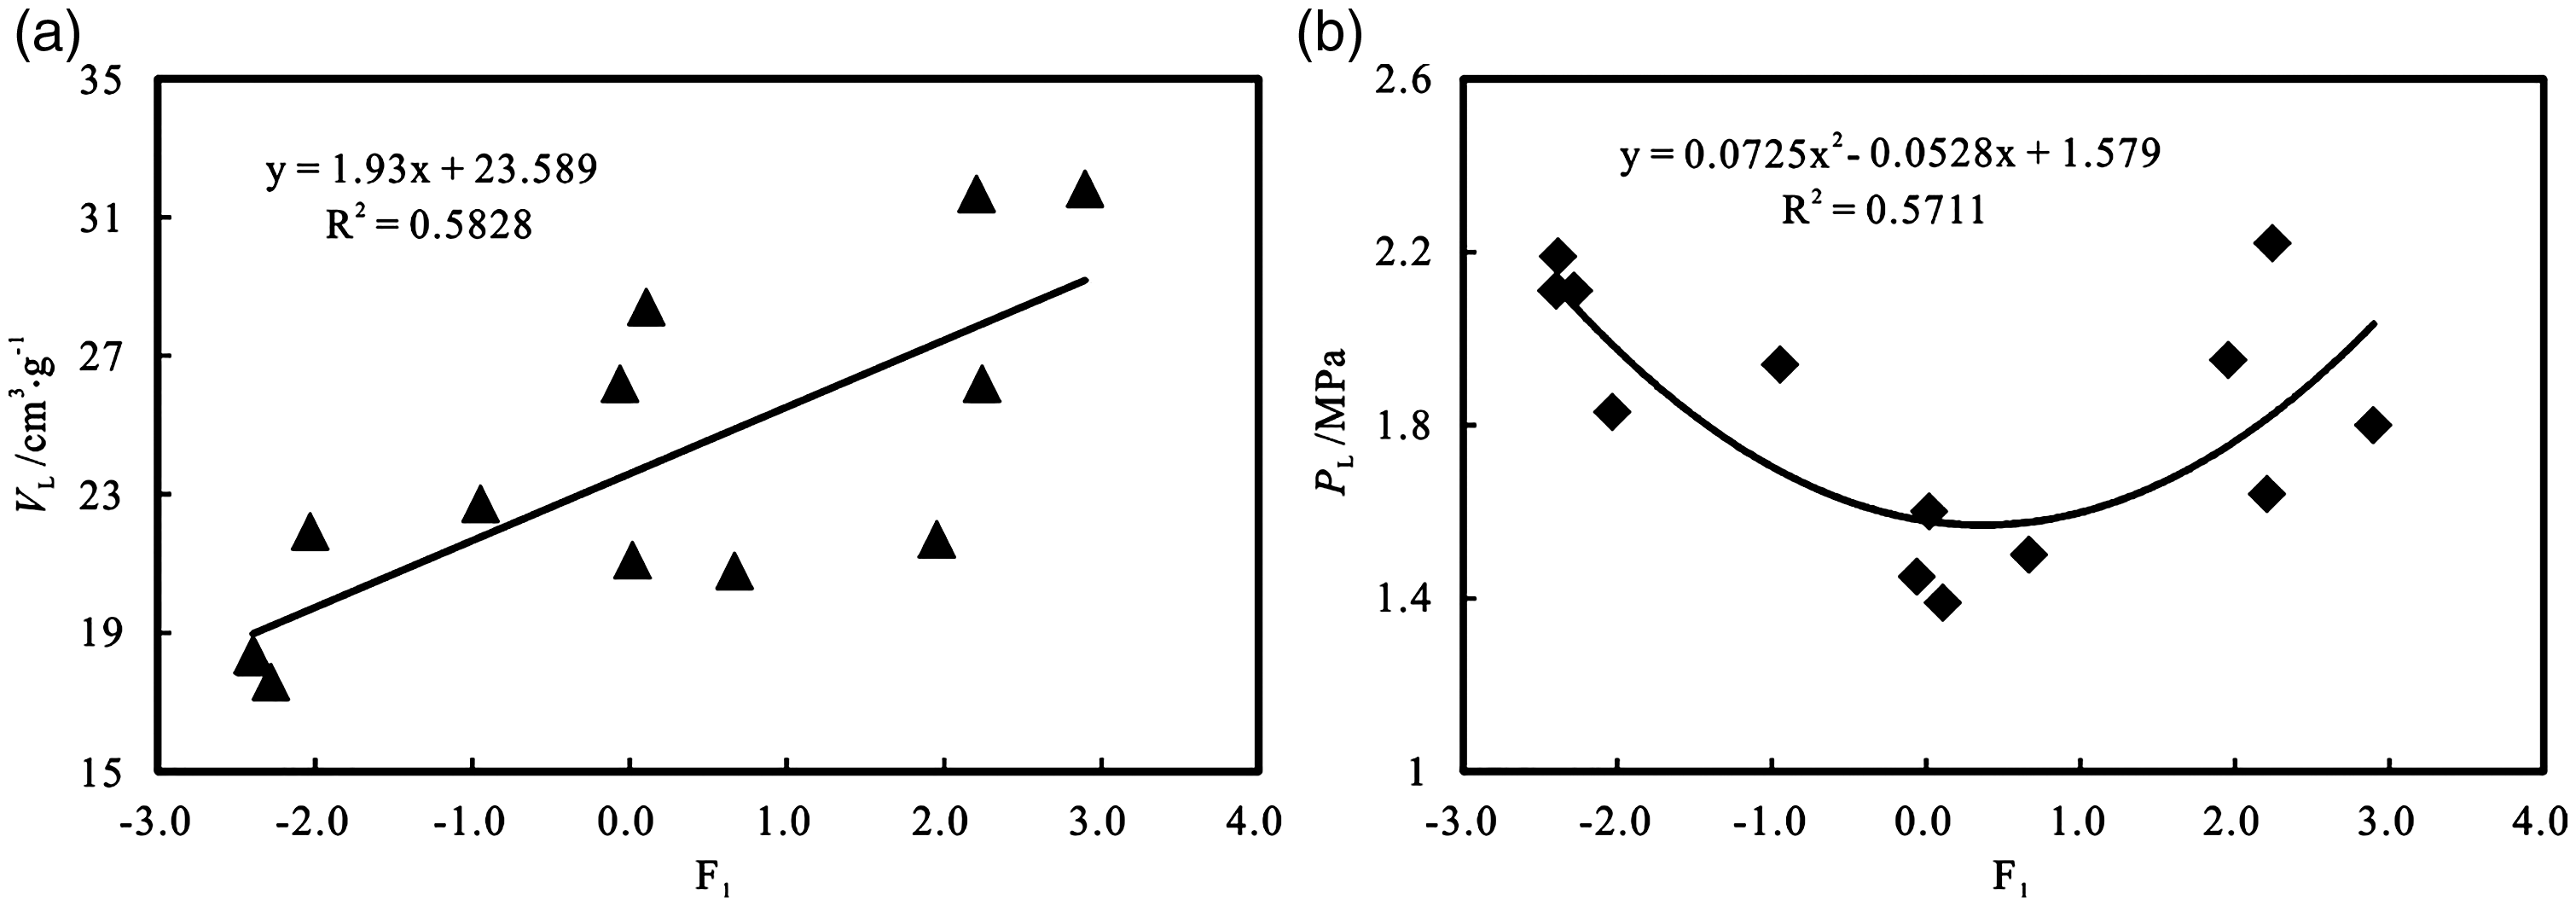
Relationships between VL (30°C), PL (30°C), and F1 of coals in the Anhe coalfield.
Results of principal component analysis to adsorption constants of coal samples.
Where the five parameters including Ro,max, Mad, Aad, V, and I are the standardized values.
The relationships between VL, PL, and the temperature (t) of coal seams in North China have been studied previously, and the correlation coefficients (R) of 0.9904 and 0.9718 were determined respectively (Xie and Chen, 2007; Zhang et al., 2004):


The correlations between VL, PL, and F1 at different temperature conditions were analyzed by combining above equations


The model for the prediction of the gas content can be described based on the Langmuir equation:


The values of D and S were obtained from previous studies of the study area (Chang and Hua, 2007; Wang, 2009). The values of G and t0 were taken from mine geology reports (Du et al., 2011). The theoretical correlation between the gas content and burial depth is shown in Figure 12 based on the data in Table 6 and above-mentioned equations. The gas content of the coals first increases and then decreases with the burial depth, regardless of Ro,max. Although coals in the shallow west have better methane adsorption capacity than that in the deep east, the formation pressure in the shallow west is relatively lower, and thus the gas content of coals in the shallow west is less than that in the deep east. The highest gas content corresponds to a depth ranging from 400 m to 700 m. Therefore, depths in this range can be regarded as critical burial depth, which is affected by both the temperature and pressure. When the burial depth is less than the critical depth, the positive effect of the pressure on the adsorption capacity of the coals is greater than the negative effect of the temperature, which is characterized by the positive correlation between the burial depth and gas content, while the opposite is true when the burial depth is larger than the critical depth (Li et al., 2016). Therefore, areas with a critical depth ranging from 400 m to 700 m are favorable for CBM exploration and development in the Anhe coalfield.
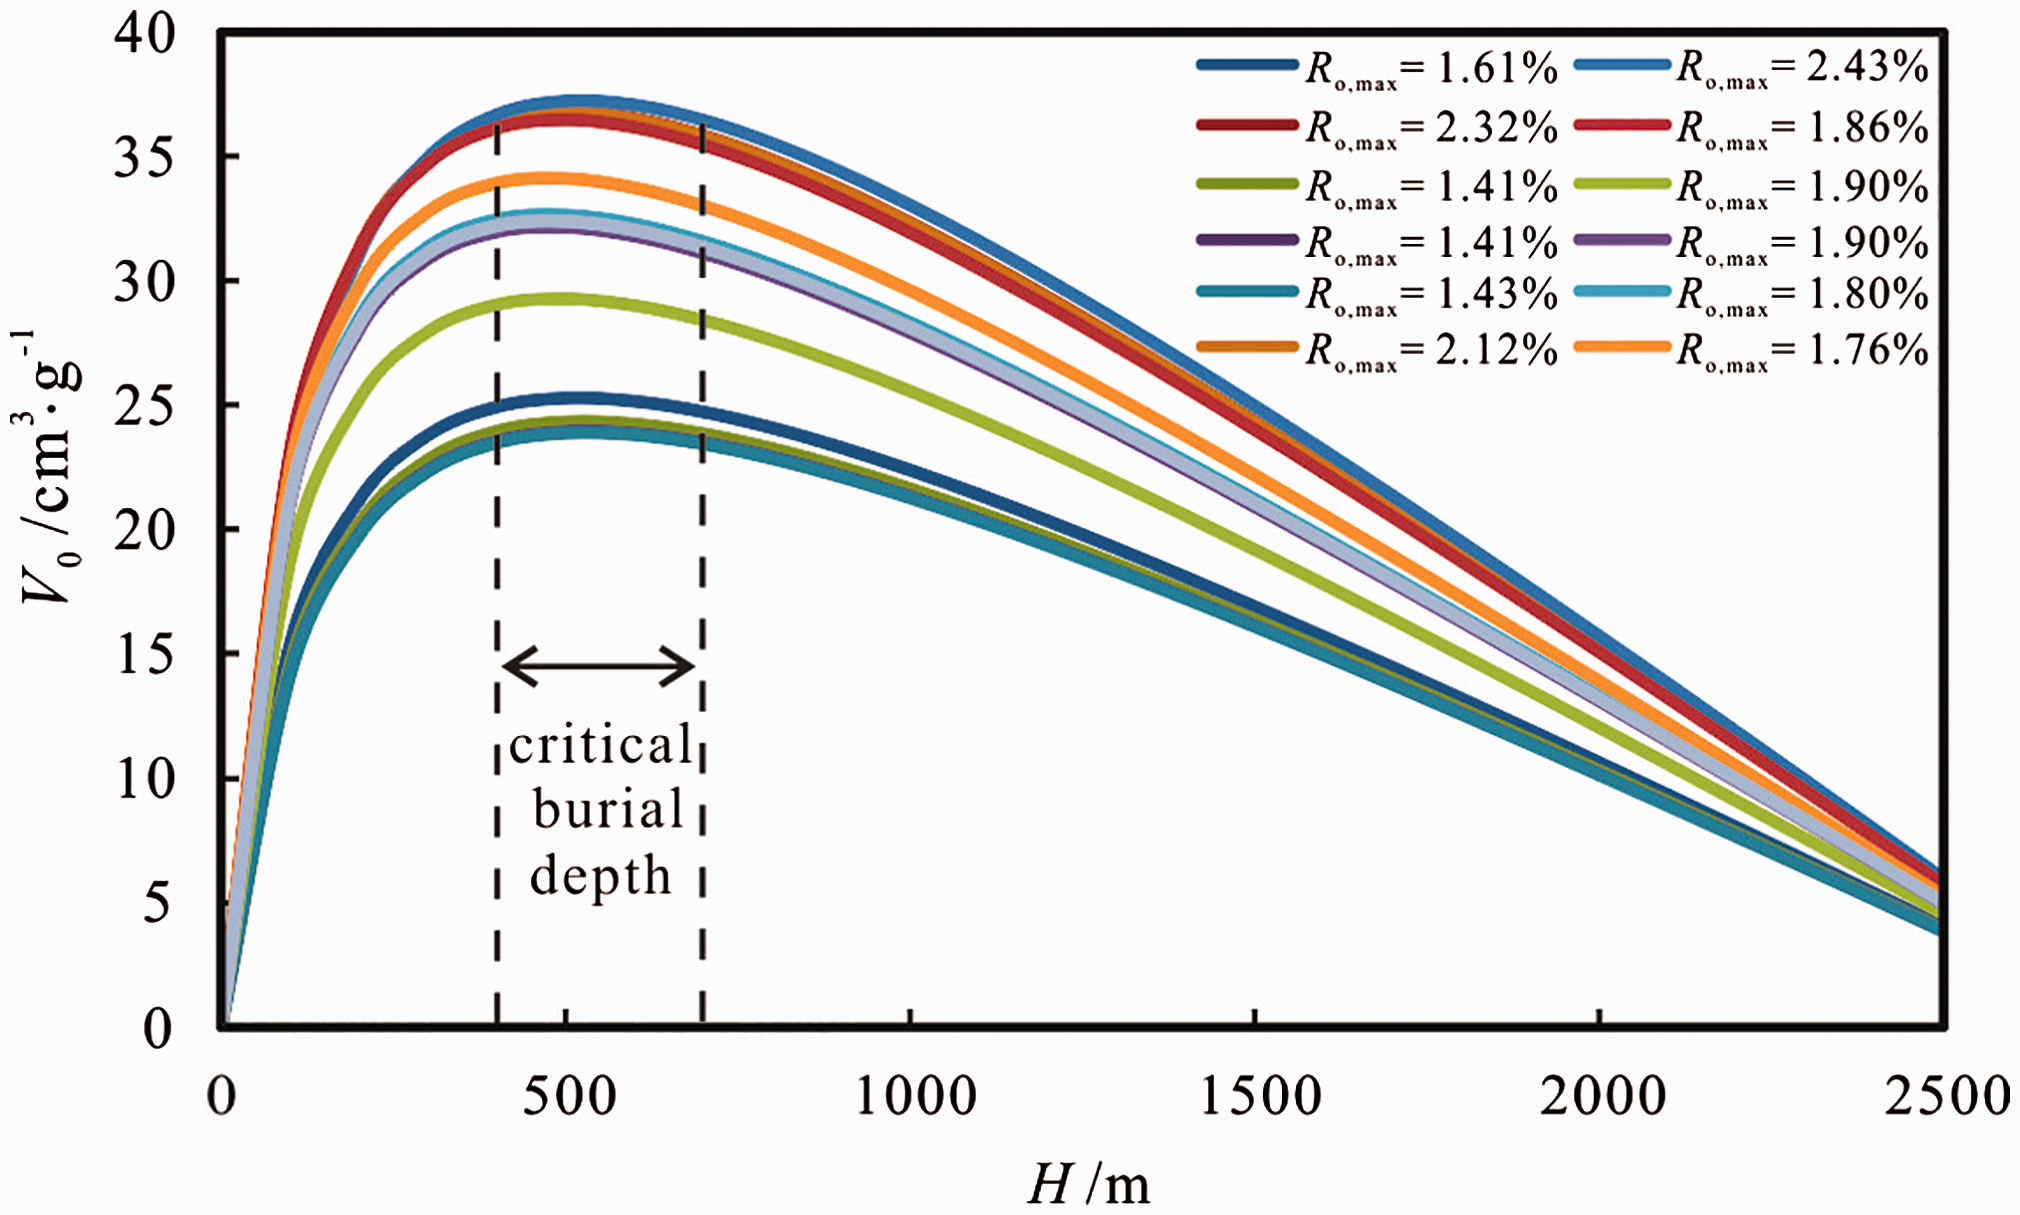
Correlation between the gas content and burial depth of coals in the Anhe coalfield. The critical depth for the variation of the gas content is roughly between 400 m and 700 m. The gas content of the coals first increases and then decreases with the burial depth, regardless of Ro,max.
Case study of the prediction model
The predicted gas content of the 13 coal samples (HL, AL, D21–9-1, D21–9-2, D21–9-3, 2702, 3001, Hb9, Hb6–1, Hb6–2, Hb8, Hb5, and Hb4) in this research are 24.73 cm3/g, 24.34 cm3/g, 17.28 cm3/g, 17.01 cm3/g, 17.05 cm3/g, 35.02 cm3/g, 34.36 cm3/g, 35.45 cm3/g, 29.00 cm3/g, 31.80 cm3/g, 32.28 cm3/g, 33.00 cm3/g, and 32.03 cm3/g, respectively. To verify the reliability of this prediction model, the comparative analysis between the predicted gas content and the measured gas content of coals from 26 boreholes was carried out. The burial depth of coals varies from 710.14 m to 1353.92 m, and the measured gas content from 26 boreholes are collected from the coal exploration reports of Lunzhang mine and Longgong mine. The standard MT/T 77–94 was followed to measure the gas content of coals.
The coal exploration reports showed that the values of Ro,max varies from 1.5% to 2.4% with an average of 1.83%, the G in the areas is around 0.87°C/hm, and the D of coals changes between 0.53 and 0.68 MPa/hm with an average of 0.58 MPa/hm. The t0 near the surface is 15°C, the S of coal seam varies from 68% to 92% with an average of 86%. The average values of moisture content and the ash yield of coals are 0.91% and 14.25%, respectively. The vitrinite content is around 85.82%, and the inertinite of coal reservoir is 8.73%.
The predicted gas content of coals from 26 boreholes was calculated based on equation (10) and above data. Meanwhile, the comparative result between the predicted gas content and the measured gas content is shown in Figure 13. The predicted gas content of coals changes between 24.13 cm3/g and 32.37 cm3/g (average; 27.80 cm3/g), and the measured gas content varies from 24.12 cm3/g to 33.22 cm3/g (average; 27.81 cm3/g). Furthermore, the gas content obtained from two methods showed the similar negative correlation with the burial depth of coals. Therefore, the prediction model of the gas content in this research may be helpful to the further CBM exploration in the Anhe coalfield.
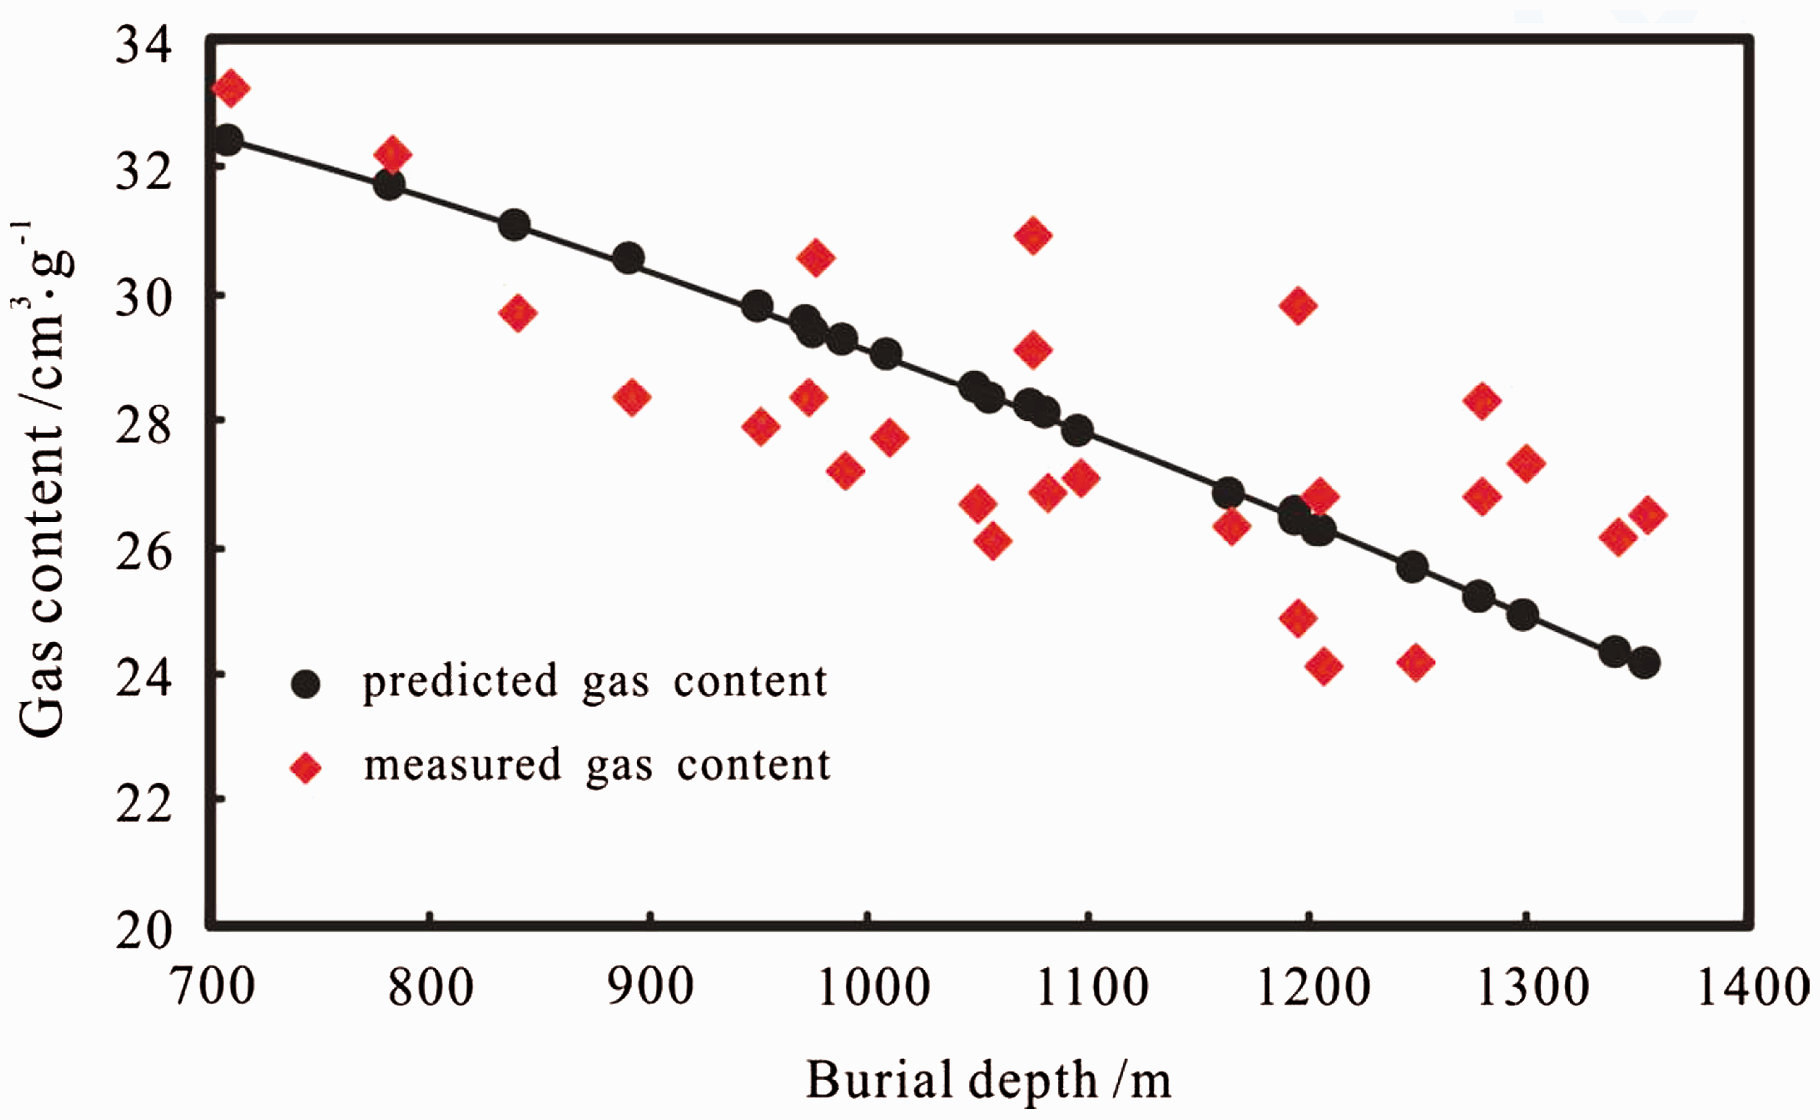
The comparative analysis between the predicted gas content and the measured gas content of coals.
Conclusions
In the Anhe coalfield, the VL, ad of coals ranges from 17.58 cm3·g−1 to 31.82 cm3·g−1 with an average of 23.14 cm3·g−1. The values of VL, ad in the shallow western area of this anti-Hilt law region are generally higher than those in the deep east. The PL ranges from 0.30 MPa to 2.22 MPa with an average of 1.40 MPa. The coal rank and the coal macerals are the dominant factors that influence the methane adsorption capacity of coals in this anti-Hilt law area. The methane adsorption capacity of coal samples in the Anhe coalfield first increases and then decreases with the coal rank, and the highest VL, daf value corresponds to the Ro,max value of ∼2.1%. The adsorption capacity displays a positive correlation with the vitrinite and the moisture content, a negative relationship with the inertinite content. Overall, the adsorption capacity of coal samples shows a “V-shaped” change with the ash yield. Based on the method of PCA, the critical depth for the variation of the gas content is roughly between 400 m to 700 m. The gas content of the coals first increases and then decreases with the burial depth, regardless of Ro,max. Therefore, areas with a critical depth ranging from 400 m to 700 m are suggested to be methane enrichment regions for CBM exploration in the Anhe coalfield.
Footnotes
Acknowledgements
The authors are grateful to the Henan Administration of Coalfield Geology for assistance during sampling.
Declaration of conflicting interests
The author(s) declared no potential conflicts of interest with respect to the research, authorship, and/or publication of this article.
Funding
The author(s) disclosed receipt of the following financial support for the research, authorship, and/or publication of this article: This research is supported by the China Geological Survey Scientific Research Project (1212011220794), and National Science and Technology Major Project (2016ZX05041004–003).