
Abstract
Understanding the organic sulfur structure and its evolution characteristics is crucial to the desulfurization of coal, as they are the dominant factors determining the removal of organic sulfur from coal. To learn the organic sulfur structure characteristics, a series of high-organic-sulfur coals from China with different ranks were studied by coal petrology, structural chemistry, and organic geochemistry theory in this paper. Coal petrological analysis shows some of the high-organic-sulfur coals with high TPI values and low GI values indicating that they have experienced unusual conditions when the coal was forming. Through the FTIR analysis, the organic sulfur structural parameters shows the relative abundance of aliphatic sulfur (thiol, thioether and sulfone) in these coals decreased with the increasing coal rank and the relative abundance of aromatic sulfur in coal generally showed an increasing trend with increasing coalification, divided into three different evolutionary stages (0.37%–1.40%, 1.40%–1.99% and 1.99%–3.93% of Rm). Comprehensive analysis shows that EID and TPI had a significant correlation with the organic sulfur structural parameters, which means regardless of the coal rank the impact of the environment on the structure of organic sulfur is independent. These results give a new insight into organic sulfur characteristics in coal and its evolution characteristics with coal rank, which are potentially useful for the efficient remove the organic sulfur from coal.
Introduction
The environmental impacts of coal combustion and utilization cannot be ignored, especially the pollution caused by the release of sulfur from coal (Abelson, 1975; Davut and Sibel, 1997; Medunić et al., 2016a, 2018a, 2018b; Train, 1975), compelling scholars to study the geochemical characteristics of the genesis and sources of sulfur in coal (Casagrande and Ng, 1979; Casagrande and Siefert, 1977; Casagrande et al., 1989; Chou, 1997, 2012; Dai et al., 2008, 2017, 2018; Lei et al., 1994; Ren et al., 1994, 1996; Tang et al., 1993, 1996, 1997, 2002, 2015; Yang and Zhao, 2018). Coal with an organic sulfur content of 4% to 11% is referred to as superhigh-organic-sulfur (SHOS) coals (Chou, 1997). The SHOS coals and their very high organic sulfur contents, are not common and have attracted the attention of researchers (Dai et al., 2008, 2017, 2018; Li and Tang, 2014; Li et al., 2015; Medunić et al., 2020; Smith and Batts, 1974; Torres-Ordonez et al., 1990; White et al., 1990; Zhao et al., 2014, 2020). In some special cases the sulfur content in coal is high and the organic sulfur content exceeds 50% of total sulfur (Dai et al., 2008, 2017, 2018; Li and Tang, 2013, 2014; Li et al., 2015; Medunić et al., 2016b; Sinninghe Damsté et al., 1999; Smith and Batts, 1974; Torres-Ordonez et al., 1990; White et al., 1990; Zhao et al., 2014). Studying the evolution characteristics of organic sulfur compounds, the source of the organic sulfur, and the relationship between organic sulfur and the coal-forming environment in these special cases can provide guidance for the rational utilization and removal of organic sulfur to achieve clean utilization of coal (Ken and Nandi, 2018; Kumar et al., 2019; Kumar and Kumar, 2018; Liu et al., 2019; Shen et al., 2019; Singh et al., 2012a, 2013, 2018; Medunić et al., 2019).
The petrological characteristics of coal retains some information on the coal-forming parent materials and coal-forming environment (Diessel, 1986; Diessel and Gammidge, 1998; Gayer et al., 1999; Gentzis and Goodarzi, 1990; Lei et al., 1994, 1995a, 1995b; Singh et al., 2012b, 2016). Analysis of the coal maceral composition and its organic sulfur structural characteristics can provide important information for understanding the genetic mechanism and coal-forming environment of high organic sulfur coals. Since the emergence of infrared spectroscopy, it has become an indispensable tool for the identification, quantitative determination and structural study of organic compounds. Infrared spectroscopy studies of organic solids such as coal, oil shale, and kerogen have made great progress since the 1960s (Bent and Brown, 1961; Cline Ii et al., 2018; Guo and Bustin, 1998; He et al., 2017; José et al., 1996; Lis et al., 2005; Liu et al., 2018; Mastalerz and Bustin, 1993; Painter et al., 1978, 1981, 1985; Tang et al., 2018; Wang et al., 2011; Zhao et al., 2015). At present, Fourier Transform Infrared Spectroscopy (FTIR) is often used to obtain chemical structural parameters and also an important means for studying the molecular structure of coal (Chen et al., 2012; He et al., 2017; Jiang et al., 2019; Liu et al., 2018; Supaluknari et al., 1988; Tang et al., 2018; Yan et al., 2020).
Therefore, studying the coal-forming environment, organic sulfur structure, and the organic sulfur structure evolution of coal can be of great significance for the efficient removal of organic sulfur to achieve the clean utilization of coal. This study focused on the structural characteristics of organic sulfur and coal petrological characteristics in high organic sulfur coals from China with different rank to better understanding the coal-forming environment, organic sulfur structure and evolution characteristics of organic sulfur in coals with different ranks.
Experimental
Samples
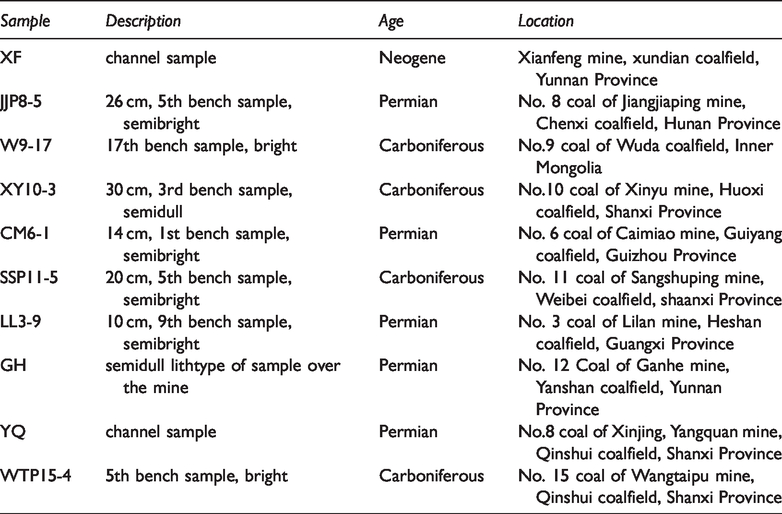
In this study 10 raw coal samples with different coal ranks were collected from different regions of China and they are all bench samples except XF, GH and YQ. XF and YQ are channel samples which collected cut as 20-cm wide and 10-cm deep channels. Each coal bench sample was cut over an area about 20-cm wide and 10-cm deep by an interval of 10–30 cm for coal seam. The sampling locations are shown in Figure 1 and the descriptions of these samples are listed in Table 1.
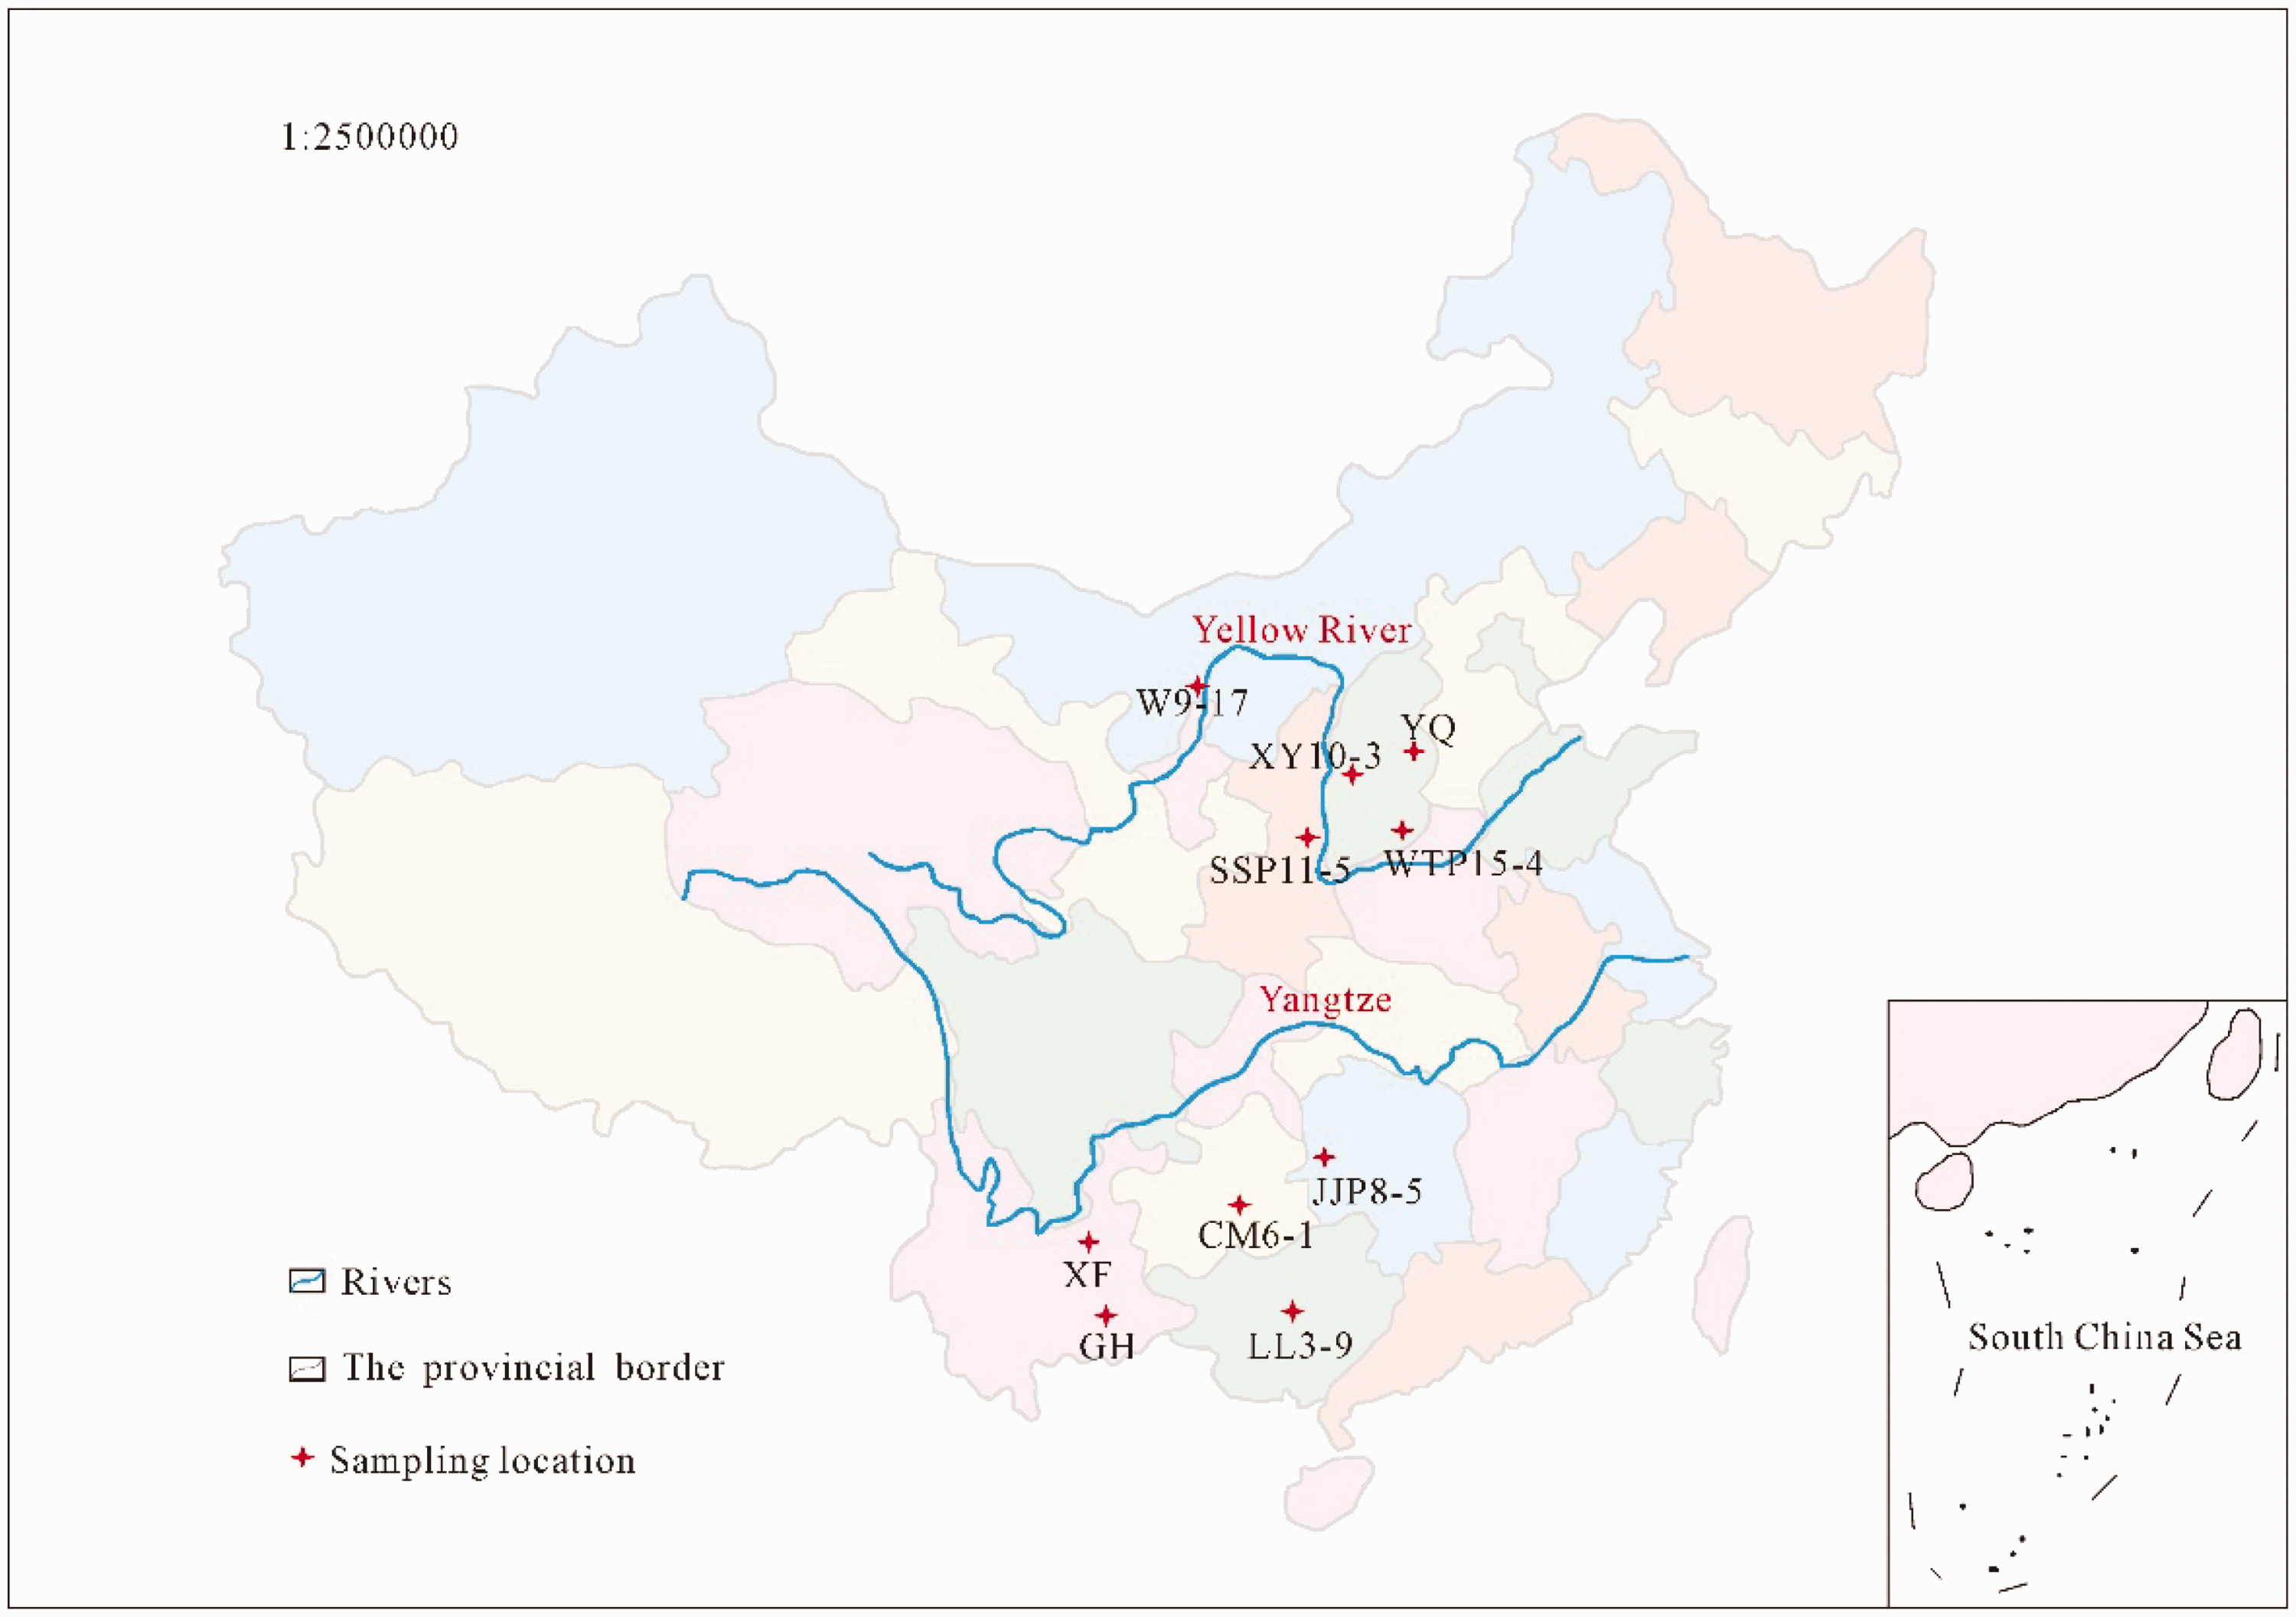
Distribution of sampling locations on the map of China.
Description for all analysis samples.
Analytical method
Proximate analysis was performed following ASTM Standard D3173-11 (2011), ASTM Standard D3174-11 (2011) and ASTM Standard D3175-11 (2011). The total sulfur and forms of sulfur were determined according to the ASTM Standard D3177-02 (2011) and ASTM Standard D2492-02 (2012). Ultimate analysis was determined based on ASTM Standard D5373-08 (2011). The maximum reflectance of vitrinite (Rm %) was determined by Leitz Orthoplan microscope equipped with a Daytronic mainframe 9005 spectrophotometer following ASTM Standard D 2798-2011a (2011). As for petrologic analysis, coal samples was ground to 20 mesh for preparation of the polished pellet, more than 500 counts were taken for each polished pellet under oil-immersion white light using a magnification of 500 ×. The classification and quantification of coal macerals is according to the International Committee for Coal and Organic Petrography system-ICCP 1994 system (1998, 2001).
Samples subjected to FTIR study were raw coal ground to 200 mesh and prepared with KBr pressed into thin pellets. A Bruker TENSOR 27 FTIR was used with a scan range of 450–4000 cm−1, 32 scans with a resolution of 4 cm−1. The curve-fitting of the FTIR statistics was performed using Origin software. The Statistical Product and Service Solutions (SPSS) software was used to analyze the relationship between the index of coal petrology and FTIR organic sulfur structure parameters.
Results and discussion
Coal chemistry and vitrinite reflectance
Proximate analysis, ultimate analysis, total sulfur and forms of sulfur analysis results are listed in Table 2. The coal samples organic sulfur content is between 0.92 and 12.09 and JJP8-5, CM6-1, SSP11-5, LL3-9 and GH are considered to be SHOS coals. They are all high organic sulfur coals except WTP15-4. Even though the WTP15-4 coal sample’s organic sulfur content So,d is 0.92%, the ratio of organic sulfur to total sulfur is 90%, making it appropriate to study the structure of the organic sulfur. Sample XF has a moisture content of 18.37% reflecting its low coal rank, and WTP15-4 has a moisture content of 3.84%, which is higher than other samples (0.19–0.44%). This is because in this high metamorphic degree anthracite coal, molecules are arranged more neatly, the internal surface area of coal increases and the amount of adsorbed water increases (Zettlemoyer et al., 1975).
Proximate analysis (%), ultimate Analysis (%), forms of sulfur (%) and vitrinite random reflectance (%) of coal samples.*
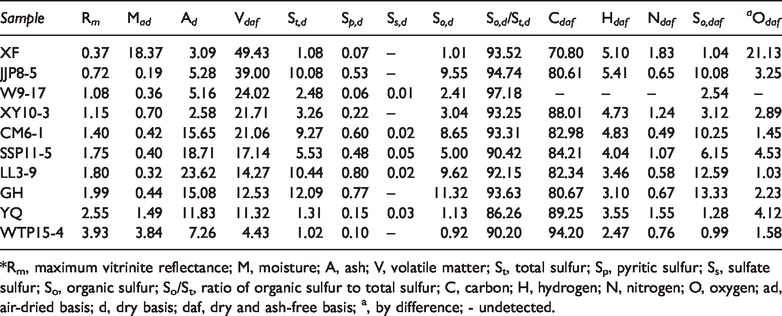
*Rm, maximum vitrinite reflectance; M, moisture; A, ash; V, volatile matter; St, total sulfur; Sp, pyritic sulfur; Ss, sulfate sulfur; So, organic sulfur; So/St, ratio of organic sulfur to total sulfur; C, carbon; H, hydrogen; N, nitrogen; O, oxygen; ad, air-dried basis; d, dry basis; daf, dry and ash-free basis; a, by difference; - undetected.
Petrological analysis
Determining the maceral composition of coal can provide information about the coal-forming environment. The coal maceral composition of the samples is shown in Table 3. The content of vitrinite in the coal samples ranged from 51.4 to 84.2 (Vol. %), inertinite from 5.4 to 41.9 (Vol. %), liptinite from 0 to 18.3 (Vol. %) and mineral matter from 2.0 to 31.5 (Vol. %). Collodetrinite was the main vitrinite maceral varying from 2.6 to 61.1 (Vol. %), and fusinite was the main inertinite maceral varying from 0.6 to 13.6 (Vol. %).
Petrological analysis of samples (vol%).*
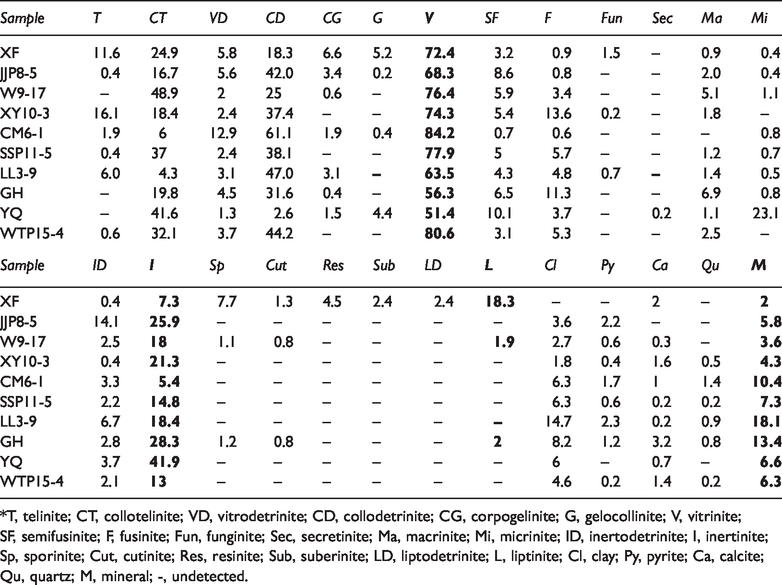
*T, telinite; CT, collotelinite; VD, vitrodetrinite; CD, collodetrinite; CG, corpogelinite; G, gelocollinite; V, vitrinite; SF, semifusinite; F, fusinite; Fun, funginite; Sec, secretinite; Ma, macrinite; Mi, micrinite; ID, inertodetrinite; I, inertinite; Sp, sporinite; Cut, cutinite; Res, resinite; Sub, suberinite; LD, liptodetrinite; L, liptinite; Cl, clay; Py, pyrite; Ca, calcite; Qu, quartz; M, mineral; -, undetected.
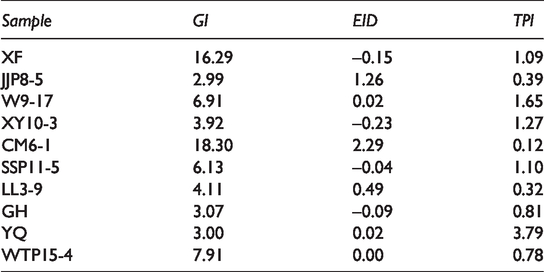
Diessel (1986) proposed the ‘Gelification Index (GI)’ and ‘Tissue Preservation Index (TPI)’ to determine the coal facies and depositional environments relations. Diessel and Gammidge (1998) also defined ‘Excess Inertodetrinite’. In general, the value of ‘Excess Inertodetrinite (EID)’ is negative. When EID is greater than 0, it indicates a special peat swamp environment, which means there was strong oxidation and/or allochthonous dispersal. According to the formula petrological parameters of coal samples were calculated (see Table 4). These coal samples petrological parameters value of GI are from 2.99 to 18.30, EID from -0.23 to 2.29, TPI from 0.12 to 3.79.


Petrological parameters of coal samples.
As seen in Figure 2(a) the high organic sulfur coals’ TPI and EID are inversely proportional, and TPI values are mostly very low between 0∼2, except for YQ (see Figure 2(b)). Previous studies showed that the formation of high organic sulfur coals is closely related to the activity of microorganisms and the strong microbial activity leads to substantial decomposition of plant tissue and poor preservation of tissue structure resulting in low TPI values (Dai et al., 2000; Gayer et al., 1999; Gentzis and Goodarzi, 1990; Lei et al., 1995b; Shao et al., 2003; Tang et al., 2002). However, YQ's TPI is significantly higher than that of the other samples, indicating that the plant structure is well preserved during coal formation and that YQ's coal-forming environment is more stable than the others.
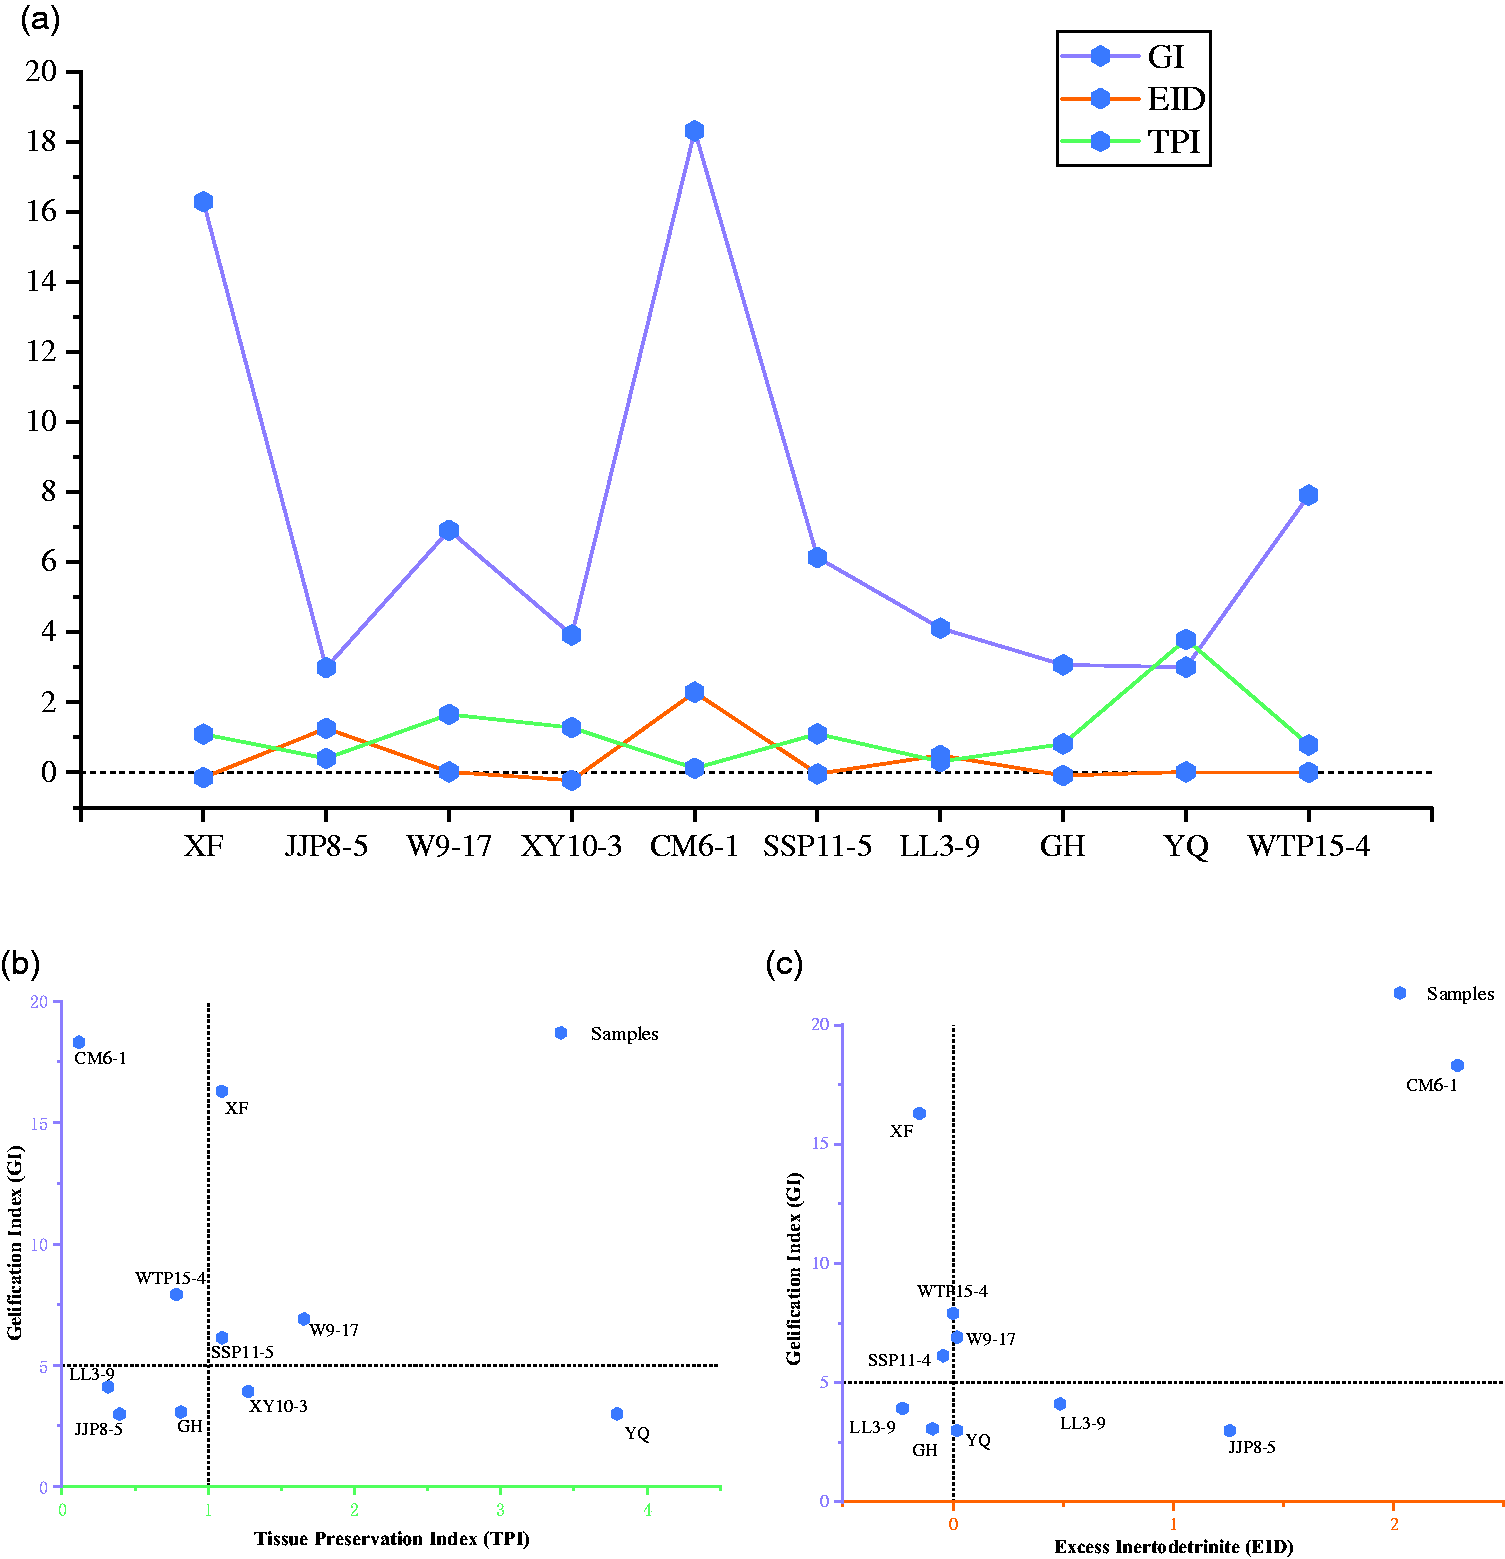
GI, EID and TPI parameters of coal samples.
According to Figure 2(b), the GI values of XF, W9-17, SSP11-5, CM6-1 and WTP15-4 are very high (>5.0) indicating that they have experienced strong gelification during coal formation. The results are consistent with previous studies that showed that the formation of high organic sulfur coal is inseparable from the gelification of coal (Kang et al., 1999; Lei et al., 1994, 1995a, 1995b; Shao et al., 2003; Tang et al., 2002). As shown in Figure 2(c), the EID values of W9-17, YQ, JJP8-5, CM6-1 and LL3-9 are all greater than 0, especially JJP8-5, CM6-1 and LL3-9, indicating that the coal-forming environment of the three coals had experienced oxidation and/or allochthonous dispersal.
FTIR results and discussion
The FTIR analysis results are discussed in two parts, the overall coal structure and the organic sulfur structure parameters.
Coal structure analysis
Figure 3 depicts the FTIR spectrum of all samples after normalization. Taking the LL3-9 sample as an example, the procedure of curve-fitting is shown in Figure 4. In Figure 3, from top to bottom, are samples XF, JJP8-5, W9-17, XY10-3, CM6-1, SSP11-5, LL3-9, GH, YQ, and WTP15-4, with Rmax values of 0.37%, 0.72%, 1.08%, 1.15%, 1.40%, 1.75%, 1.80%, 1.99%, 2.55% and 3.93%, respectively. Overall, as the coal rank increases, the number of functional groups and peak positions decrease. In particular, the stretching vibration at 2800–3000 cm−1 of aliphatic structural functional groups became increasingly weaker. In sample WTP15-4, which has the highest coal rank, it almost disappeared. The 700–900 cm−1 region reflects the vibration of the adjacent H atoms outside the aromatic hydrocarbons (Colthup et al., 1990; Painter et al., 1985).
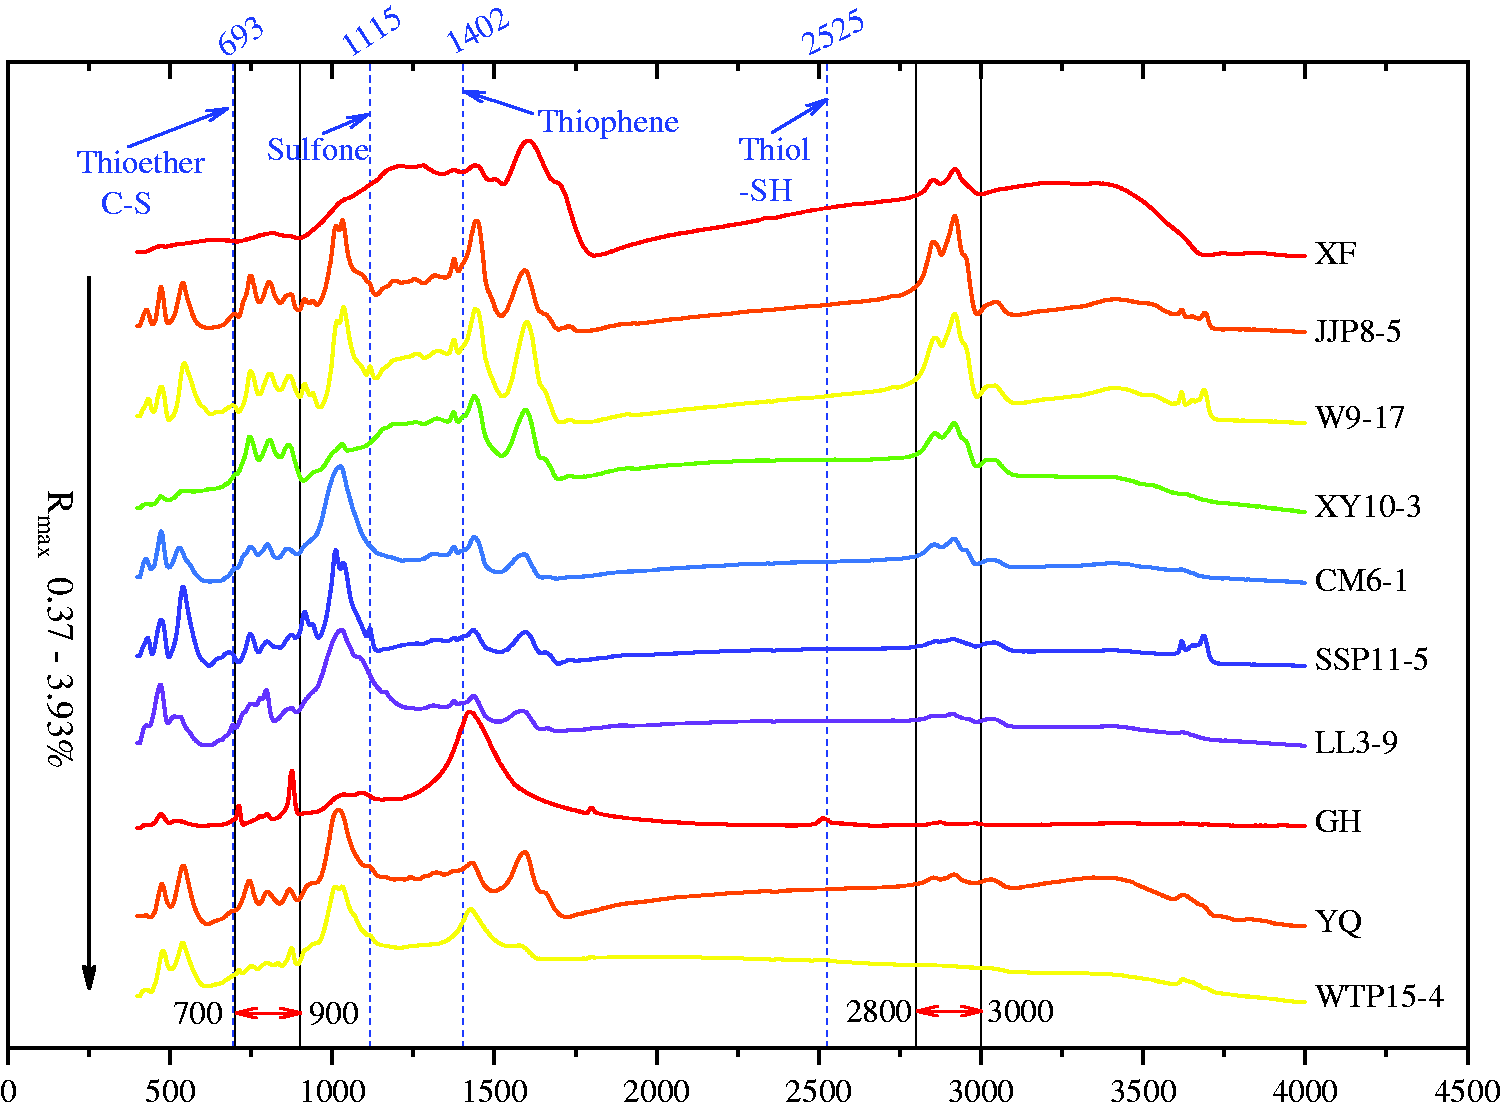
Comparison of FTIR spectra of coal samples.
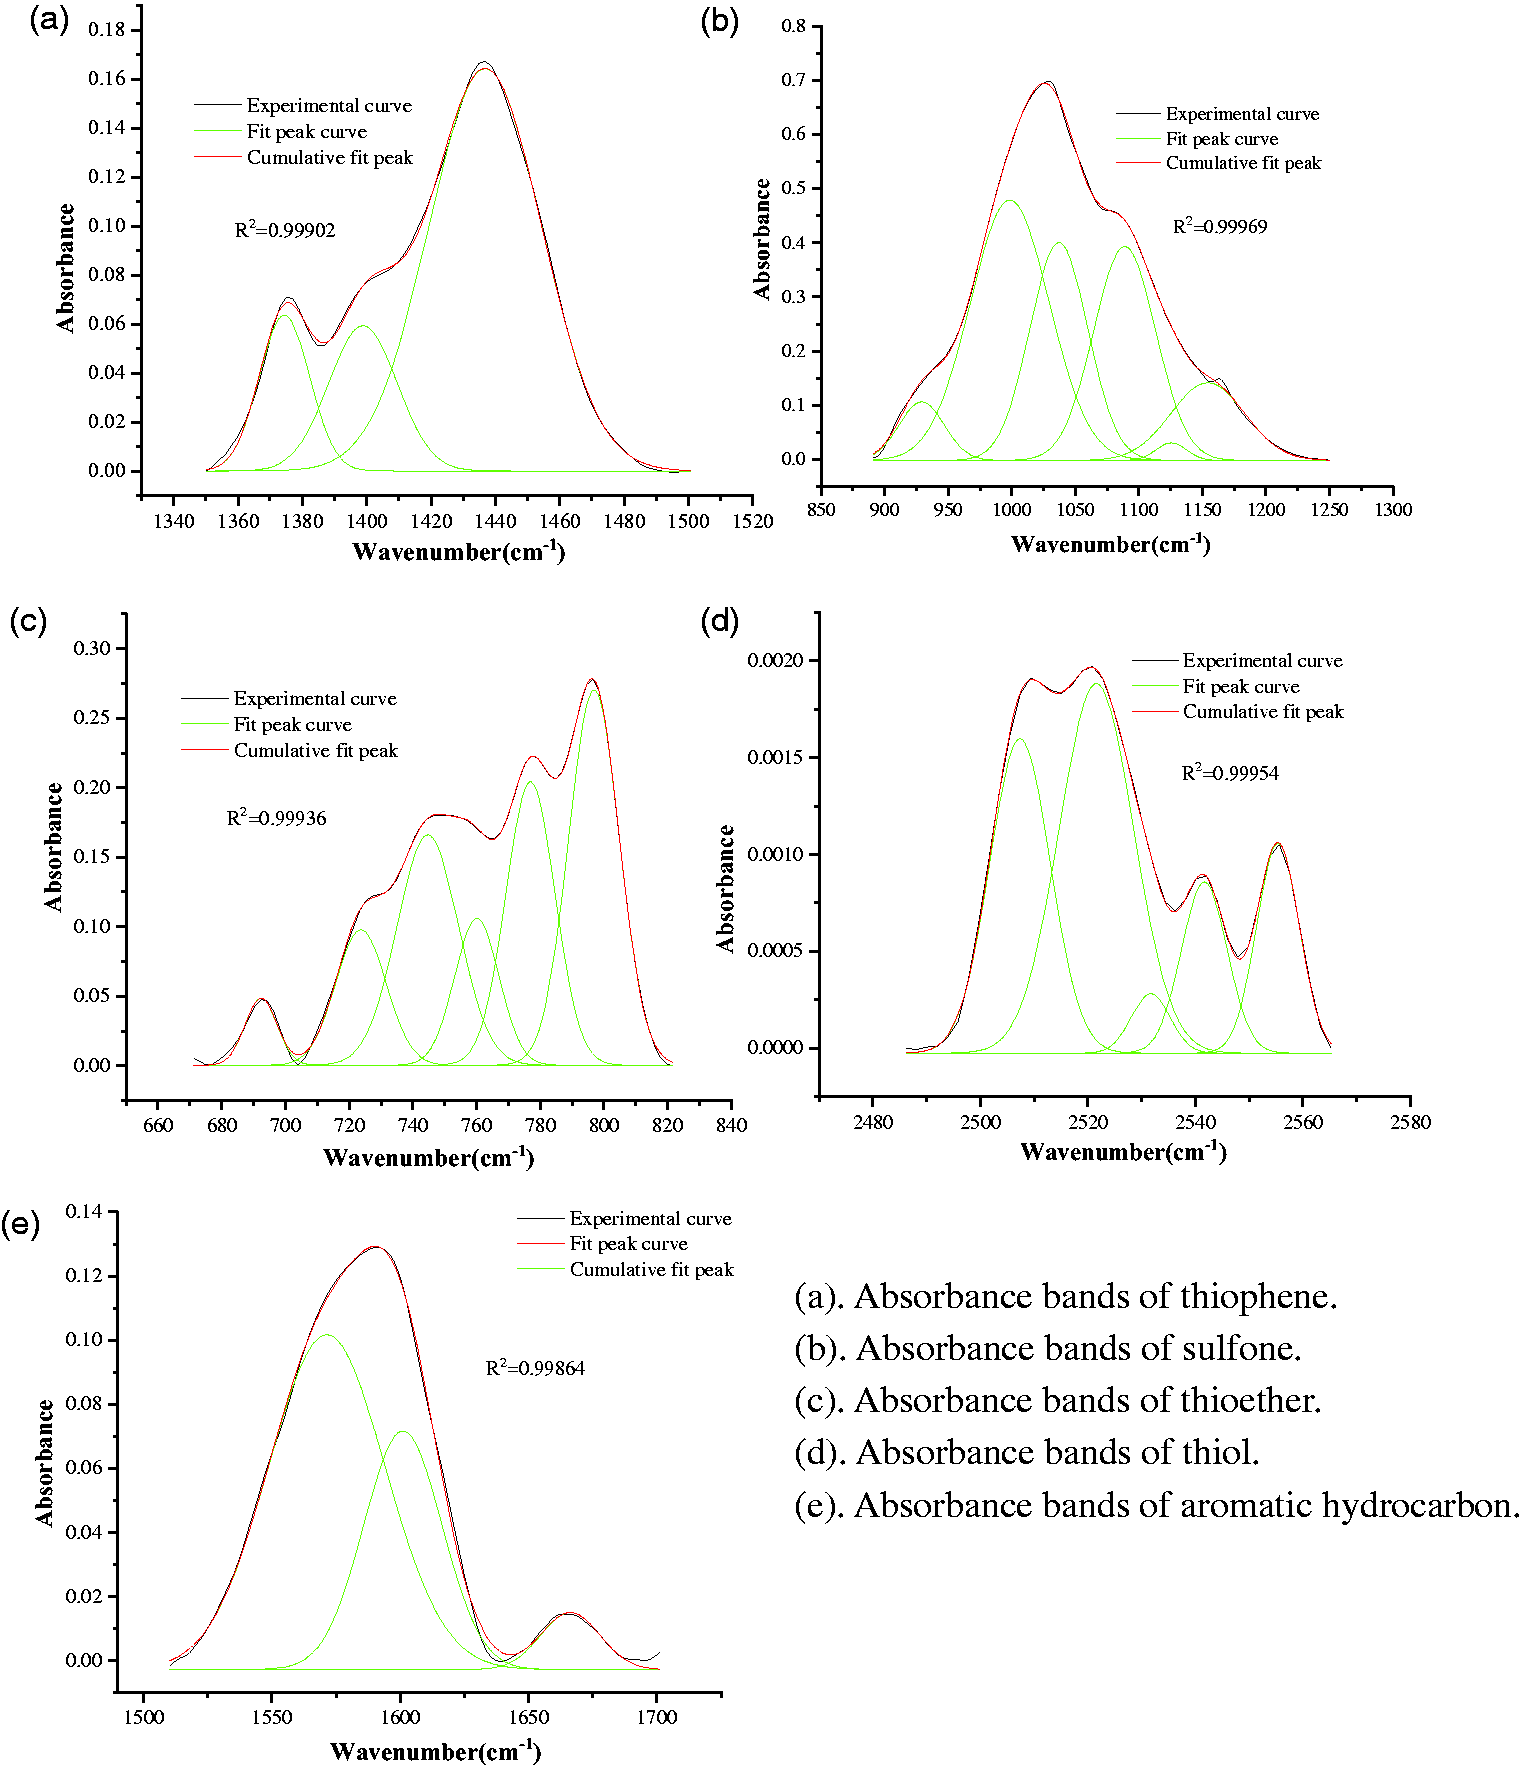
Curve-fitting FTIR spectrum of Sample LL3-9.
The relative vibrational strength of the 700–900 cm−1 region in the XF, JJP8-5,W9-17, XY10-3, CM6-1, SSP11-5, LL3-9 and YQ samples is increasing, which is consistent with previous studies (José et al., 1996; Kuehn et al., 1982; Mastalerz and Bustin, 1993) showing that as the coal rank increases, the degree of aromatization of coal is enhanced. The vibrational strength of the 700–900 cm−1 aromatic core functional group of GH and WTP15-4, the 4–5 adjacent H atoms at 750 cm−1 and the 3 adjacent hydrogen atoms at 810 cm−1 are weakened, whereas the relative intensity of vibration of 2 adjacent hydrogen atoms at 870 cm−1 is enhanced. This indicates that as the degree of coal rank increases, the coal tends to be graphitized and the simple aromatic hydrocarbons condense into polycyclic aromatic hydrocarbons, resulting in a decrease in the H atoms outside the aromatic ring (José et al., 1996; He et al., 2017). As shown in Figure 3, the GH main vibration peak is significantly different from the other samples, and the vibration peak is the strongest at 1300–1450 cm−1, which are the CH3 and CH2 asymmetric deformation vibrations of the alkyl chain structure. This is mainly due to the unusual coal-forming environment of the GH sample (Dai et al., 2008), which has the highest organic sulfur content among all samples and experienced strong biodegradation in the later coalification. The result is the conversion of high carbon number alkanes to low carbon numbers, leading to an increase in the proportion of vibration peaks at 1300–1450 cm−1 (Zhao et al., 2014).
Organic sulfur structure analysis
The FTIR spectrum of the organic sulfur structure in coal was analyzed by peak fitting. According to previous studies (Colthup et al., 1990; Kofranek et al., 1992; Li and Li, 1991; Nunziante et al., 1999; Quigley, 1996), the assignment of organic sulfur compound absorption peaks is listed in Table 5 and the absorption areas of curve-fitting FTIR spectrum of all samples are listed in Table 6. According to the results of previous studies (Guo et al., 1996; Mastalerz and Bustin, 1993), the ratios of the relative abundance of aromatic to aliphatic functional groups, I1=areas of (3000–3100)/areas of (2800–3000) and I2=areas of (700–900)/areas of (2800–3000), are used to indicate the aromaticity of coal. The greater the ratio, the greater the aromaticity of the coal. Thus, we calculate the area ratios as:


Frequency and assignment of organic functional groups in high organic sulfur coals (Colthup et al., 1990; Li and Li, 1991; Kofranek et al., 1992; Quigley, 1996; Nunziante et al., 1999).
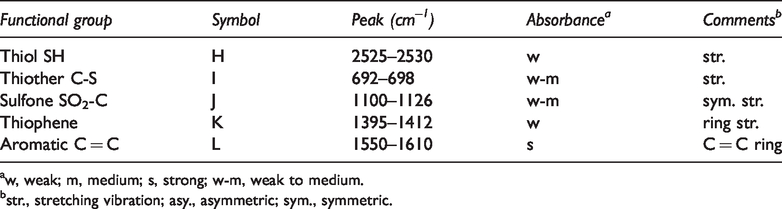
aw, weak; m, medium; s, strong; w-m, weak to medium.
bstr., stretching vibration; asy., asymmetric; sym., symmetric.
Absorption areas of curve-fitting FTIR spectrum of coal samples.*
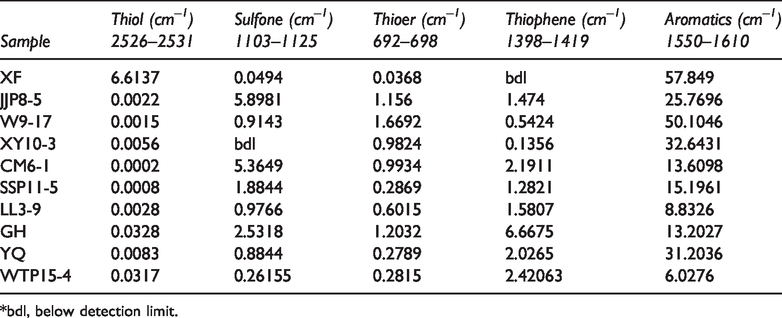
*bdl, below detection limit.
Using the A/B, A/C and B/C as the aromaticity parameters of organic sulfur in coal (see Table 7), we conducted a comprehensive analysis of the structural characteristics of organic sulfur in coal.
Organic sulfur structure parameters of the FTIR spectrum.
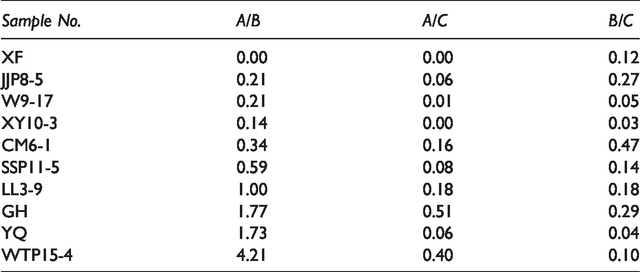
Figure 5(a) shows the trend of the FTIR aromatization parameter A/B of organic sulfur structure of high organic sulfur coals with ranks plus the WTP15-4 sample. In general, aromaticity of organic sulfur is increased with the increasing coal rank. It can be seen from Figure 5(a) that there are three stages, in the first stage (when Rm is between o.37% and 1.4%) the relative abundance of aromatic sulfur to aliphatic sulfur increases slowly with the coal rank increase; the second stage (when Rm is between 1.4% and 1.99%) the relative abundance of aromatic sulfur to aliphatic sulfur increases rapidly with the coal rank increase; the third stage (when Rm is between 1.99% and 3.93%) the relative abundance of aromatic sulfur increases slowly again. These results are similar to the previous studies on the aromaticity of carbon atoms in coal, with three distinct stages of evolution (He et al., 2017; Ouyang et al., 2016; Suggate, 1998). Taking all samples of different coal ranks into consideration, the polynomial trend line (R2=0.9586) obtained by fitting A/B with coal rank is also in line with the general laws of nature. When the sulfur content in coal is constant, with the increase of coal rank, the relative of aromatic sulfur increases and the abundance of aliphatic sulfur decreases. the relative abundance of aromatic sulfur to aliphatic sulfur will become larger and larger.
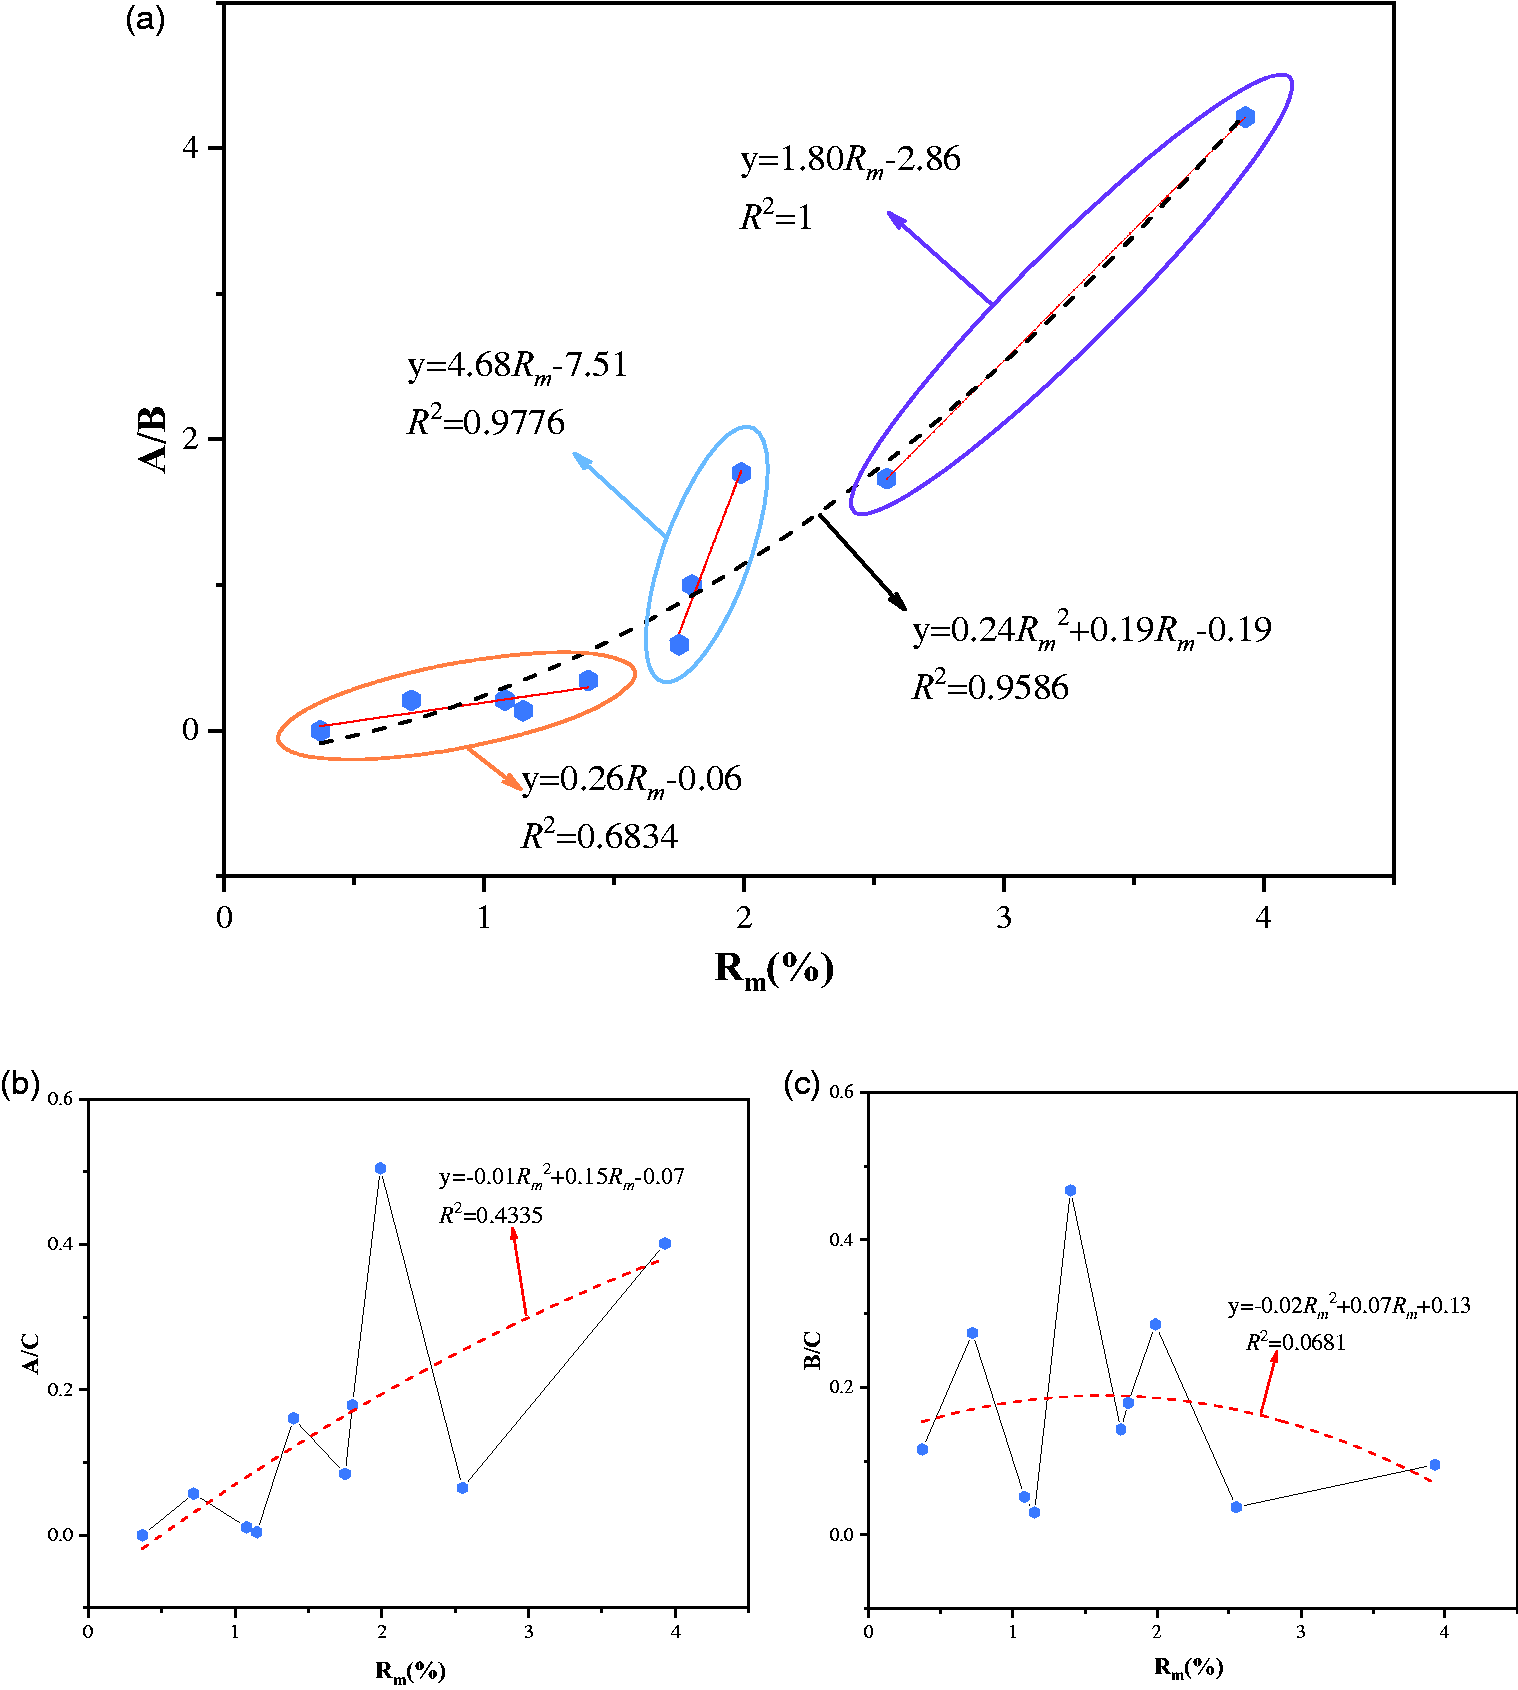
Correlation between organic sulfur structural parameters and Rm: (a) A/B (ratio of aromatic sulfur to aliphatic sulfur); (b) A/C (ratio of aromatic sulfur to aromatic C = C); (c) B/C (ratio of aliphatic sulfur to aromatic C = C).
Figure 5(b) shows the trend of FTIR aromatization parameters A/C of organic sulfur structure with different coal ranks in high organic sulfur coals. Over all, it can be seen in Figure 5(b) that the A/C values increase with the coal rank increase, but will not increase indefinitely. It will increase only to a certain critical value, and this critical value depends on the amount of organic sulfur content in coal. Figure 5(c) shows the trend of FTIR aromatization parameters B/C of organic sulfur structure with different coal ranks in high organic sulfur coals. In general, the B/C values decrease as the coal rank increase. There are two reasons for this result, one is with the coal rank increase, aliphatic sulfur changes into aromatic sulfur and the abundance of aliphatic sulfur decreases. Another reason is that with the coal rank increase, the abundance of aromatic C = C increase.
Above all, this also indicates that in the macromolecular structure of coal the organic sulfur compounds also follow the general rule of changing from chain to cyclic organic sulfur compounds as the degree of coal rank increases. Organic sulfur compounds structural evolution is unified with coal macromolecular structure that is with increasing coal metamorphism and increasing coal rank, aromatics increase and chain hydrocarbons and branches decrease.
Comprehensive analysis
It can be seen from Figure 6 there is a clear relationship between TPI, EID and organic sulfur aromatization parameters. Statistical analysis shows that the EID value and the B/C value show a good linear positive correlation where as TPI value and the B/C value show a good linear negative correlation under the condition that the hypothesis test is established (significance level α < 0.05), and there is no correlation between coal rank and GI. It shows that B/C has a correlation with TPI, EID and is not affected by the coal rank. The TPI and EID index is closely related to coal-forming environment. This shows that the structural characteristics of organic sulfur in coal are affected by the coal-forming environment in addition to the coal rank. Therefore, when studying the structural characteristics and trends of organic sulfur in coal, we should consider not only the coal rank but also the effect of the coal-forming environment on organic sulfur structure when the organic sulfur compounds forms.
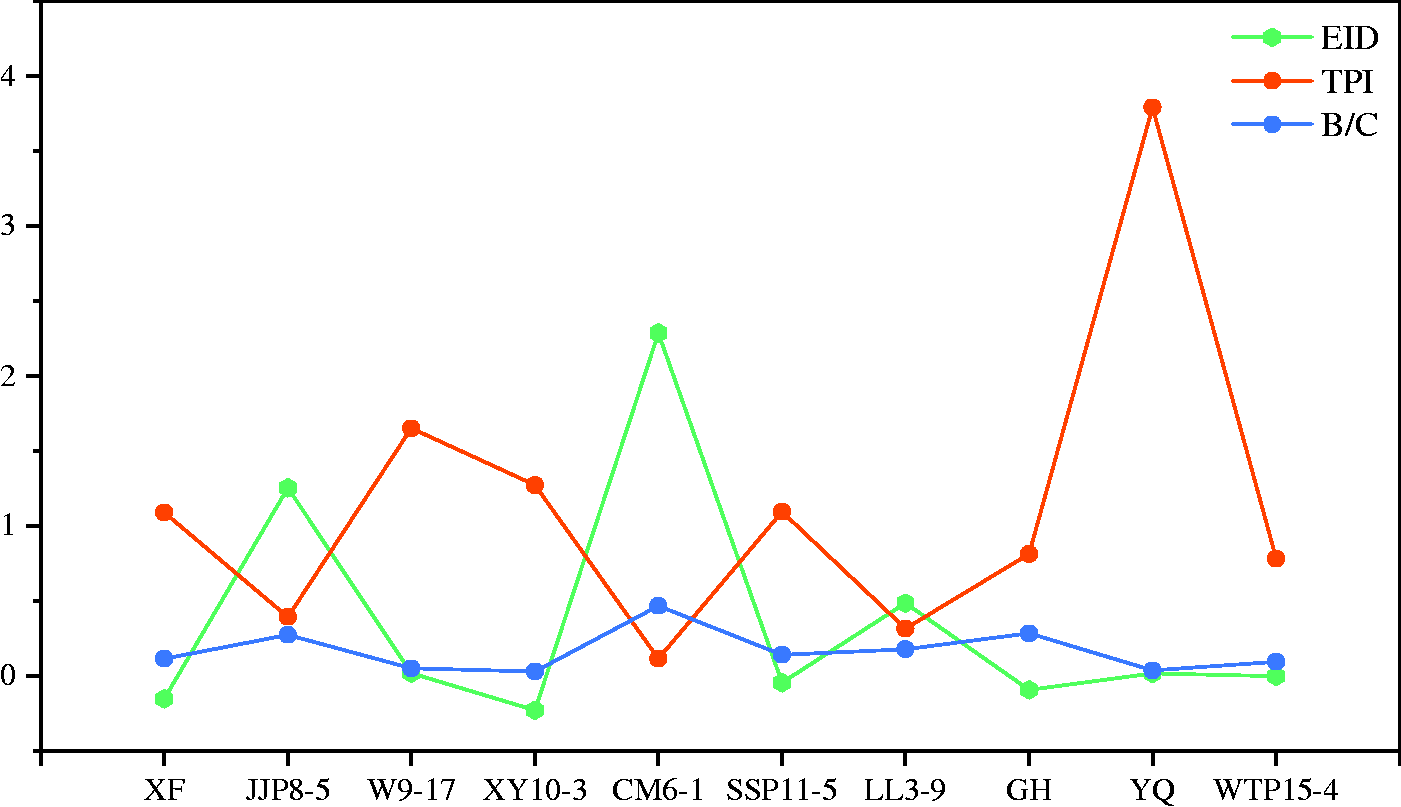
Diagram of EID, TPI and organic sulfur FTIR parameters B/C.
Conclusions
In summary, a series of high organic sulfur coals with different coal ranks was analyzed by petrology and FTIR. Coal petrological analysis shows coal macerals are predominantly vitrinaite and inertinite, some of the high-organic-sulfur coals with high GI values and low TPI values (CM6-1, XF), some of the high-organic-sulfur coals with high TPI values and low GI values (YQ). We suggest that some high organic sulfur coals (JJP8-5, LL3-9 and CM6-1) have experienced oxidation or intrusion of exotic waters in the early peat period. FTIR analysis shows the structural characteristics of organic sulfur in different coal ranks are different. over all, the aromaticity of organic sulfur increases with coal rank increase, but it divided into three stages (0.37%–1.40%, 1.40%–1.99% and 1.99%–3.93% of Rm). In addition to the influence of coal rank, the structural characteristics of organic sulfur in coal are also affected by the coal-forming environment. The impact of the coal-forming environment on the structure of organic sulfur is independent of coal rank. Therefore, not only is the coal rank important but also the coal formation environment must be considered when removing the organic sulfur from coal in the processing and utilization.
Highlights
CM6-1 with the highest GI and EID values (18.30 and 2.29 respectively), and the lowest TPI values (0.12). The evolution of organic sulfur structure divided into three stages (0.37%–1.40%, 1.40%–1.99% and 1.99%–3.93% of Rm). The impact of the coal-forming environment on the structure of organic sulfur is independent and significant.
Footnotes
Declaration of conflicting interests
The author(s) declared no potential conflicts of interest with respect to the research, authorship, and/or publication of this article.
Funding
The author(s) disclosed receipt of the following financial support for the research, authorship, and/or publication of this article: This work was financially supported by the National Key Basic Research and Development Program “973” Project of China (Grant No. 2012CB214901), and the National Natural Science Foundation of China (Grant No. 41872175 and 41172146/D0208).