
Abstract
The energy reserves of hot dry rock resources are huge, thus a model to predict engineering production for efficient and stable development and utilization is sought. Based on the geological characteristics of dry rock resources in Guide Basin, Qinghai Province, China, the fully coupled wellbore–reservoir simulator—T2Well—is used to model a production system using water as a heat transfer medium and simulate the system’s operation to analyze the influence of different injection rates on heat extraction. In later production stages, output temperature and reservoir pressure decrease by 10–30°C and 0.5–30 MPa, depending on injection rate; this occurs earlier and to a greater extent at higher injection rates; thermal breakthrough also occurs earlier (7–10 years). The heat extraction rate is 1–20 MW and the cumulative heat extracted is 2.1–24.2 × 10⁵ J. Lower injection rates result in relatively low heat extraction rates. For maximum economic benefit, an injection rate of 50–75 kg/s is ideal.
Keywords
Introduction
An enhanced geothermal system (EGS) is proposed on the basis of hot dry rock (HDR) mining technology, which extracts deep thermal energy from low-permeability rock. Its operation involves a series of thermal–hydrodynamic–mechanical coupling processes. Numerical simulation can be used to study the EGS exploitation potential on a large time scale, while at the same time understanding the migration of underground hot water, which can be done using a small amount of manpower and material resources. Although EGSs have been studied for 40 years, the focus is still in on reservoir modification, and commercial exploitation is still a long way in the future. Therefore, most research on EGS is limited to the theoretical analysis stage.
Sanyal and Butler (2005) used a numerical model to analyze the impact of different factors on heat extraction efficiency: fracture spacing, permeability, injector-producer spacing, and stimulation volume. Pashkevich and Taskin (2009) analyzed the influence on thermal extraction rate of different well velocity reservoir permeability injection wells and pressure differential well spacing between production wells, based on the Muashtnovsky volcanic site data. Based on the data from Desert Peak ground DP23-1 Zeng et al. (2013a) and Zeng et al. (2013b) used the numerical simulator TOUGH2 to analyze the development potential of geothermal energy in horizontal and vertical wells, and conducted a series of parameter sensitivity analyses under the condition of injection–exploitation showing that production rate, reservoir permeability and injected water temperature had important effects on geothermal resource development. They also analyzed the geothermal potential of China’s Yangzi well in the same way (Zeng et al., 2014). Lei et al. (2014) referenced American Desert Peak, based on the geological data of Songliao Basin, to establish a hydraulic fracturing model, simulate the thermo-hydrodynamic coupling process, and study the effect on heat extraction rate of injection rate, injection temperature well spacing, heat reservoir permeability, and wellbore diameter.
The target area of HDR in North-Central Gonghe Basin in Qinghai province was chosen in 2011, now many domestic experts and scholars have conducted a lot of research on it (Fang et al. 2009, Xue et al. 2013, Yan et al. 2013). In 2013, the ZR1 hole in the deep well was drilled in Zhacanggou. The final hole depth was 3050 m, and the measured temperature was 148.9°C. Li (2016) studied the heat source infiltration channel of the Zhacanggou hot spring, and discussed its genesis mechanism, development, and utilization prospects via remote sensing interpretation and analysis of thermal spring water chemical characteristics. Wang et al. (2015) predicted the temperature and depth of HDR thermal storage in the Gonghe–Guide Basin, predicted that the temperature would be less than 150°C at 3000 m deep, and that a higher temperature could be obtained at a depth of 4300 m. Yue et al. (2015) researched the temporal and spatial distribution of the temperature and pressure fields of an EGS in Gonghe Basin, and analyzed the influence of injection temperature and flow rate on heat extraction rate. However, the coupling model of wellbore flow and reservoir flow and the optimization of system operation were not extensive enough.
This study was based on the deep geological conditions at Zhacanggou in Gonghe Basin. It established a wellbore flow-reservoir flow coupling numerical model and used T2Well to research the temporal and spatial distribution of the flow field, temperature field, and pressure field, then analyzed the influence of injection rate on heat extraction rate and system sustainability.
Setting up the model
Geological conditions for thermal reservoirs
The Zhacanggou is a valley in a low mountainous region at the southwestern edge of the Guide Basin, which is in the transitional zone between the Loess Plateau and the Qinghai–Tibet Plateau (Figure 1). Thermal water, controlled by a tectonic fracture, flows out at the intersection of the northwest rupture and northeast distorted rupture. Water temperature ranges from 63°C to 93°C. The base of the Basin is composed of Triassic strata ancient and Indo-Chinese epoch granite, and the overlying 1400- to 1700-m thick sediments are dominated by Meso-Cenozoic strata, supporting geothermal water with nice reservoirs. According to data from the DR1 well, located in the Gonghe Basin, the granite body below 2800 m is complete. The temperature in the borehole shows positive correlation with depth, and reaches 151.34°C below 3050 m (Figure 2) (Report from Environmental and Geological Exploration Bureau of Qinghai Province).
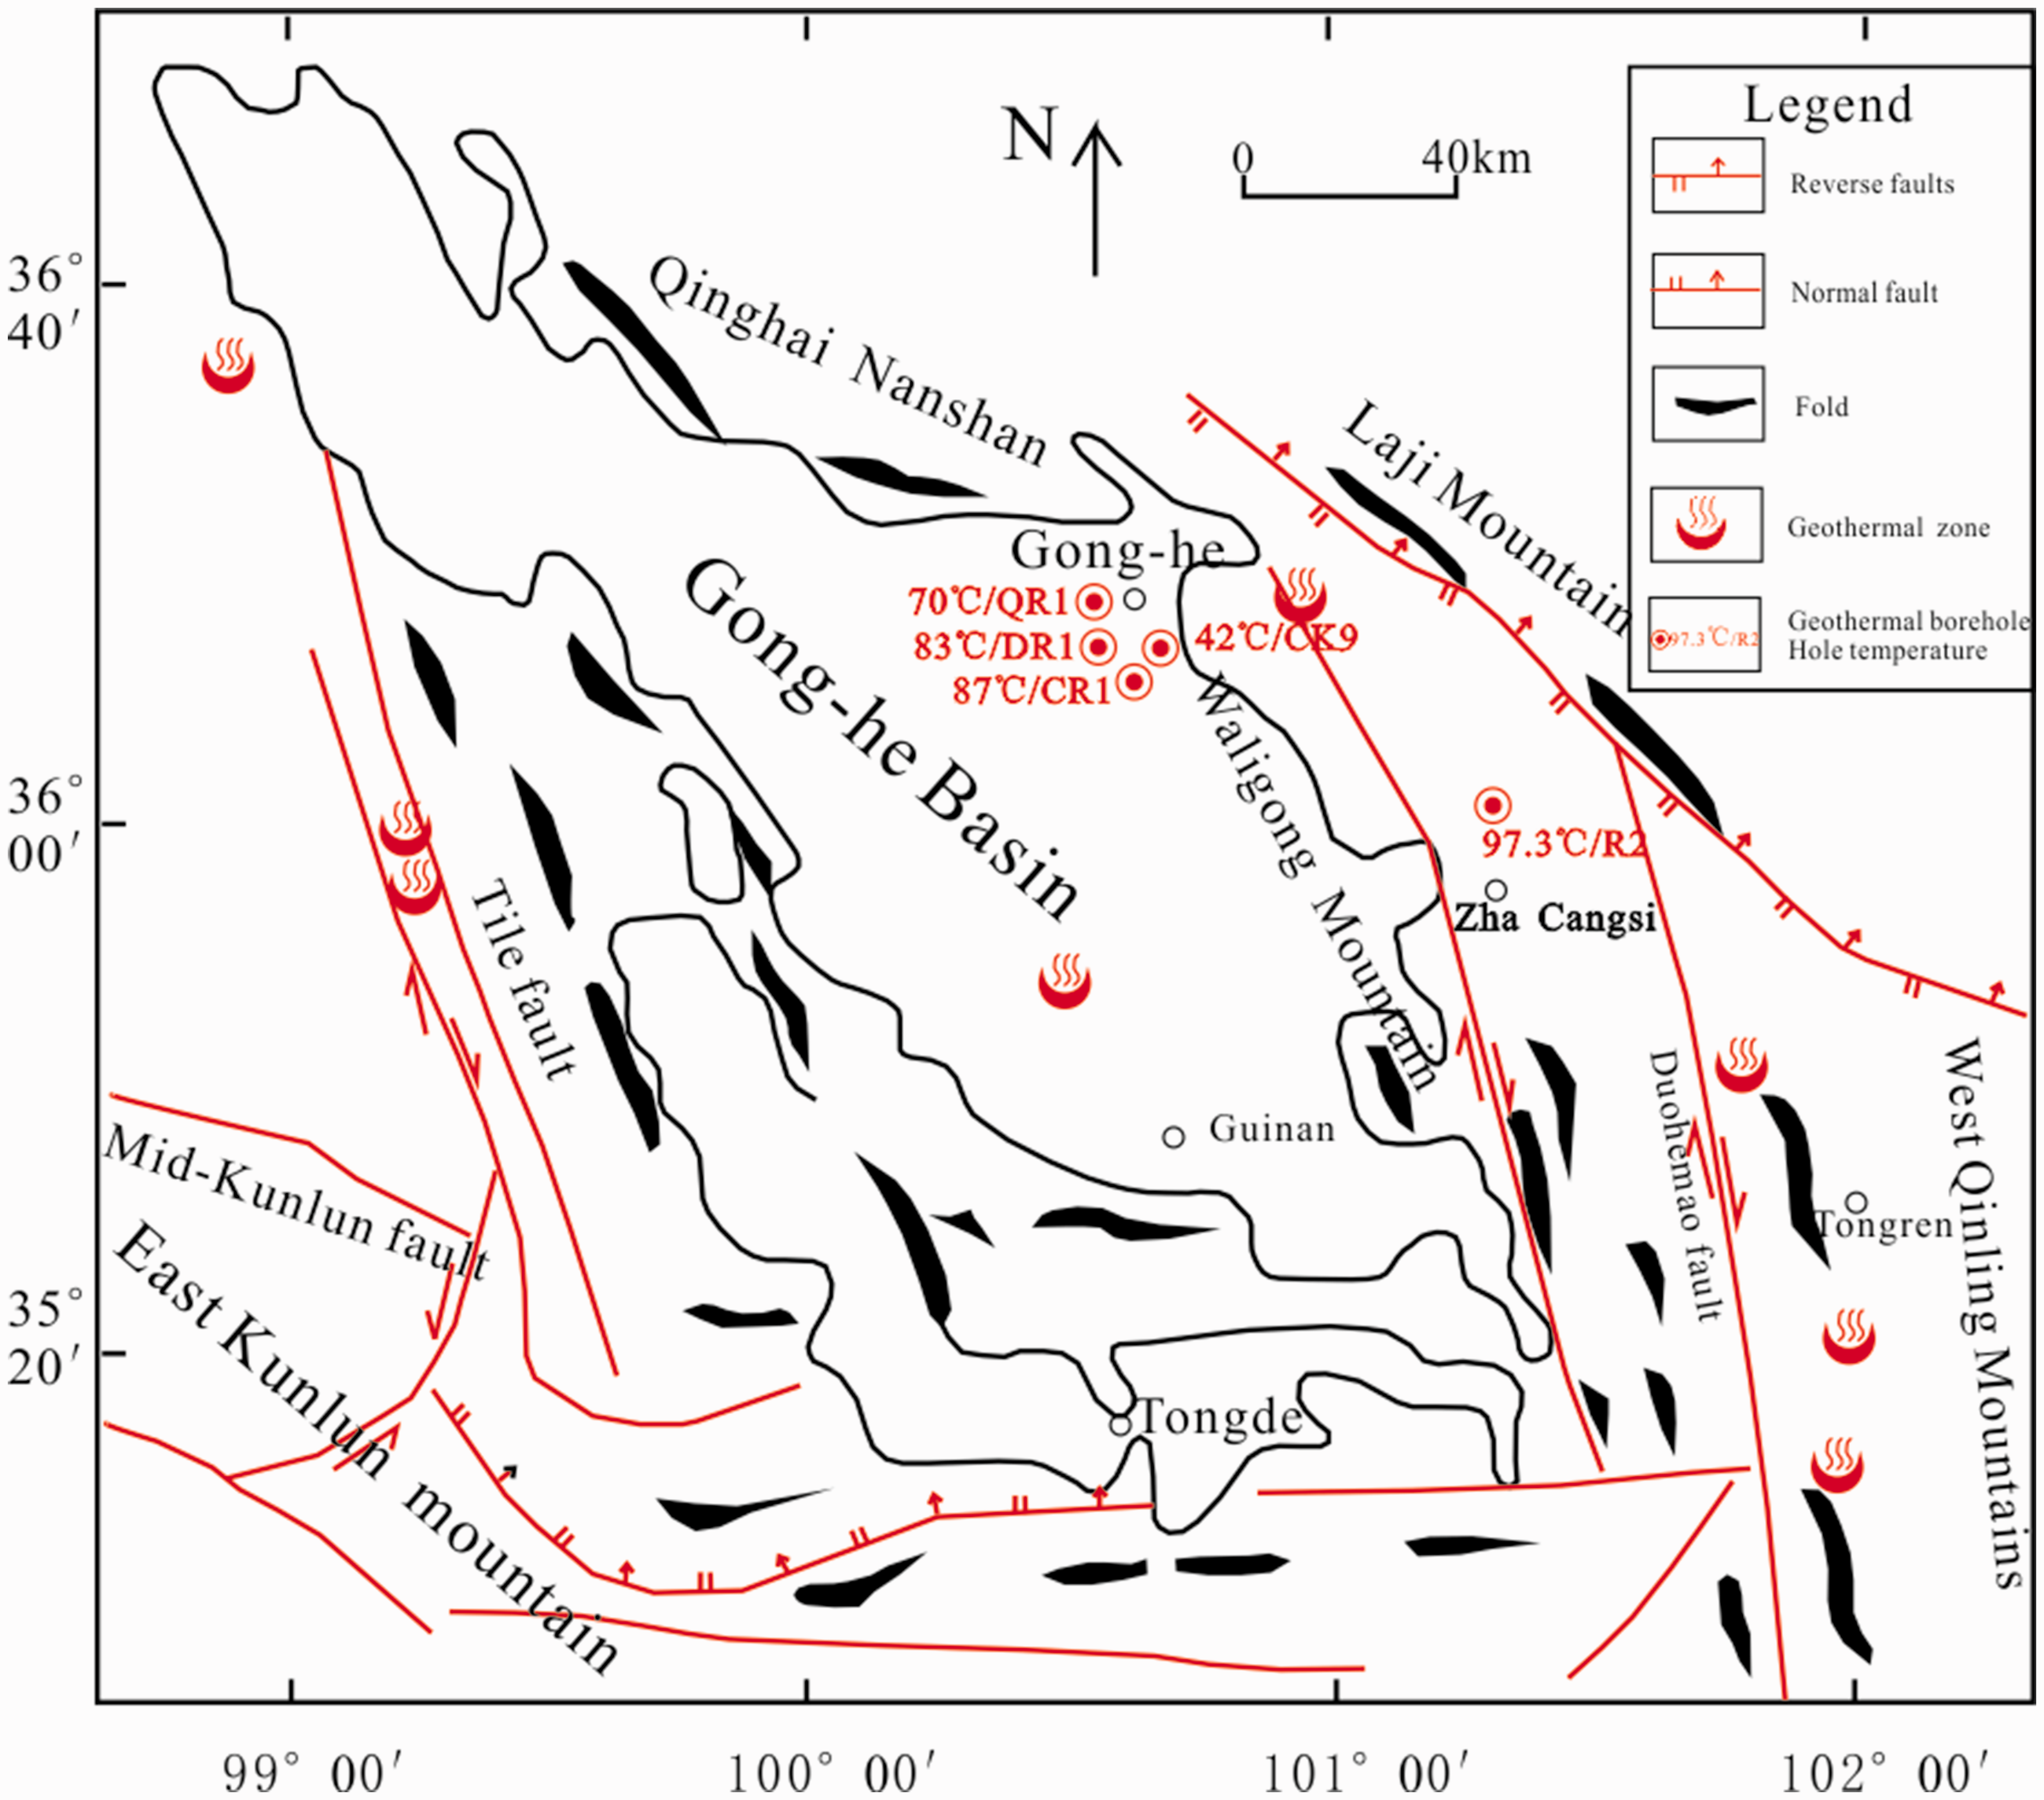
The structure and the geothermal distribution of the study area.
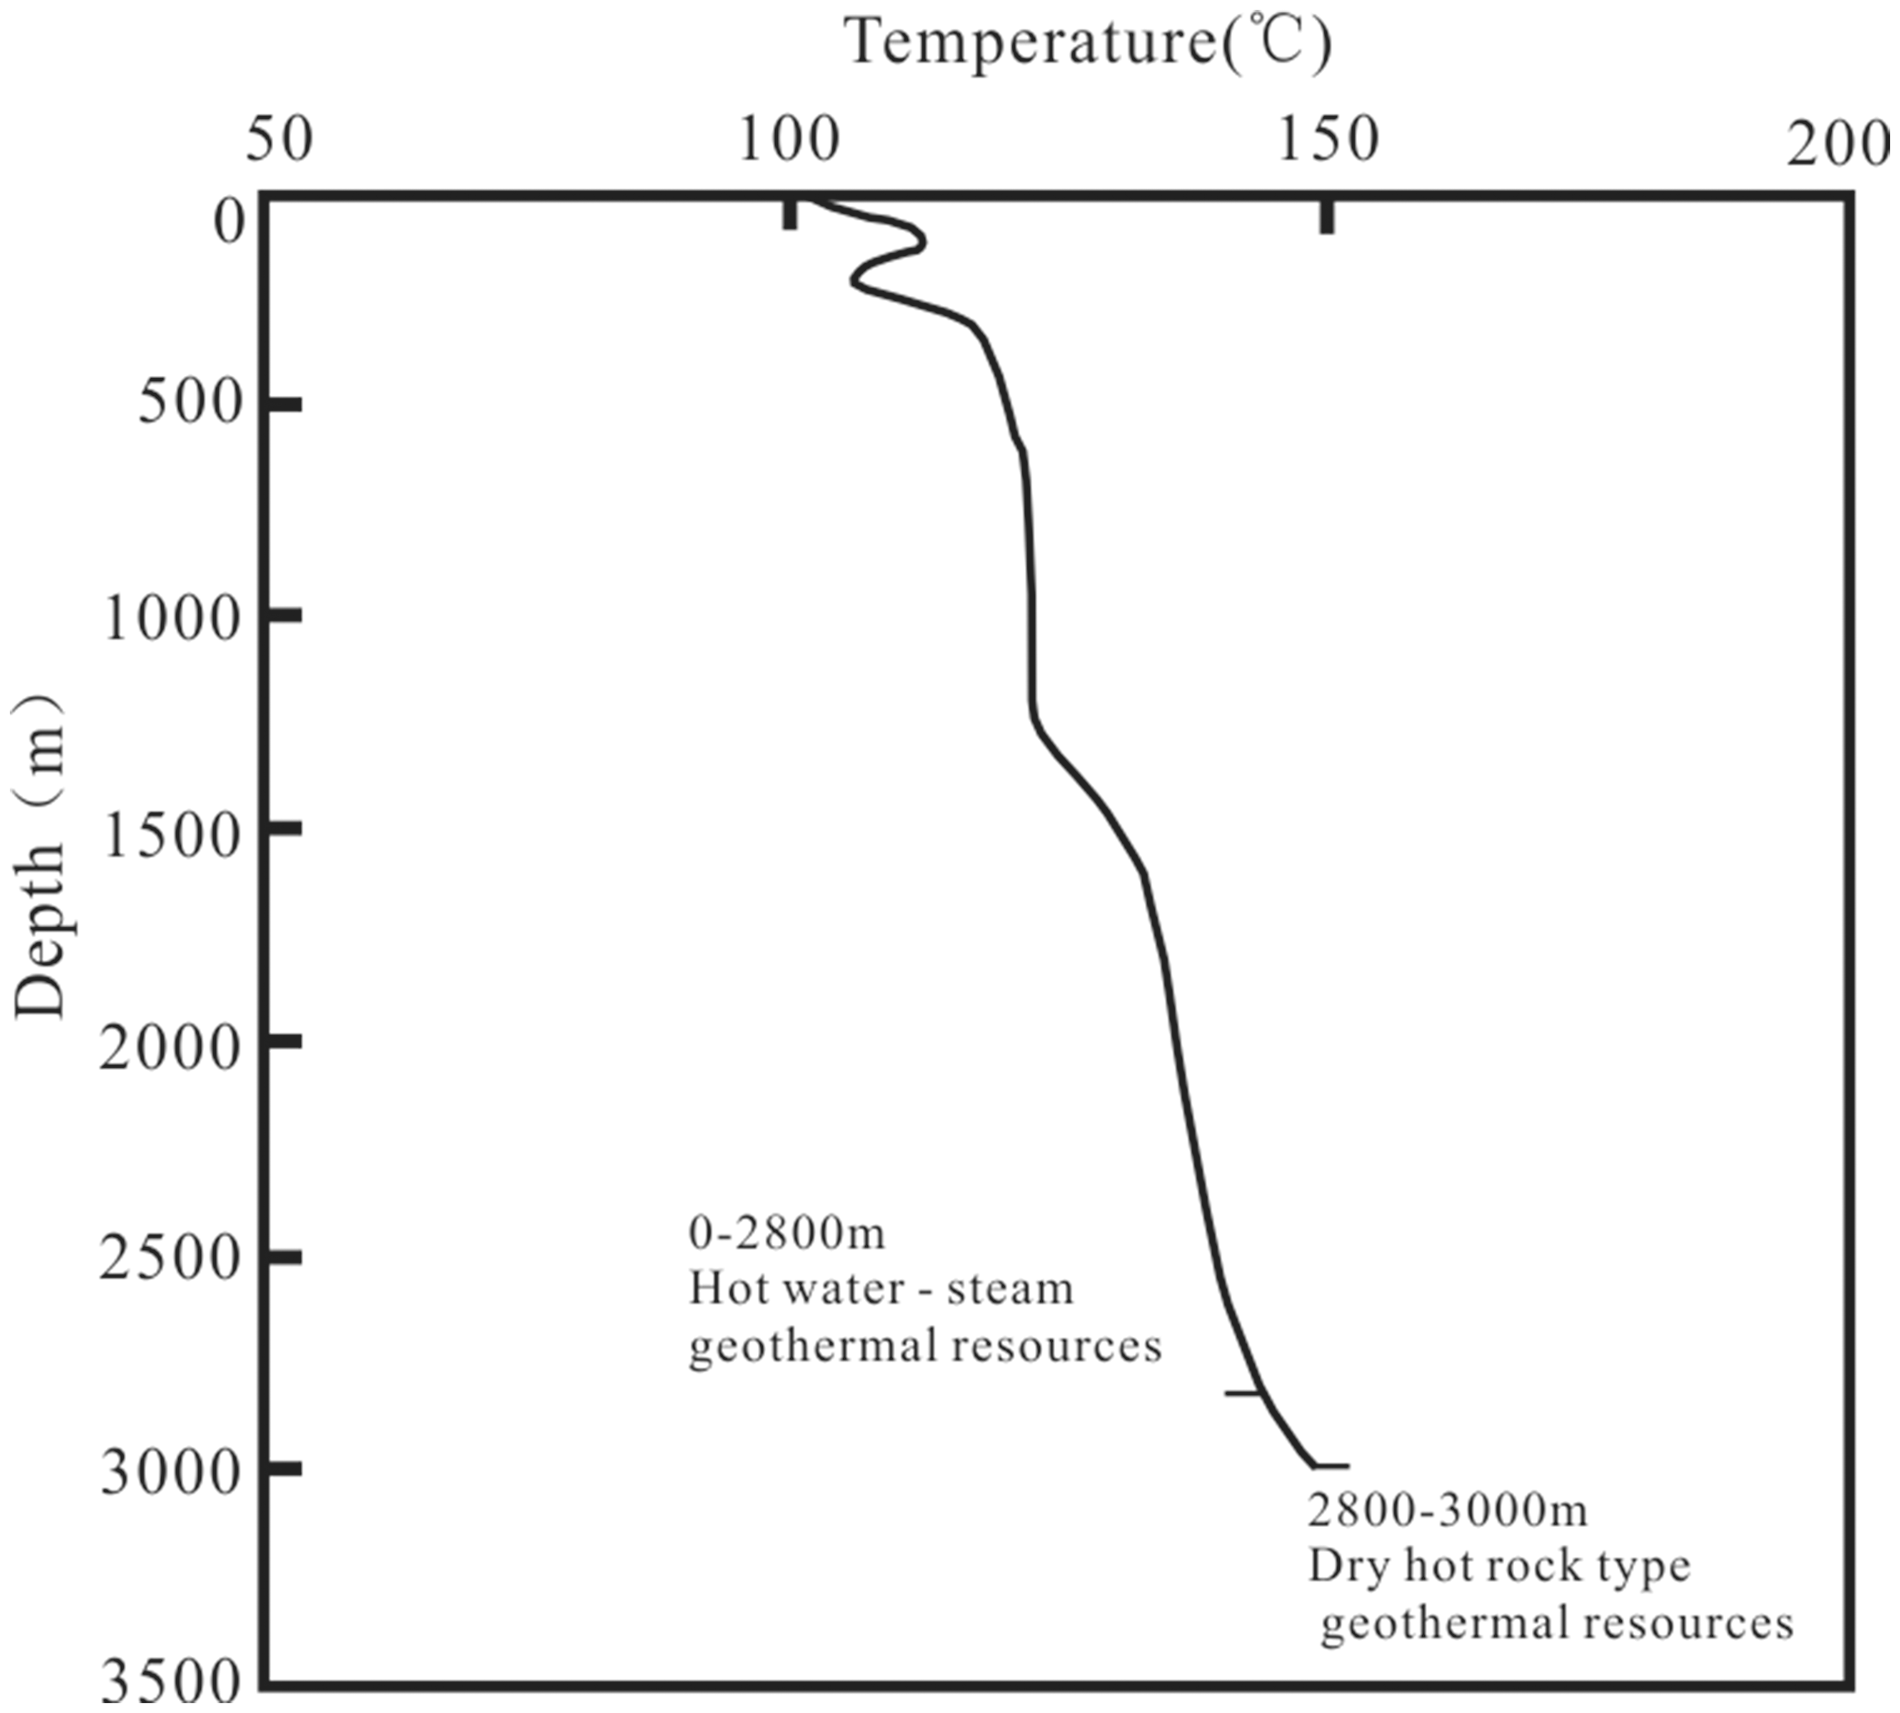
Hot dry rock DR1 well temperature measurements.
To meet the requirement of H2O–EGS, it is necessary to improve permeability and porosity of the reservoir by setting up fracking rock bodies to build an artificial flowing channel. In this paper, the “reconstructed reservoir” is used as the reservoir of artificial geothermal target.
Setting up the model
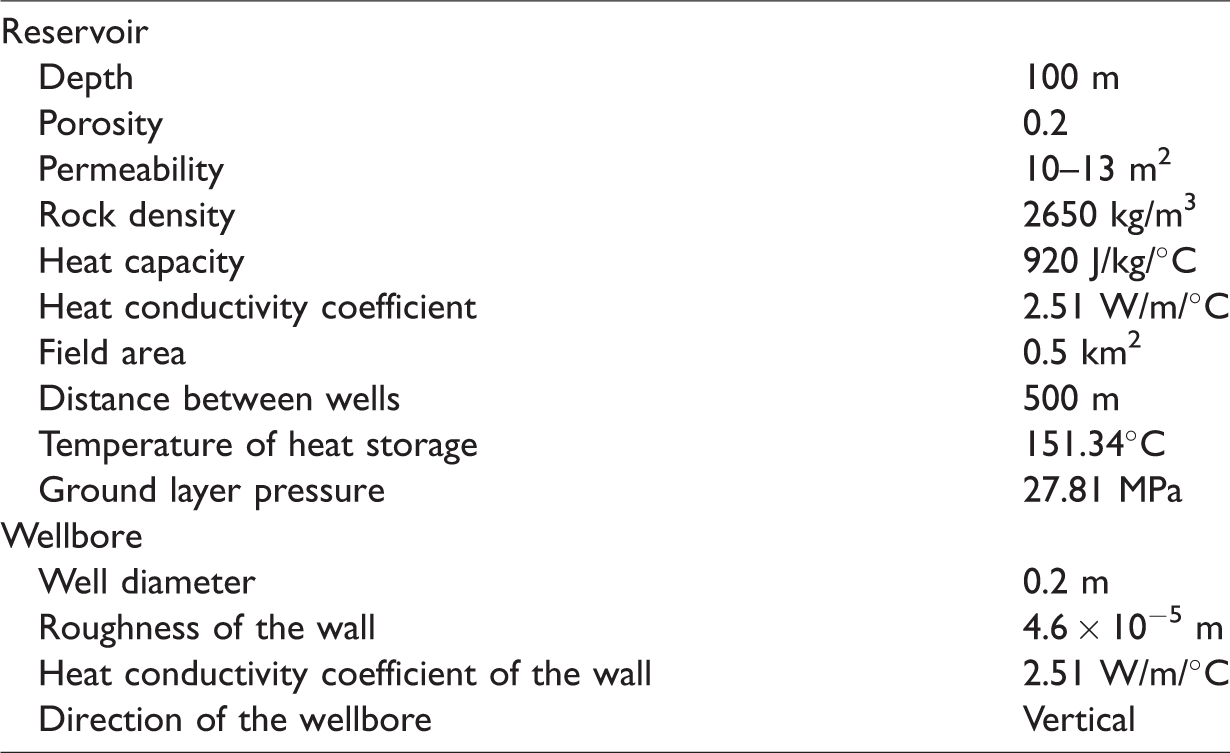
Based on actual parameters in the study area (Table 1) and on HDR development projects in the USA and Japan, three wells were set up along the ravine in a 1 km2 area. The injected well is in the middle, with production wells 500 m on both sides (Figure 3). This paper assumed that the geothermal reservoir was an ideal porous media layer with thickness up to 100 m. The initial reservoir pressure was hydrostatic pressure (27.81 MPa), and the initial temperature was 151.3°C (as shown in Tables 1 and 2). During the computation, the lateral boundary was treated as a waterproof and thermal-proof border, and the roof and floor of the reservoir were treated as waterproof and thermal-conductive borders. Flow in the wellbore was one-dimensional and stable, and heat transfer with surrounding rock was the same for the roof and floor of the reservoir. Due to the symmetry of the region, one quarter of the region (injection and productivity for a quarter), was simulated and analyzed. The heat flow calculation was done according to Vinsome and Westerveld (1980).
Geological traits and initial conditions of the model.
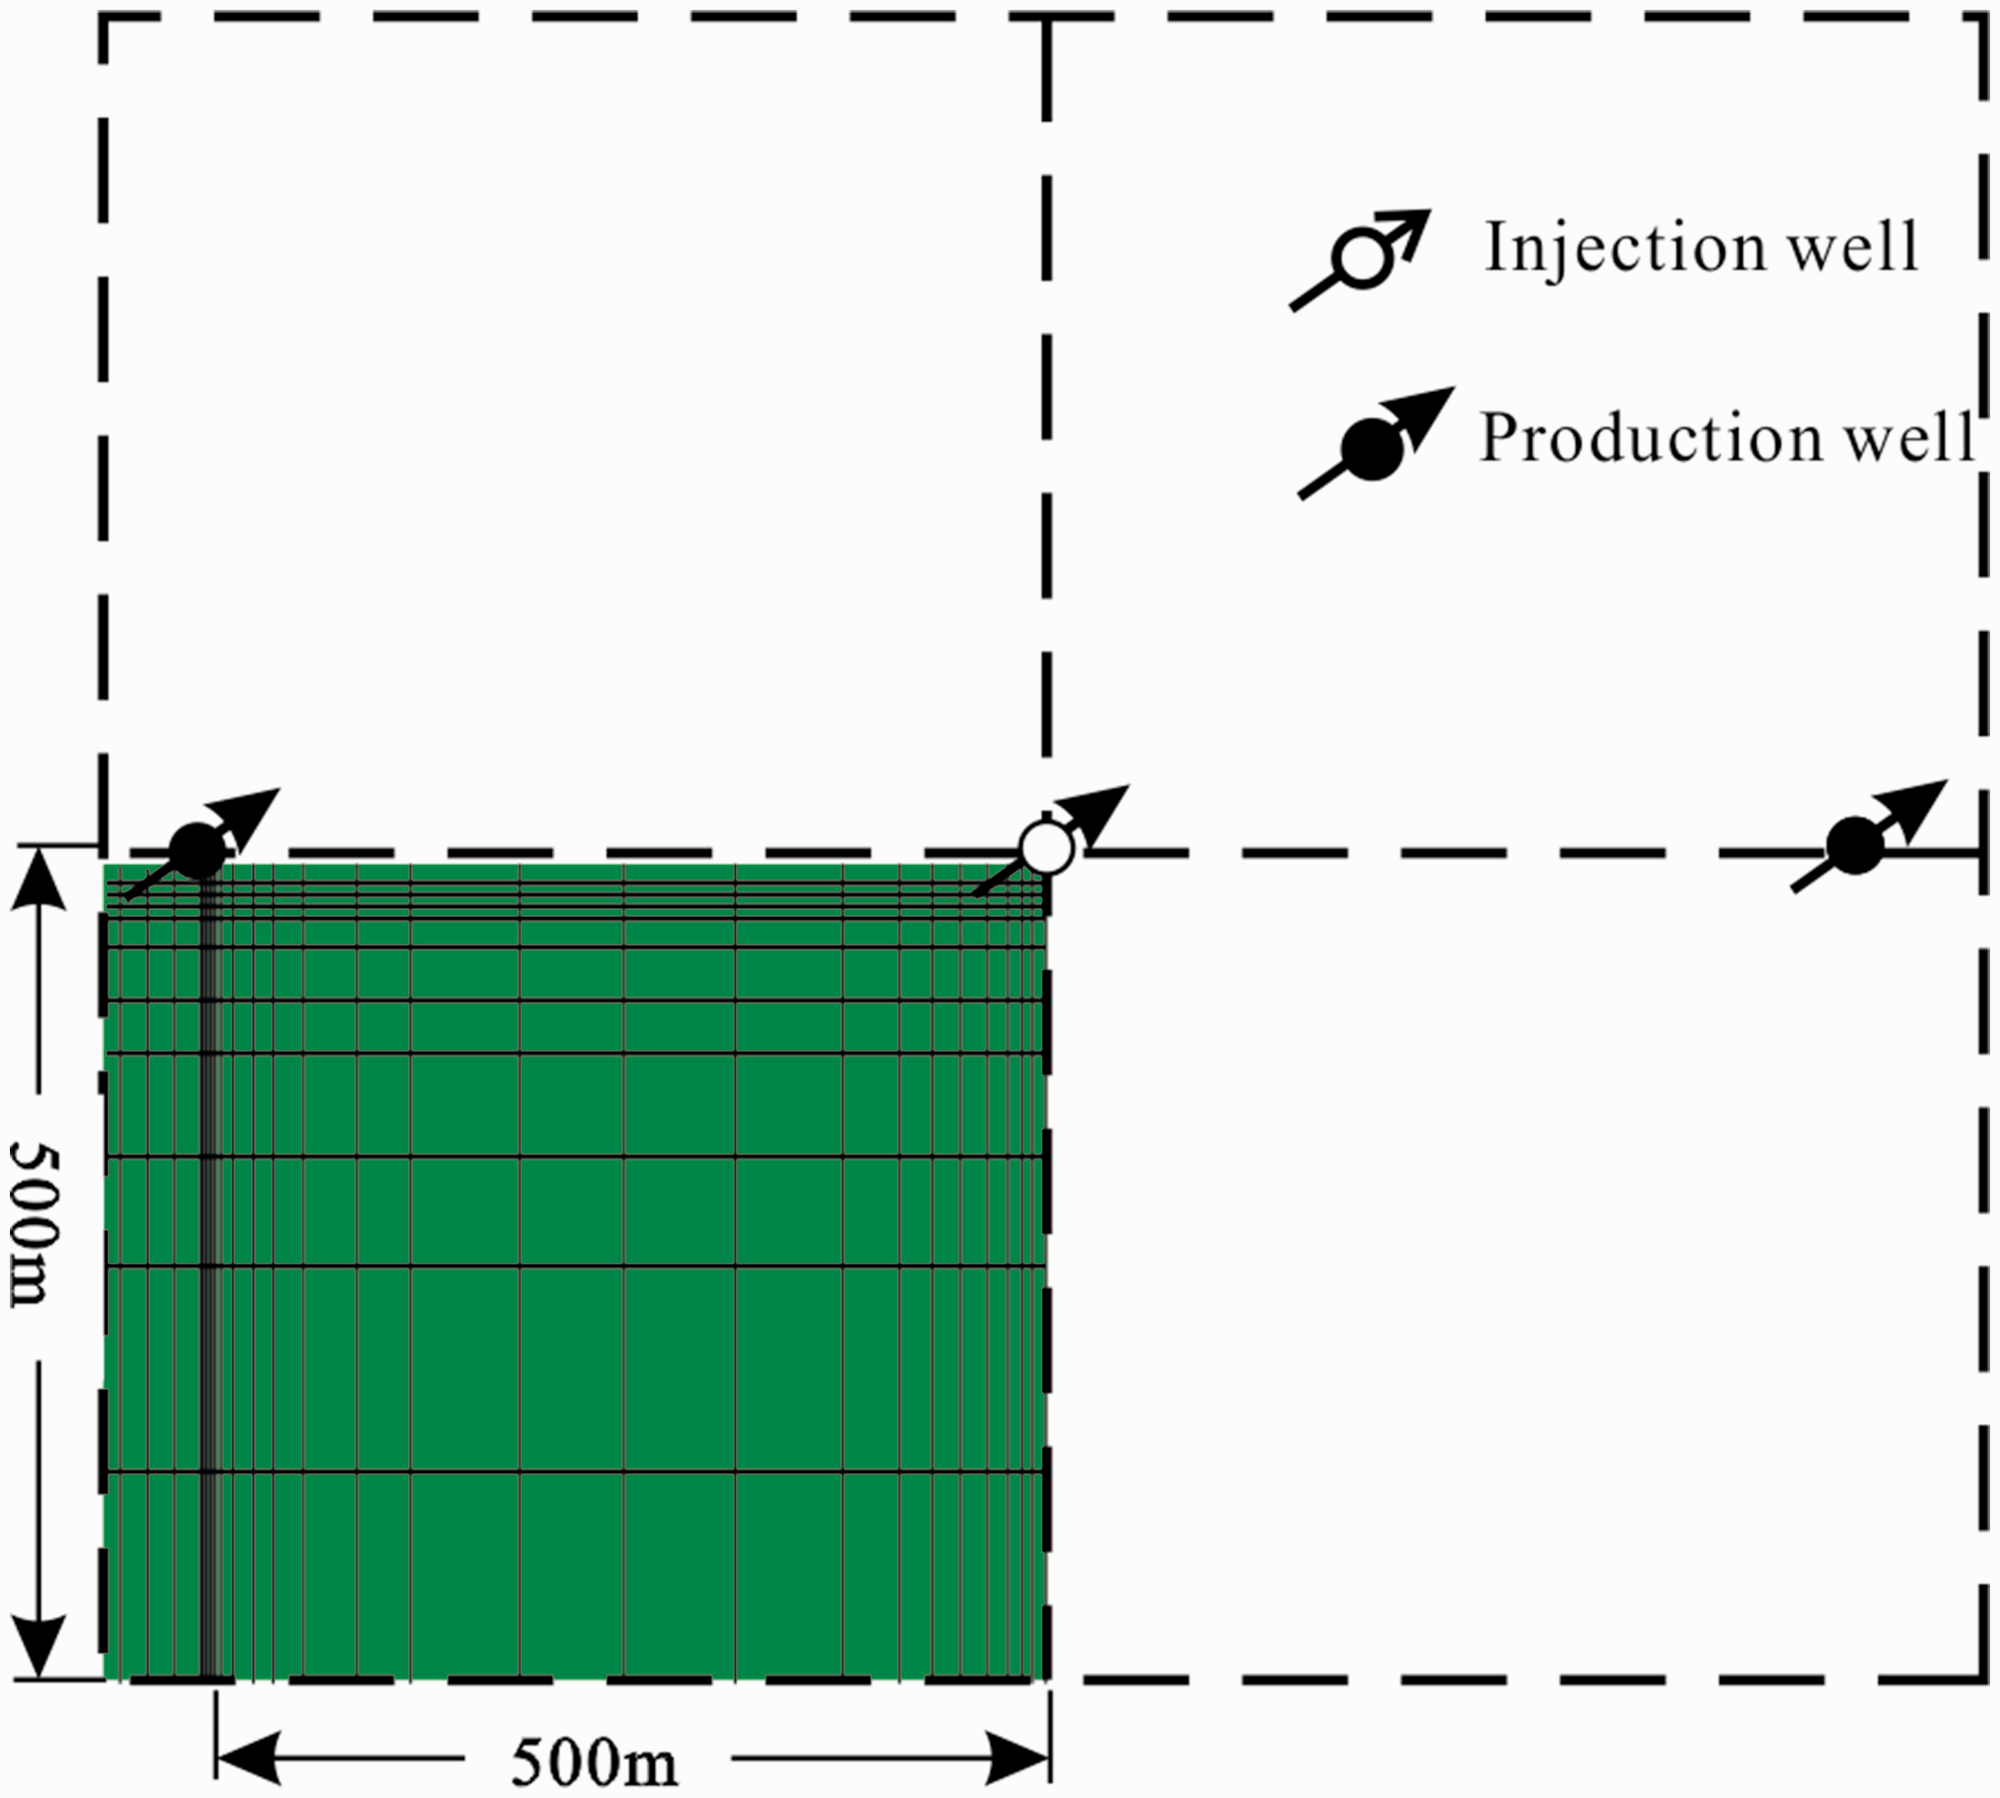
Simulation model configuration.
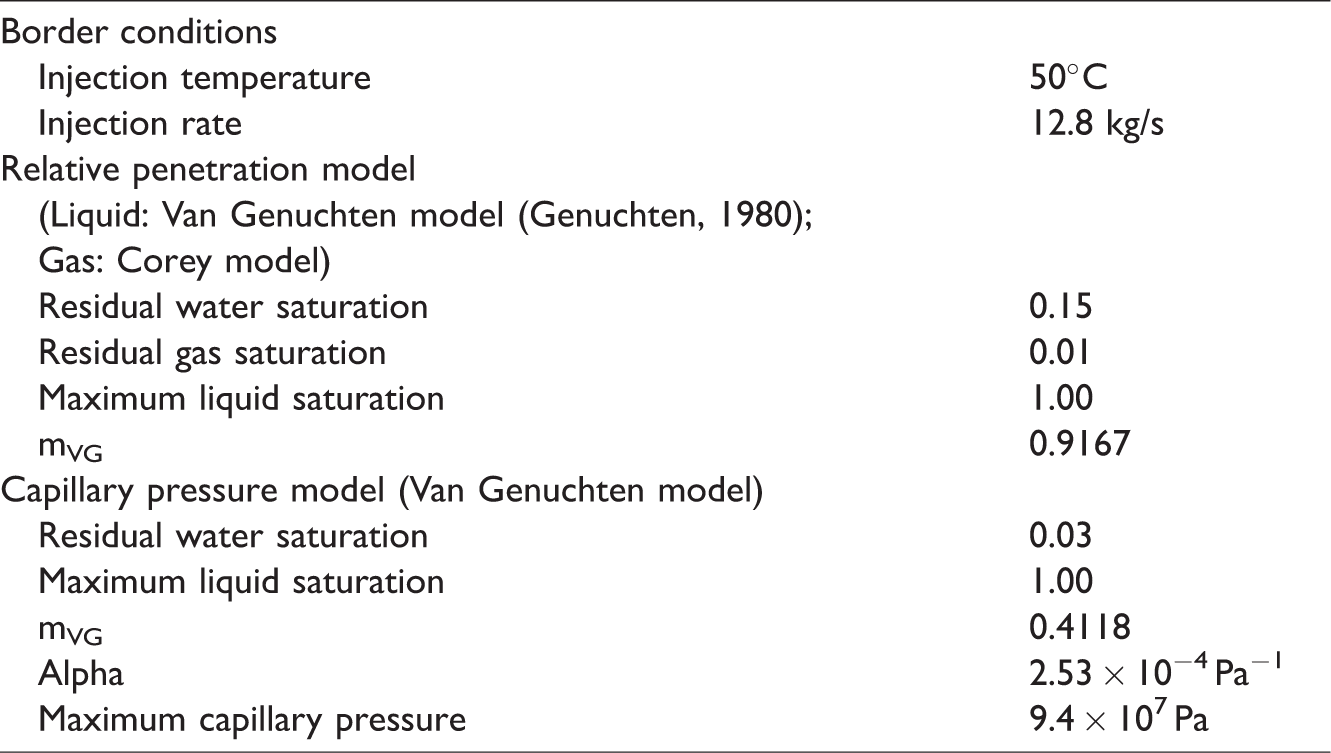
Model border conditions and relative penetration and capillary pressure parameters.
An irregular two-dimensional model was set up to represent the reservoir. To capture the changes of the flow field in the reservoir accurately, the grid size ranged from 0.1 m near the wellbore to 50 m far from the wellbore. A one-dimensional vertical model was set up to represent the wellbore, with 30 grids from the bottom to the ground, each 100 m high, with the lowest grid embedded in the reservoir. Because this paper focuses on the influence of different injection rates on heat extraction system and reservoir life, 50°C was used for injection temperature, and five injection rates were simulated (5, 25, 50, 75, 100 kg/s).
Simulation method
TOUGH2 is non-isothermal multiphase multicomponent simulation software published by Pruess et al. (1999). It is often used to simulate hydrothermal coupling in one-, two-, and three-dimensional pore and fissure mediums. We used a fully coupled wellbore–reservoir simulator, T2Well (Pan et al., 2009, 2011; Pan and Oldenburg, 2014; Pruess, 2006, 2008), which is based on TOUGH2, and used the ECO2N state equation, to simulate the multiphase flow of hot water.
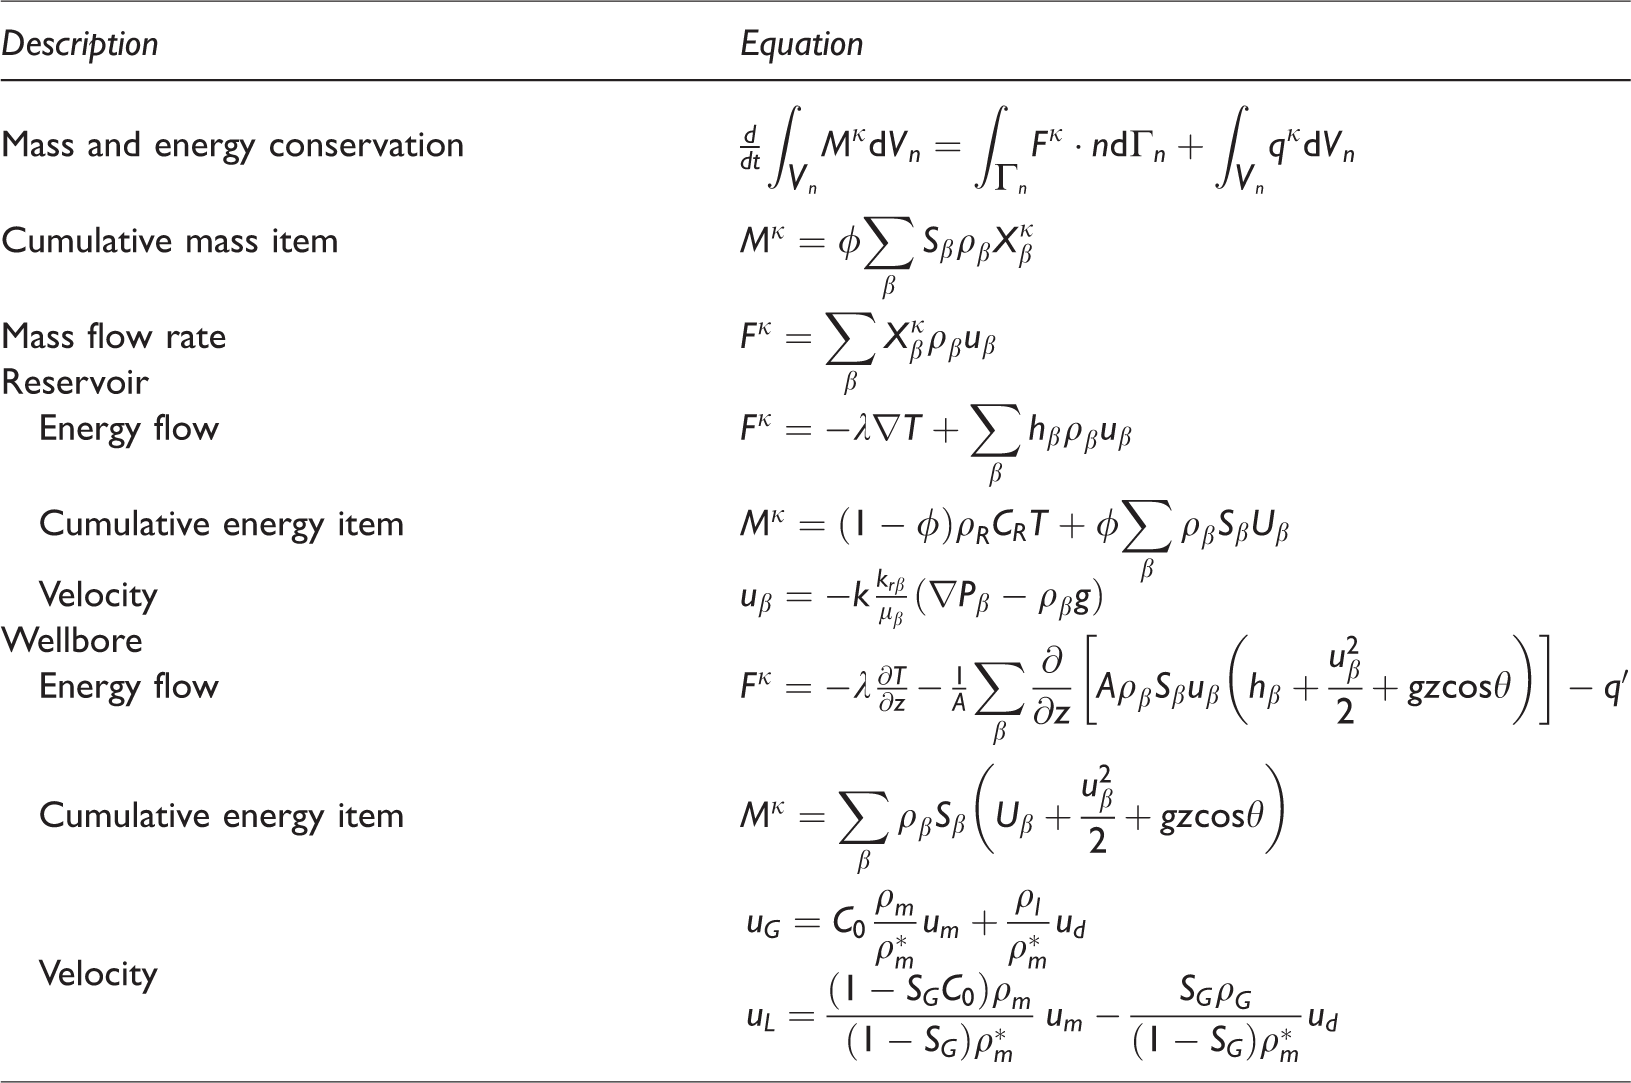
T2Well treats the wellbore and thermal reservoir as an integrated system, and the flow is controlled by different physics for each medium. Specifically, for the phase velocities, Darcy’s law for multidirectional flows is used in the reservoir, and one-dimensional constant motion law is used in the wellbore. The phase velocities are calculated from the mixture velocity and the drift velocity according to the drift flux model (DFM) (Pan and Oldenburg, 2014). For the energy balance, the kinetic energy can be neglected as the fluid velocity in the reservoir is slow. But both kinetic energy and gravitational potential energy must be considered in the wellbore. The governing equation is shown in Table 3.
T2Well basic control equations.
Results and discussions
The influence of different injection rates on the wellbore heat transfer process
Water flow in the wellbore and reservoir is highly coupled due to complicated interactions between the two mediums, the impact of the injection rate can be closely related to the injection speed.
Under the same injection temperature (50°C), the injection pressure in the injection wellhead increases with injection flow rate (Figure 4(a)), and presents a good linear function relationship. During its 30 years of production, the head pressure of the injection well only increased slightly in the early stage of production, then remained stable in the later stages, and the injection well bottom pressure increased gradually under the effect of both injection pressure and gravity (Figure 4(b)), thus the pressure change is basically the same as that of the wellhead.
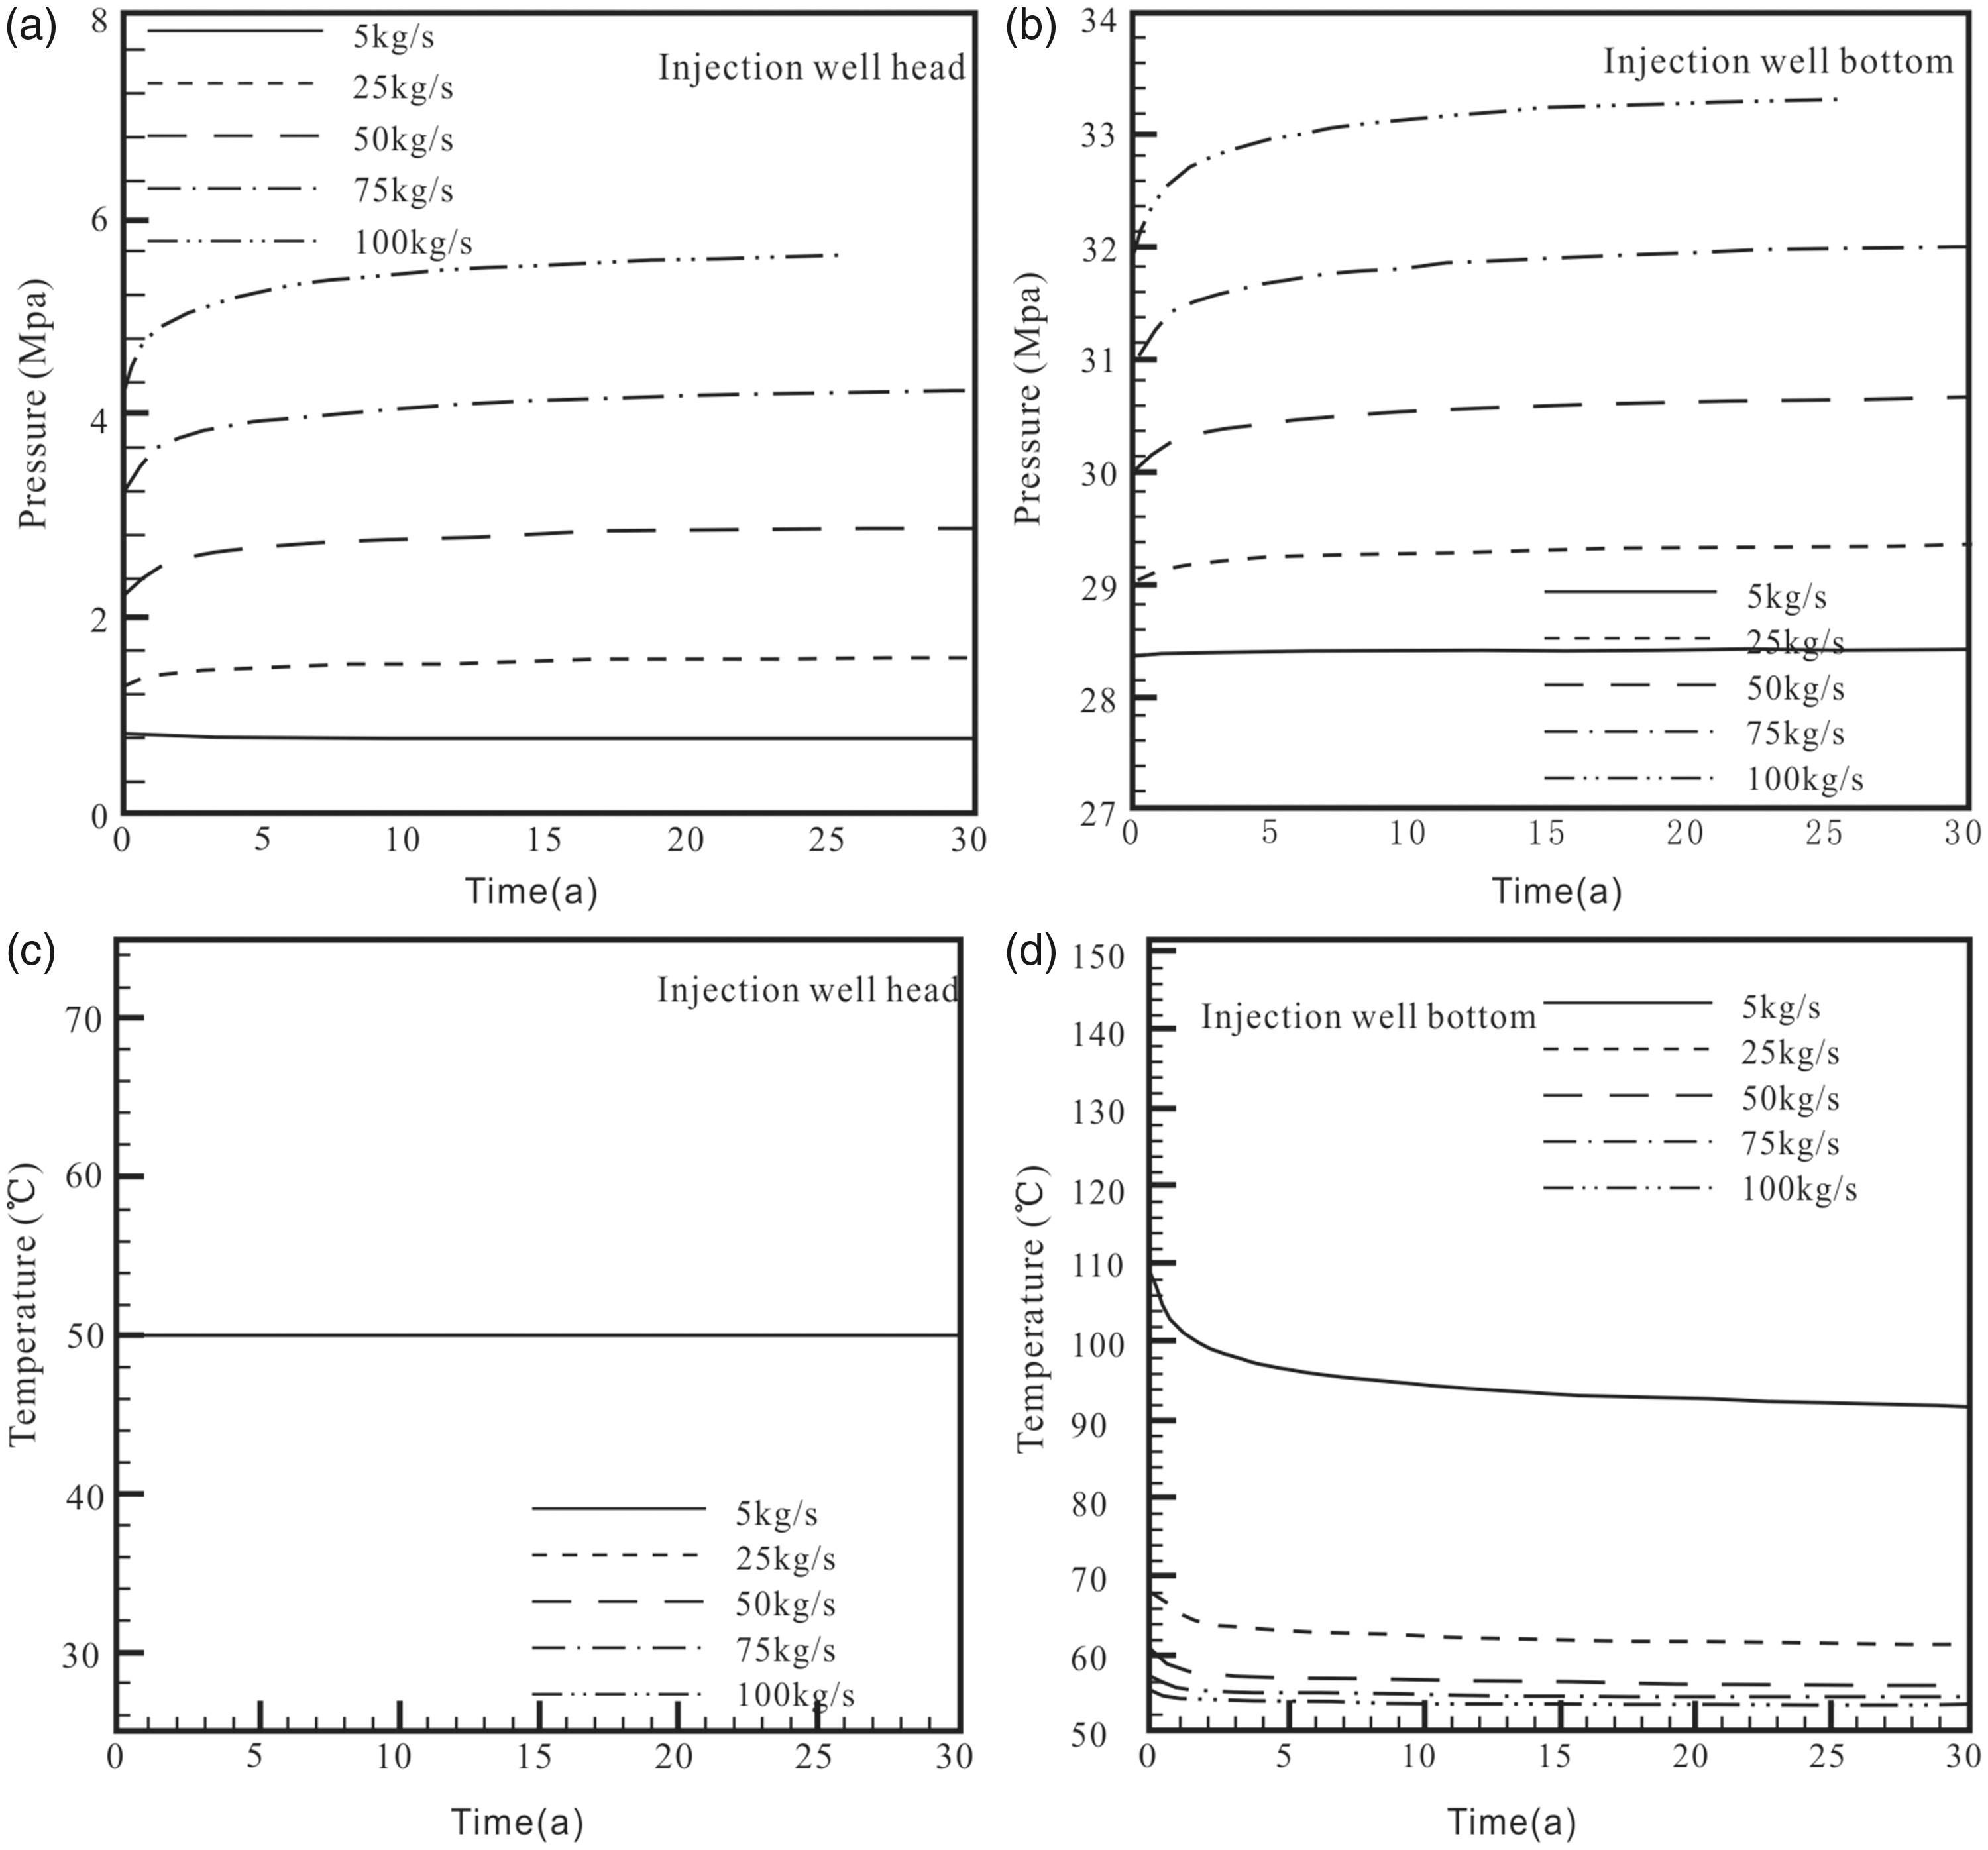
Injection well head (a, b) and bottom (c, d) temperature and pressure changes under different flow conditions.
However, the fluid temperature changed greatly from the wellhead (Figure 4(c)) to the well bottom (Figure 4(d)). At the lowest flow rate of 5 kg/s, there is a significant increase in temperature, since more heat can be absorbed from the surrounding rock. This effect was not obvious at a high flow rate, because the total heat absorbed by the cold water is constant, and the mass flow is larger, so the temperature change is small.
At high flow rates, the wellhead pressure suffered a drop, to various degrees, in later stages (Figure 5(a)), caused by the increase of momentum and friction loss in the wellbore. In all cases, transferred heat can reach 151°C (reservoir temperature) by heat-exchange with the reservoir at the well bottom in the initial stage of production (about five years), but with continuing exploitation, formation pressure drops gradually (reflected in the well bottom pressure drop) (Figure 5(b)), the temperature of the heat-transfer is reduced as the flow rate increases, and the decline of temperature accelerates (Figure 5(d)). In the initial stage of production, due to the heat dissipation of the surrounding rock the wellhead temperature increases gradually (Figure 5(c)), but with continued exploitation, the wellhead temperature gradually stabilizes with the surrounding rock. The wellhead temperature is consistent with the temperature of the well bottom under high flow rates, but far below the temperature of the well bottom at low flow rates, because the heat exchange with the surrounding rock in the wellbore is more significant.
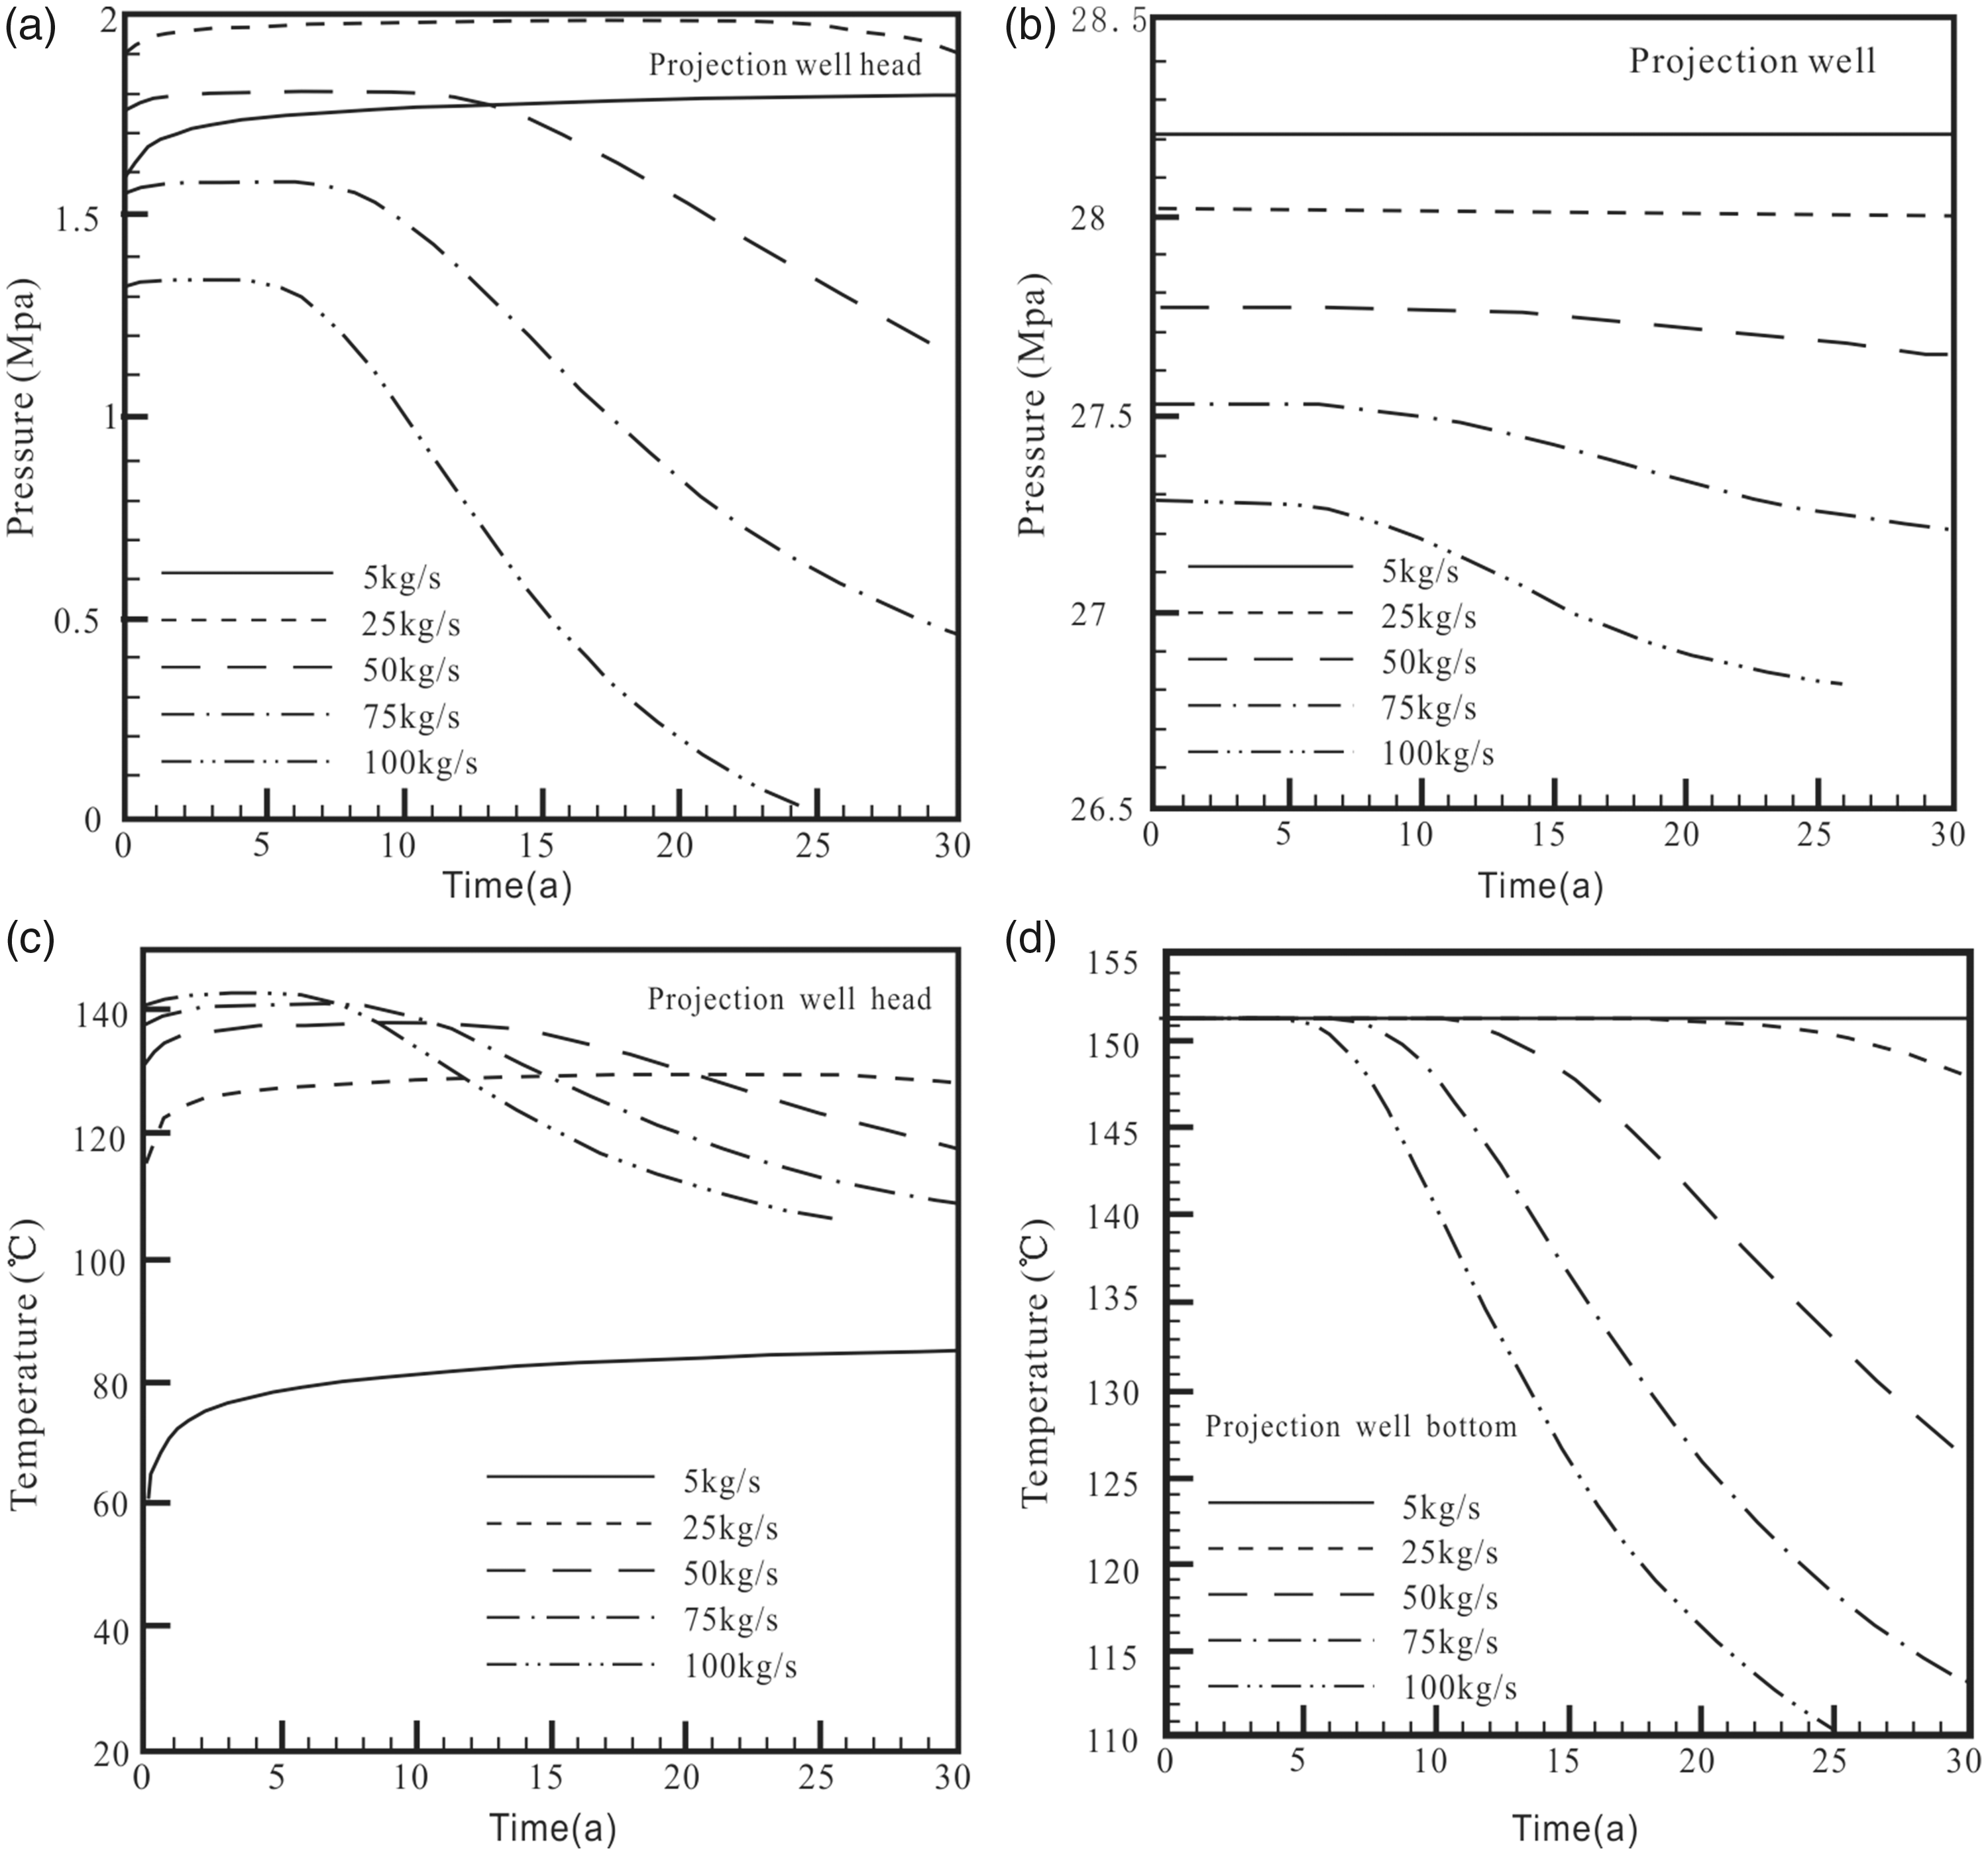
Changes in pressure (a, b) and temperature (c, d) of the projection well head and bottom under different flow conditions.
Both the wellbore and reservoir show a loss of flow pressure (Figure 6). The pressure in the injection well is greater than the projection well at high injection rates, indicating that pressure is lost in the processes of underground migration and heat extraction, and the higher the flow rate, the greater the pressure loss (Figure 6(a)). When fluid is transported through the injection well bore, the pressure exerted at the wellhead is transferred to the well bottom. The pressure difference between the bottom and the wellhead is similar to that of the formation pressure (Figure 6(c)).
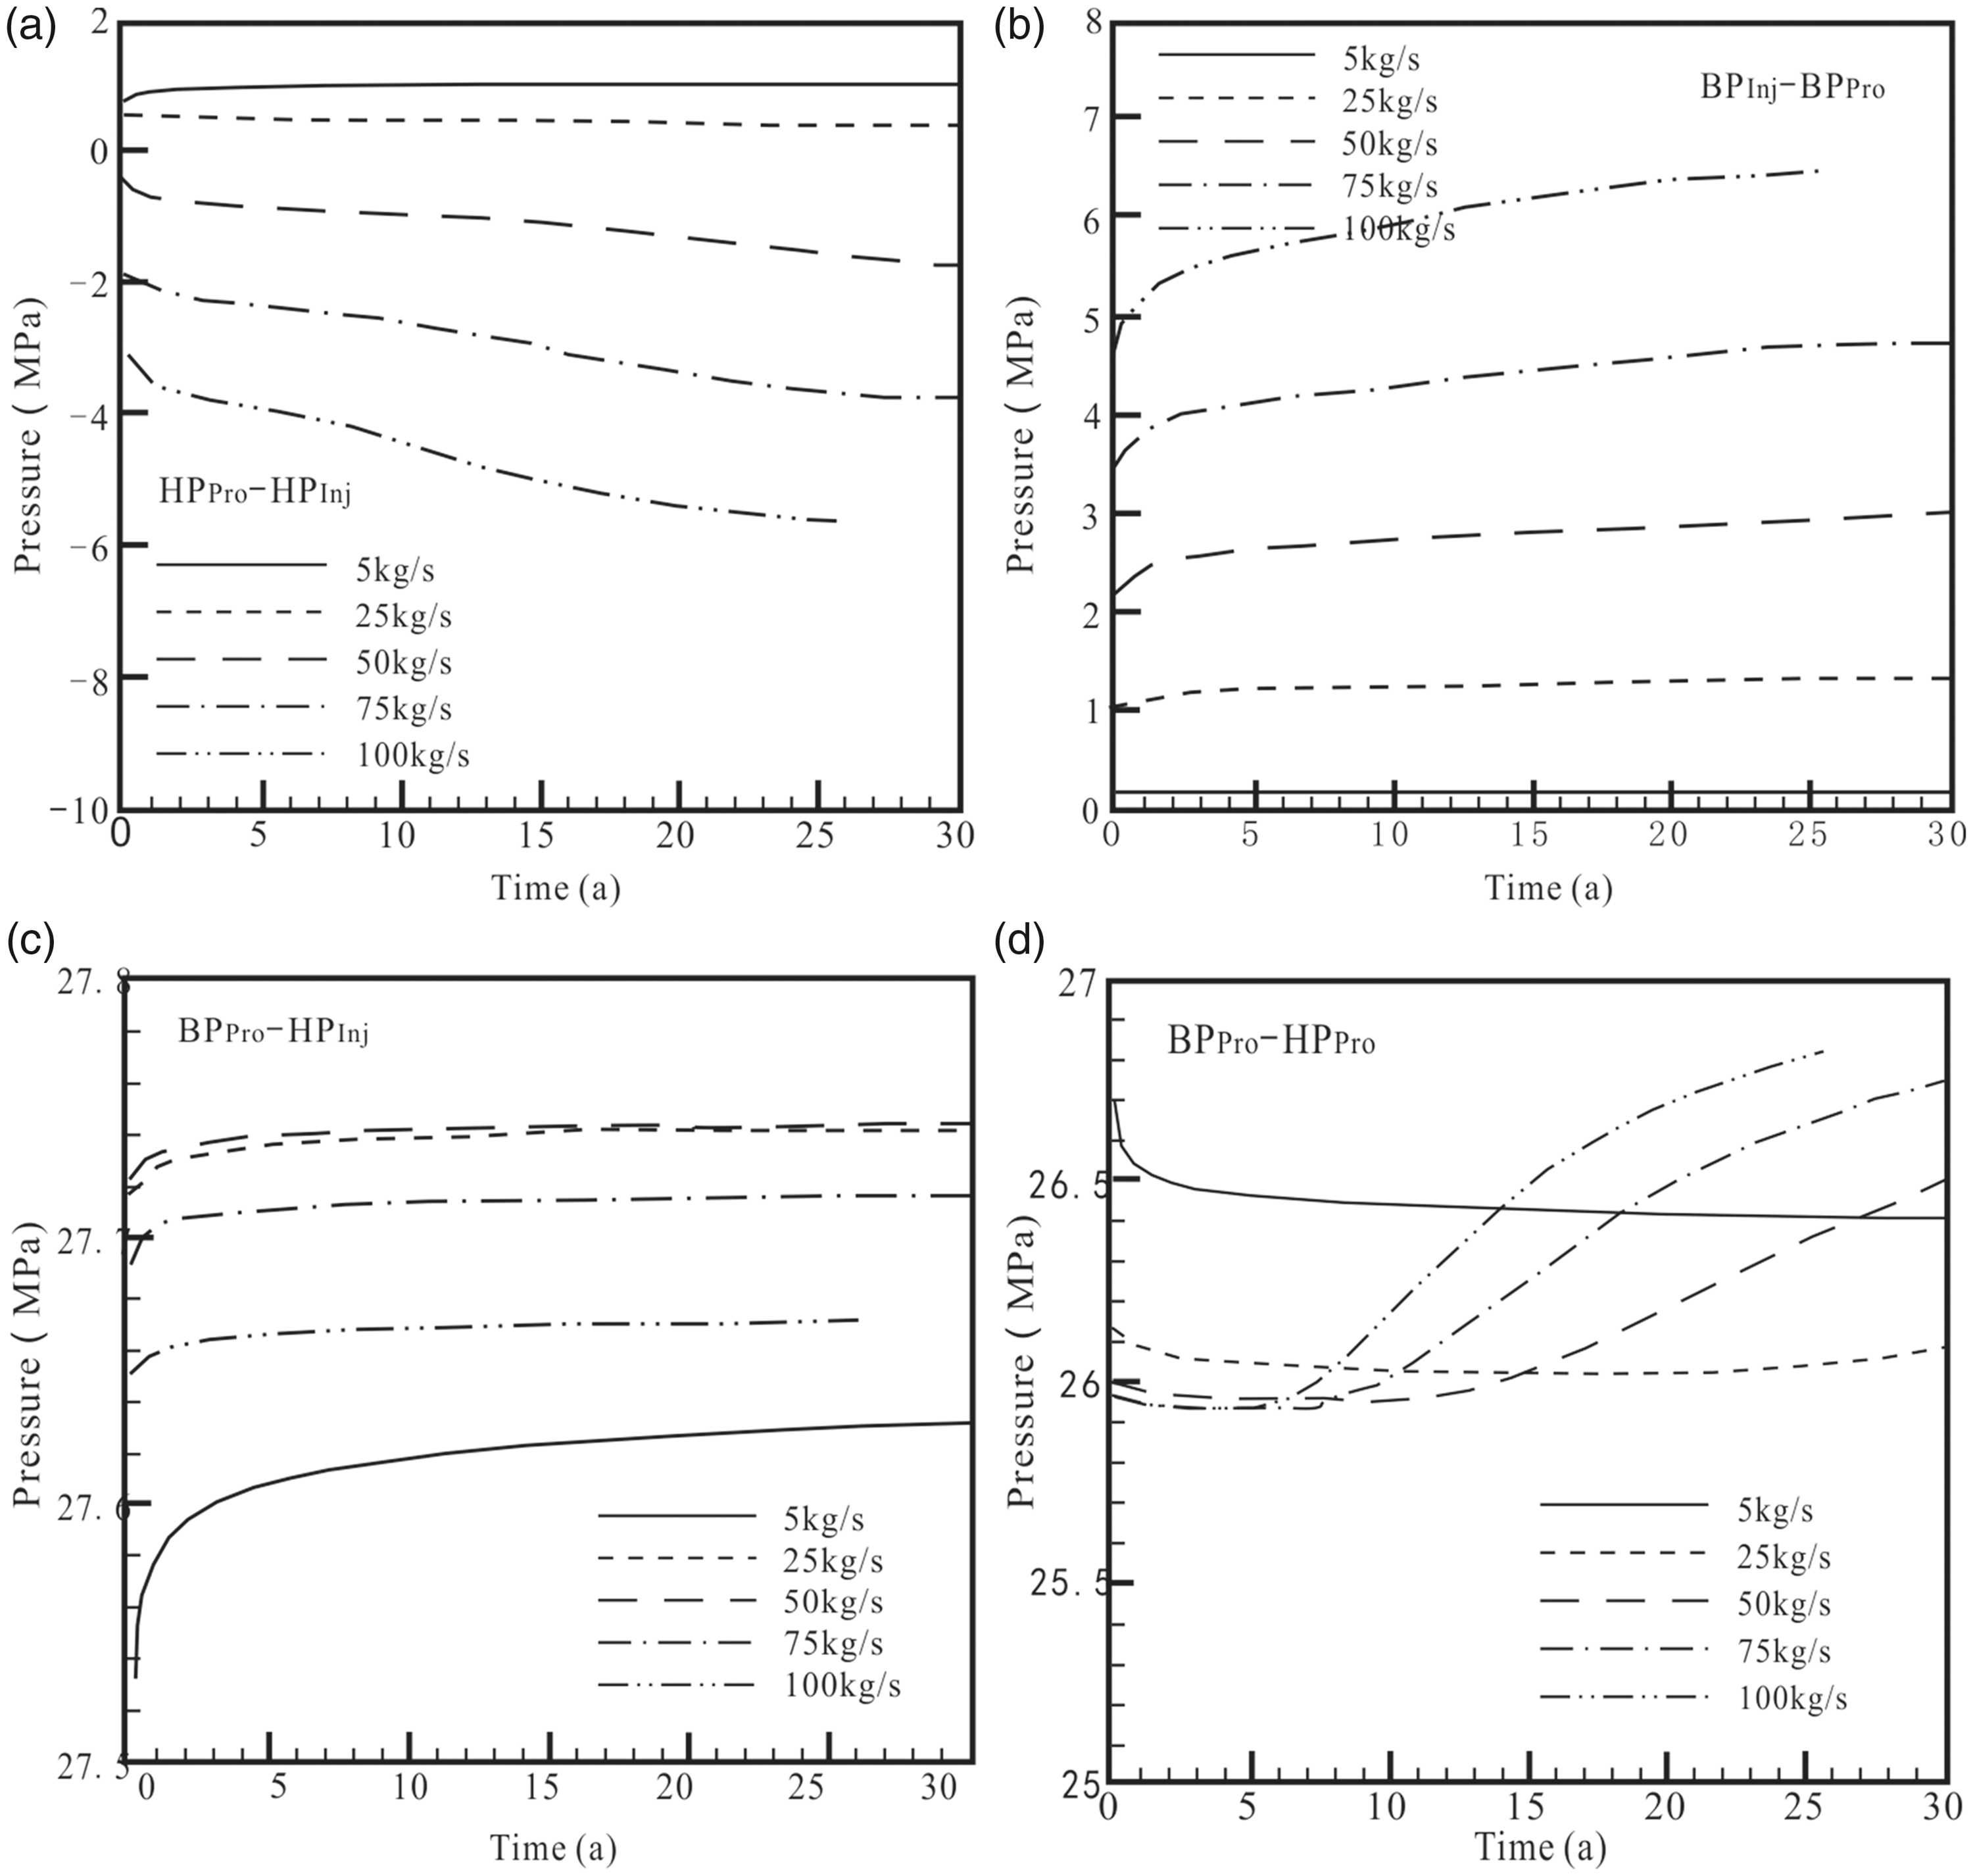
Pressure differences between the Injection and production wellheads and well bottoms under different injection rates. (a) production wellhead–injection wellhead, (b) injection well bottom–projection well bottom, (c) injection well bottom–wellhead, and (d) production well bottom–wellhead.
The higher the flow rate, the higher the pressure difference is, which is mainly because the injection pressure has a greater impact than the low flow rate in overall high flow rate conditions, and the high flow rate overcomes the high frictional resistance loss due to the gravity-related pressure. Because the pressure due to gravity is greater than the high frictional resistance loss and higher injection rate, the pressure difference is greater at high injection rates. The fluid flow from the injection well bottom to the production well bottom is the migration process in the reservoir; the pressure difference is proportional to the flow rate (Figure 6(b)). The heated water is raised from the bottom of the production well to the wellhead, and since gravity opposes the flow, wellhead pressure is reduced. The amplitude of the pressure drop in the production well is related to the flow rate and time, but it is not monotonous. At the lower flow rate, the pressure difference is stable, but at higher flow rates, after 5–10 years of operation, the pressure difference increases at a greater rate as the wellhead pressure decreases (Figure 6(d)).
The pressure, temperature, and density in the wellbore were also analyzed (Figures 7 and 8). In the injection wellbore, the fluid temperature increased due to heat conduction with surrounding rock, but the increase is small at higher flow rates. At lower flow rates, the temperature increase is greater, but only at the bottom of the wellbore near the reservoir, because at the lower flow rate the heat transfer from the surrounding rock to the fluid is more effective. Because the density, viscosity, enthalpy value, compressibility, and expansion coefficient of water are almost exclusively affected by temperature, the distribution of density in the wellbore is negatively correlated with temperature.
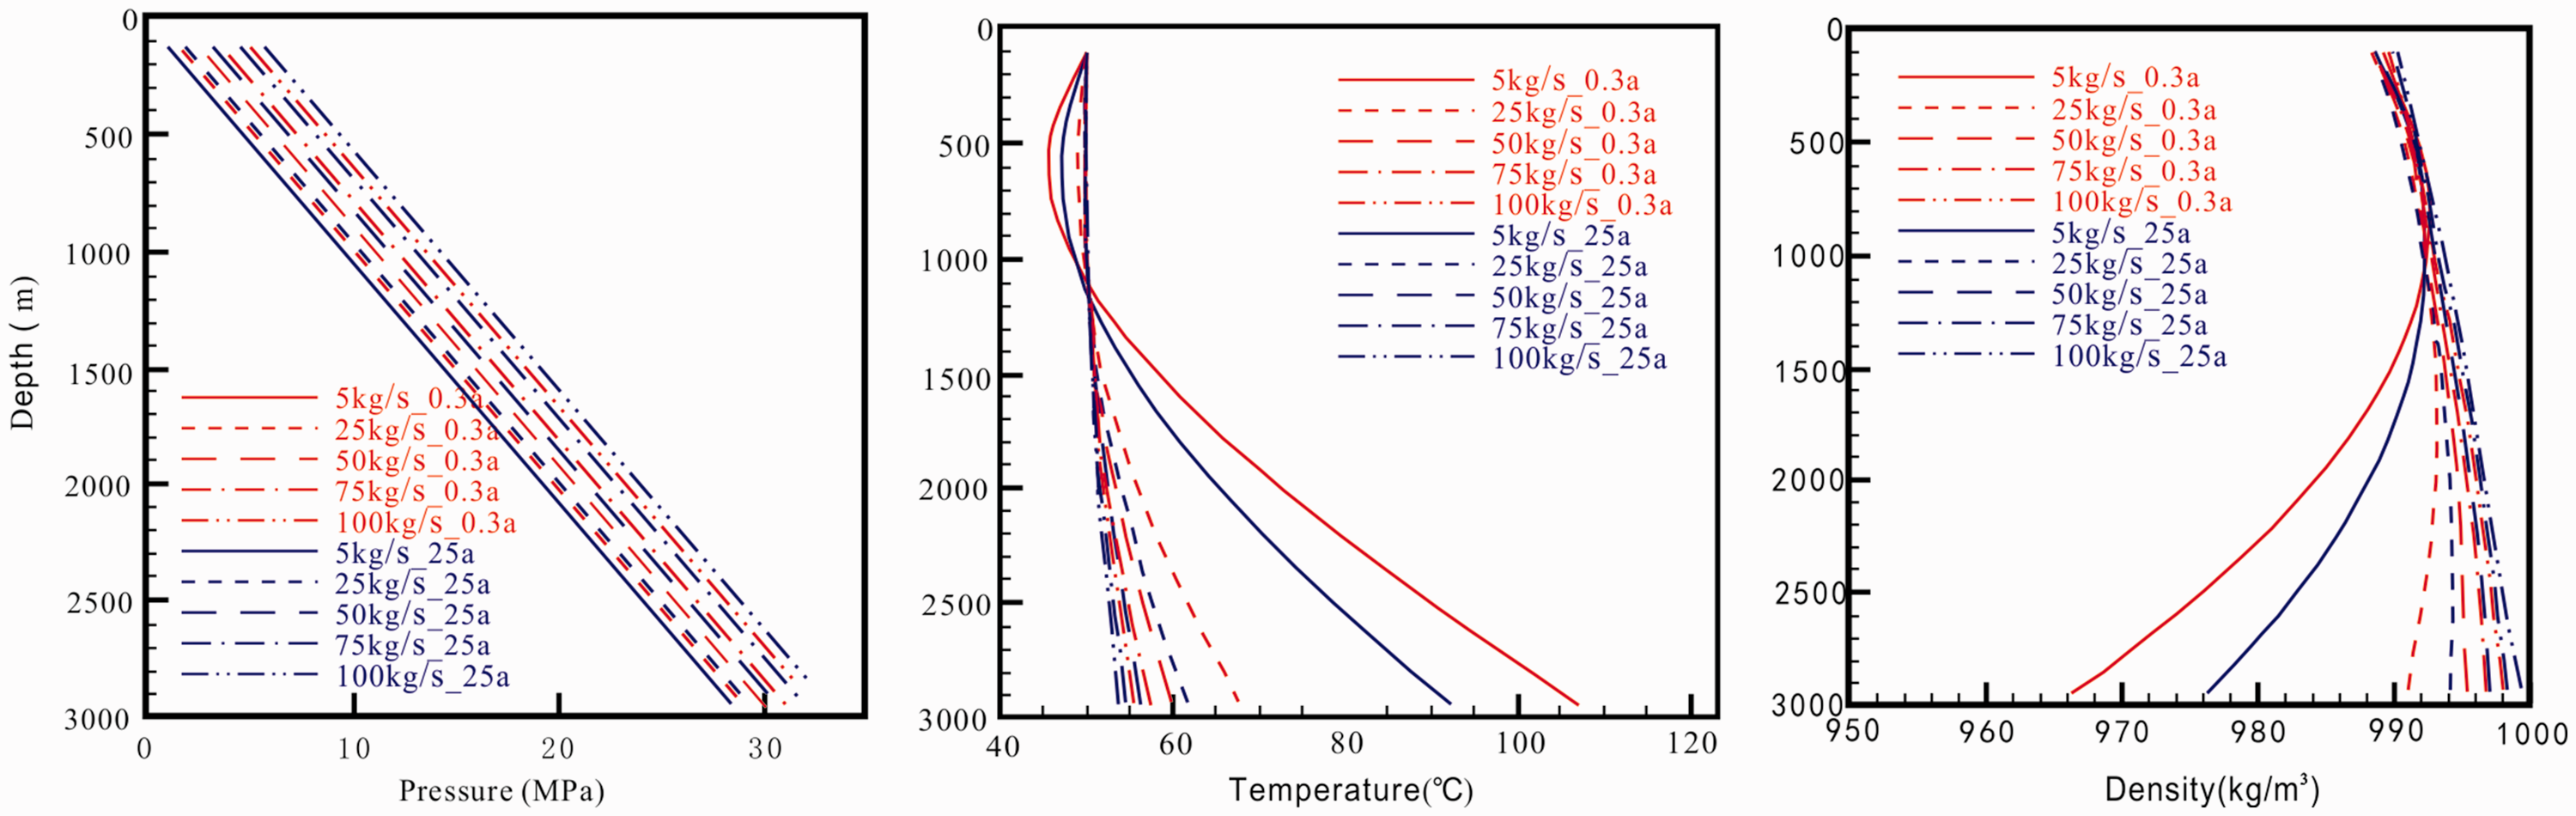
Vertical distribution of fluid pressure, temperature, and density along the injection wellbore after 0.3 and 25 years.
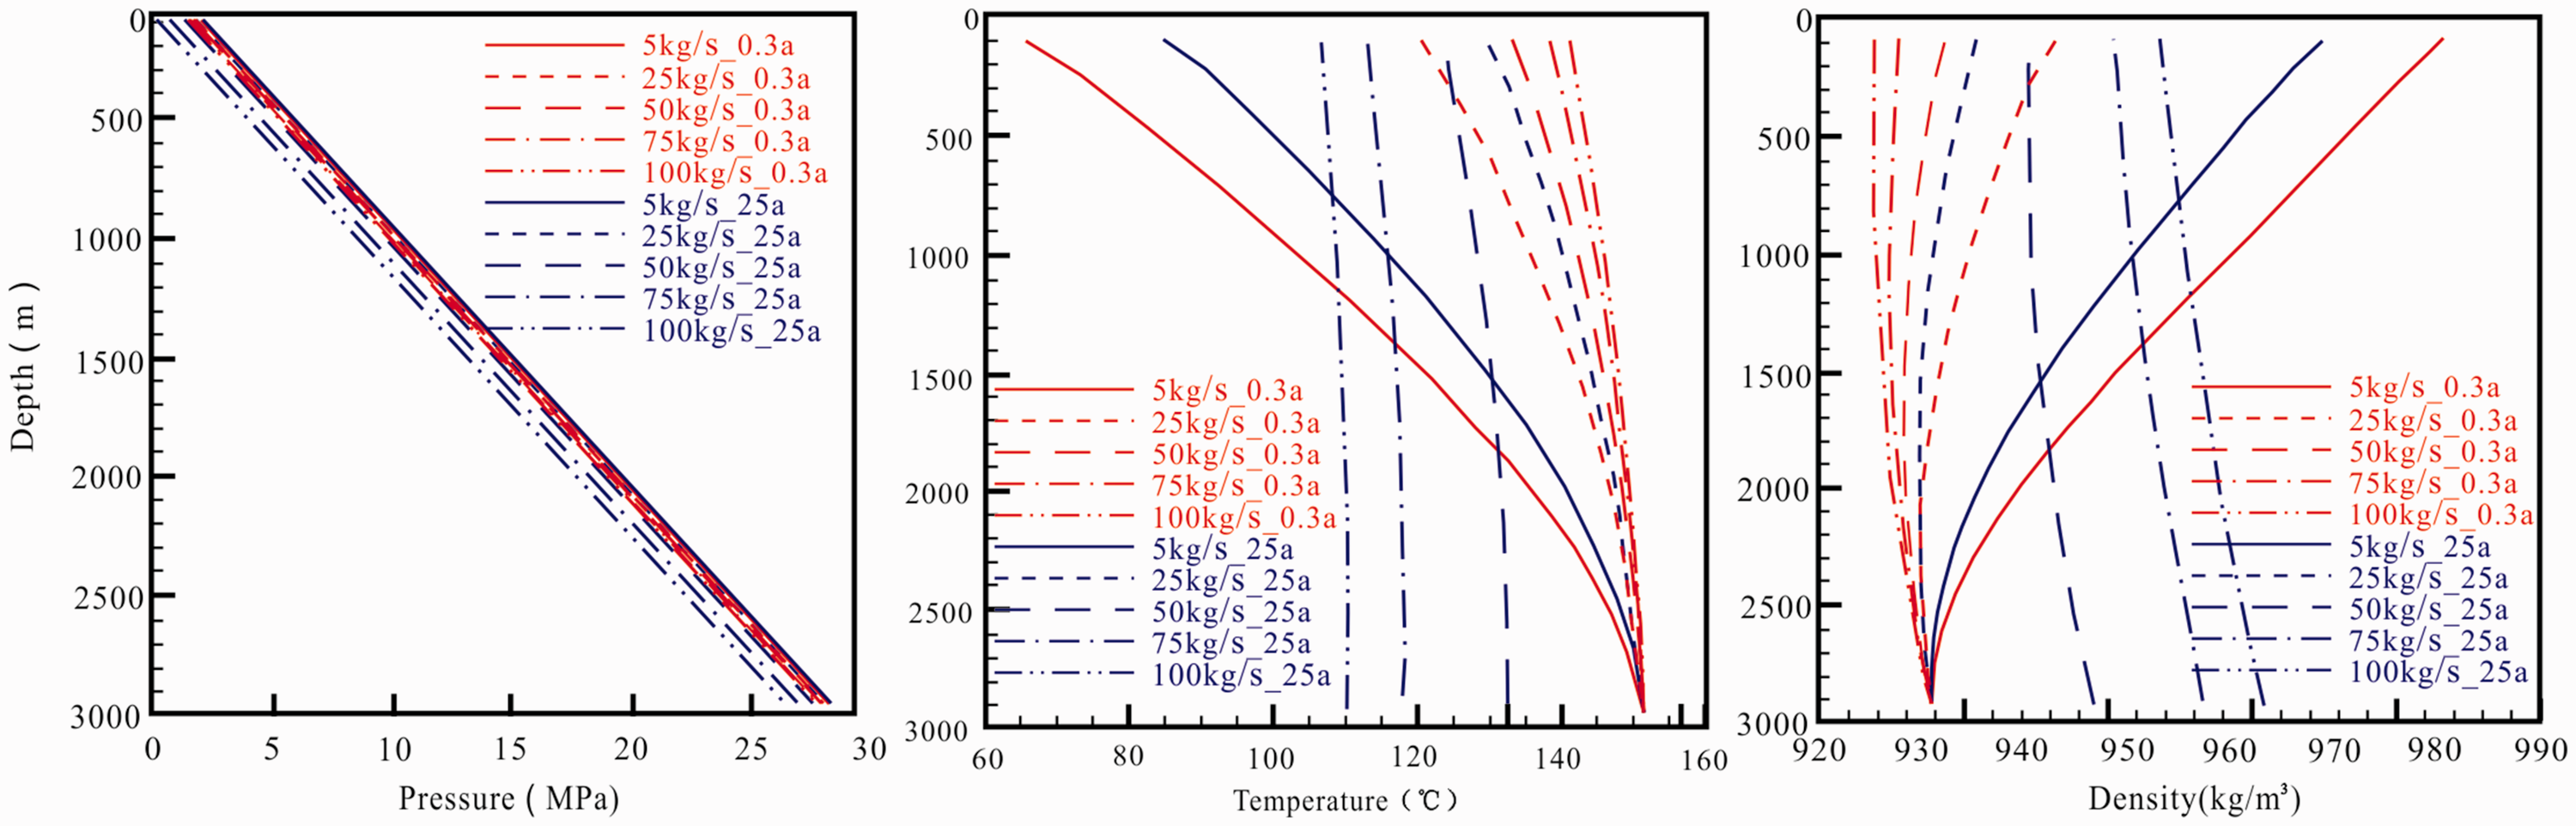
Vertical distribution of fluid pressure, temperature, and density along the production wellbore after 0.3 and 25 years.
In the production wellbore, heated fluid also experiences heat exchange with the surrounding lower temperature rock, which reduces the energy of the fluid. Also, according to the Joule–Thompson effect, the temperature of the fluid drops with pressure. Given these factors, fluid temperature largely declines from the head to the bottom, and the temperature drops even more at lower flow as the heat exchange rate to the surrounding rock from the hot fluid is higher than that to the surrounding rock. At high flow rates, the temperature at the well bottom is lower than at the top, and the temperature gradient in the wellbore is gradual, because less heat is lost from the fluid to the surrounding rock mass.
The influence of different injection rates on the heat transfer process
Figure 9 shows how, for 5 kg/s and 100 kg/s injection rates, the temperature and pressure are distributed in the system after 30 years. At lower flow rate, the affected region of cold water is limited, and the temperature variation throughout the reservoir is small. At a high rate, the reservoir temperature decreases greatly, and the influenced region is larger. Because the density of water is affected only by temperature, the density distribution in reservoir is consistent with the temperature distribution. The maximum pressure drop (relative to the original reservoir pressure) always occurs near the production well, and the pressure signal quickly spreads throughout the reservoir.
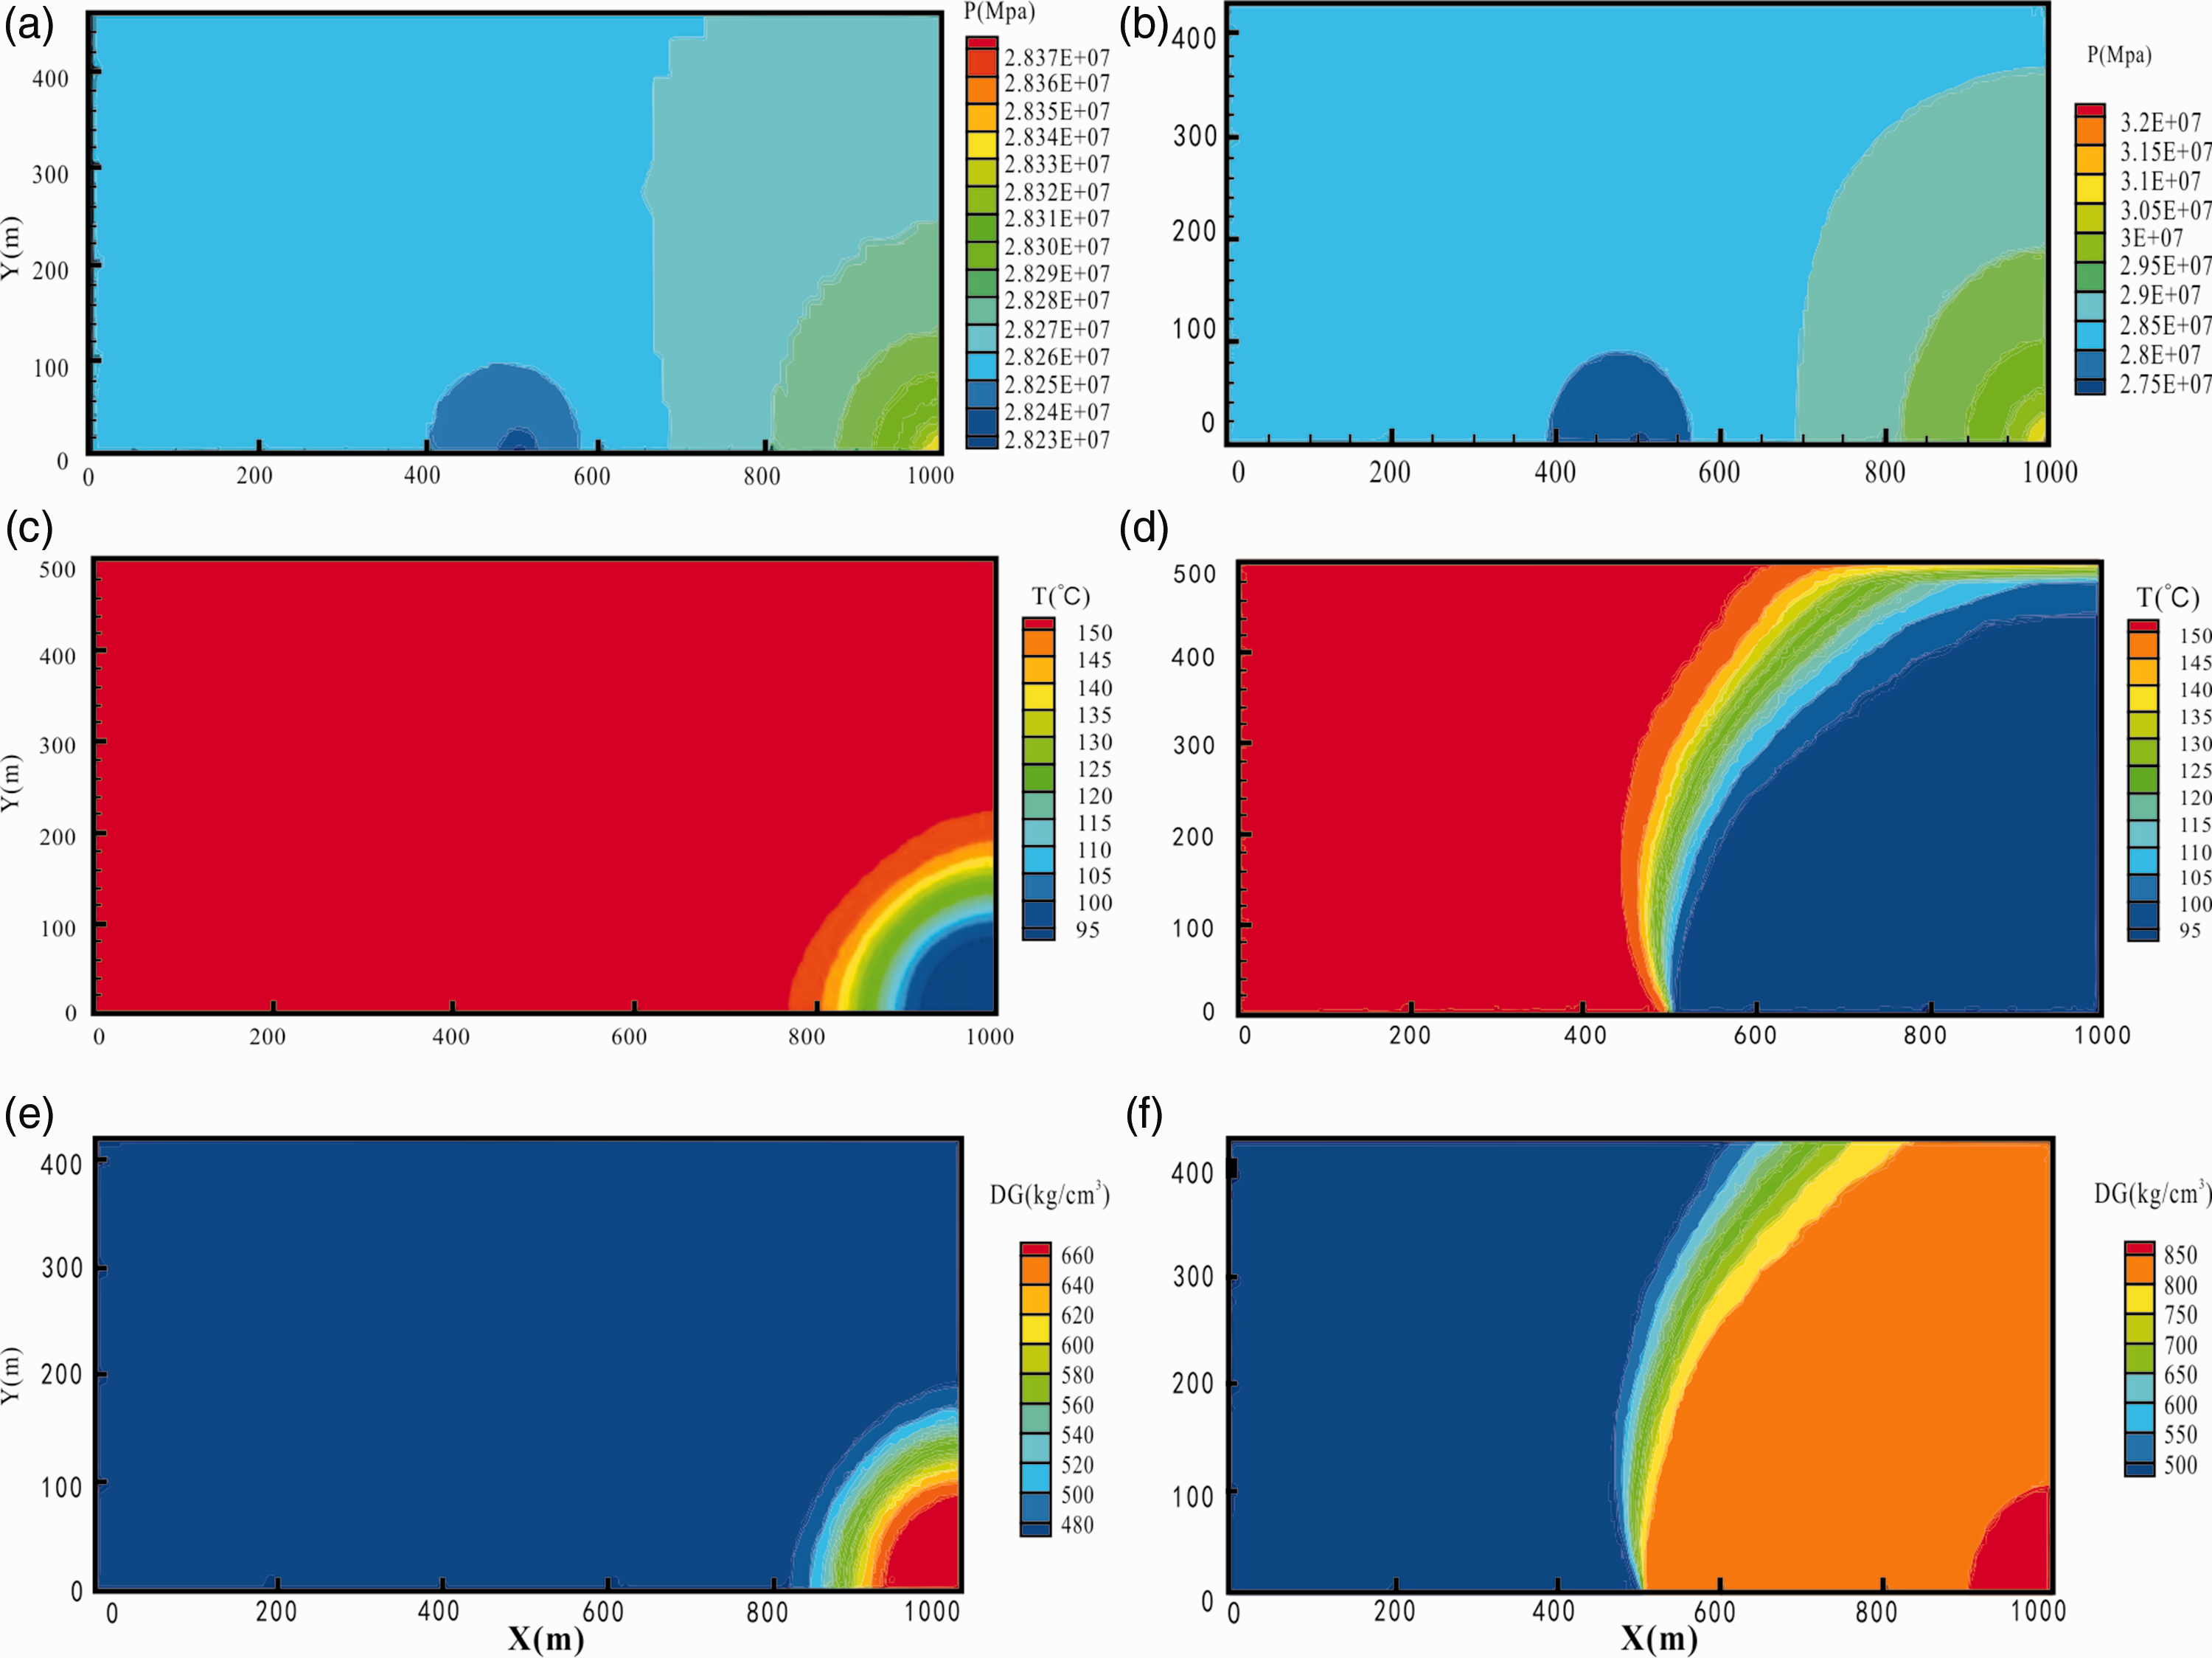
Distribution of fluid pressure, temperature, and density in reservoir after 30 years at varying injection flow rates: (a, c, e)5 kg/s;(b, d, f)100 kg/s.
The influence of different injection rated on heat extraction rate
Figure 10 shows the rate of heat extraction with time at different injection rates, according to the formula from equation (1). The heat extraction rate is greater at higher injection rates, and lesser at lower rates. However, at high injection rates, the heat extraction rate increases rapidly at first, but then decreases sharply. Because the reservoir is losing heat faster, thermal breakthrough occurs sooner.

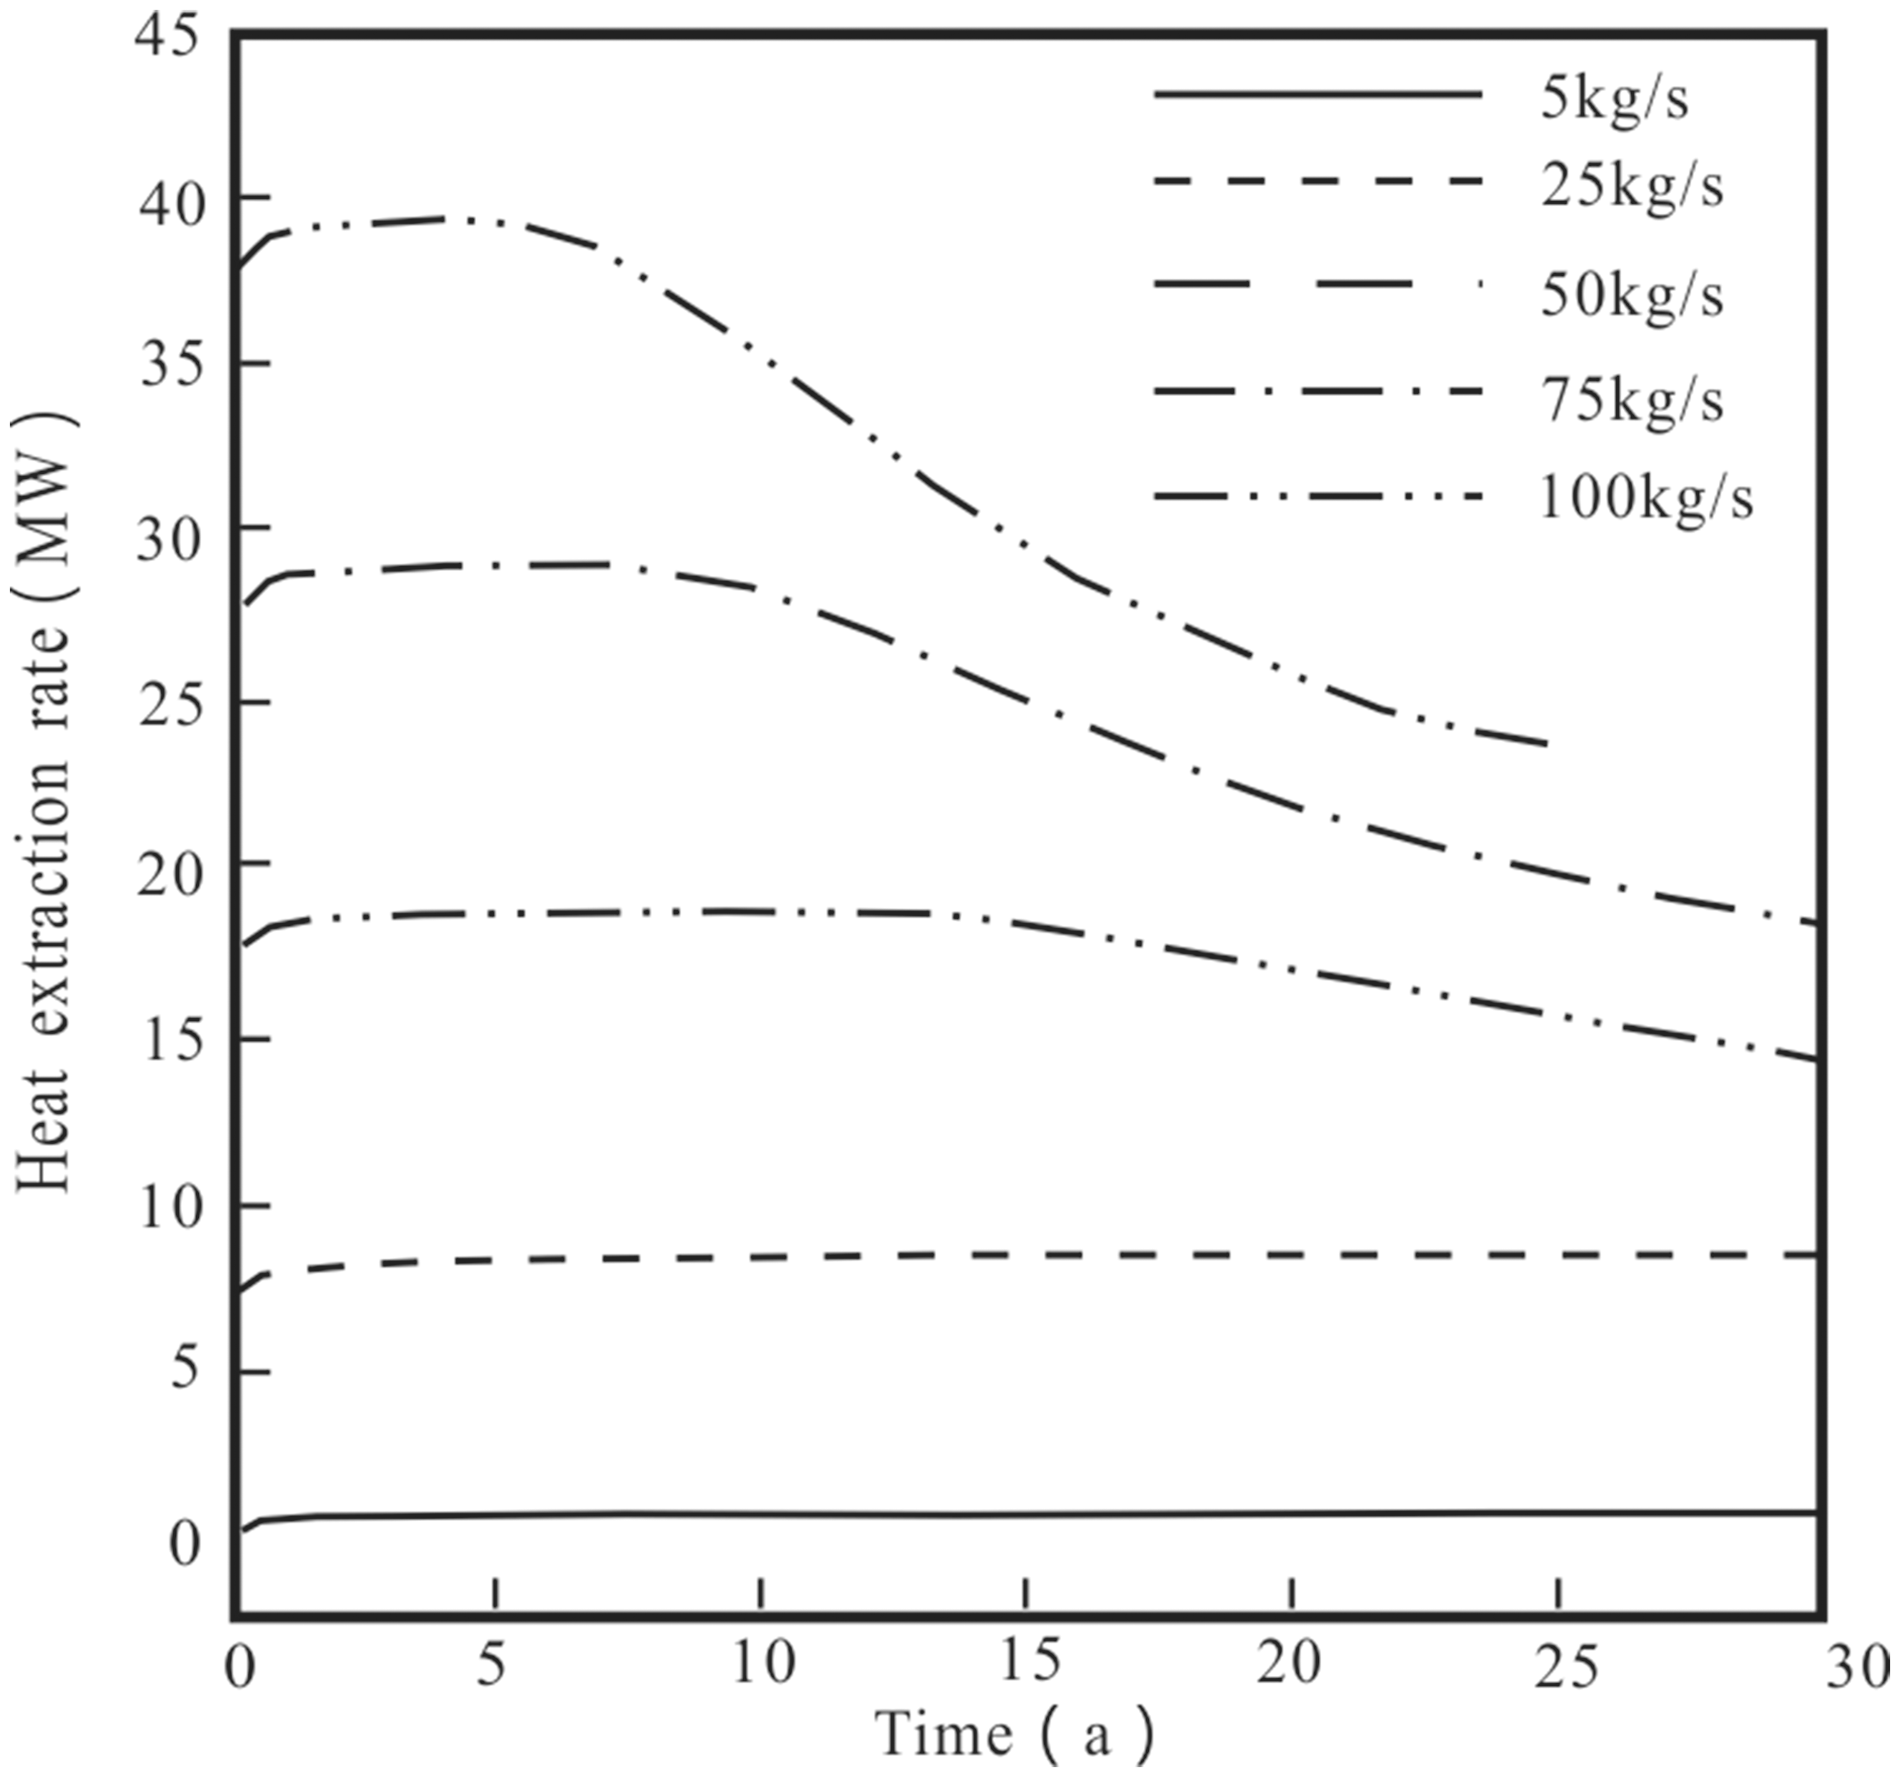
Variation of heat extraction rate over time at different injection rates.
G: the heat extraction rate; F(pro) and F(inj) respectively represent the flow rate of production Wells and injection Wells; h(pro) and h(inj) respectively represent the specific enthalpy values of production Wells and injection Wells.
Over a period of 25 years, at injection rates of 5, 25, 50, 75, and 100 kg/s, cumulative heat extraction will be 2.1 × 10¹⁵, 7.8 × 10¹⁵, 15 × 1015, 21.2 × 10¹⁵, and 24.4 × 10¹⁵ J for each situation, respectively (Figure 11). Cumulative heat extraction is larger at higher injection rates, but as production continues, cumulative heat extraction gradually decreases in the latter stages. Therefore, a 50 kg/s injection rate is suitable for stable geothermal energy exploitation systems in Guide Basin.
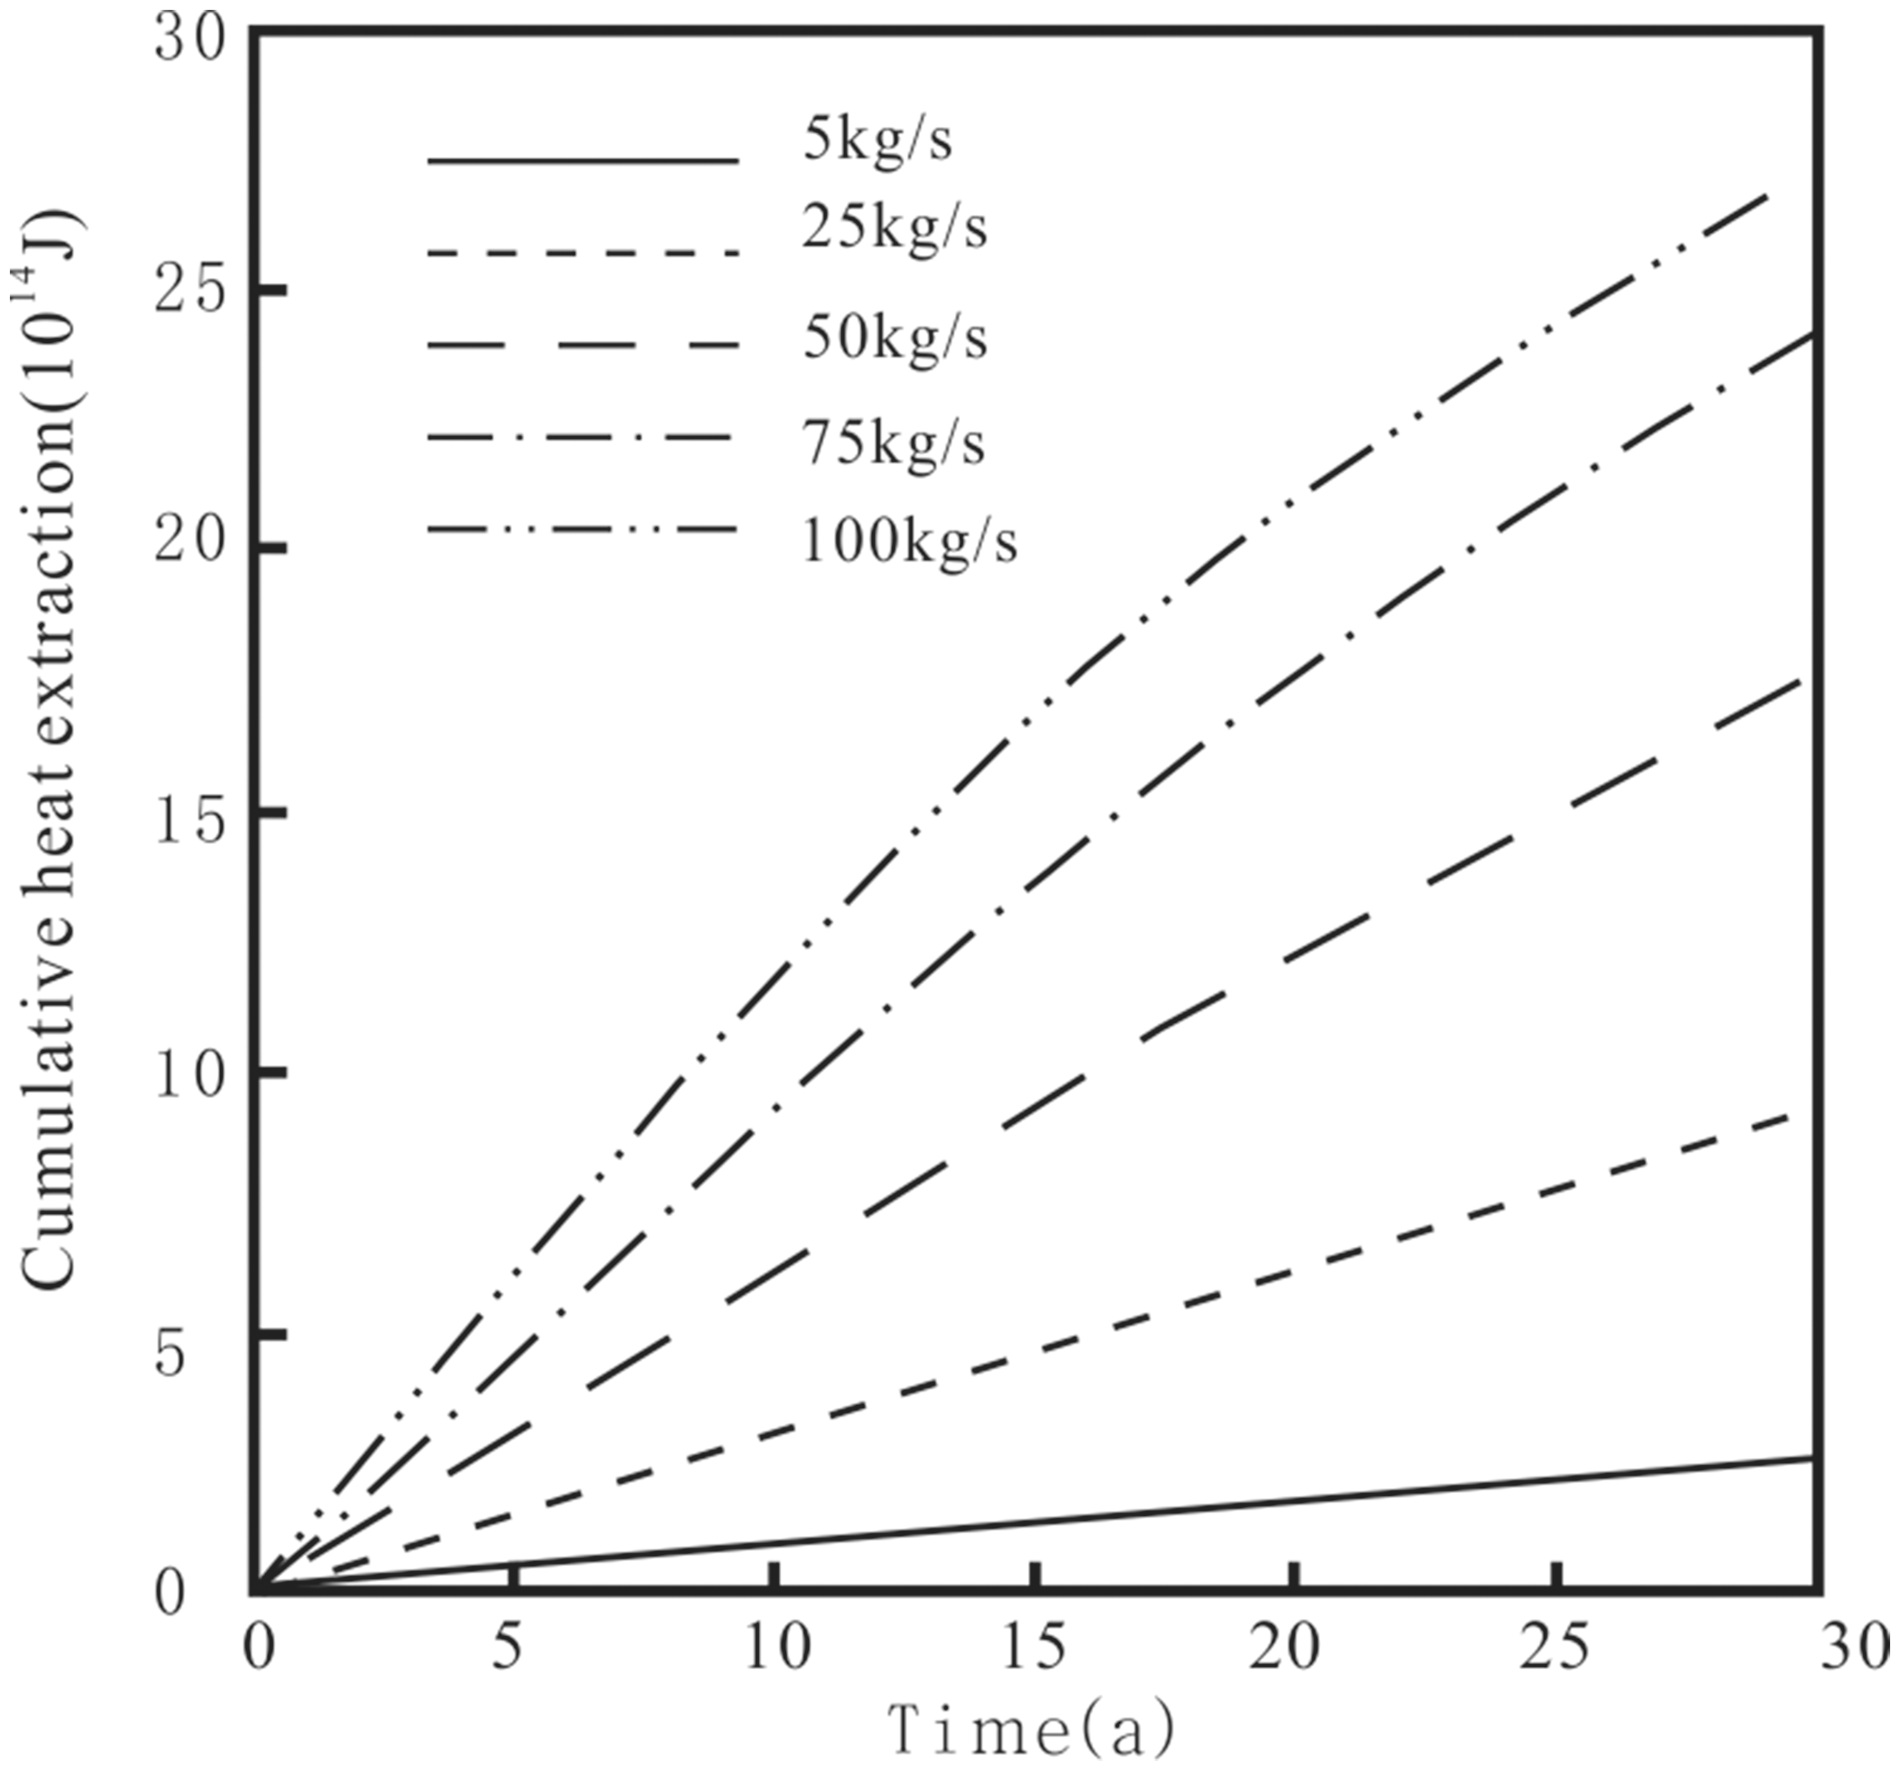
Cumulative heat extraction at different injection rates.
Conclusion
Based on the geological conditions of Guide Basin, this paper established a two-dimensional and three-point wellbore reservoir coupling model, and chose H2O as the heat transfer medium to analyze how injection rate affects the characteristics and physical fields of flow in both wellbores and reservoirs. Meanwhile the maximum heat extraction capacity in the Guide Basin was estimated. The conclusions obtained through numerical simulation are as follows:
In injection wells, the fluid is in a compressed state, and its density increases as pressure increases. Only at a low injection rate (5 kg/s), the fluid is in an expansive state and thus its density decreases with increasing temperature. In production wells, however, the situation is quite the opposite. The density of the fluid decreases with the decrease in pressure, but the density of the fluid, at the 5 kg/s injection rate, increases with the decrease in temperature. Therefore, for low flow rates, the influence of temperature on fluid density is dominant, while for high rates, pressure has a greater effect on fluid density. For low flow rates, the temperature of the production well remains relatively stable after 30, but the heat loss of the reservoir is relatively large at higher flow rates, and both temperature and thermal extraction efficiency are greatly reduced at these rates (75 kg/s, 100 kg/s). Therefore, using H2O as heat medium, it is more suitable to keep the injection rate between 50 and 75 kg/s for Guide Basin.
Footnotes
Acknowledgement
The authors wish to thank Dr Liu Yanguang.
Declaration of conflicting interests
The author(s) declared no potential conflicts of interest with respect to the research, authorship, and/or publication of this article.
Funding
The author(s) disclosed receipt of the following financial support for the research, authorship, and/or publication of this article: This project is supported by the Chinese Academy of Geological Sciences Fund (No. YK201611, SK201501, SK201704), the National Key R&D Program of China (Grant No.2018YFC0604300, 2018YFC0604306), the National Natural Science Foundation of China (Grant No. 41502249).