
Abstract
Dezhou City is located in northwestern Shandong Province, China, and is rich in geothermal resources. Approximately 30% of the geothermal wells and geothermal heating areas of Shandong Province are located in Dezhou. A doublet-well layout geothermal system was completed by the Lubei Geo-engineering Exploration Institute for local winter heating, which has been in operation for 4 years. The wellbores penetrated the Guantao Formation with a well spacing of 180 m. This study aims to assess the heat extraction performance of the current well layout and predict the temperature evolution and lifespan. Furthermore, larger well spacing schemes were used in a simulation to test the heat supply potential and sustainability. In this study, the thermal conductivity and permeability were calibrated using in situ measured data from a field production test. A relatively high permeability layer was found between the depths of 1468 and 1536 m. The temperature remained stable in the first 6 years and then started to decrease. The recharging (injection) water tended to concentrate along the bottom highly permeable layer and accounted for over 64% of the outflow in the 100th year of the simulation test. The outflow temperature decreased from 53.9°C to 50°C in the 32nd year, making it less viable for subsequent sustainable exploitation. Hence, a larger well spacing is required for long-term operation based on the same geothermal reservoir. It was found that a spacing of 400 m could guarantee an outflow temperature above 50°C over a 100-year lifespan with an 80 m3/h pumping (production) rate. Moreover, the sustainability of the 600-m spacing was almost 2.5 times that of the 400 m case. The modeling and analysis method can be useful for the development and optimization of a doublet-well geothermal system under similar conditions.
Keywords
Introduction
Background
Traditional power generation based on fossil fuels is generally considered unsustainable in the long term. Thus, many efforts have been made worldwide to introduce more renewable energy sources (Ellabban et al., 2014; Majorowicz and Grasby, 2019; Sowizdzal, 2018; Zarrouk and Moon, 2014). Geothermal energy has the advantage of a wide distribution, huge reserves, and features that are not affected by weather and seasonal changes (Pang et al., 2017; Pellizzone et al., 2017). As a result, it is widely promoted and has become one of the most competitive and strategic renewable resources. Globally, accessible geothermal resources have been used for more than a century (Pellizzone et al., 2017). According to the utilization styles, it can be categorized into indirect use (electrical power generation and combined heat and power in cogeneration applications) and direct use of heat (district heating, heat pump applications, bathing, fish farming, etc.) (Fridleifsson, 2001; Hepbasli, 2008).
In China, hydrothermal resources are the primary geothermal resources. The total amount of hydrothermal energy is equivalent to 1.25 × 10³ billion tons of standard coal, and the annual recoverable resources are equivalent to 1.865 billion tons of standard coal, which fulfilled 44% of Chinese energy consumption demands in 2015 (Wang et al., 2017). Since they were explored in the 1970s, hydrothermal resources have been mainly used for heating and bathing purposes in China (Balke and Zhu, 2007; Hou et al., 2018; Kong et al., 2014). Currently, the total hydrothermal heating area in China has become the world's largest, reaching 0.43 billion m2 (Li et al., 2020).
Recently, groundwater level drop or even surface subsidence caused by hydrothermal resource exploitation has become noteworthy. In addition, it always leads to surface water pollution problems unless the tailwater is appropriately treated (Li and Xu 2018b; Wang and Zhao, 2015). Compared to a single well only for production, a doublet-well configuration, one for injection and the other for production, possesses certain advantages (Kaya et al., 2011; Rivera Diaz et al., 2016; Rybach, 2003): (1) it allows for safe reinjection of the produced water; (2) it improves the heat-recovery factor; and (3) it counteracts production-induced subsidence. Hence, this system can effectively prolong the life of a geothermal field (Duan et al., 2011; Seibt and Kellner, 2003). Nevertheless, reinjection in a doublet geothermal well is expected to develop a thermal front of cold water within the reservoir. Moreover, when there is a contrast in salinity and/or chemical facies between the pristine reservoir water and the reinjected water, a compositional front may also be formed (Gringarten, 1978). Such fronts may be of concern for the sustainability of the geothermal well doublet. In particular, if cold water reaches the pumping well by flowing along the pressure gradient, thermal breakthrough occurs at the pumping well, and the temperature of the extracted water progressively declines. Once a certain minimum threshold is reached, the system lifetime is significantly shortened. Generally, the geologic and hydraulic reservoir properties and the operational details of the doublet can affect the thermal breakthrough time.
Reservoir cooling can be effectively minimized by increasing the distance between recharge and pumping wells; however, the short distance between geothermal wells can help maintain pressure within reservoirs (Rybach, 2003). Therefore, the locations of production and recharge wells should be properly planned and optimized to maintain reservoir pressure and avoid thermal breakthrough (Li et al., 2016; Liu et al., 2020). In addition to the wellbore layout, the feasibility and sustainability of a doublet-well geothermal system also depends on its power, that is, on the water yield and the temperature difference between the produced and injected water and its operational lifetime. In summary, to maintain the sustainable development of geothermal resource utilization and reservoirs, a reasonable and optimized wellbore layout and recharge/pumping scheme is necessary.
Research area
Shandong Province is rich in geothermal resources in China, with four geothermal areas. According to Li's study, more than 73% of Shandong's geothermal resource reserves are in the northwestern depression geothermal district (Li, 2016). Lying in the Linqing depression, Dezhou is a geothermal exploitation demonstration city in Shandong Province (Chen et al., 1994; Liu et al., 2018; Zhao, 2007). Geothermal exploration in Dezhou began in the 1990s. By 2020, 29% of geothermal wells and 32% of the geothermal heating areas in Shandong were in Dezhou (Luo, 2015) (Figure 1).
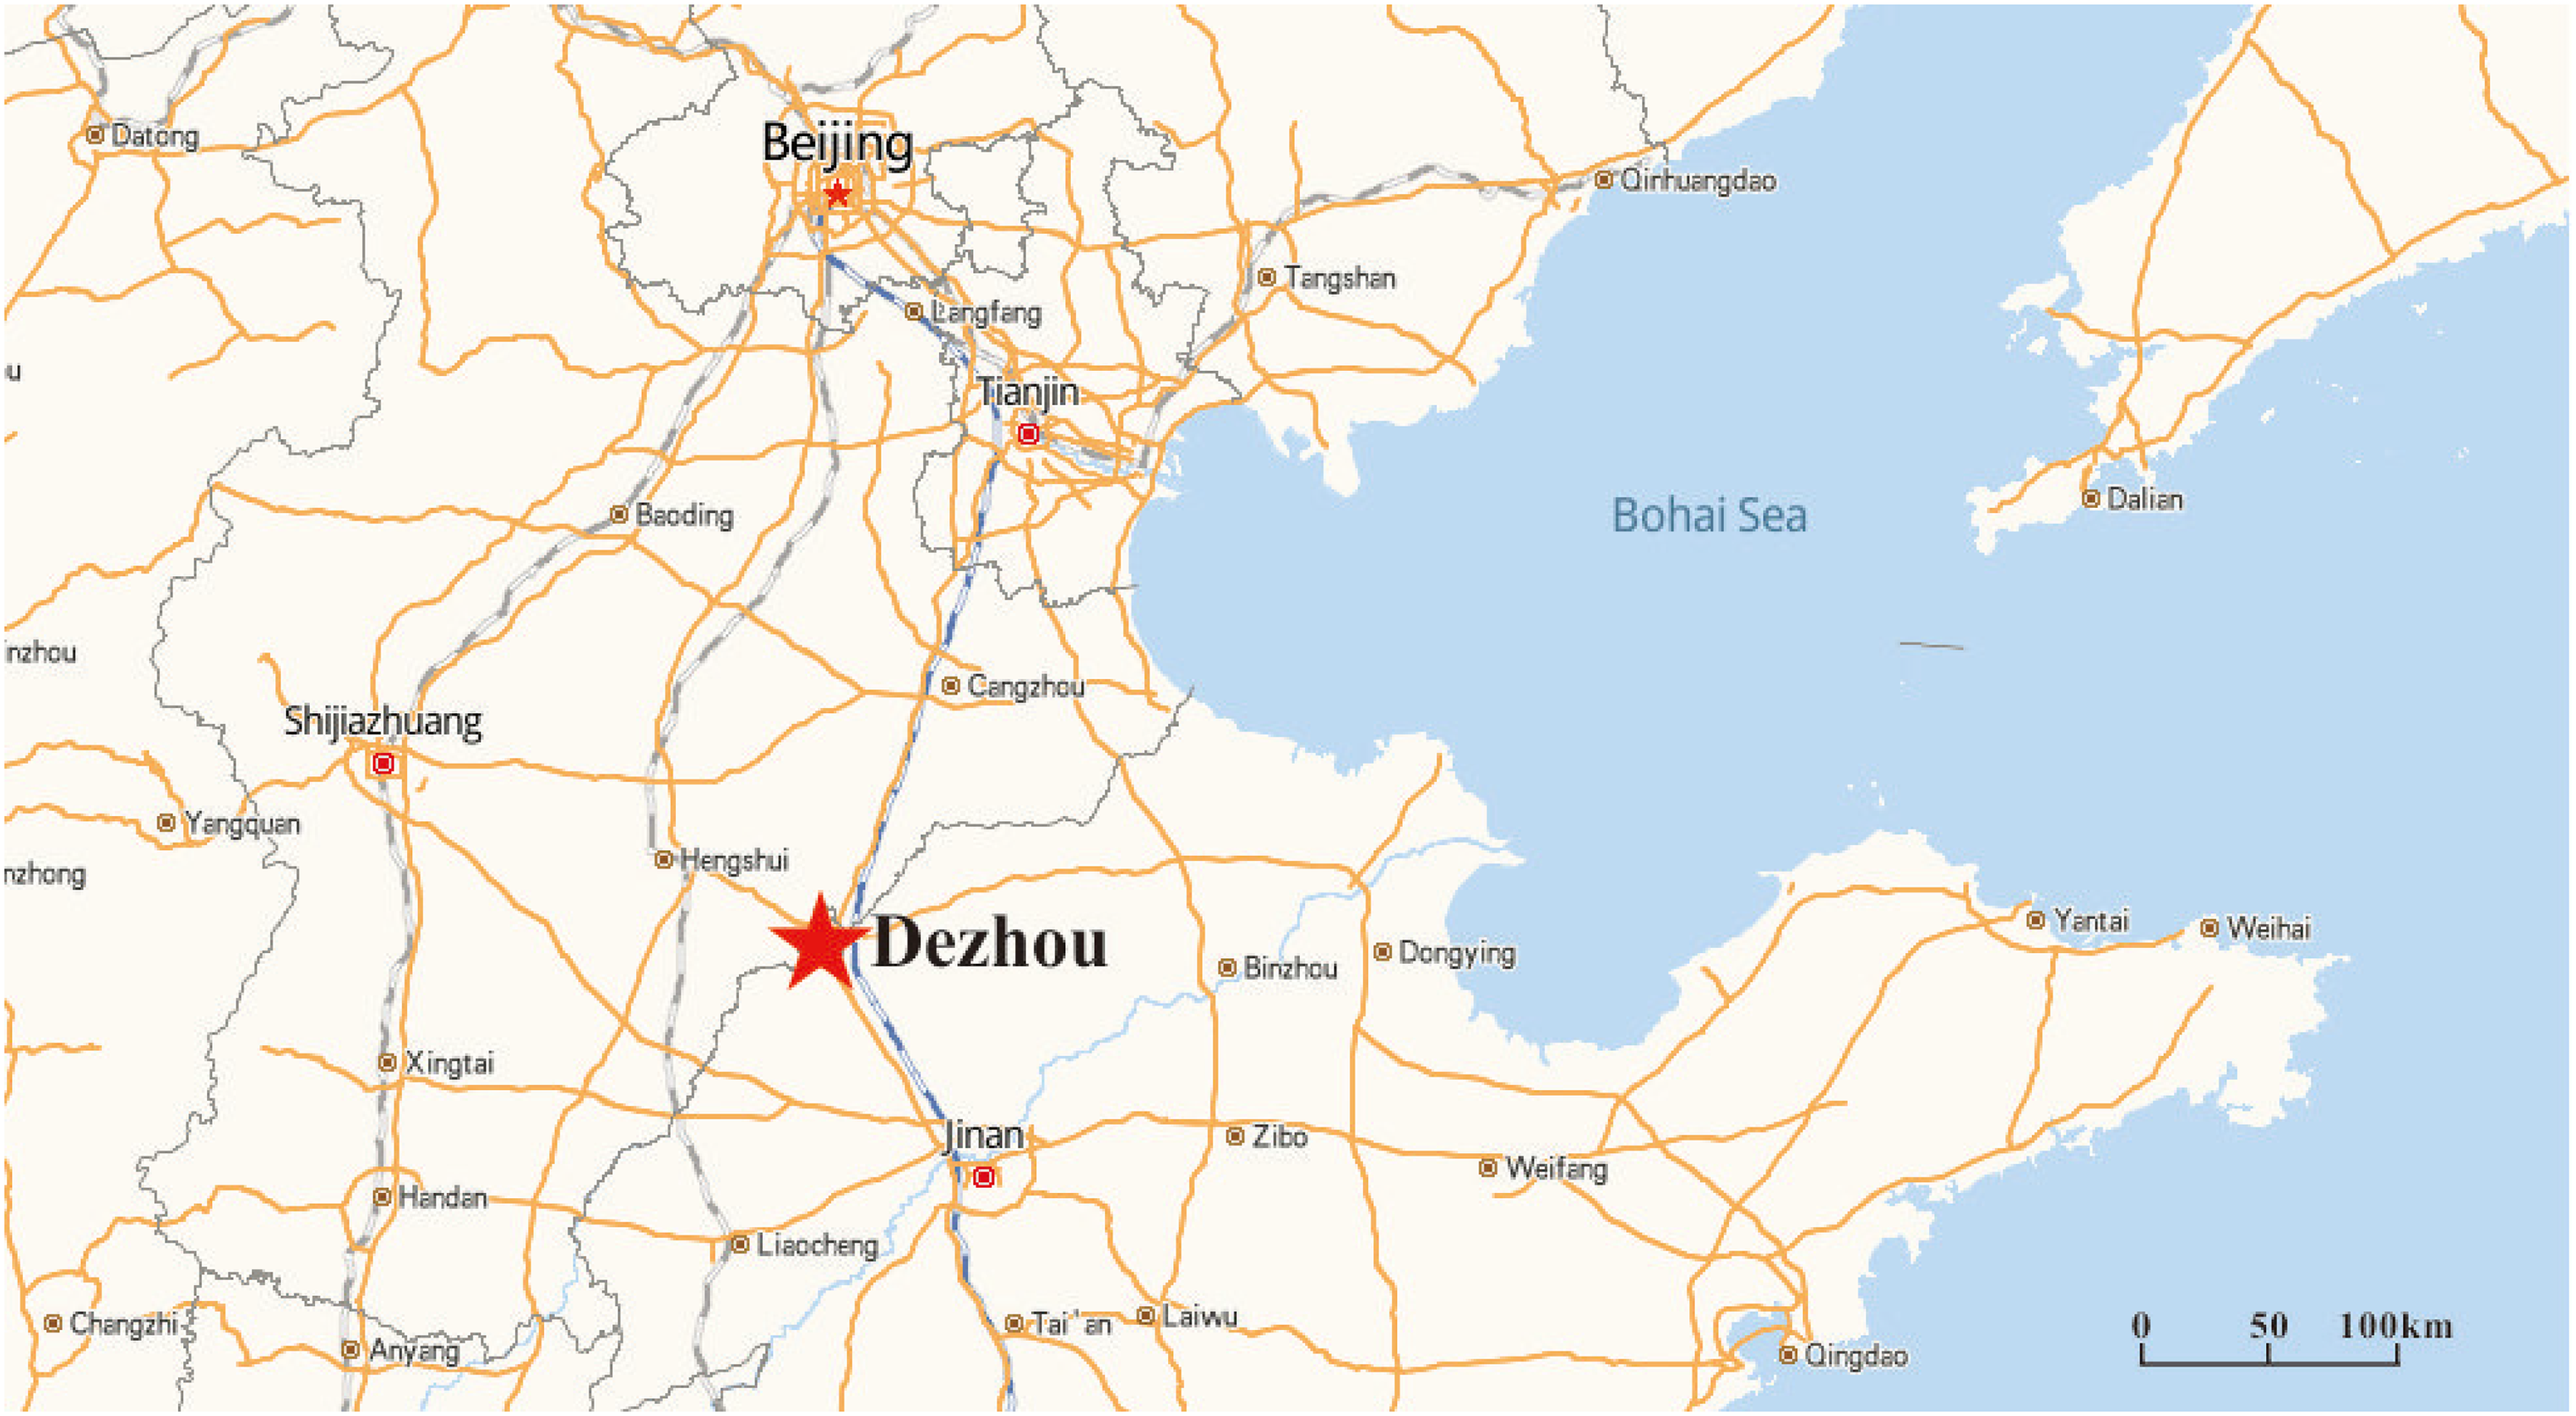
Study area location.
Classified by geothermal reservoir type, over 99% of the geothermal reservoir in Dezhou is stratified, sedimentary sandstone, with little natural water recharge (Li, 2016; Li and Xu 2018b); therefore, artificial recharge is necessary. In 2016, a doublet geothermal system was established in the Decheng district for local winter heating. The heating period in Shandong Province is from November 15 to March 15, approximately four months a year, and the other eight months remain for heat recovery. Currently, it has been in stable operation for 4 years and many field-measured data have been acquired.
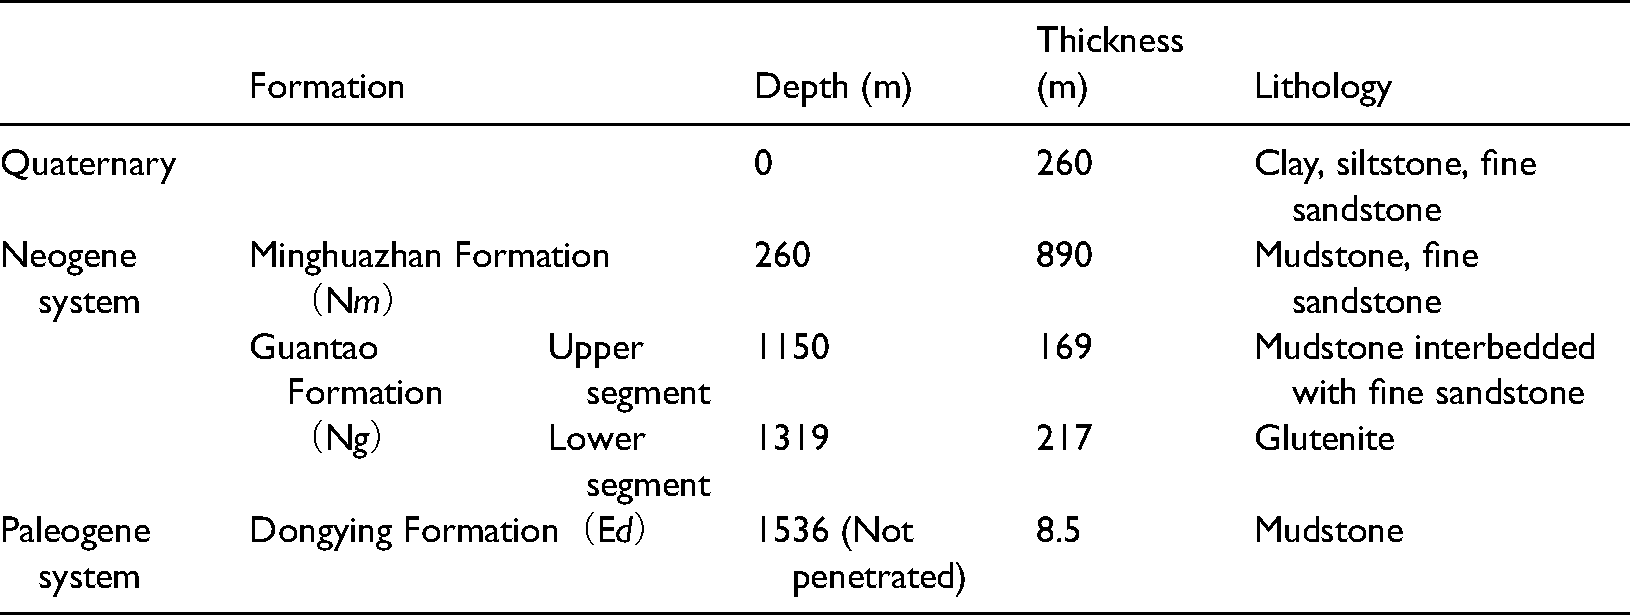
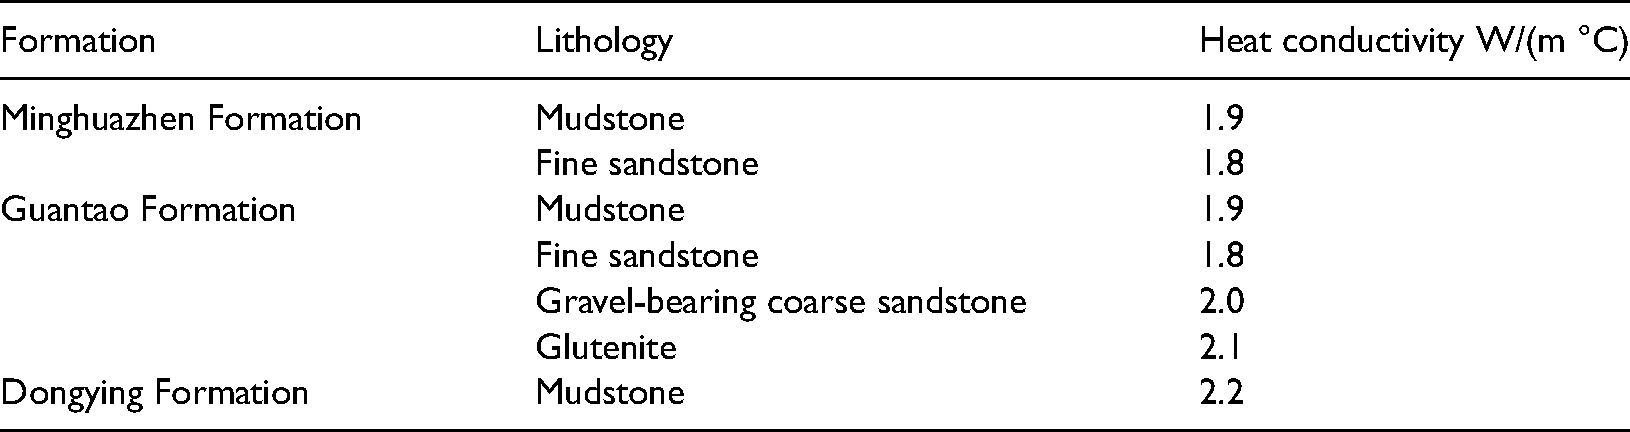
The stratigraphic sequence revealed by the borehole from the ground surface to the bottom of the section is the Quaternary Minghuazhen Formation, Neogene Guantao Formation, and Paleogene Dongying Formation. The Guantao Formation, which is considered to have the highest geothermal potential in this area (Chen and Huang, 1987; Ma et al., 2007; Tan et al., 2017; Zhao, 2013), is the target geothermal reservoir in this study. The heating experiment data reveal that the outflow temperature can reach 54.3°C to 55.7°C, and the flux rate ranges from 60 to 70 m3/h. Meanwhile, the chemical analysis results suggest that the type of outflow water is Cl–Na dominant (Ma et al., 2007; Qin and Zhang, 2018; Zhang and Wang, 2015; Zhao, 2013).
Following the lithologic logs collected in the recharge well in this study, the Quaternary strata consist of clay and silty clay, with a thickness of 260 m. The primary lithology of the Minghuazhen Formation is sandstone with a thickness of 890 m. The target reservoir, the Guantao Formation, can be divided into two segments based on the distinct sedimentary cycle structure (Qin and Zhang, 2018; Tan et al., 2017). The upper Guantao Formation consists of mudstone interbedded with fine sandstone and gravel-bearing coarse sandstone, while the lower segment is mainly composed of glutenite. Therefore, a large difference exists in the permeability of the rocks. The lower part, at a depth of 1319 to 1536 m is often regarded as a geothermal reservoir. The recharge well reaches a depth of 1544.5 m, running through the entire lower segment of Guantao Formation and entering the Dongying Formation (Table 1).
Stratigraphic sequence of recharge well in the research area.
Based on the field measurement data obtained from the doublet-well geothermal system, we intend to predict the temperature evolution and assess the system sustainability for a lifecycle of 100 years. Furthermore, this study attempts to design rational recharge/pumping rate schemes for different well-spacing situations, providing references for future heat exploration of the Guantao geothermal reservoir in Dezhou City.
Simulation approach
Simulation code
The fully coupled wellbore–reservoir simulator T2Well was employed to describe the fluid and heat flow processes in both the wellbore and reservoir (Pan and Oldenburg, 2014). T2Well was developed by introducing wellbore flow equations into TOUGH2, which is now widely used for non-isothermal multi-phase flow in porous and fractured media. In this study, some improvements were made. The EOS1 module, which is specifically designed for hydro-geothermal modeling, was incorporated into T2Well. In addition, a parallel computing version was developed following the parallel strategy introduced by Feng et al. (2017), which could deal with the enormous computational burden caused by large numbers of mesh grids.
Government equations
Conservation equations
The most fundamental governing equations are conservation equations for mass and energy. The general form can be expressed as equation (1). It includes three terms: accumulation (M), flux (F), and source/sink (q).


The accumulation and flux terms for energy balance are relatively complex. The accumulation term for the reservoir includes the internal energy of fluid and rock matrix, as equation (4). The flux term includes fluid advection, heat conduction, and the work done by fluid, as equation (5), in which the internal energy and work can be expressed as the specific enthalpy, 


Flow equations
Different flow-governing equations are applied to different domains. Darcy's law, equation (9), is applied for the flow in the reservoir, and the momentum conservation, equation (10), is used to describe the flow in the wellbore. For the momentum equation, 

Parameter calibration
There is a large amount of measured data from the in situ test, which is helpful for thermo-physical parameter estimation. Rock permeability and thermal conductivity are the most significant parameters for fluid and heat flow, and can be calibrated by fitting the pressure and temperature log curves. The results may not be accurate, but the scope can be determined.
Thermal conductivity
The temperature logs shown in Figure 2 were obtained from the Jianianhua borehole near the pumping well. Five temperature measurements were taken in the borehole from 2 November 2019, to 2 August 2020. It could be seen that the temperature above 100 m depth was strongly affected by the seasonal temperature variation and was excluded in the following calibration work. Among the measured data, the measurement taken on 2 August 2020, was least affected by the heating season (from 15 November to 15 March of the following year); hence, it was chosen as representative for the calibration simulation.
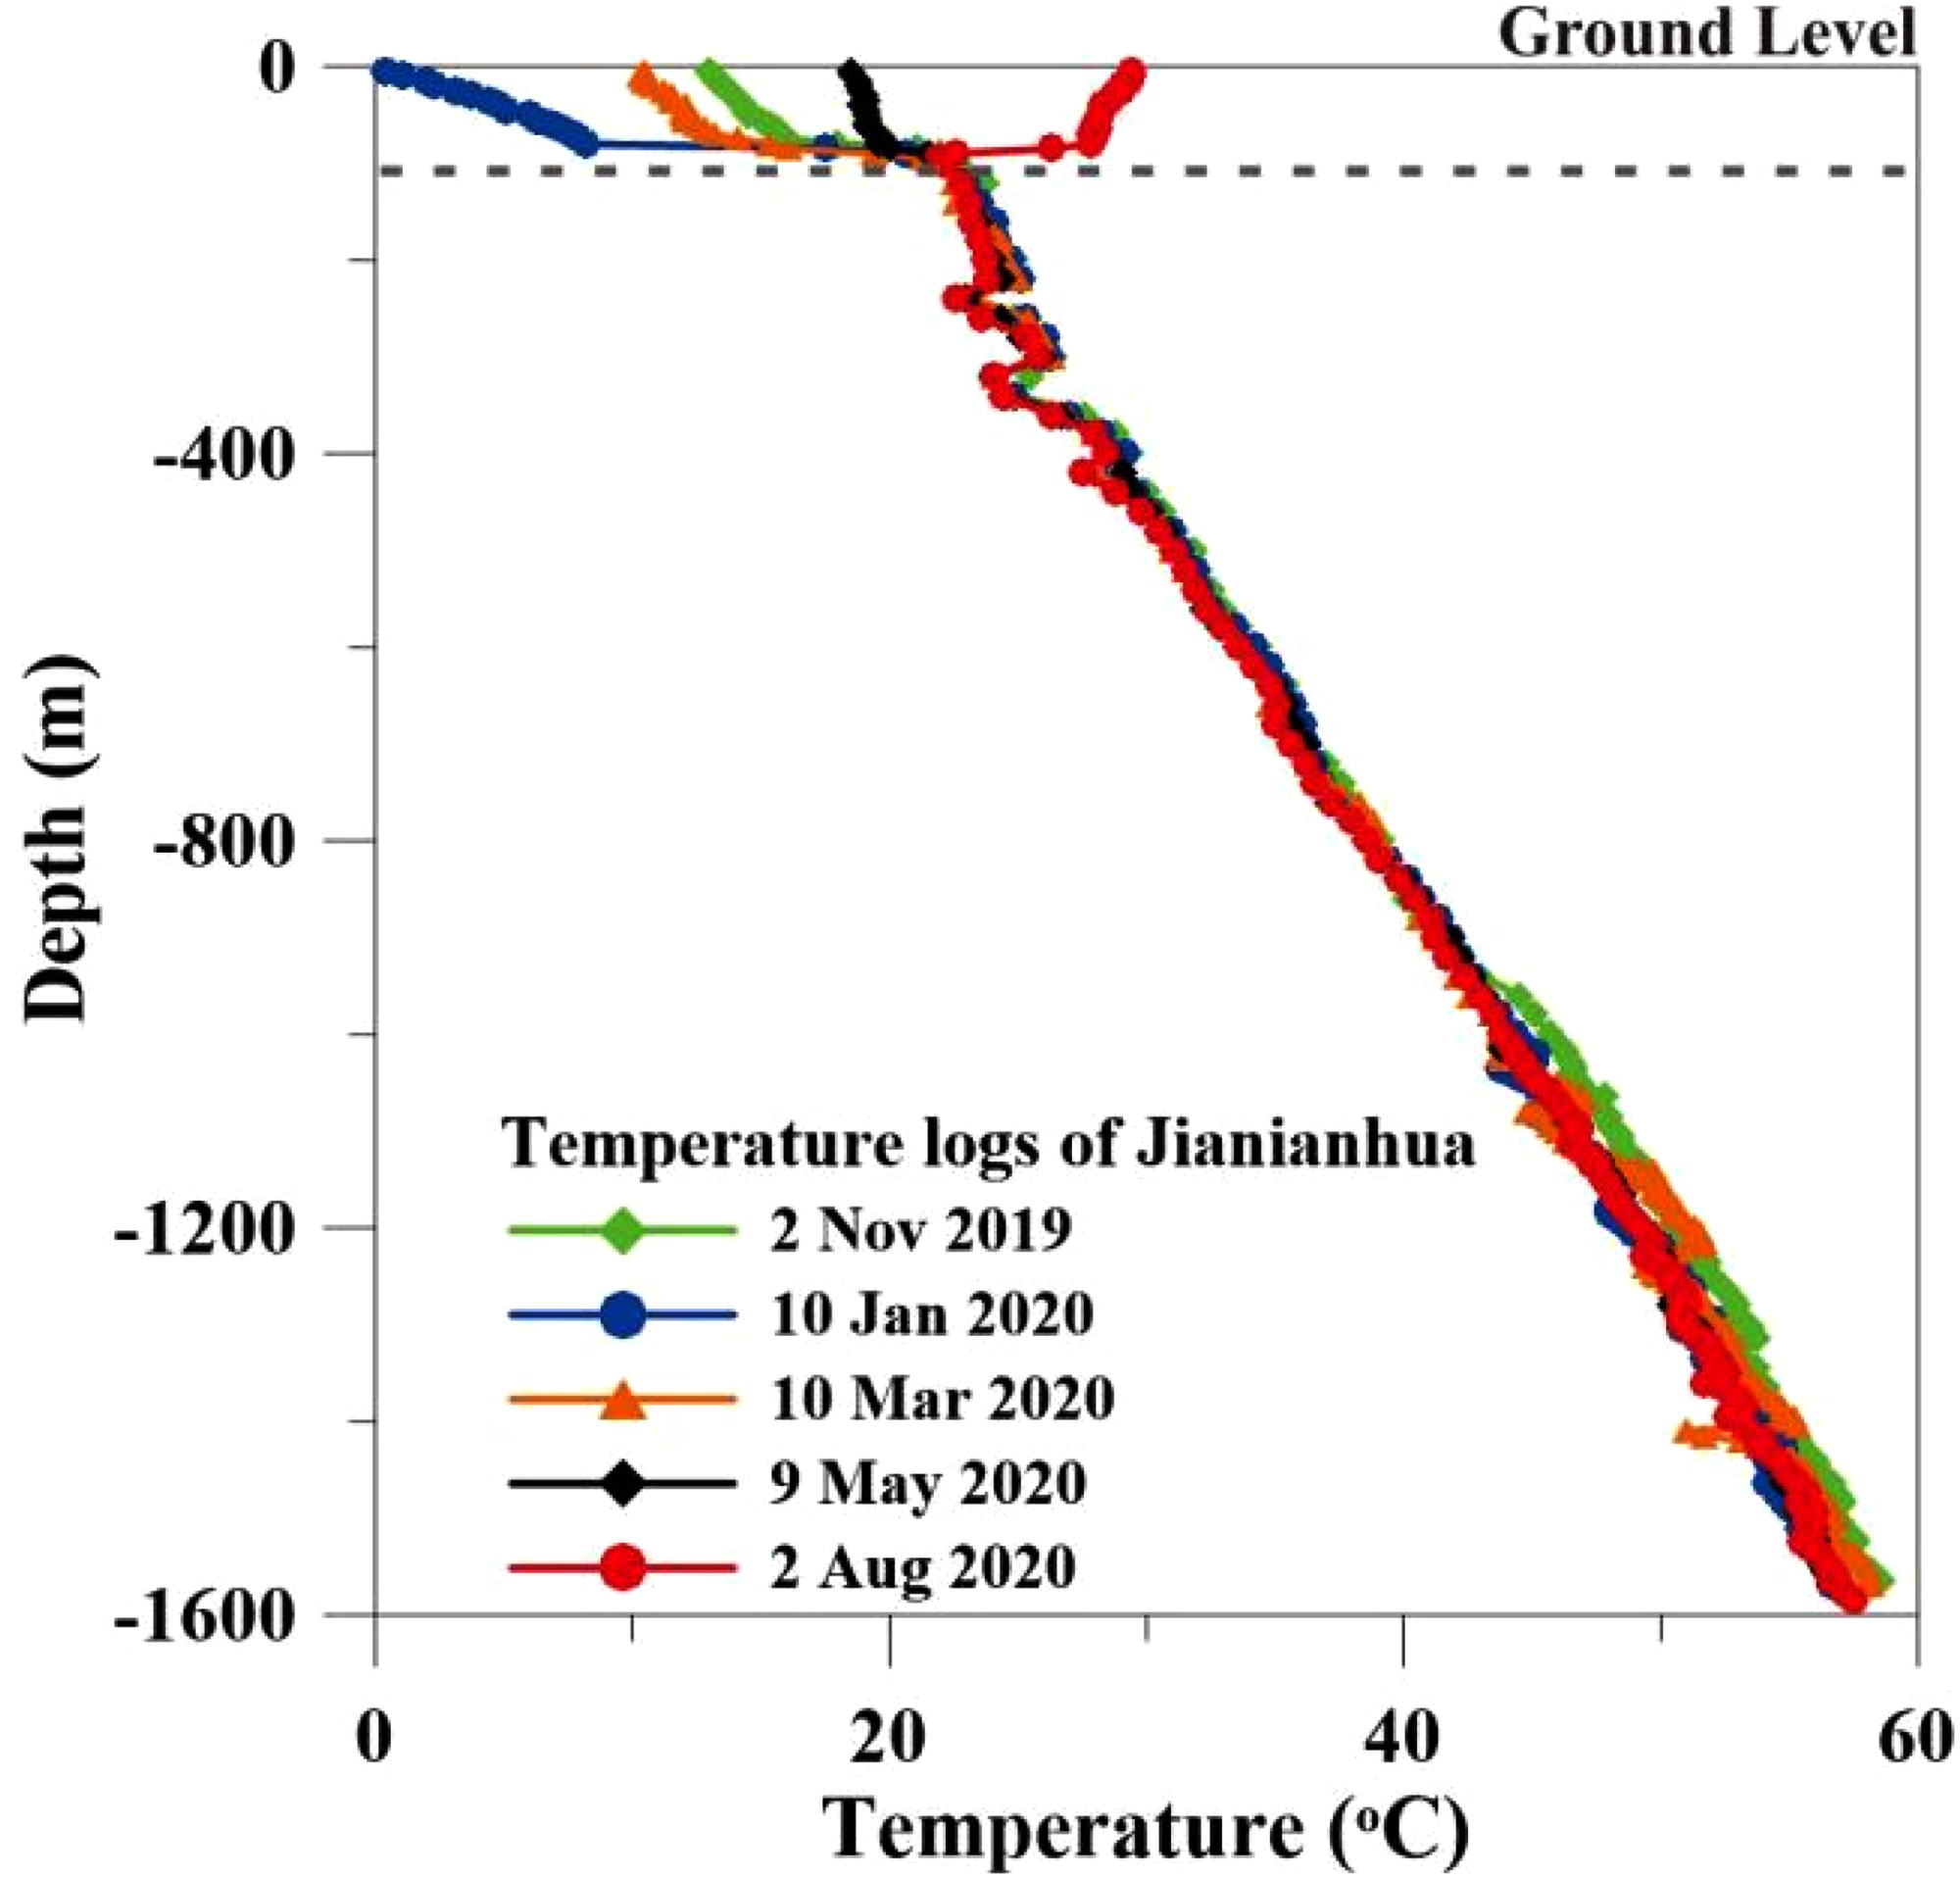
Temperature logs of the Jianianhua borehole from November 2019 to August 2020.
The temperature log along the wellbore will help build the temperature field and estimate the thermal conductivity of each formation layer. The sedimentary rock layers are sub-vertical, and the natural flow field is weak, whose influence on the temperature log can be neglected (Chen and Huang, 1987). Hence, the model can be simplified as a one-dimensional (1-D) vertical rock column static model under natural conditions.
Based on the stratigraphic sequence and lithologic distribution mentioned in Section 1, the 1-D column model was discretized into 82 modeling layers from the surface to a depth of 1585 m. The temperature below the annual temperature variation zone was approximately 22.5°C, and the bottomhole temperature was measured at 57.2°C. Thus, the average temperature gradient was estimated at around 2.39°C/100 m (Figure 3).
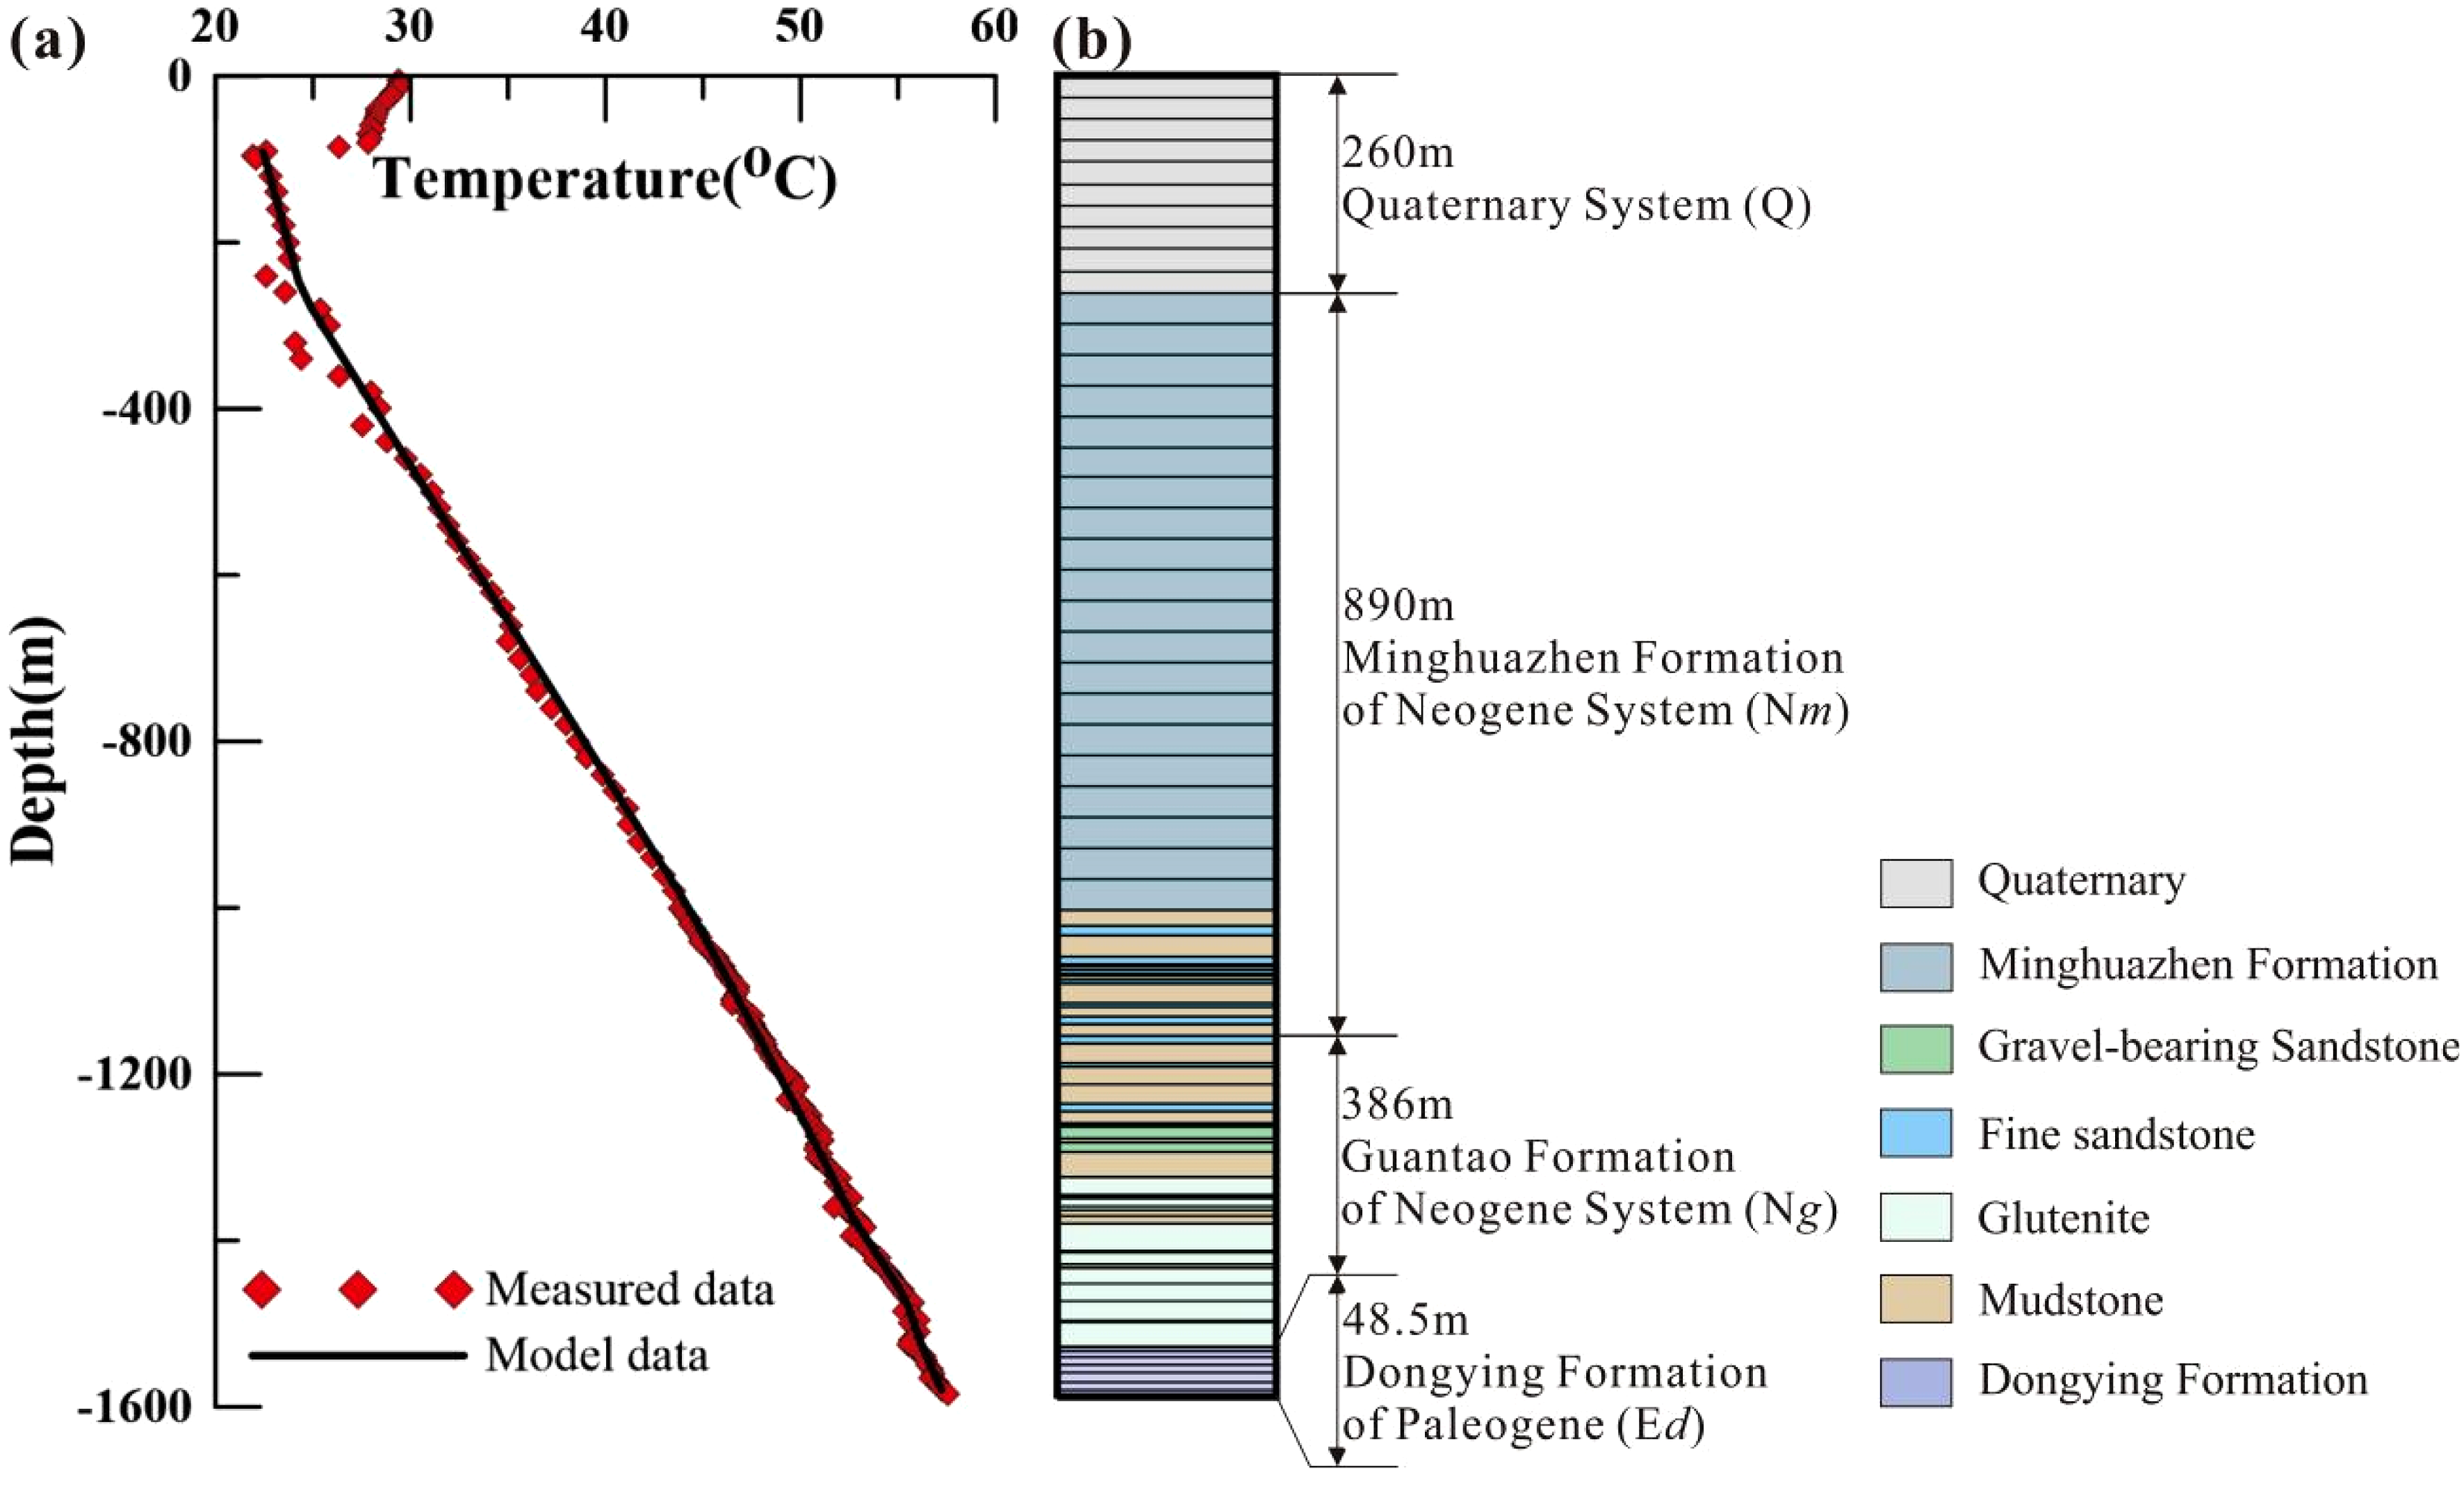
Temperature logs of the Jianianhua well and the temperature distribution with calibrated heat conductivity as listed in Table 2 (a). Lithology logs in the study area (b).
Calibrated thermal conductivity values of each rock formation.
The resulting temperature profile is shown in Figure 3 by adjusting the thermal conductivity to fit the temperature log. The resulting temperature profile is shown in Figure 3. The root-mean-square error is 1.10, and the coefficient of determination R2 between the model and measured data is 0.99, which proves the reliability of the calibrated values. The calibrated thermal conductivities of each layer are listed in Table 2.
Permeability
Overview of pumping test
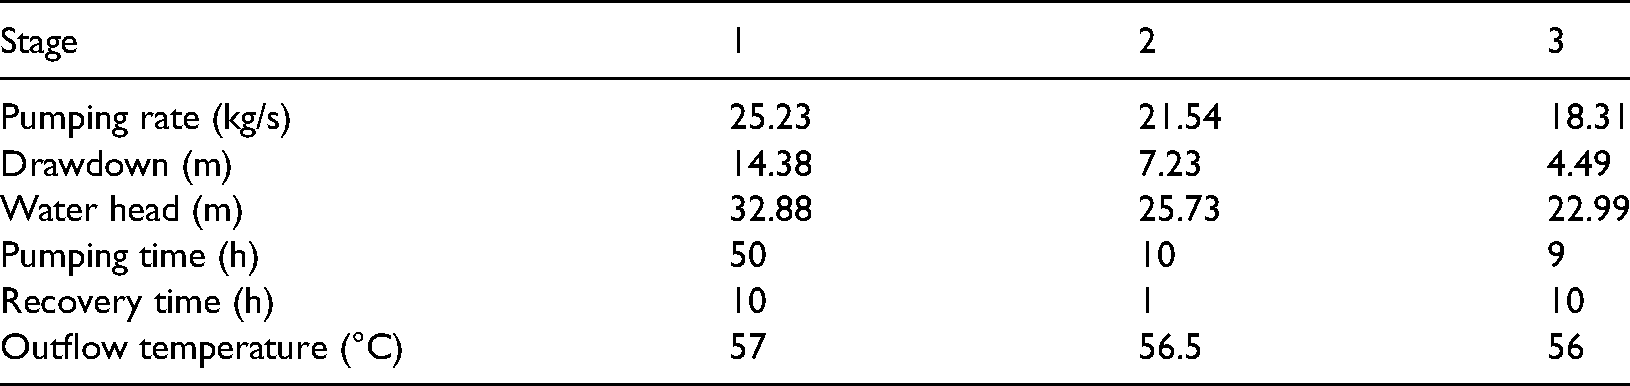
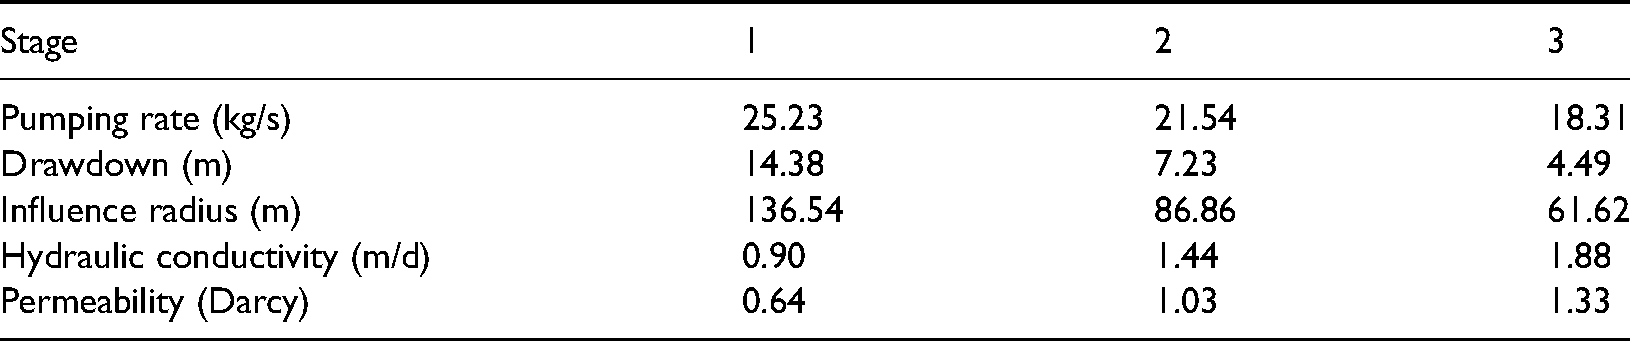
To quantitatively assess the reservoir permeability, a series of pumping tests were performed using the recharge well mentioned in Section 1. The pumping test lasted for 90 h, with three different pumping rate stages, 25.23, 21.54, and 18.31 kg/s, with corresponding drawdowns of 14.38, 7.23, and 4.49 m. Detailed parameters are listed in Table 3.
Parameters of the three-stage pumping test.
The recharge well was partially hydraulically perforated and open to the reservoir, at depths of 1343.4–1354.64 m and 1366.4–1524.74 m. The rest of the wellbore was closed (uncompleted). Under the assumption of homogeneity and isotropy, the Babushkin formulation (Babushkin et al., 1975) can deal with an uncompleted well in a confined aquifer, which can consider the effect of the top and bottom aquitards on the water flow. The Babushkin formulation can be written as
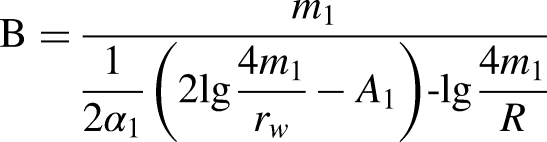
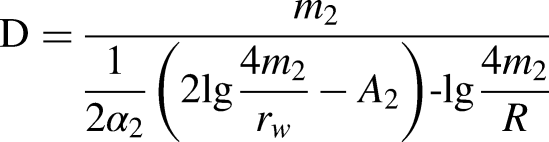
where K is the equivalent hydraulic conductivity; m1 and m2 are the distances from the perforation center to the top and bottom of the reservoir, respectively;
A is a function of 
The calculation results are presented in Table 4. It can be seen that the permeability calculated at different stages varied. Under the assumption of homogeneity, a linear relationship should be present between the pumping rate and drawdown (Equation (11)). However, the pumping test data deviated from the line. A higher pumping rate corresponded to a lower permeability (Table 4). Combined with other pumping tests in this geothermal area, the phenomenon is not unique but is a general outcome. The general pump rate to permeability relationship exhibits an approximate quadratic relationship in this area rather than a linear relationship (Figure 4).
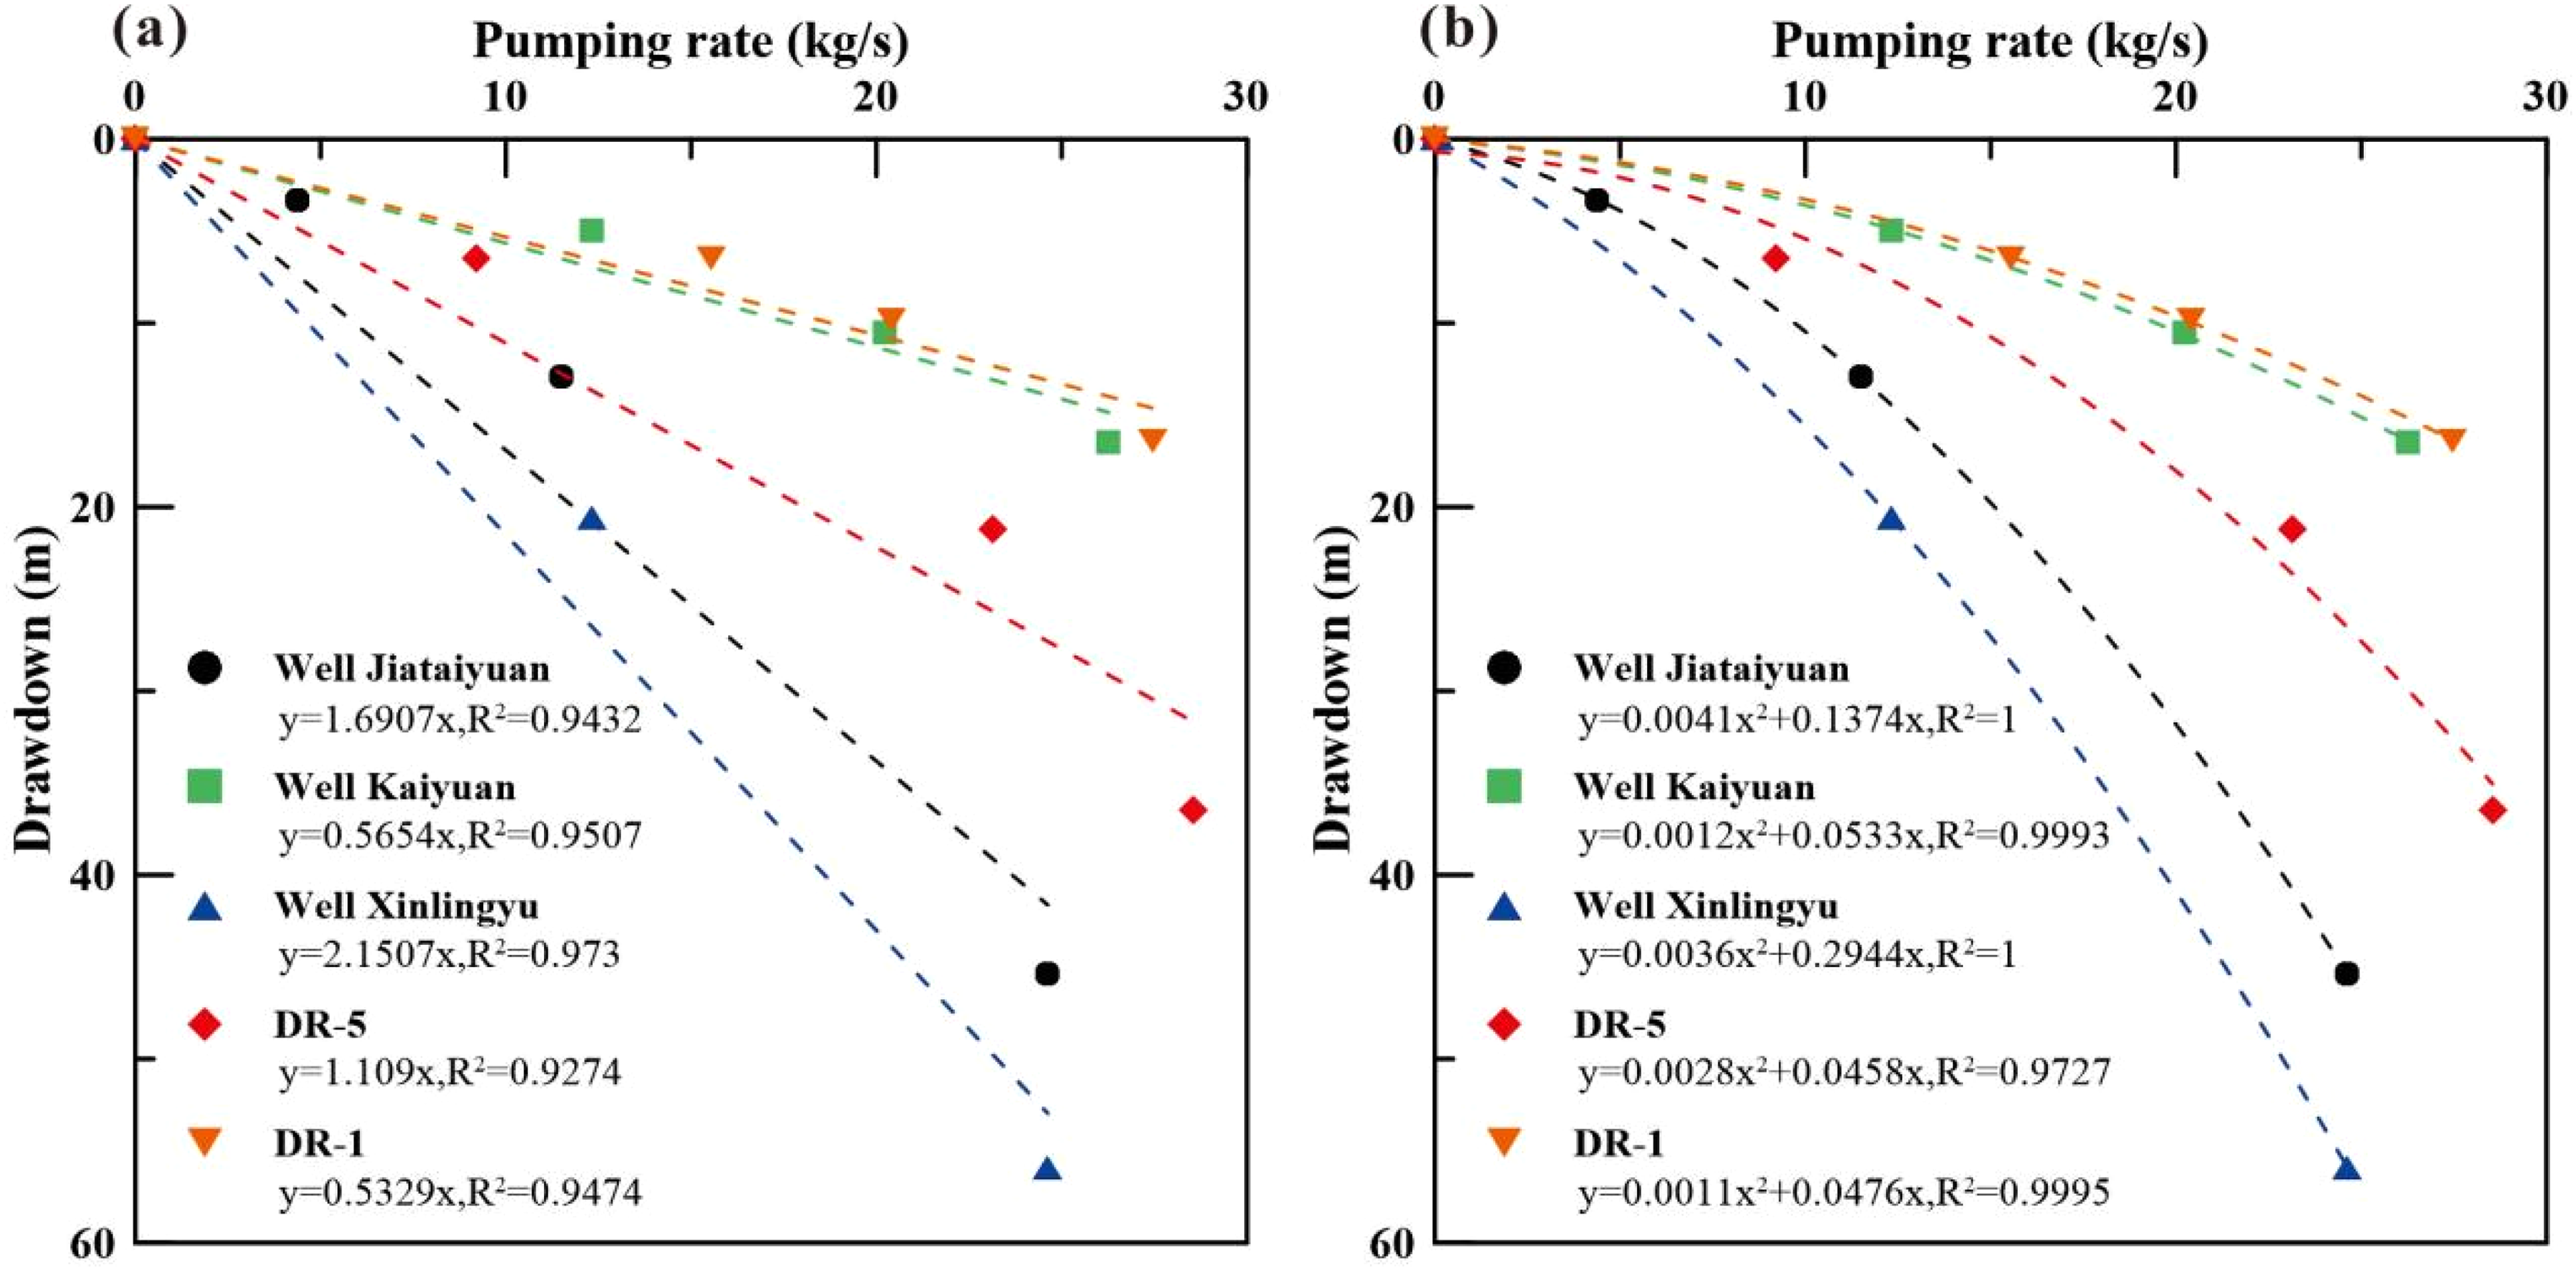
Linear (a) and quadratic (b) fitting between pumping rate Q and drawdown S in different pumping tests in the geothermal area.
Calculation results of the pumping test
The assumption of homogeneity may be the reason for the differences in the calculation results. With a higher pumping rate, the depression cone has a more significant influence on the shallower part of the reservoir. The higher the pumping rate, the lower the permeability calculated, indicating that the layer located at the bottom has a high permeability. A numerical model was established to verify this inference.
Numerical model
An R-Z 2-D model was built at a depth of 1150–1544.5 m. The well was located at the center, as illustrated in Figure 5. The lateral boundary was 5 km away from the well, far enough to avoid the effect of pumping; thus, it can be regarded as a constant boundary. The cap and base rocks were considered no-flow boundaries, but allowed the heat exchange calculated by a semi-analytical solution proposed by Vinsome and Westerveld (1980). Similarly, the heat exchange between the wellbores and surrounding formation was also considered by a semi-analytical solution, as shown in equation (13) (Ramey Jr, 1962).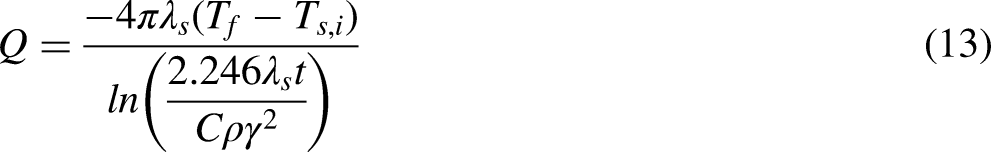
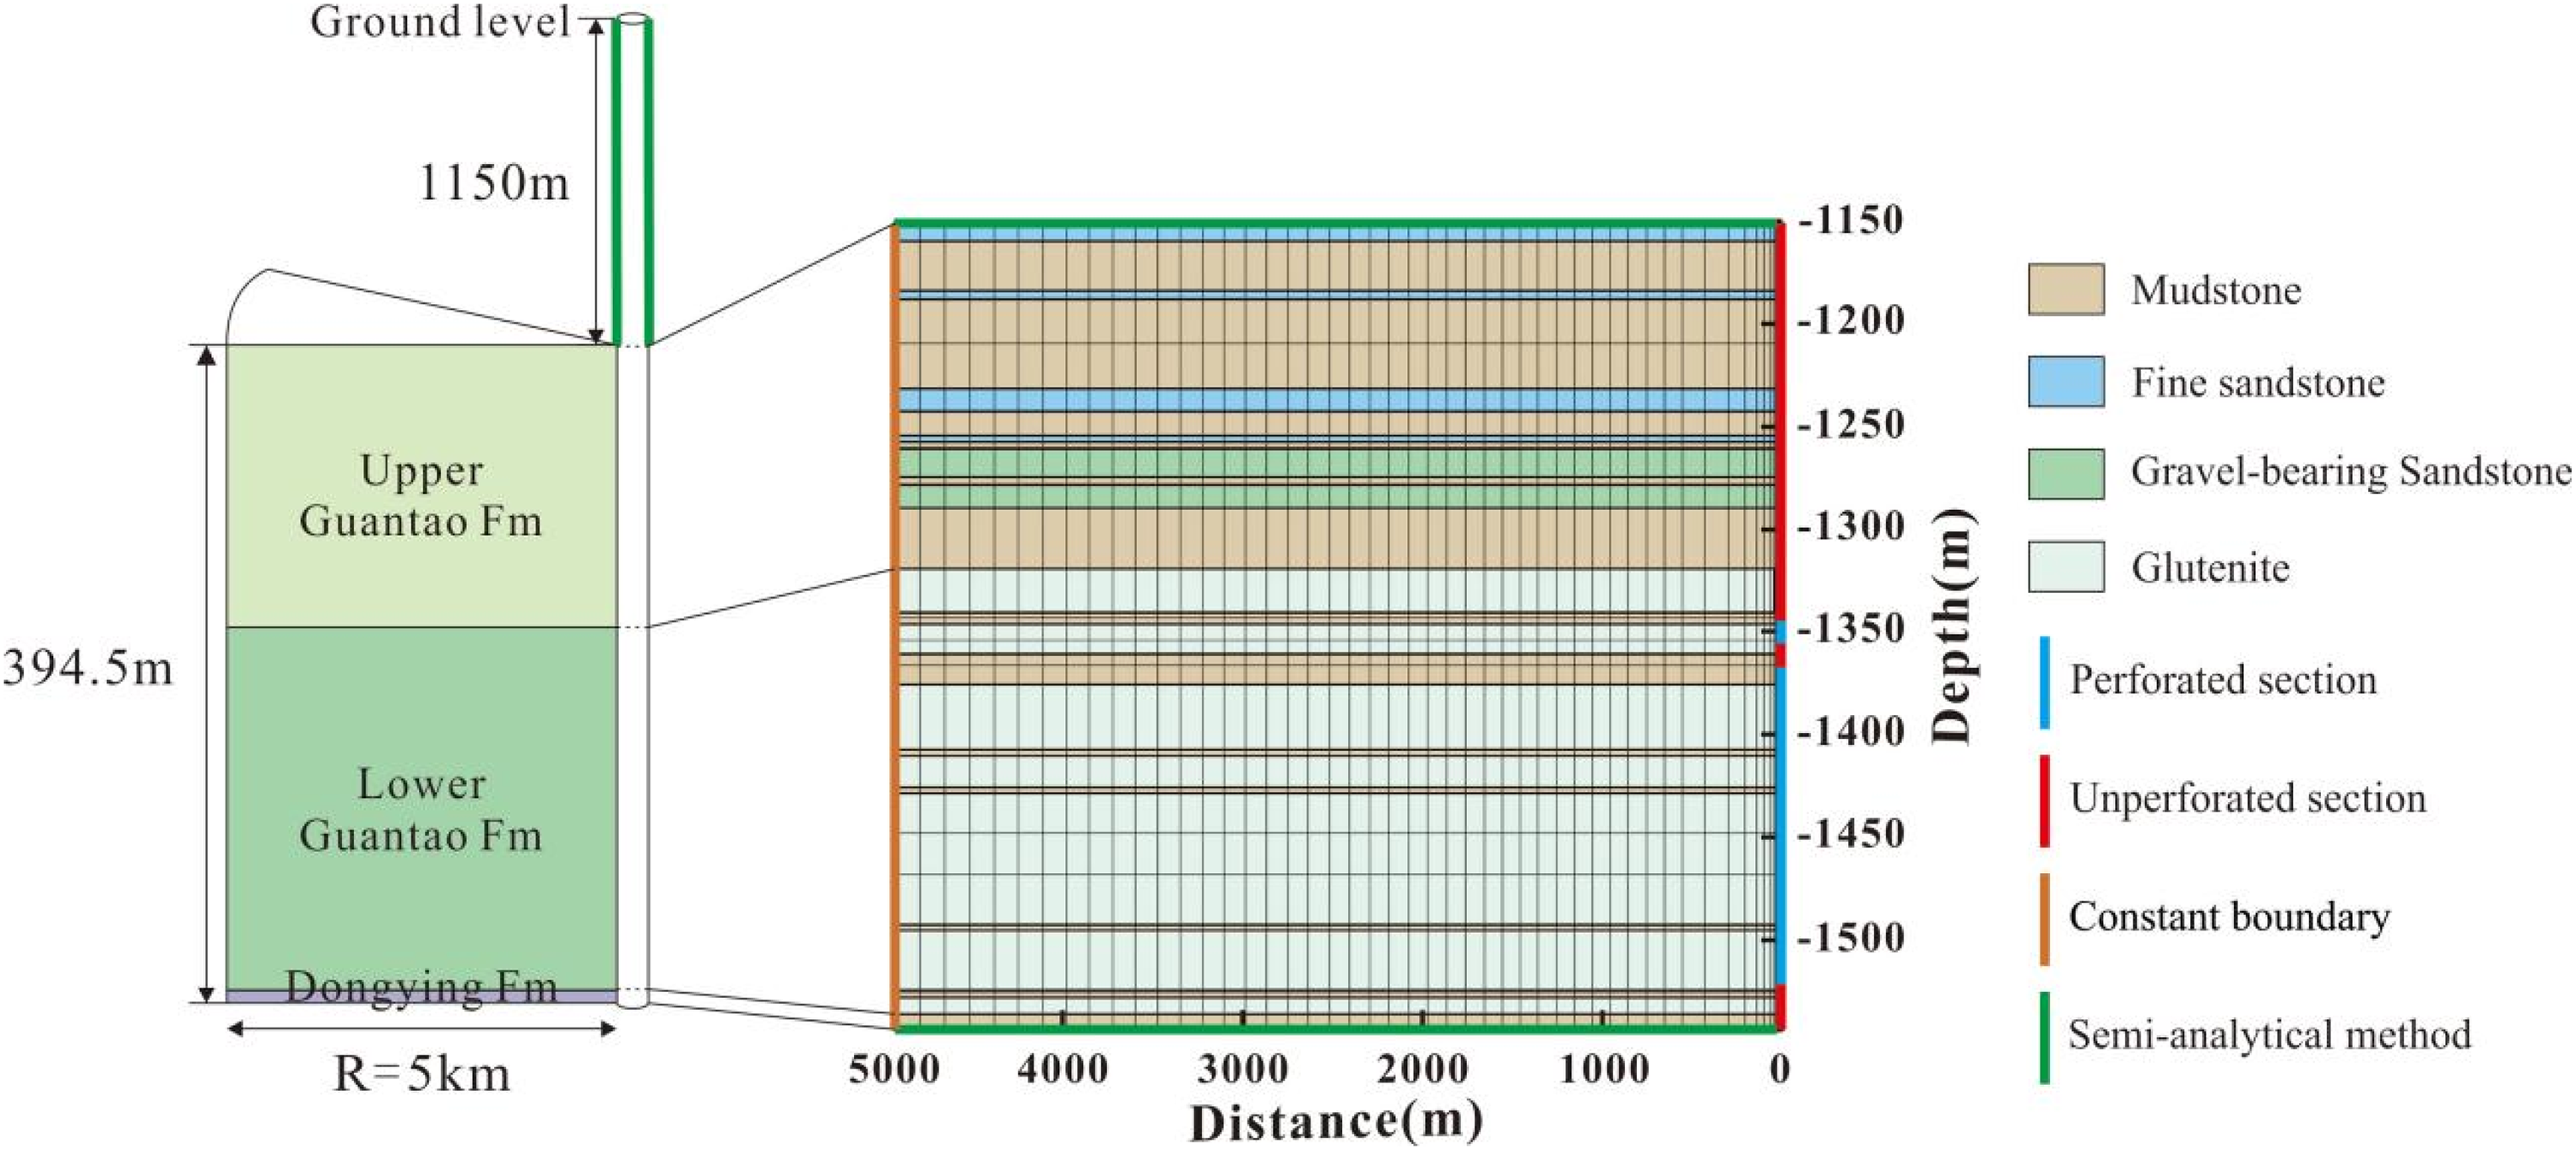
Conceptual model and numerical grid for the pumping test simulation.
The space discretization in the vertical, rock thermo-hydrological properties and initial conditions were inherited from the model above. The first step was to verify the numerical model using the Babushkin equation. Under the assumption of domain homogeneity, using the permeability calculated from the Babushkin equation as an initial guess, the three-stage pumping test was reproduced and compared with the measured temperature and drawdown test data. The results are presented in Figure 6(a).
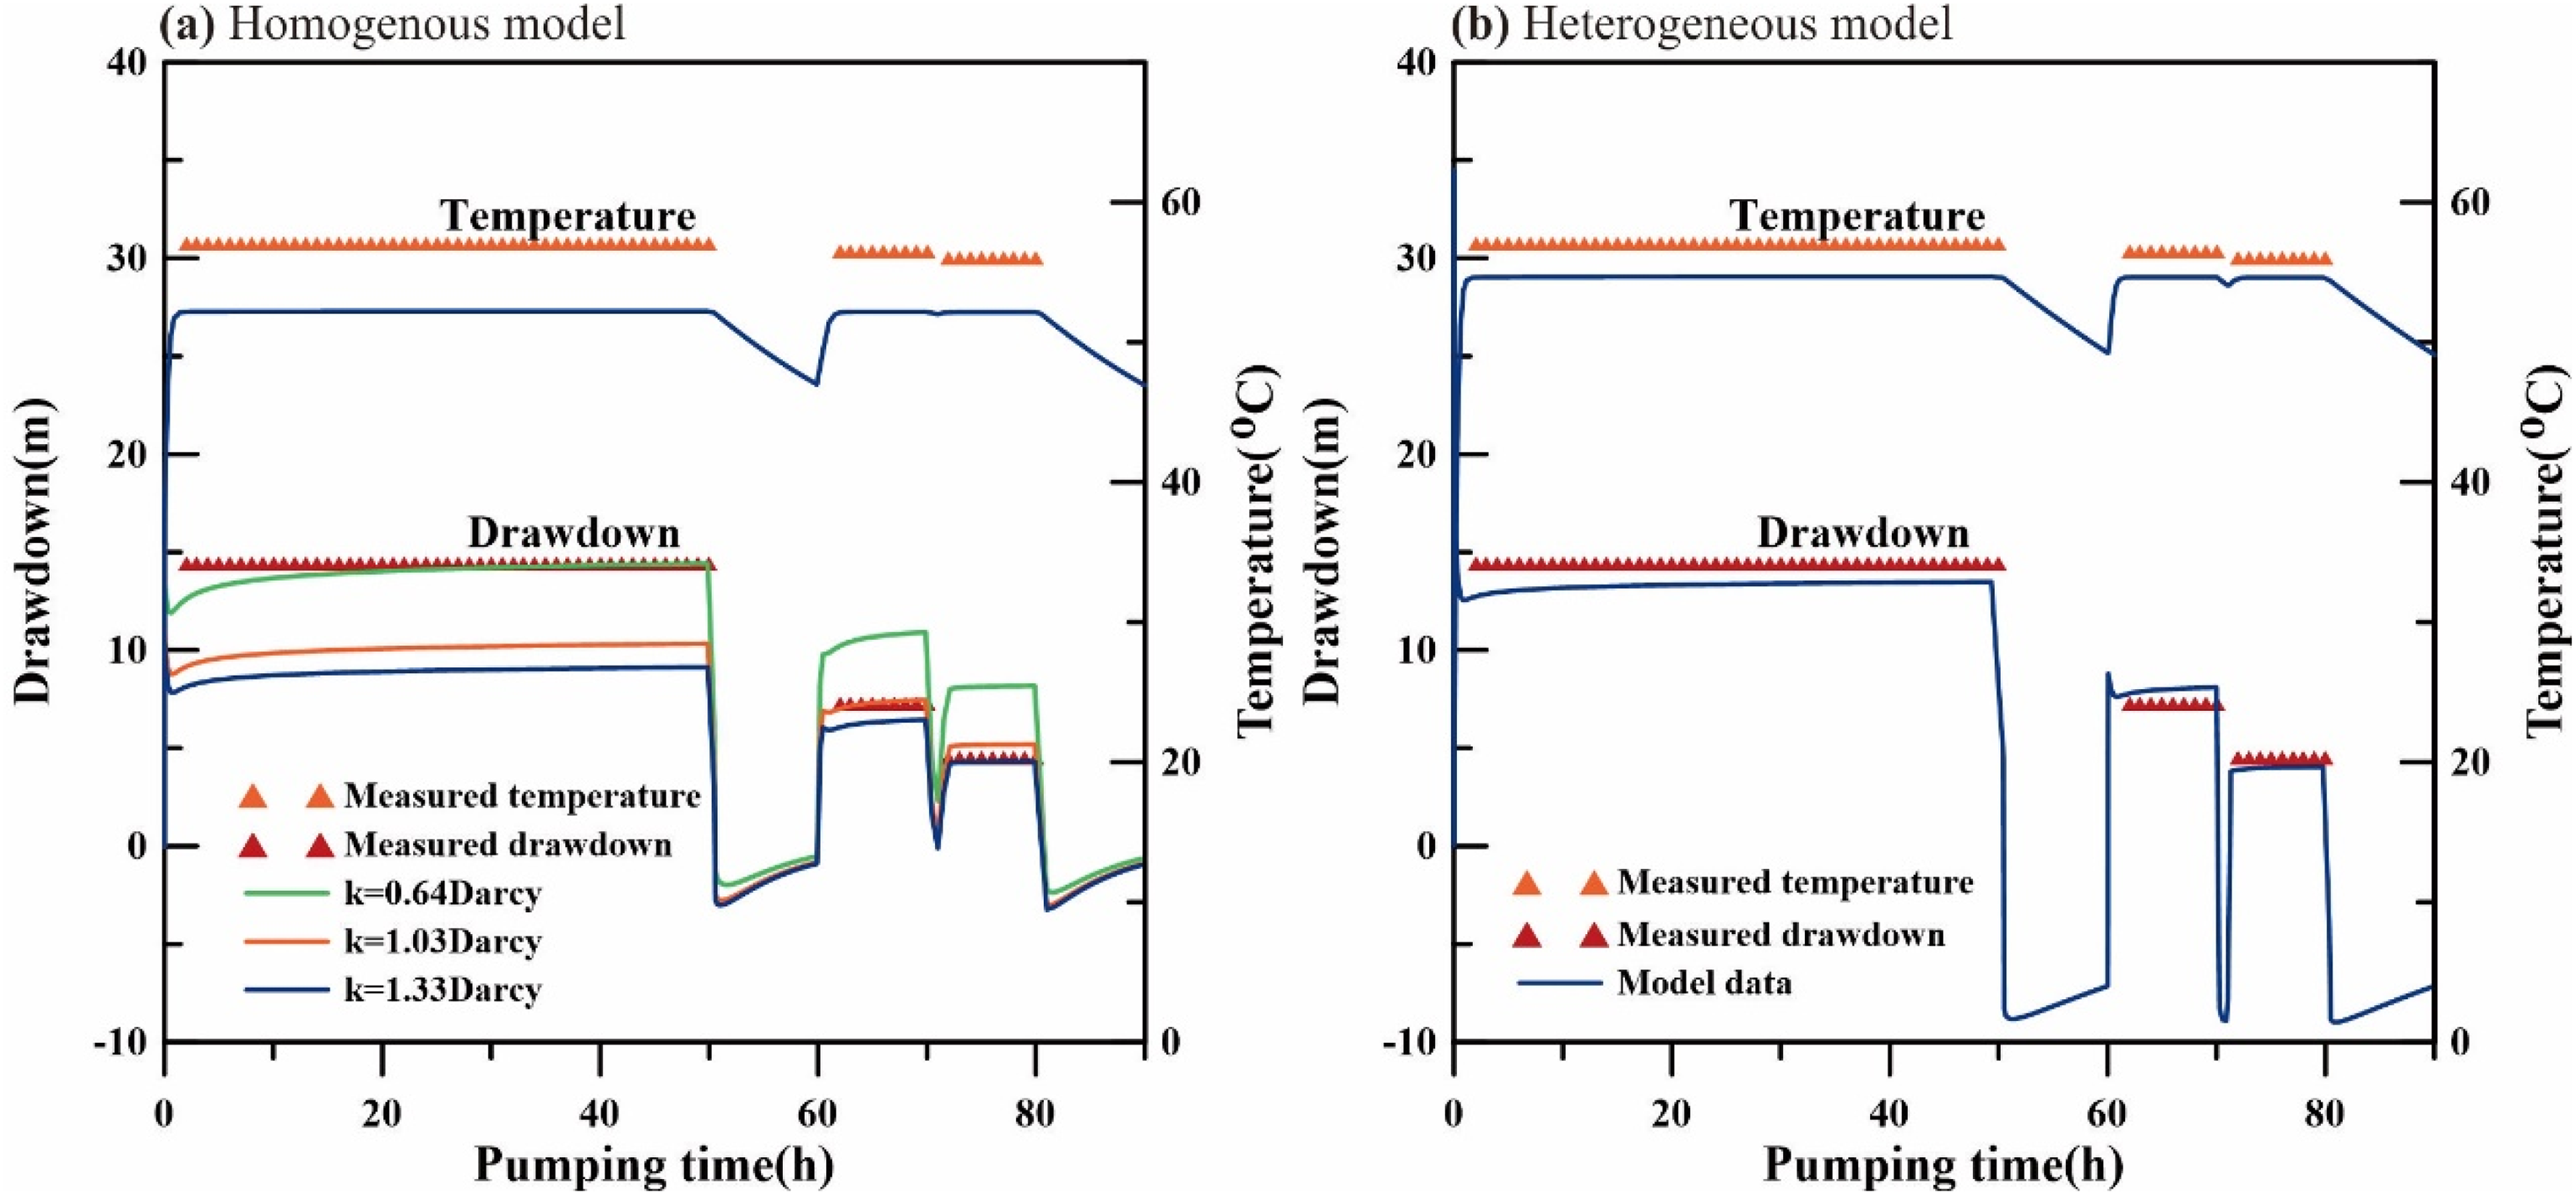
Outflow temperature and the drawdown variation with time in the assumption of homogeneity (a) and heterogeneity (b).
It can be seen that under the three different permeability scenarios, the simulated drawdowns fit the measured data well in each stage, demonstrating the consistency of the numerical model with the Babushkin equation and the model reliability.
The outflow temperature was approximately 52°C, which was nearly 5°C lower than the measured value, implying that more water came from the deeper and higher temperature layers. Based on this inference, a heterogeneous model was established. Heterogeneity was assumed to exist only between the different geological layers.
The permeabilities were calibrated by fitting the drawdowns and outflow temperatures. Based on the properties shown in Table 5 and Figure 7, the simulated drawdown fit reasonably well with the measured data (Figure 6(b)). At this point, the highly permeable layer was located at the depth of 1468–1536 m, with the permeability reaching 4.0 Darcy. Moreover, the outflow temperature rose to approximately 55°C. The simulation results reflect the assumption of a highly permeable layer at the bottom of the reservoir. The calibrated parameters are shown in gray in Table 5. The other permeability values in the model were assigned according to empirical values.
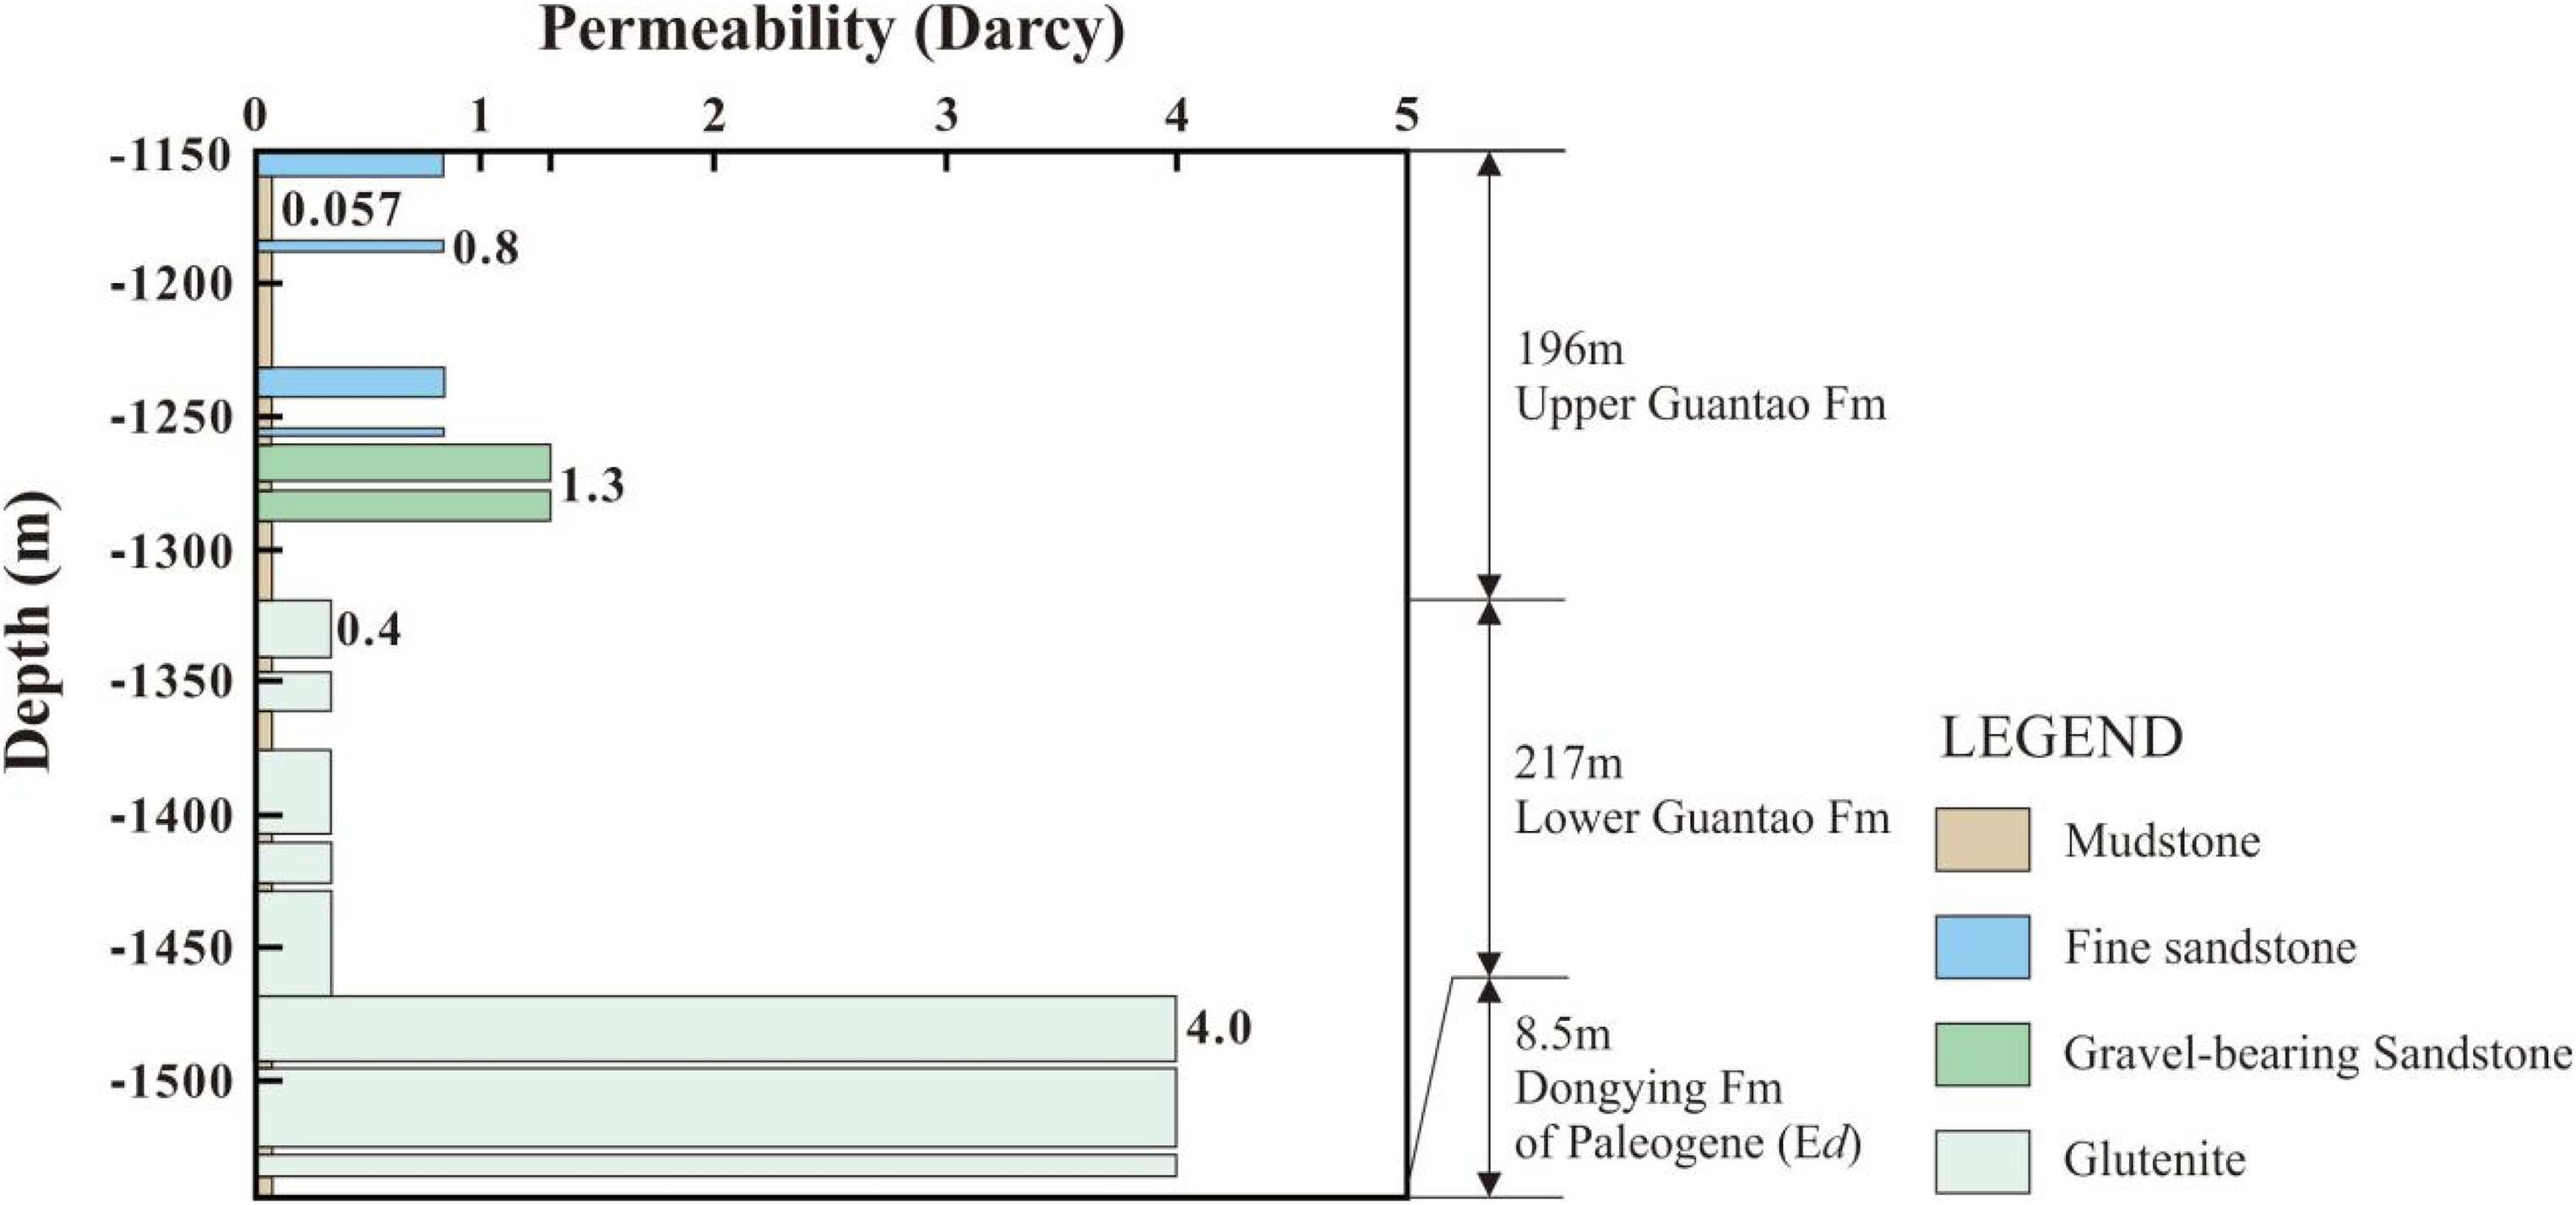
Distribution of calibrated permeabilities of different geological layers.
Calibrated thermal conductivity and permeability in the model (Q: quaternary caprock; Nm: Neogene Minghuazhen formation; Ng: Neogene Guantao formation; Ed: Paleogene Dongying Formation).
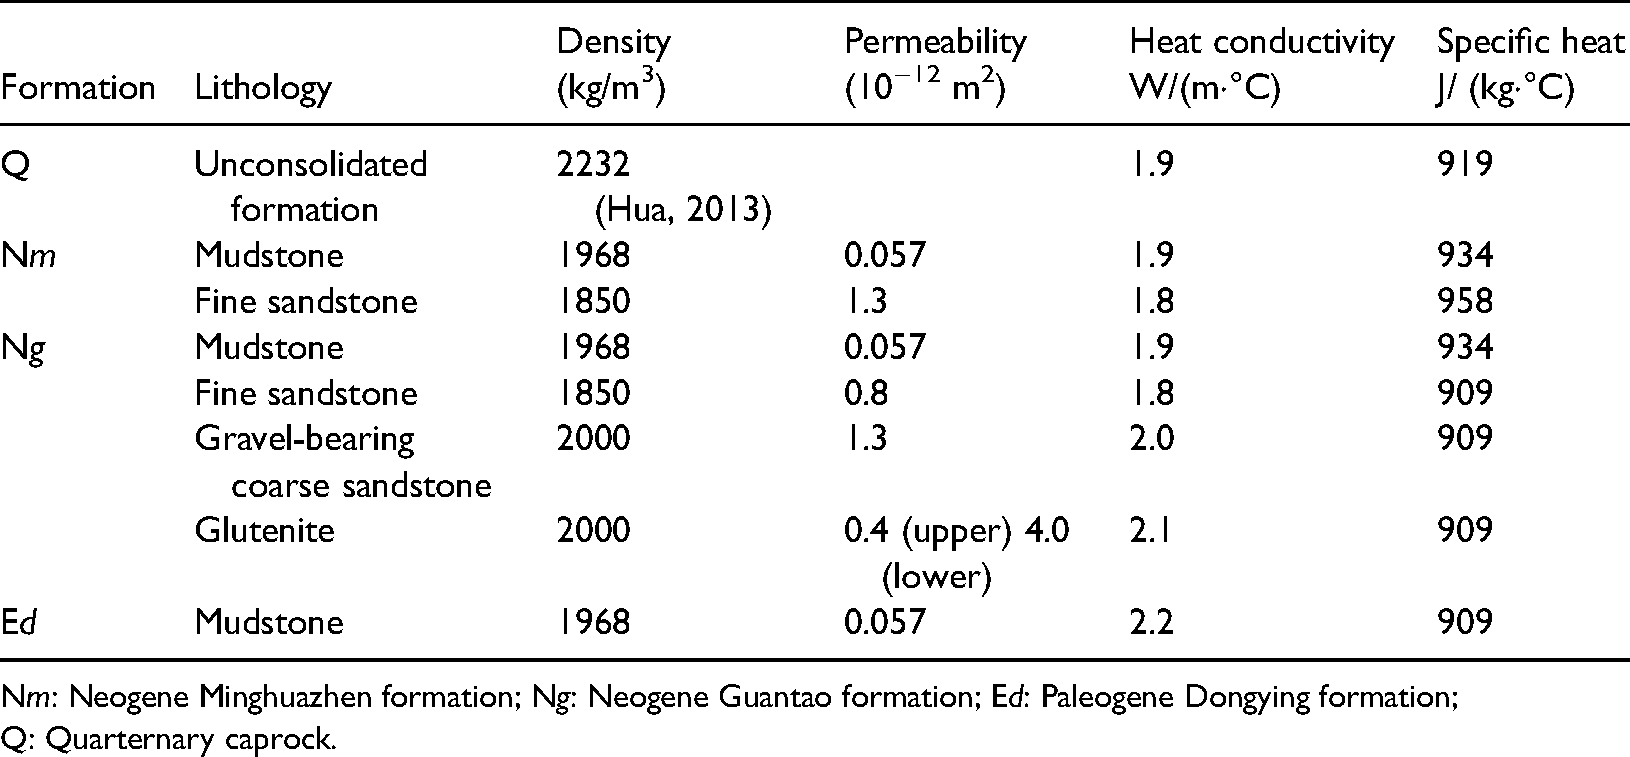
Nm: Neogene Minghuazhen formation; Ng: Neogene Guantao formation; Ed: Paleogene Dongying formation; Q: Quarternary caprock.
Model setup
The thermo-hydrological parameter estimation was based on the recharge (injection) well. A pumping (production) well was drilled 180 m from the recharge well, forming a doublet wellbore geothermal system for the local area's winter heating. The pumping well was also partially perforated in the reservoir, similar to the recharging well. The perforated part of the pumping well was shallower than in the recharging well, located at a depth of 1335.6 to 1464.0 m, as shown in Table 6 and Figure 8.
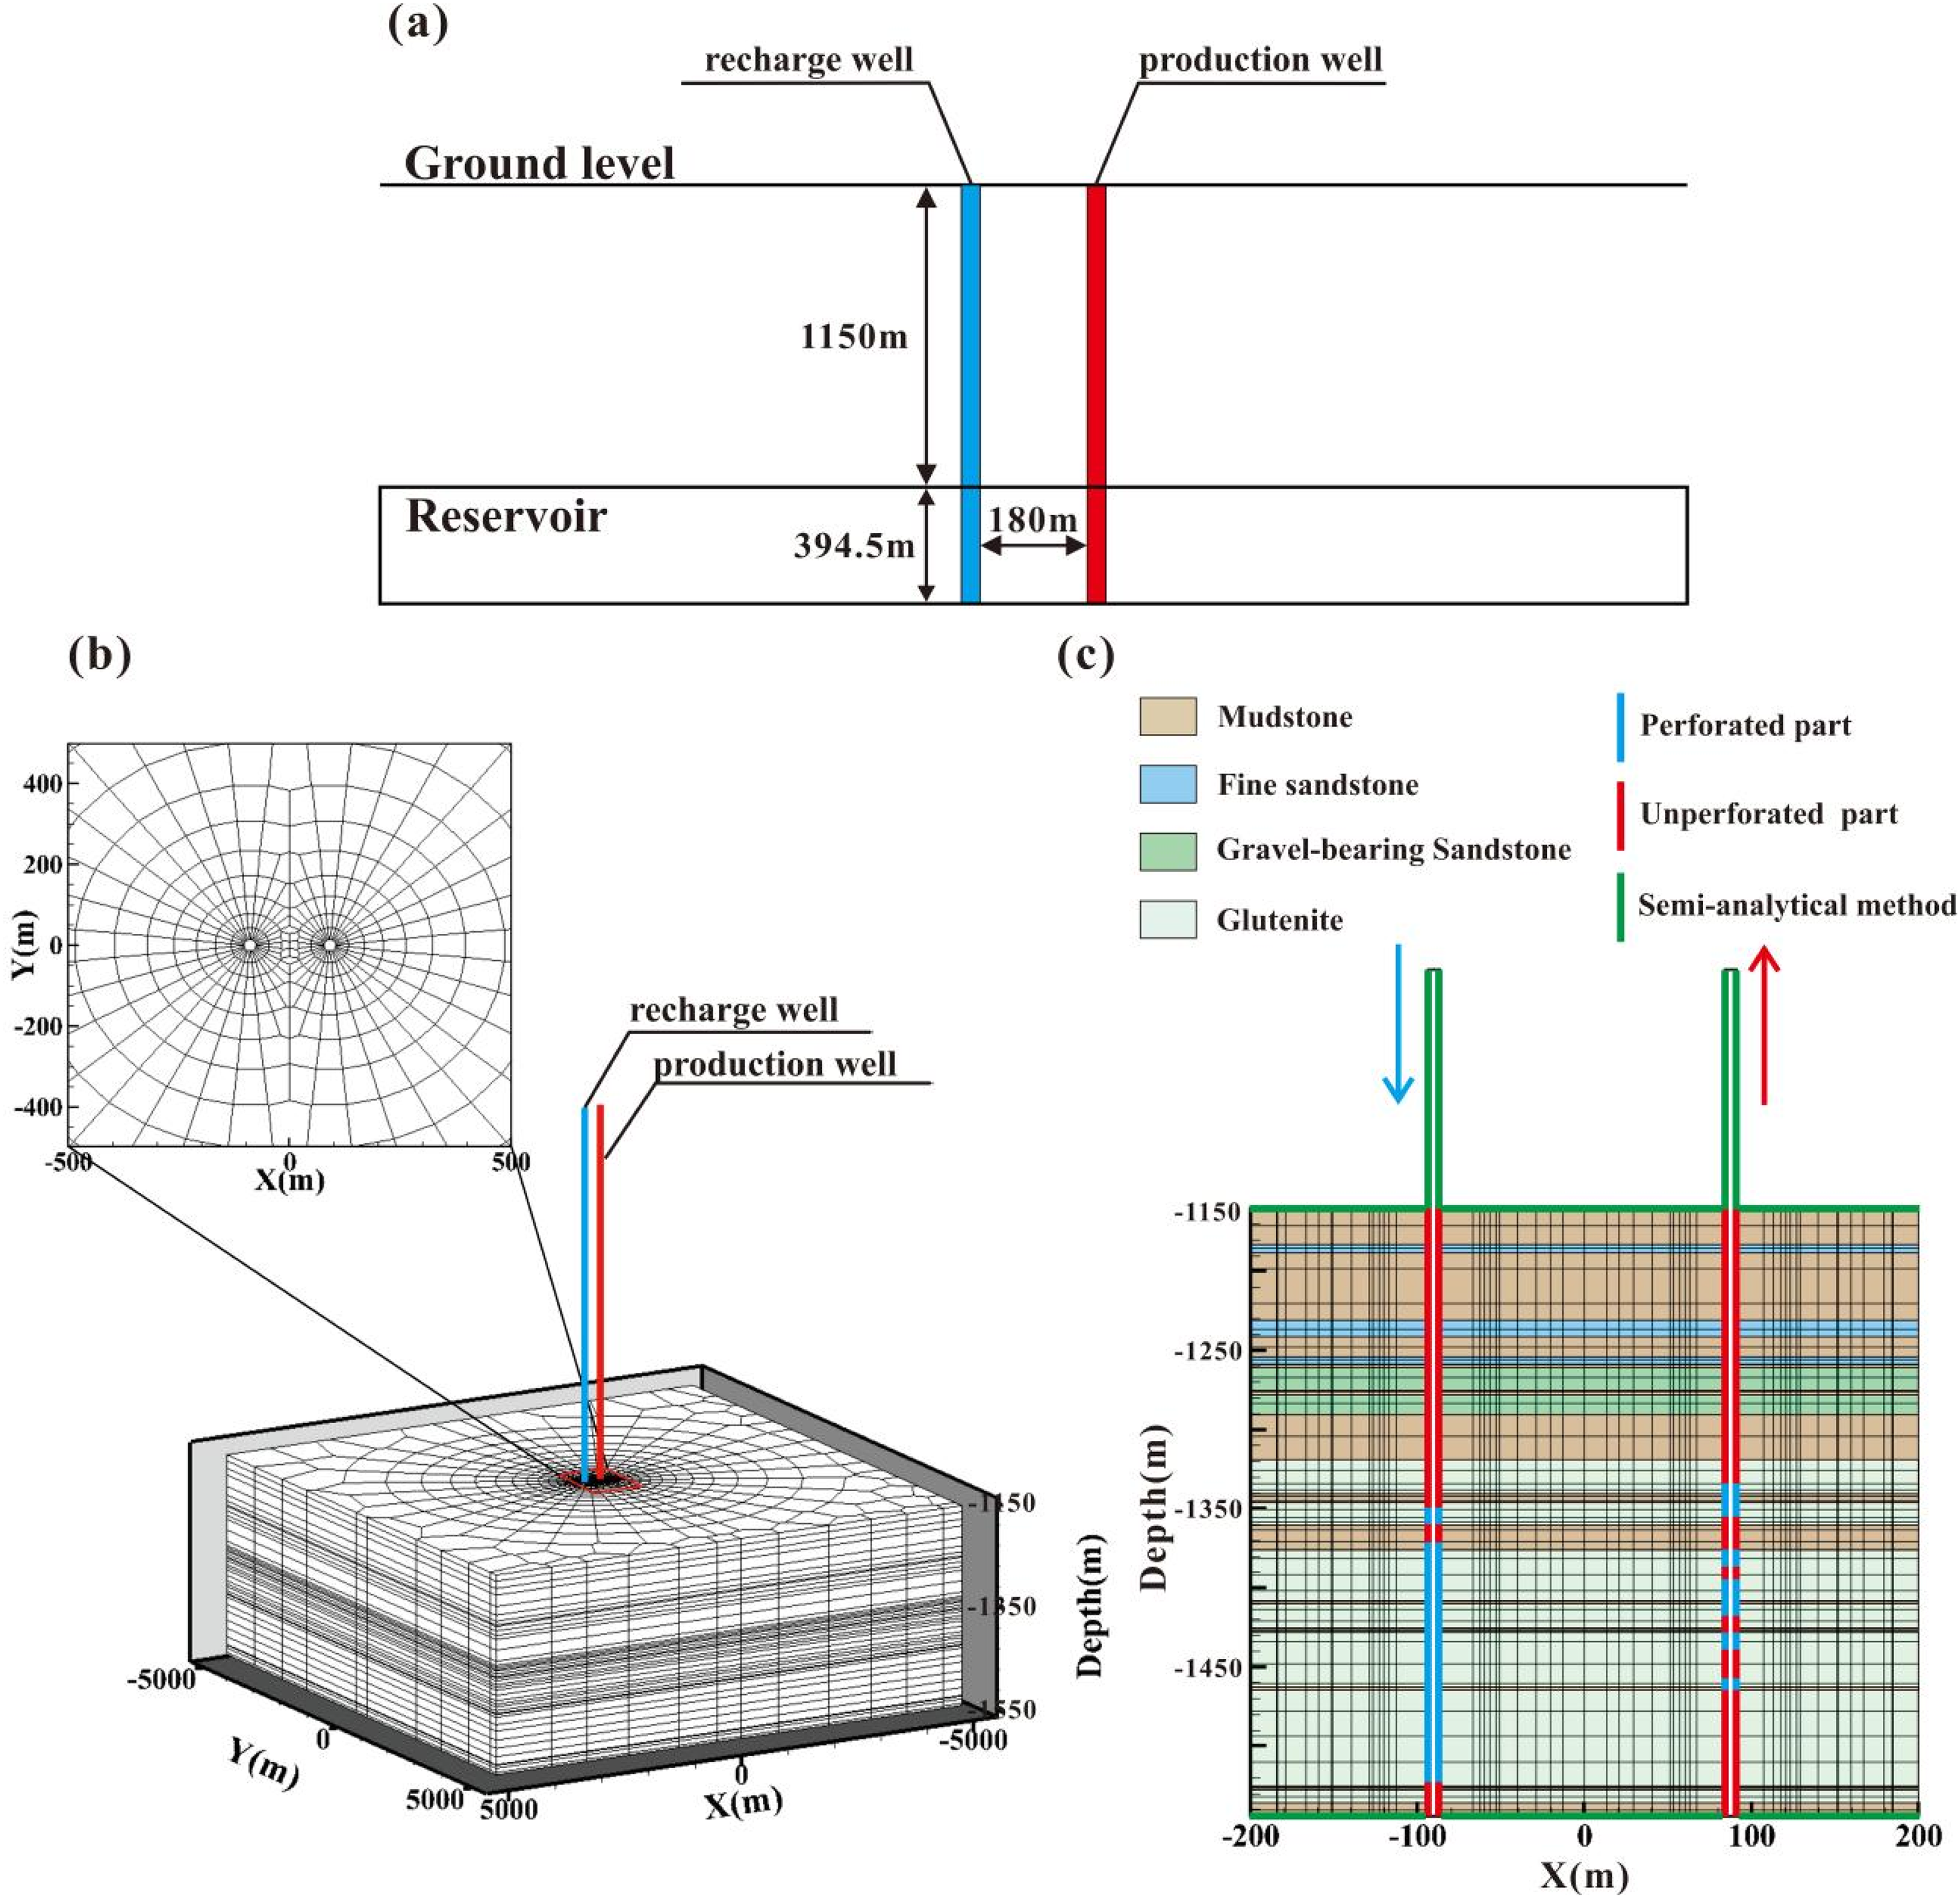
Lateral two-dimensional cross-section of the model (a), a two-spot wellbore-reservoir conceptual model with grid discretization and the subdivision scheme near the well (b), and the lithology and boundary conditions set in three-dimensional coupled wellbore-reservoir model (c).
Wellbore geometry and boundary conditions for the doublet-well geothermal development system.
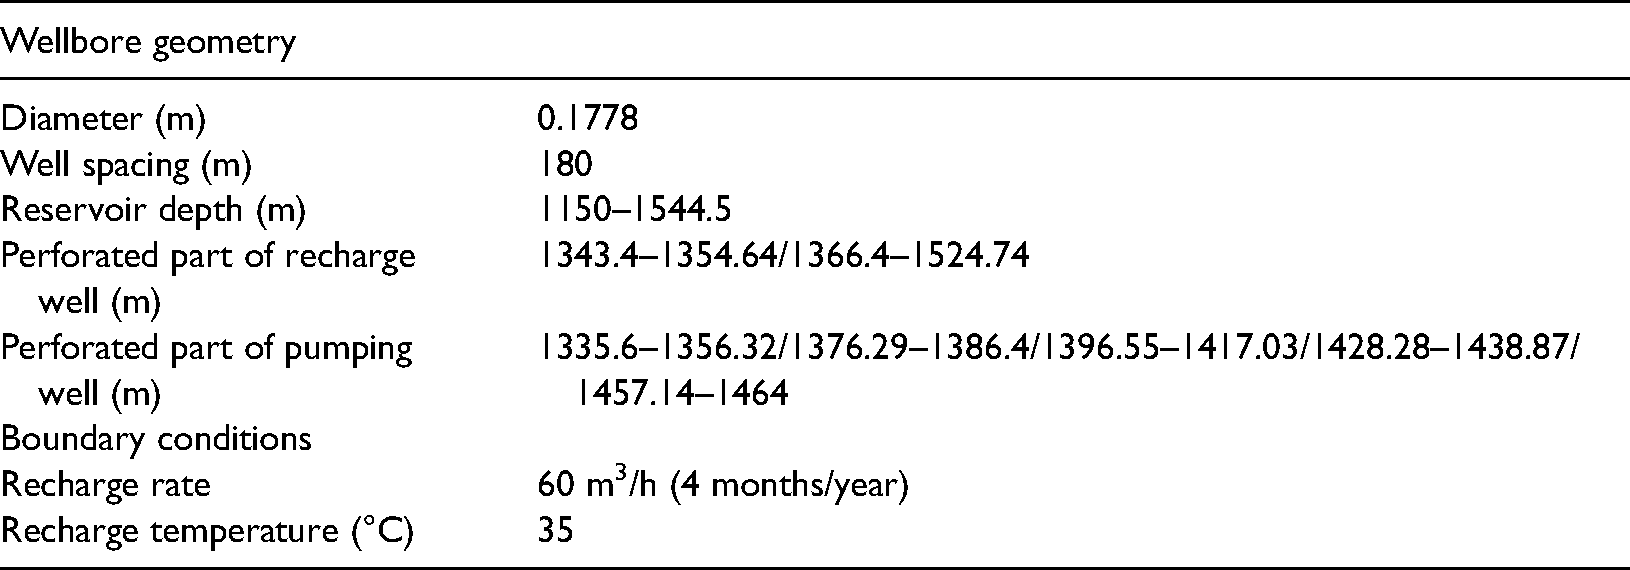
A three-dimensional wellbore–reservoir coupled model with an area of 5 km × 5 km was established to assess the exploitation potential and design an optimal scheme over a lifespan of 100 years. The mesh is shown in Figure 8, which was generated by TOUGHVISUAL (Yang et al., 2013). The mesh in the vicinity of two wellbores was refined to describe the fluid and heat around the wellbore more accurately. The reservoir was divided into 42 modeling layers according to their lithologic character, and each layer was discretized into 846 elements. There were over 35,000 elements in total. A parallel version of the T2Well was introduced to overcome the enormous computational burden associated with a large number of grid cells (Feng et al., 2017). The reservoir parameters were defined as those calibrated from the pumping test. The wellbore geometry and boundary conditions are presented in Table 6.
The initial conditions were assigned based on the static temperature and pressure measurements from the Jianianhua well, the same as those for the pumping test model discussed above. The heating period in Shandong Province is from 15 November to 15 March, approximately 4 months a year, and the other 8 months remain for heat recovery (Ma and Feng, 2015). Hence, the cyclical mass flow rate was given as 60 m3/h, and the temperature of the recharging water was 35°C, which is taken from practical engineering.
Results and discussion
Hydrothermal flow
Generally, recharge water injected into deeper zones can prevent a low-temperature front from moving towards a pumping well significantly, thus decreasing the risk of thermal breakthrough (Rivera Diaz et al., 2016). This is why the perforated part of the pumping well was shallower than the recharging well in our simulation. Under the combined action of the low-temperature dense water and high-permeability bottom layer, the recharging water tended to be dominated by downward movement and was concentrated in the bottom highly permeable layer (Figure 9(g)-(i)). The high-permeability zone was beneficial to water recharge. In addition, it provided more water from the bottom, where the temperature was higher. As shown in Figure 11(b), more than 72% of the extracted water comes from the bottom layer, which is conducive to the outflow temperature.
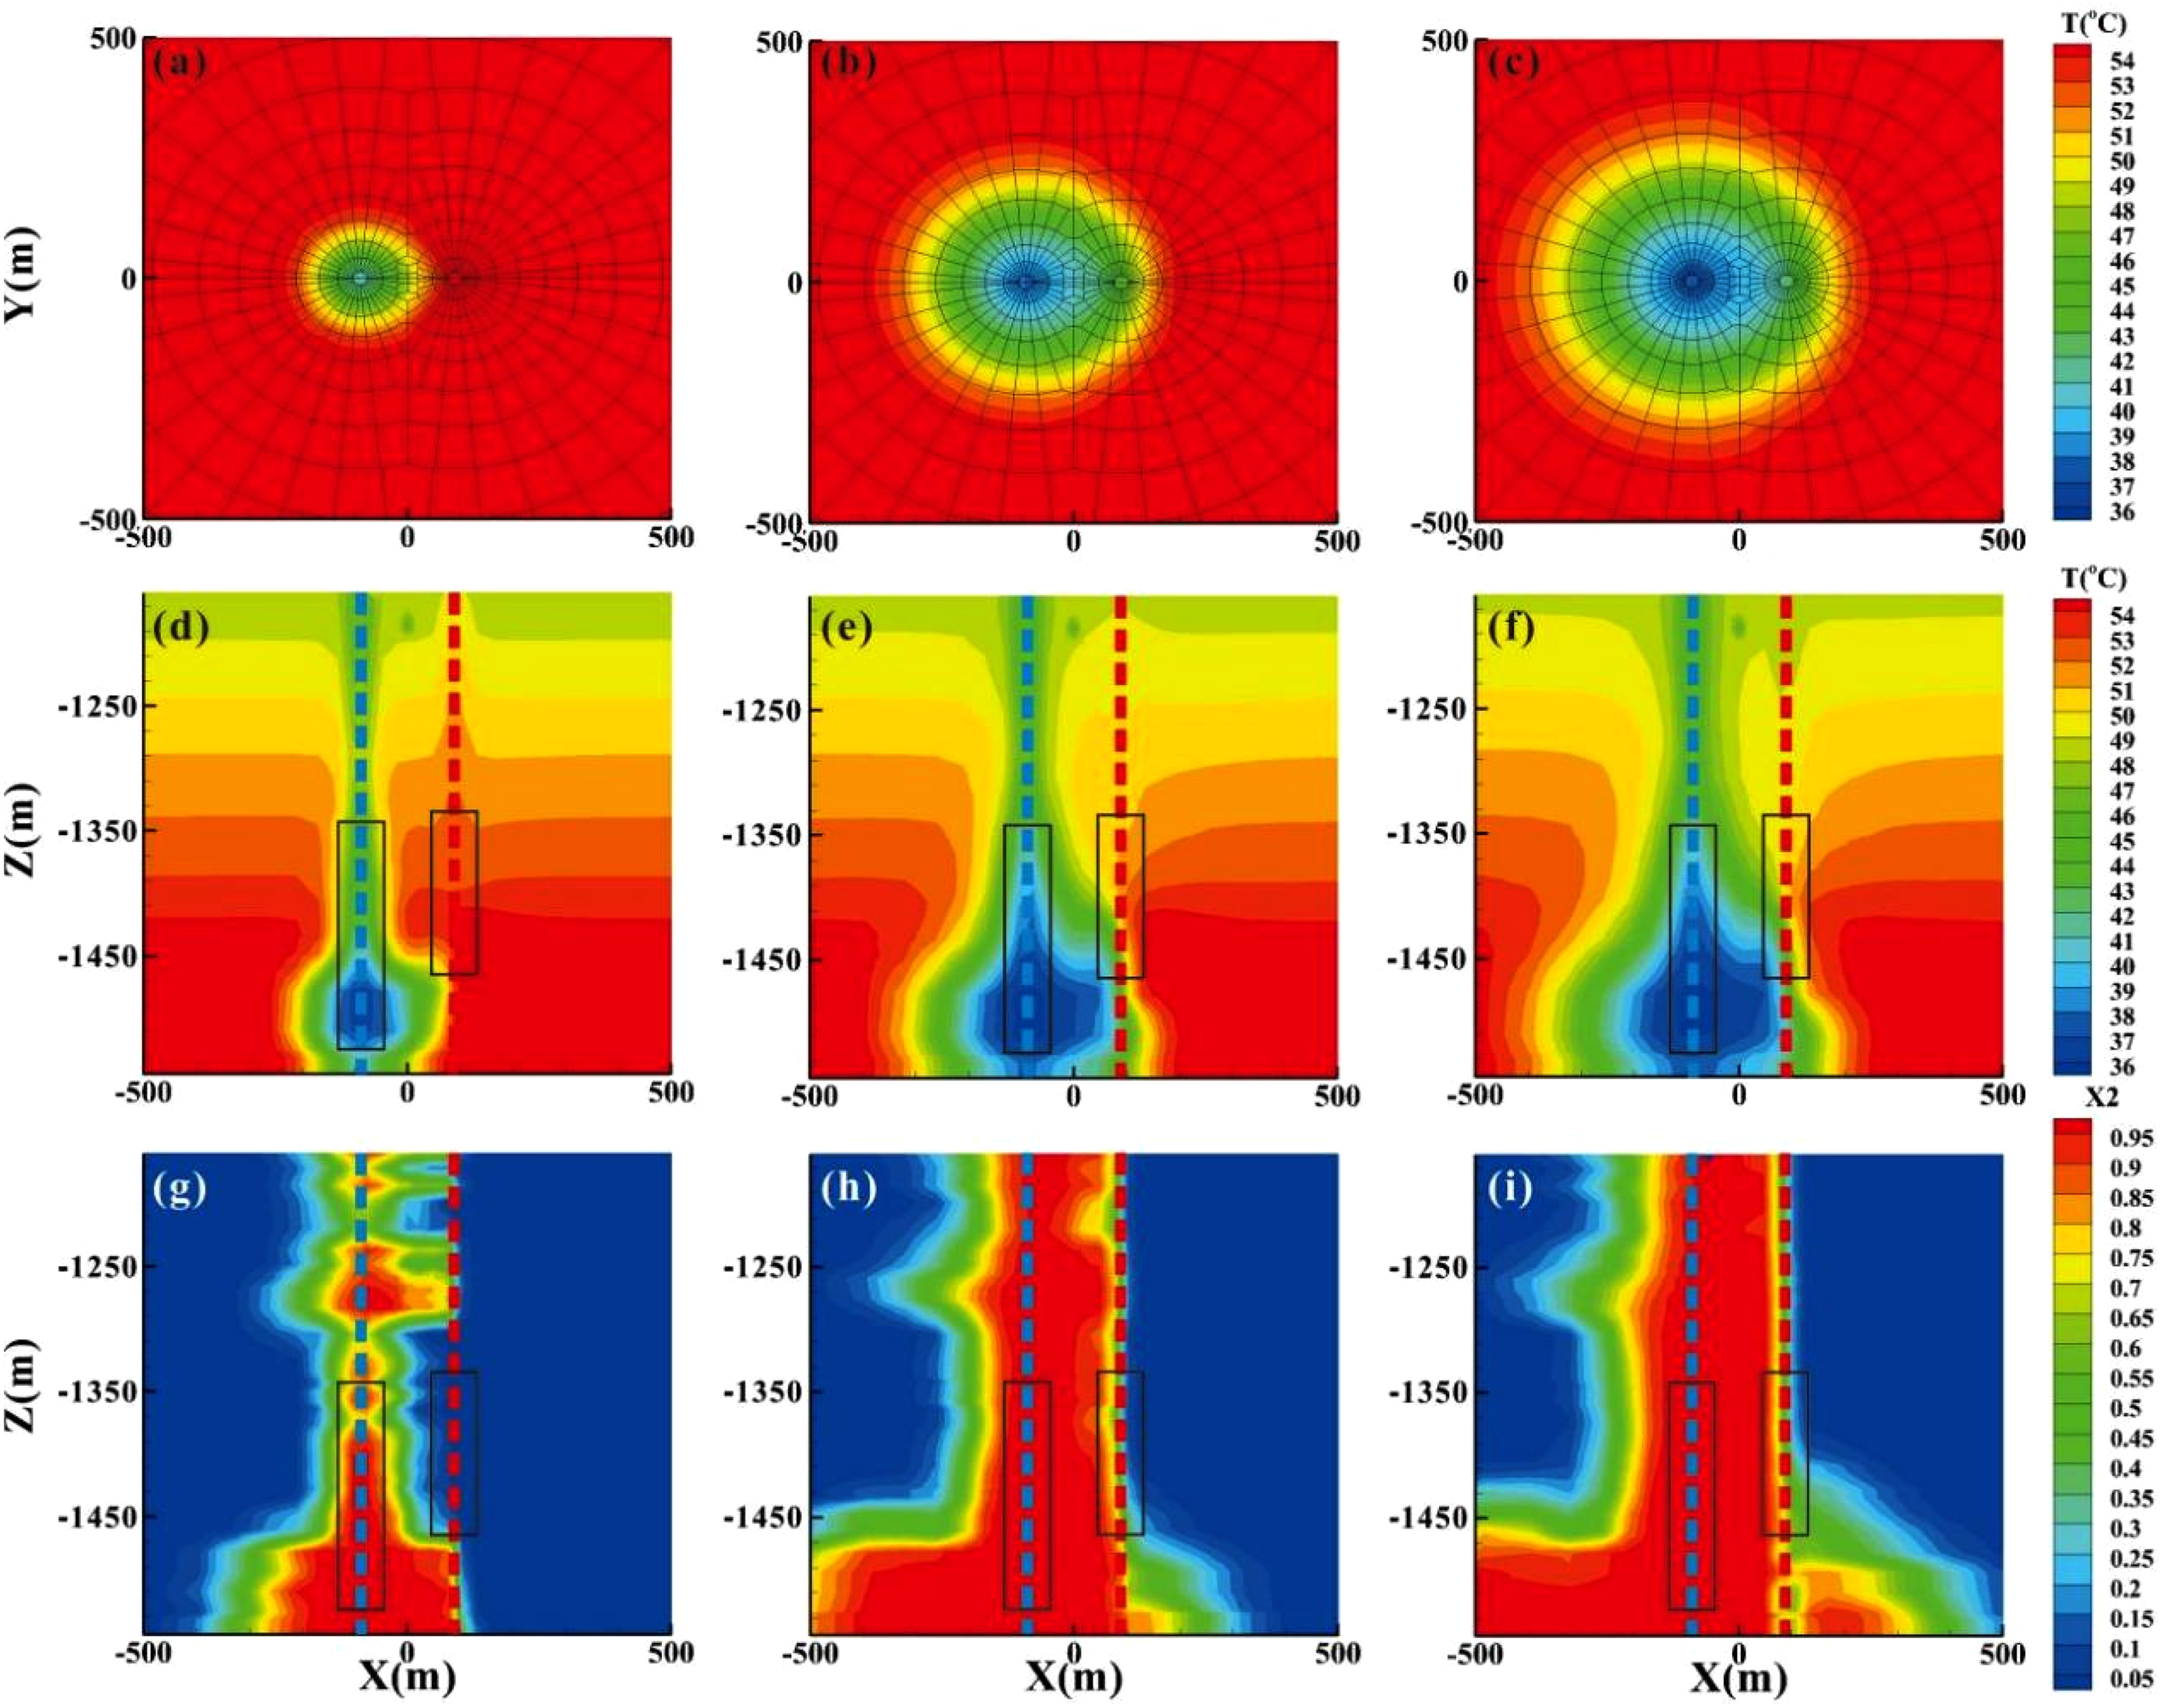
Temperature distribution in horizontal planes (at the bottom of the reservoir, Z = −1544.5 m) (a, b, c) and two-dimensional (2-D) X–Z cross-section (at Y = 0 m) at the 10th, 50th, and 100th year (d, e, f). The distribution of the recharge water fraction in 2-D X–Z cross-section (at Y = 0 m) (g, h, i). The left and right dashed lines denote the recharge and pumping well, respectively, and the rectangles indicate the perforated part of the two wells.
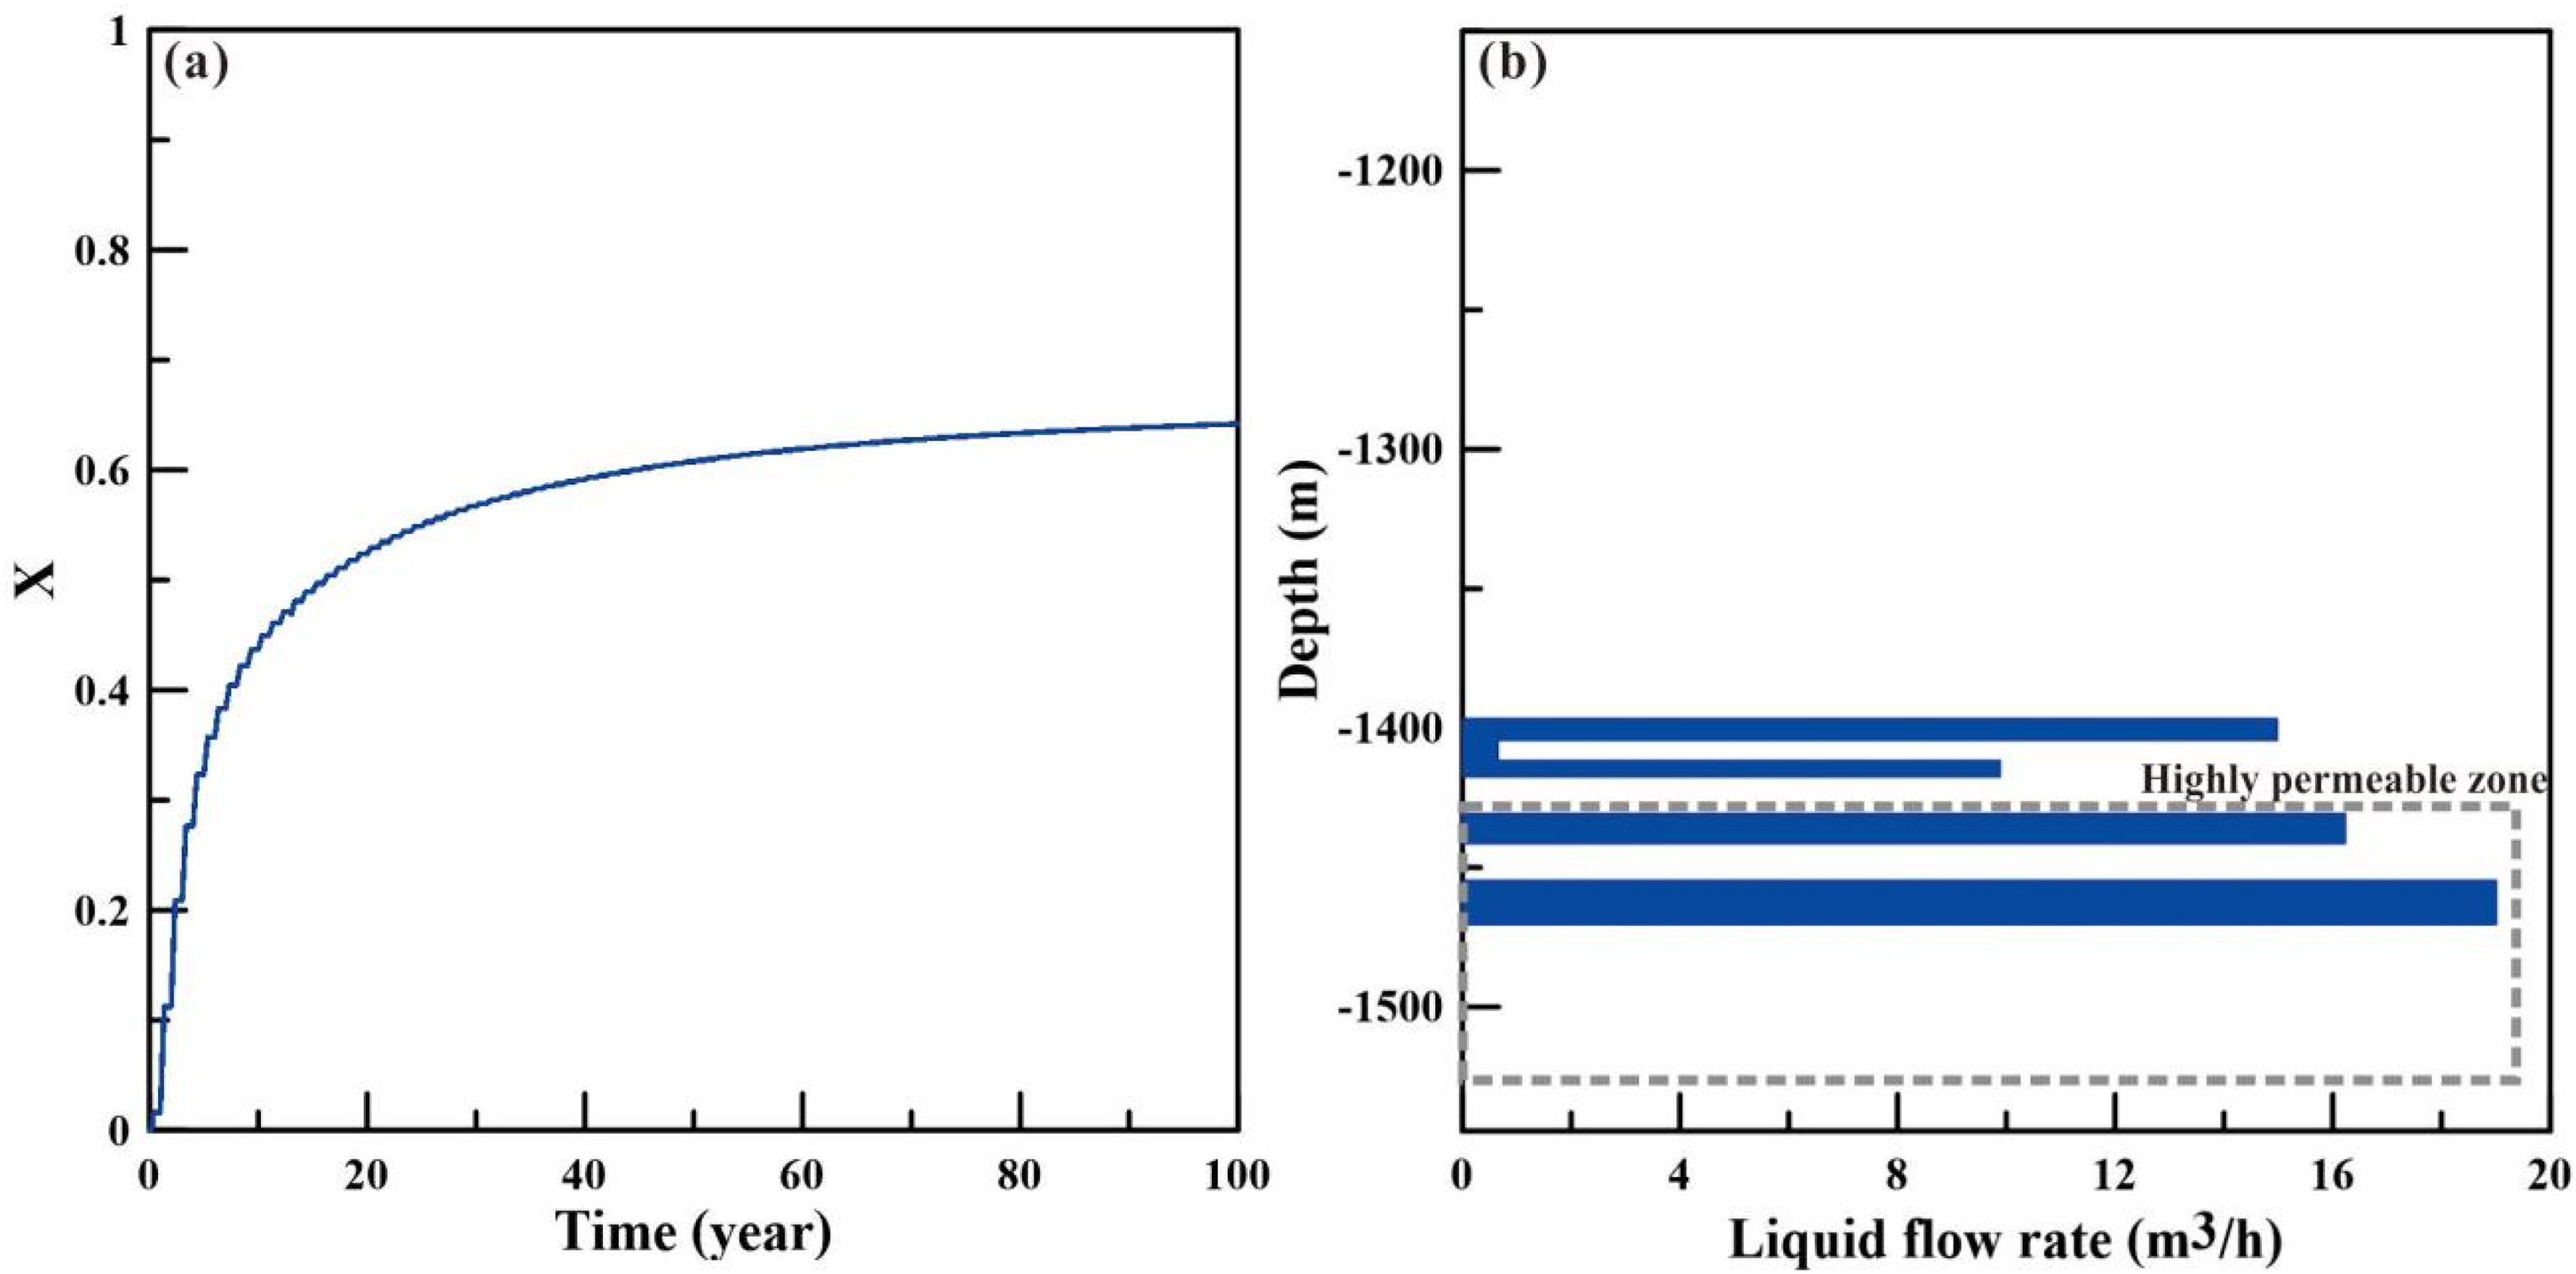
Variation in the recharge water proportion in the produced fluid (X denotes the proportion) (a) and the mass flow rate of each layer at different wellbore depths (b).
However, it also posed a risk of thermal breakthrough. At the beginning of the heat extraction, the cold front did not affect the outflow temperature. The perforated section of the pumping well was shallower than in the recharging well; thus, the recharging water drives deeper in situ hot water to flow upward and be extracted, resulting in a slight increase in the production temperature until the 3rd year rather than the expected decline, as shown in Figure 10(b). The produced fluid temperature was approximately 53.7°C initially, and then in the 3rd year, the temperature increased to 53.9°C. However, due to the short distance between the two wells, the recharging water gradually occupied the space between the two wells (Figure 9(g)), and the reservoir temperature around the pumping well started to drop (Figure 10(a)). Therefore, the outflow temperature decreased rapidly, and thermal breakthrough occurred. In the 20th year, the temperature at the top of the reservoir decreased to 50 °C (Figure 10(a)). In the 32nd year, the produced fluid temperature decreased to 50°C, which is an alert for follow-up development. The low temperature makes it less worthy of subsequent sustainable exploitation. After 50 years of operation, the recharge water occupied almost the entire space between the two wells. The recharge water accounted for over 60% of the production water (Figure 11(a)), causing a temperature decrease of 4.9 °C (Figure 10(b)). After 100 years, the proportion increased to 64% and caused a temperature reduction of 6.8°C.
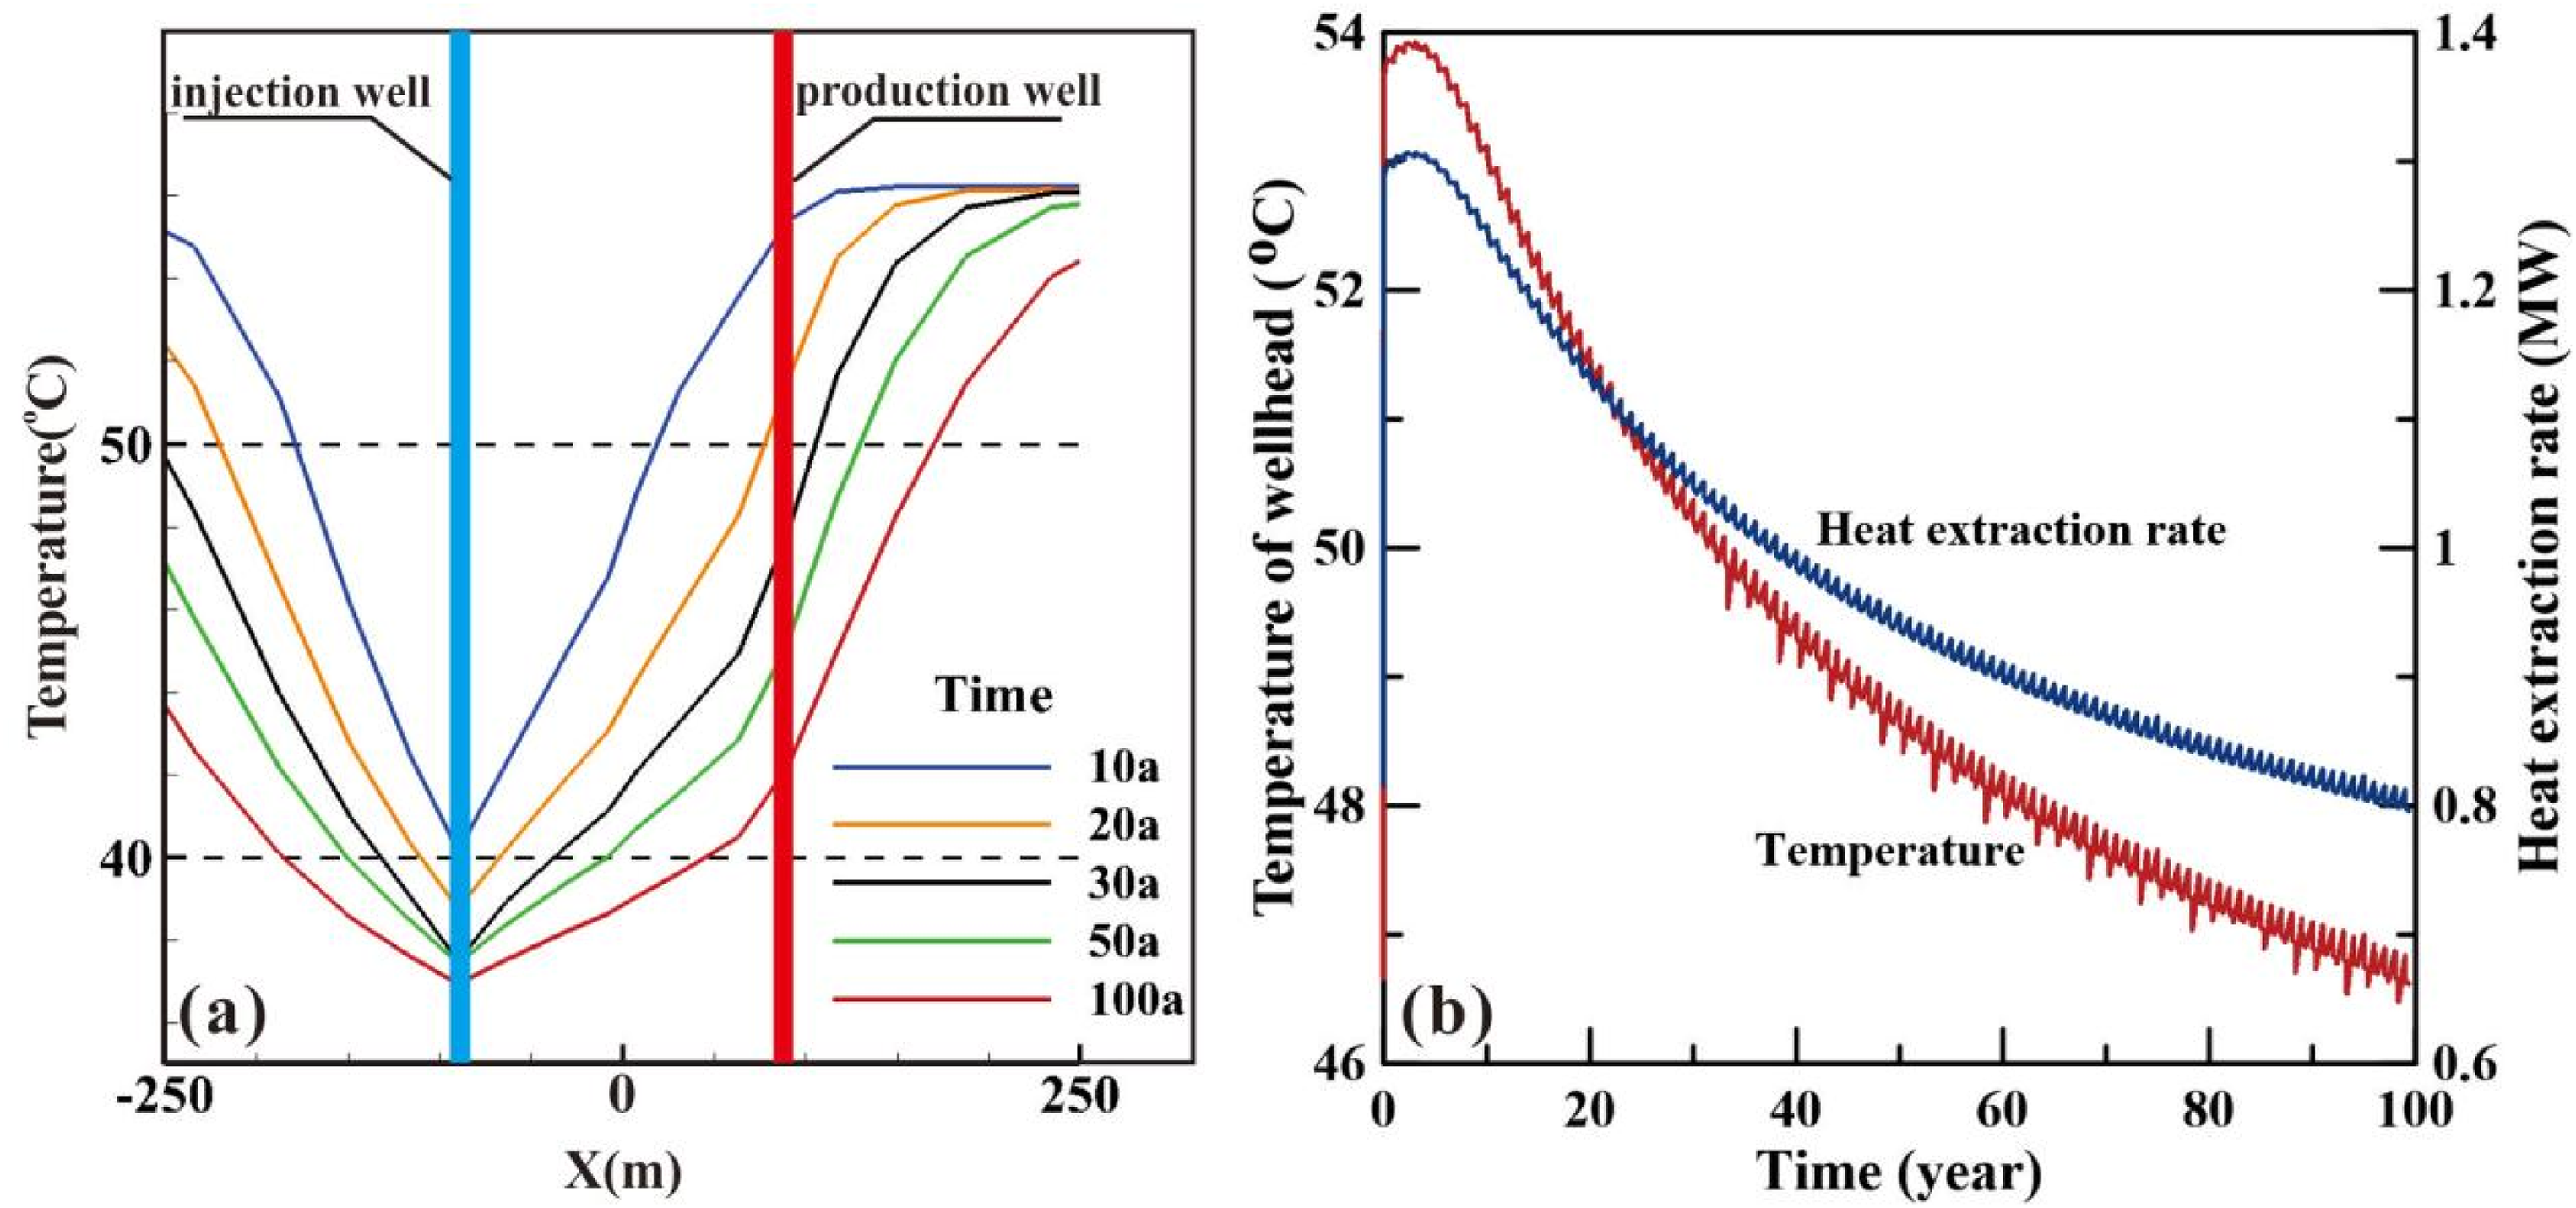
Temperature profile along the two wells of different times at a depth of 1150 m (a), and outflow temperature and the heat extraction rate (b).
Generally, to evaluate the productivity of a geothermal development project, the heat extraction rate (Wh) is used, which is calculated by the following equation:
As illustrated in Figure 10(b), the heat extraction rate was controlled by the production rate. It showed an increase in the first 3 years because of the rise in outflow temperature and then exhibited a downward trend. Over a lifespan of 100 years, under the current exploitation rate of 60 m3/h, the heat extraction rate will decrease from 1.3 to 0.8 MW. Moreover, according to the actual heating demand in Dezhou City, which is 44 W/m2 (Li, 2018a), the doublet-well geothermal system can supply a heating area of 1.8 to 3.0
Other schemes
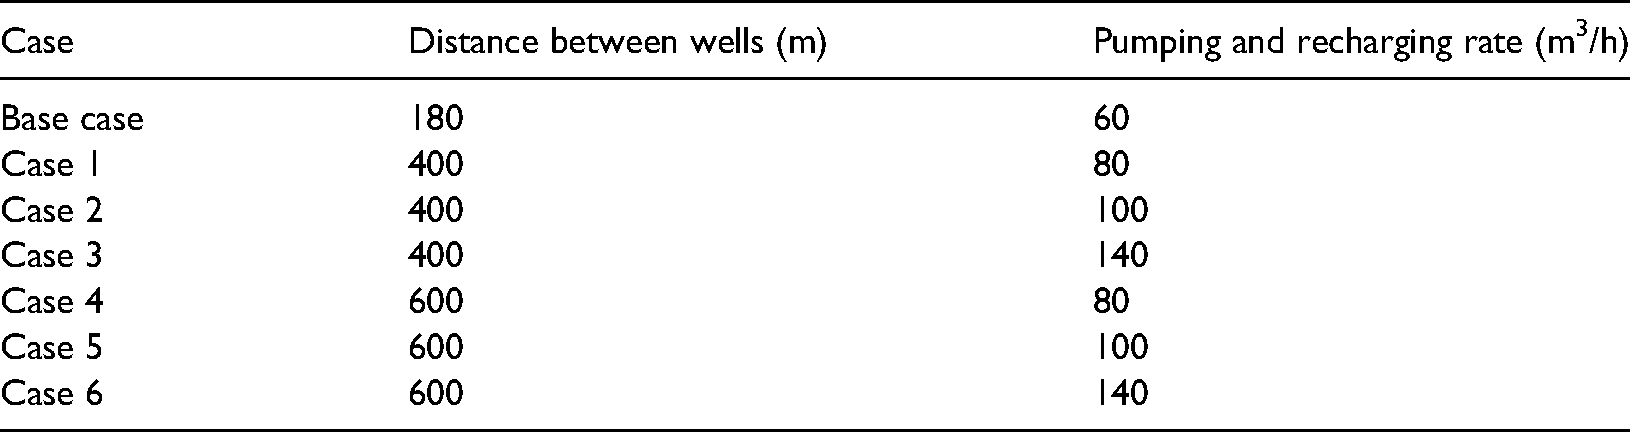
According to the discussion above, it can be concluded that the production rate determines the heat supply area, and the well spacing affects the system sustainability. Referring to the calculation above, a 180-m well spacing is not sufficient to maintain long-term operation with such a production rate. Simulation cases with a larger well spacing are given to test the heat supply potential and sustainability, as listed in Table 7.
Well distance and flow rate setting of each case.
The outflow temperature and heat extraction rate are shown in Figure 12. The temperatures at the early stage were the same for different cases, and the heat extraction rates were proportional to the pumping rates. Compared to the 400-m cases, the performance of the 600-m well-spacing cases was more stable. Under a pumping rate of 80 m3/h, the outflow temperature with a well spacing of 600 m remained constant. The temperature was still over 53°C after 100 years of operation. For the 400-m case, it dropped to 50.6°C in the 100th year. If we set the lower limit of the outflow temperature to 52°C, the system with 400-m well spacing could only maintain operation for 63 years at a pumping rate of 80 m3/h, and it could be maintained for 86 years under the pumping rate of 140 m3/h in the 600-m well-spacing case.
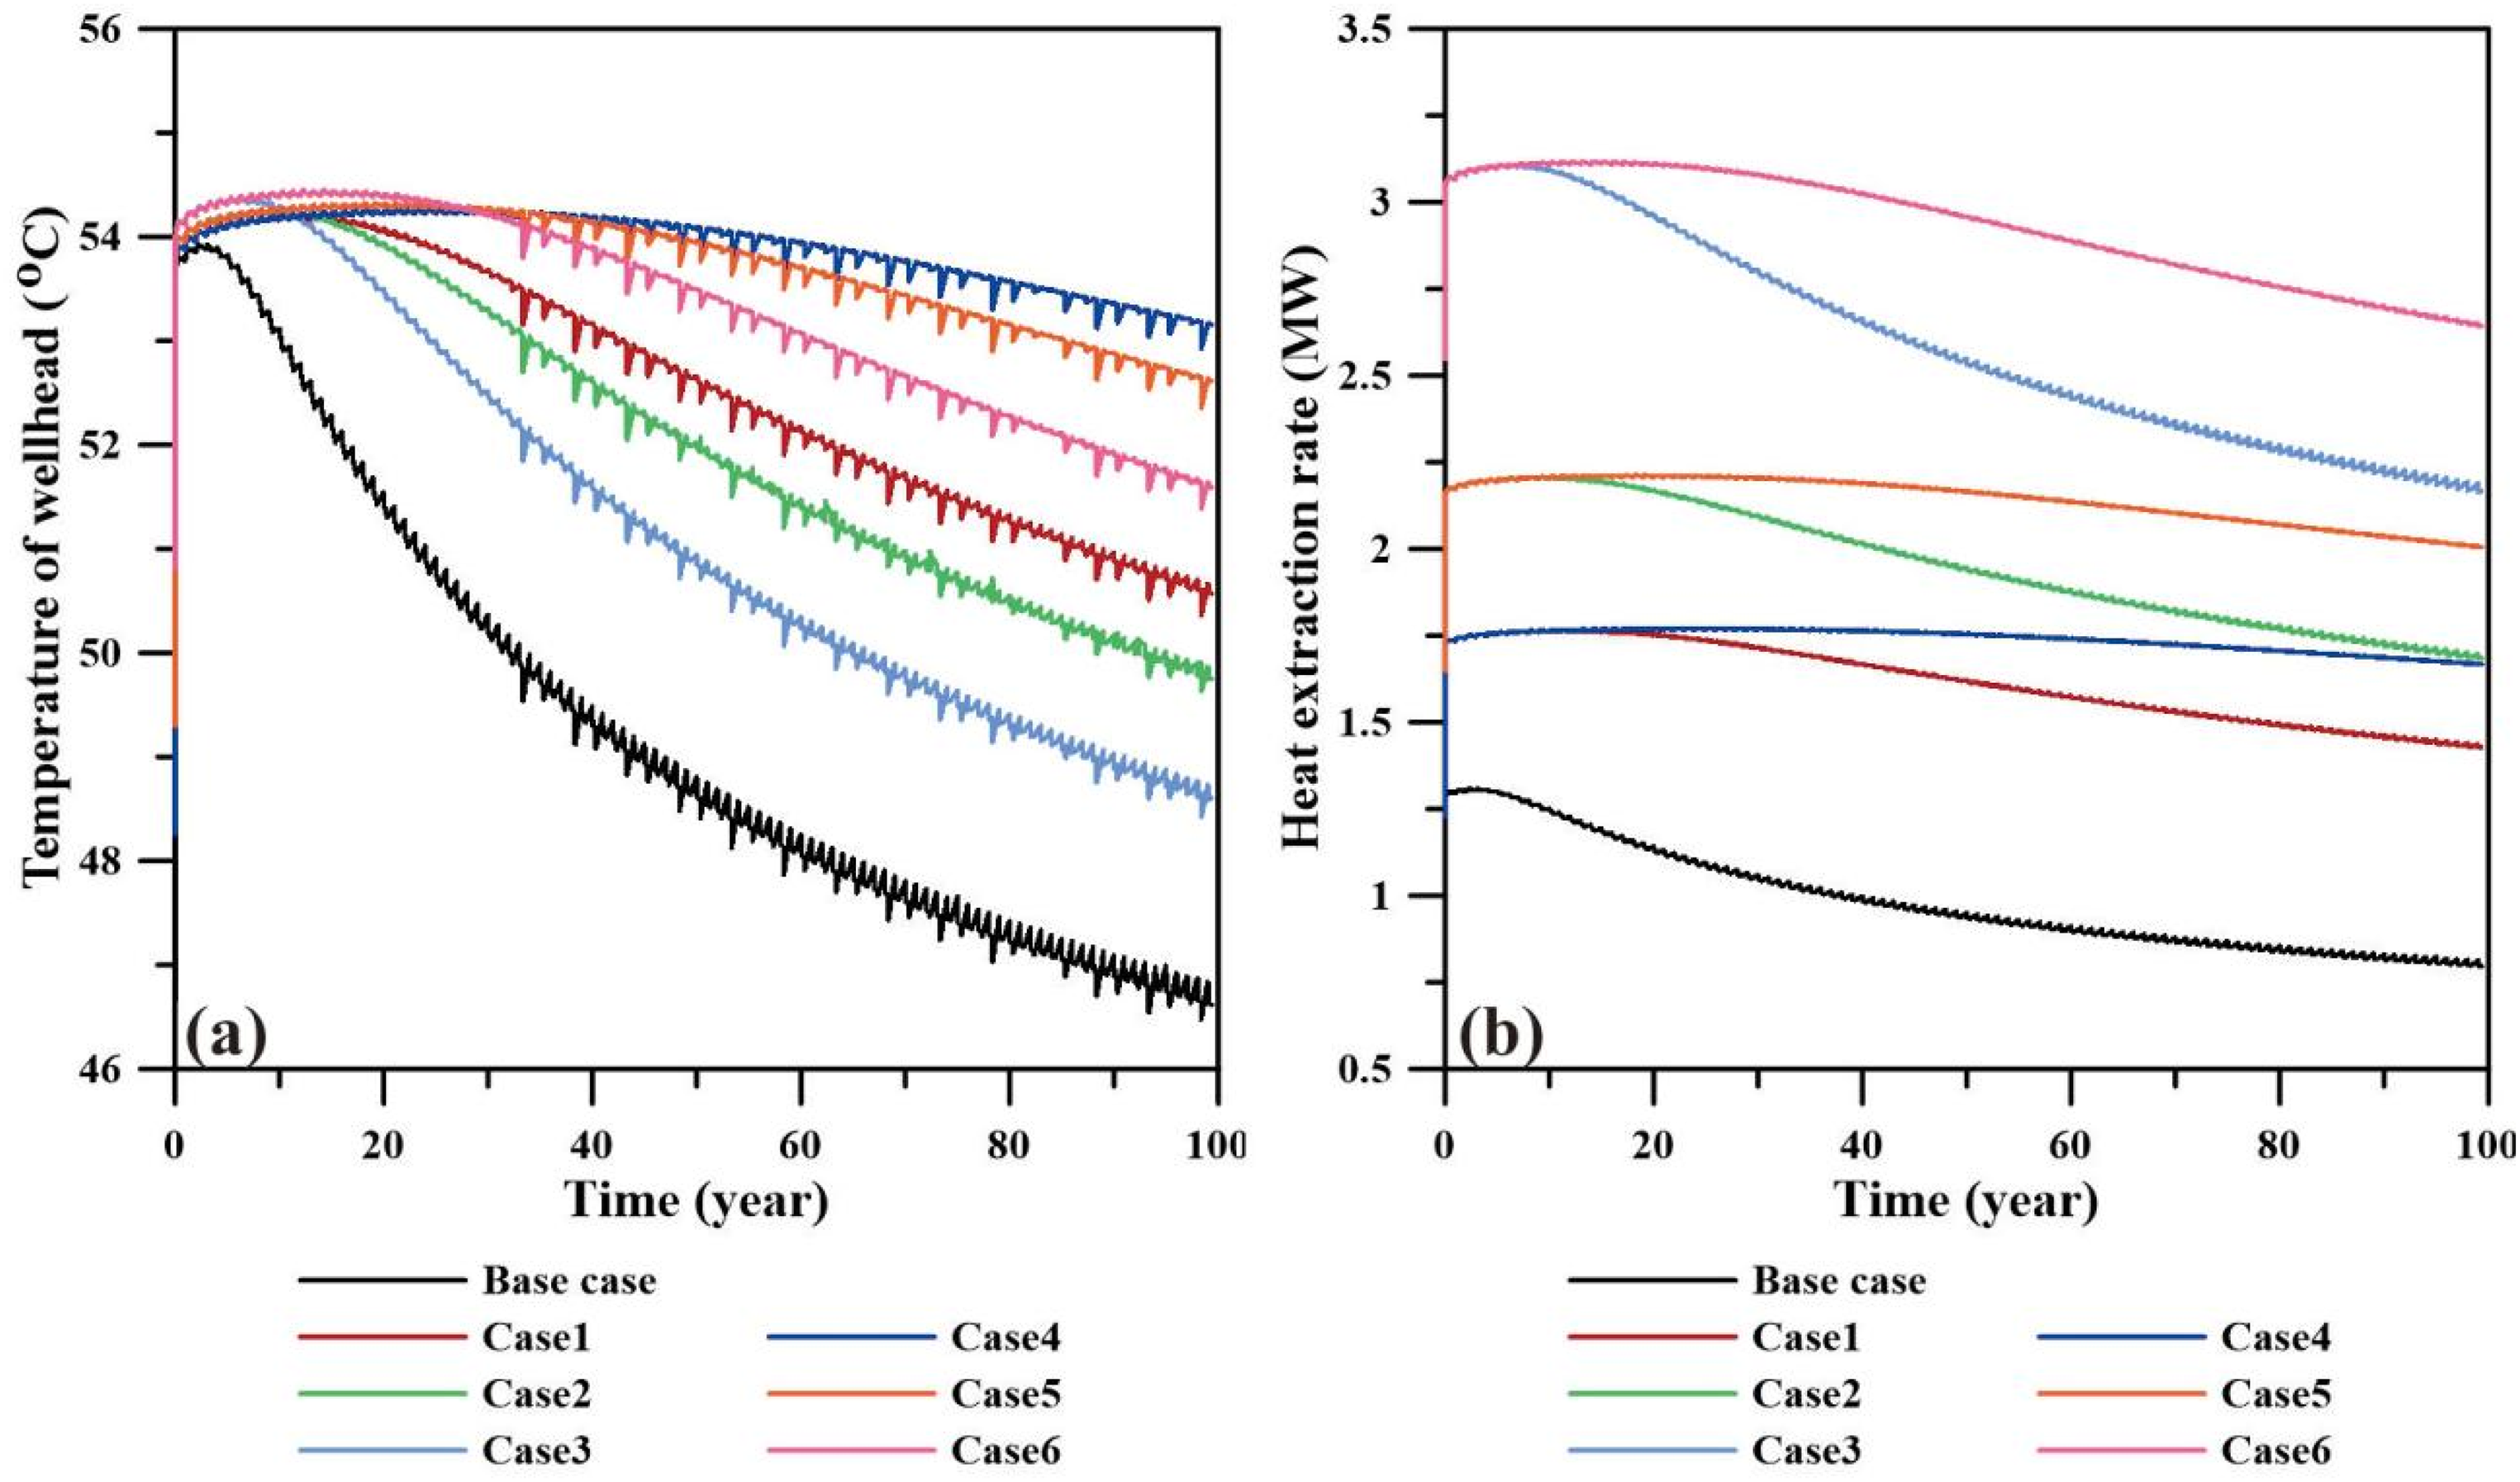
Outflow temperature and heat extraction rate with the well spacing of 400 m (a) and 600 m (b).
The operating times of the two schemes above a specific temperature were compared to investigate the relationship between well spacing and system sustainability. It was found that the sustainable time above any given temperature in the 600-m well-spacing cases was almost 2.5 times of that for 400-m cases, as listed in Table 8. Under the same pumping rate, the pressure gradient between the two wells with a well spacing of 600 m was less than that of the 400-m cases, implying that more high-temperature in situ water would contribute a larger proportion in the outflow, which is favorable for temperature stability (Figure 13).
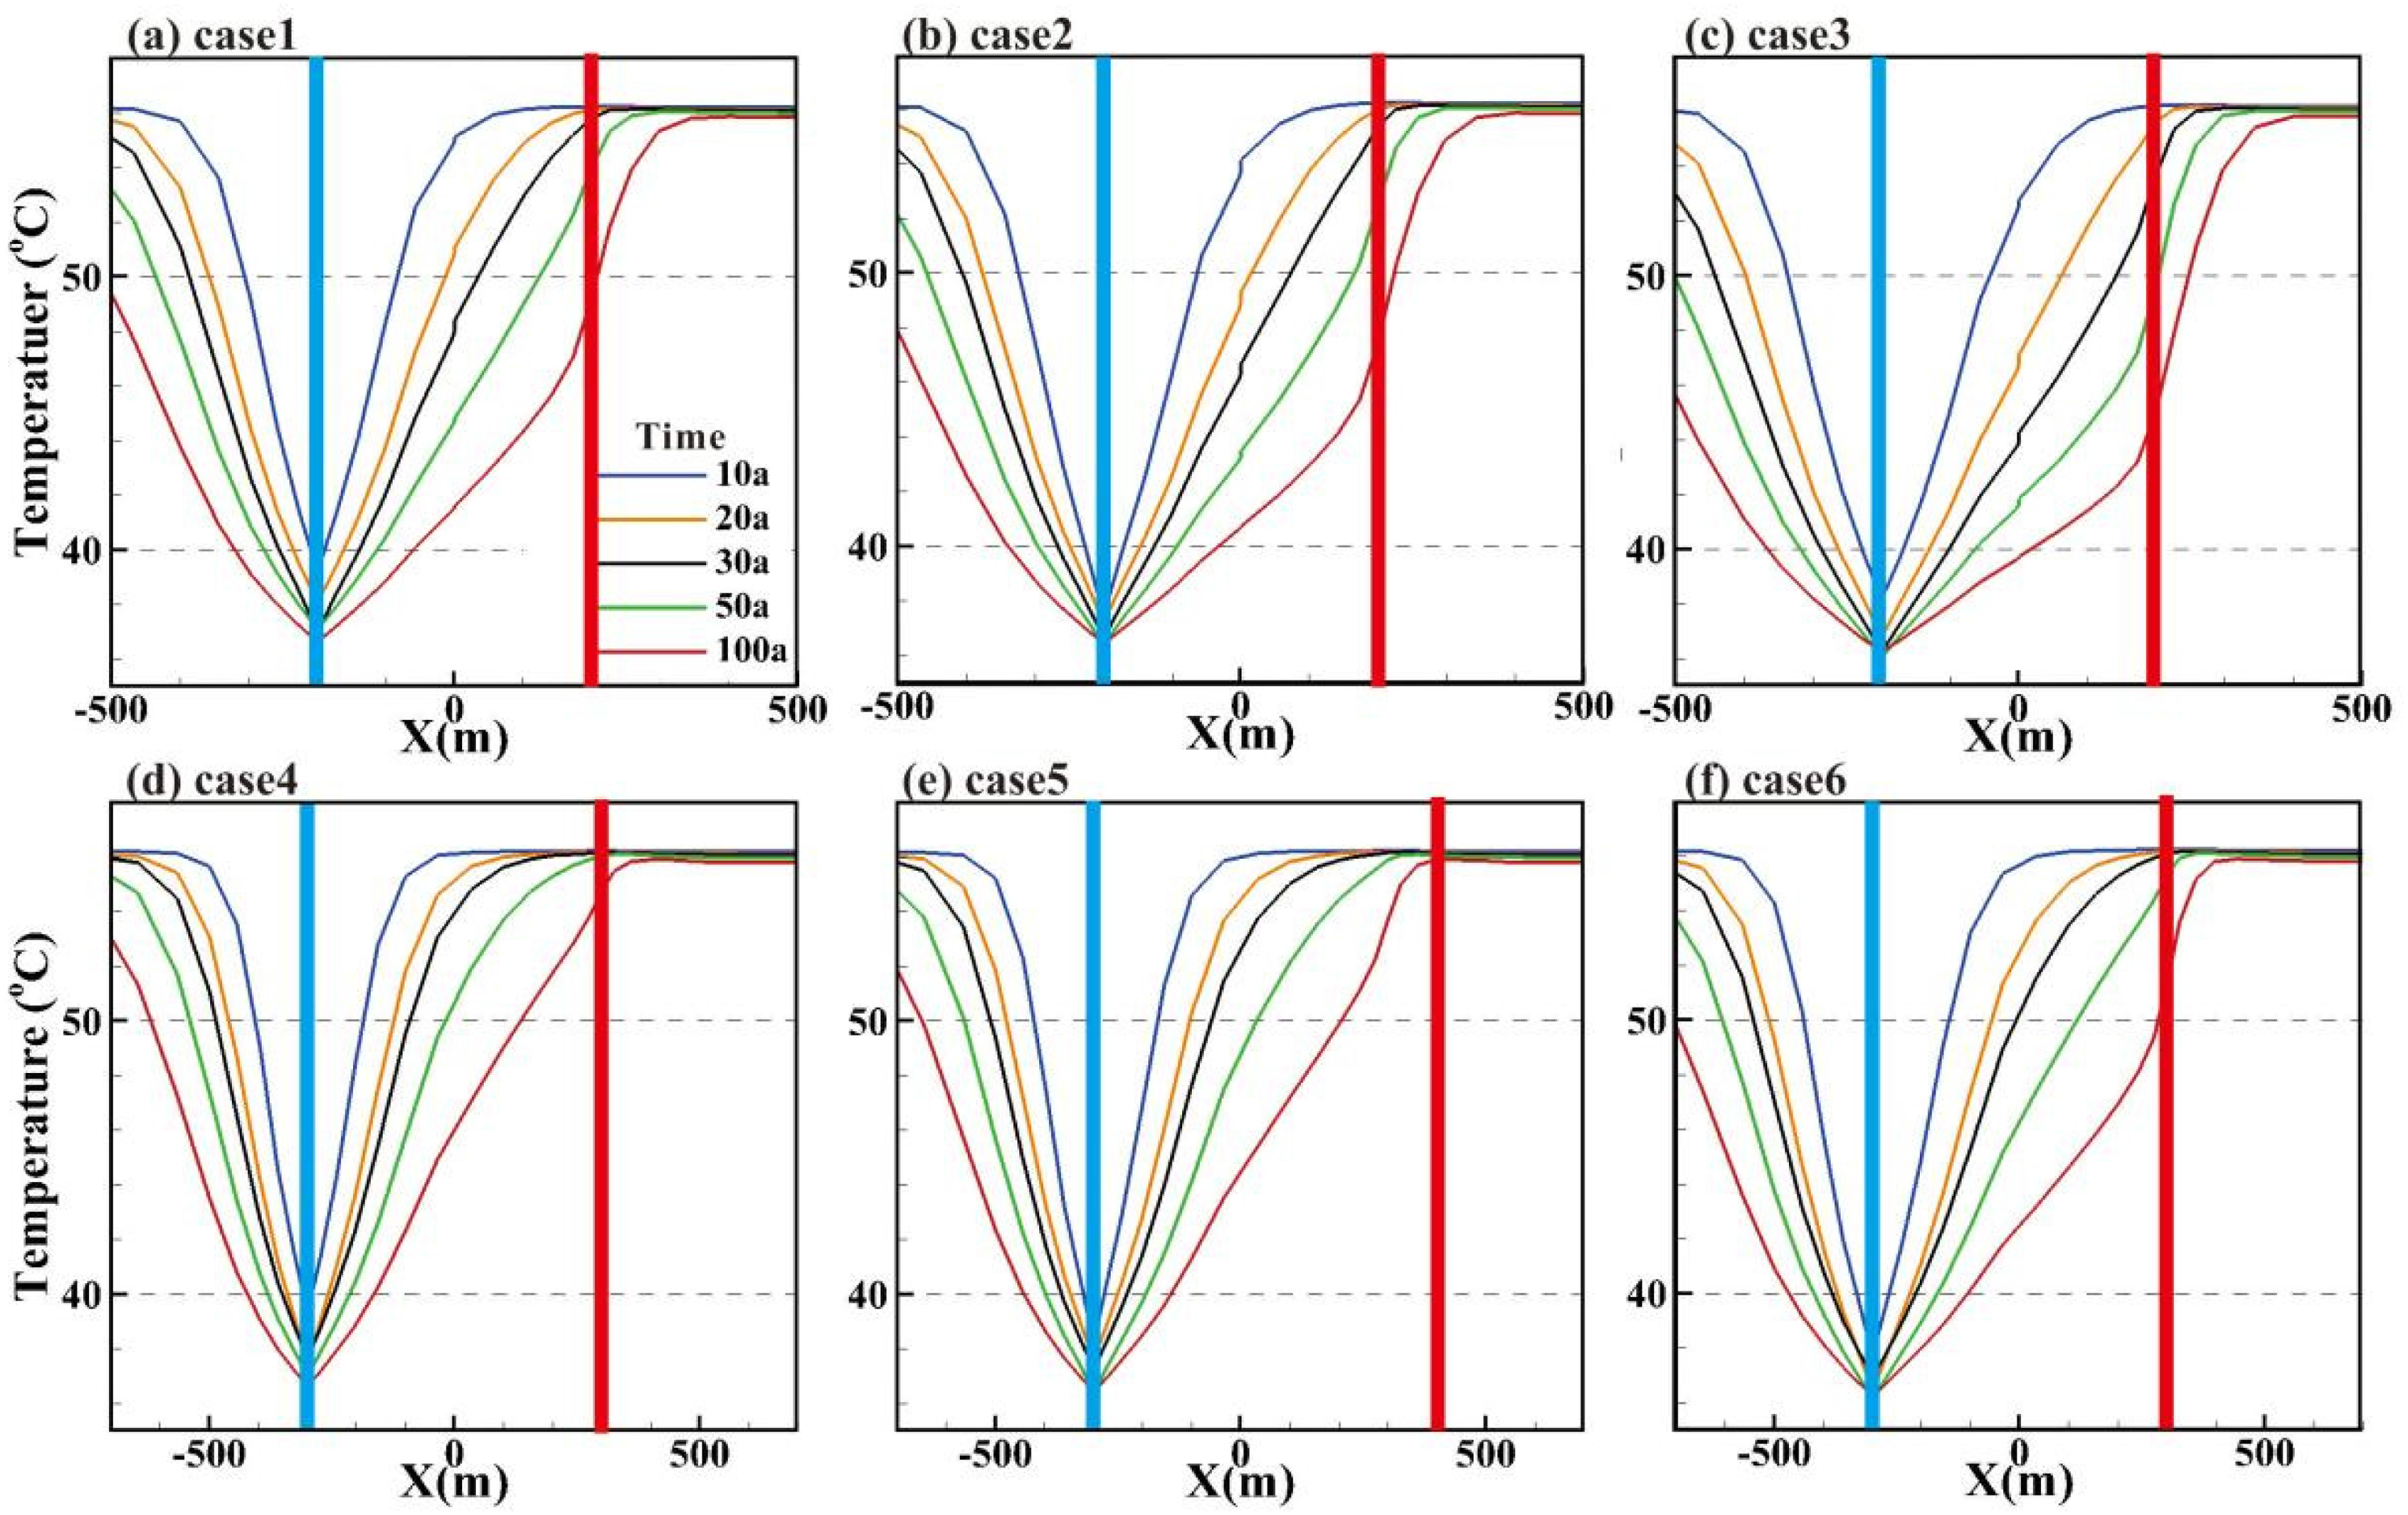
Temperature profile along the two wells for different times at a depth of 1150 m for cases 1–6.
Operating time of every case above a certain temperature between 49 and 51°C.
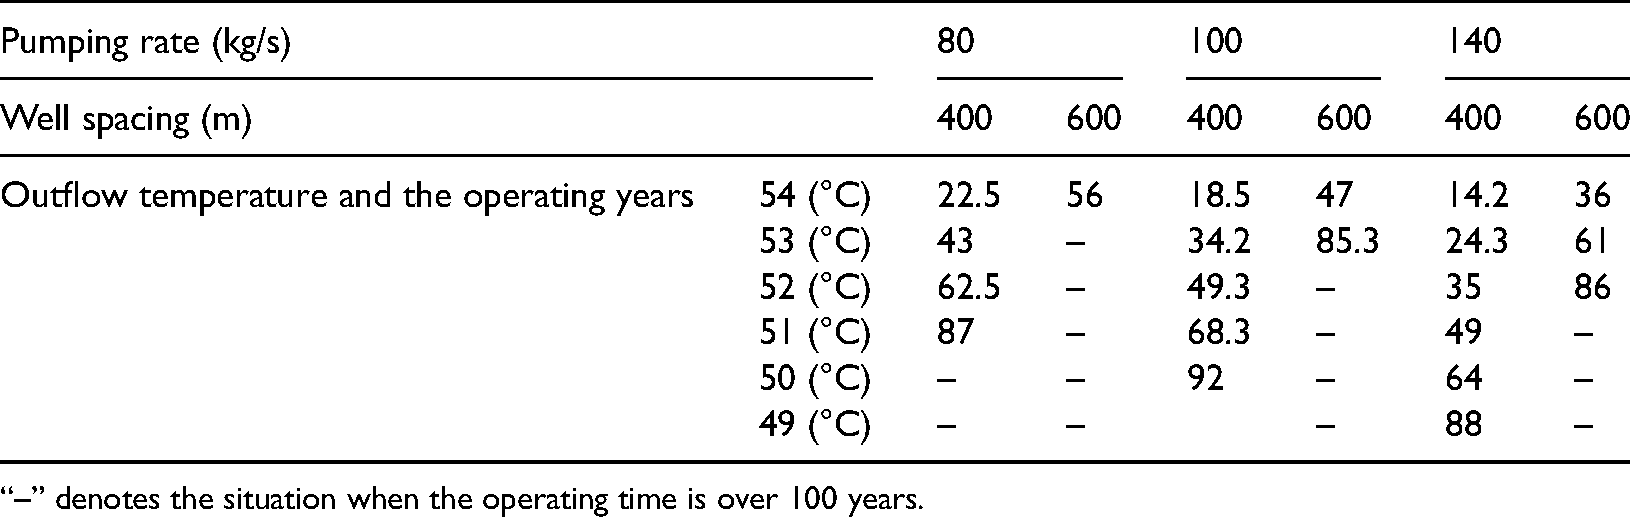
“–” denotes the situation when the operating time is over 100 years.
Higher pumping rates could supply a larger heating area, but the energy consumed by the pumps and the stability of the formation must be further considered.
Conclusion
In this study, production test data were used to calibrate the thermal conductivity and permeability of the Guantao geothermal reservoir in Dezhou, China. On this basis, the temperature evolution and heating area of the current wellbore layout were analyzed. Additional wellbore layouts and pumping schemes were simulated and discussed to investigate the heat supply potential and sustainability, providing references for future heat exploration in Dezhou City.
Based on the modeling results and analyses, the following conclusions can be drawn:
A relatively high permeability layer is found at a depth of 1468–1536 m, which could explain why the pumping rate and drawdown exhibit an approximately parabolic relationship rather than a linear relationship. The equivalent permeability of the relatively high permeability layer can reach 4.0 Darcy, which is an order of magnitude greater than that of the formations above. The current well spacing of 180 m in the study area was too short to maintain a long-term operation with a pumping rate of 60 m3/h in the simulated reservoir test. In the 6th year, a thermal breakthrough occurred. Then, the outflow temperature fell sharply and decreased by 7.4°C within a lifespan of 100 years, only supplying a heating area of 1.8 to 3.0 A larger well spacing can effectively prevent a thermal breakthrough. The sustainability of 600-m spacing is almost 2.5 times of 400-m spacing. Moreover, a spacing of 400 m can guarantee an outflow temperature above 50°C over a lifespan of 100 years under an 80 m3/h pumping rate.
Footnotes
Acknowledgments
This work was jointly supported by the National Key R&D Program of China (Grant No. 2018YFE0111300) and the National Natural Science Foundation of China (Grant No. 41902309); (Grant No. 41807208); (Grant No. 42072331).
Declaration of conflicting interests
The authors declared no potential conflicts of interest with respect to the research, authorship, and/or publication of this article.
Funding
The author(s) disclosed receipt of the following financial support for the research, authorship, and/or publication of this article: This work was supported by the National R&D Program of China (grant nos. 2018YFE0111300, 41807208, 41902309, and 42072331).