
Abstract
In the study, we analyzed the hot dry rock geothermal field of the Guide Basin in Qinghai Province, China. We used T2Well software—a coupled wellbore–reservoir simulator—to build a “wellbore–reservoir” coupled model with a “three-spot” well pattern (one injection and two production wells). We simulated several fixed flow rate cases in which water or CO2 is injected. The objectives of our present work are (1) to investigate the fluid flow and thermal processes of water circulating at well bottoms, wellbores, and wellheads; (2) to identify the changing parameters at all physical fields; (3) to understand the influence of injection rates on heat extraction; and (4) to measure the maximum heat extraction capacity of the Guide area. Water extracts more heat than CO2 at the same flow rate. However, water consumes more pressure in reservoir, and its pressure decreases more quickly as the flow rate increases. In contrast, CO2 is in a sense a better working fluid. CO2 consumes less pressure when it flows and can circulate automatically due to the siphon phenomenon. In this way, a lower injection pressure is required in a higher CO2 flow rate case. The density of CO2 is sensitive to both temperature and pressure and vice versa. Inside a wellbore, such interactions are extremely complicated. When the fluid rate is slow, a system could operate for 30 years and remain stable, and there is only a small decrease in temperature. However, with higher flow rate scenarios—namely 50, 75, and 100 kg/s—the reservoir will exhibit greater heat loss. The reservoir’s production temperature and extraction efficiency will drop dramatically. Therefore, for the Guide area, if a “three-spot” well pattern is used for geothermal extraction either with water or CO2 as the working fluid, the most appropriate flow rate is 50 kg/s.
Introduction
Although enhanced geothermal systems (EGS) have a history of 40 years, their focus remains on reservoir reformation, and these systems have a long way to go before they can be used for business applications. Therefore, most studies on EGS geothermal development are limited to theoretical analyses (Pan and Oldenburg, 2014).
Sanyal and Butler (2005) carried out a numerical simulation to analyze the efficiency of geothermal extraction with different well configurations, fracture spacing, permeability, and fractured volume. It was found that the fractured volume of a geothermal reservoir is the most sensitive parameter affecting the amount of recoverable heat. As the fractured volume increases, such relativity decreases. The percentage of recoverable thermal energy is nearly constant at approximately 40%, and the net electrical power that can be achieved for the EGS is approximately 26 MW/km3.
As an alternative to water, the conventional working fluid, Brown (2000) proposed using CO2 as a working fluid for extracting geothermal heat and analyzed many benefits for such a replacement and for geological sequestration. Pruess (2006) used the EGS data of Soultz and employed a TOUGH2 module to analyze the heat extraction efficiency of water and CO2, which indicates that CO2 is two times greater than water in its ability to mine heat from hot fractured rock. Pruess also noted some disadvantages of CO2 (e.g. water–rock–gas interactions affect the stability of heat extraction). The injection of CO2 in place of brine in a CO2–EGS system induces halite precipitation and the clogging of fractures, causing a drop in the heat extraction efficiency. Borgia et al. (2012) produced a numeral simulation of these influences and concluded that under a high saline condition approximately one year after CO2 injection begins, serious clogging problems will occur.
Zeng et al. (2013, 2016) adopted the geological data of Well DP23-1 and used TOUGH2 software to investigate the hot dry rock (HDR) thermal potential with the water circulation through both horizontal and vertical wells. They analyzed the sensitivity of a series of parameters and determined that the production rate, the reservoir permeability, and the injection well temperature greatly influence geothermal extraction. Recently, they analyzed potential of the Yangbajain geothermal field with the same method. Atrens et al. (2010) used the radiation capacity (the greatest amount of work done by a thermodynamic system to move from a given state to equilibrium with surrounding media) as the reference variable and compared the heat extraction capacity of water and CO2 as heat conducting fluids. They found that the radiation capacity of a CO2–EGS was lower than a traditional EGS mainly due to two reasons: (1) the heat capacity of CO2 is lower, and the heat extracted by unit mass of CO2 is far lower than that of water, and (2) as CO2 is transmitted into the wellbore, the temperature decreases due to the Joule–Thomson effect.
During the process of geothermal extraction, the wellbore (horizontal/vertical or inclined) serves as the main passage for the exchange of medium and energy at the surface and the underground reservoir. Wellbores have many characteristics, including large volumes of pore space and a smooth surface. Darcy’s law no longer governs the viscous flow in a wellbore, which is different from other porous medium. This flow type only follows the popular law of momentum conservation (Zuber and Findlay, 1965).
If the wellbore is a one-dimensional linear cylinder, then the governing equation for its flow processes is the same as in the reservoir, except that the fluid rate does not follow Darcy’s law. In addition to the conduction and convection of energy, this paper also includes the conversion of kinetic energy to gravitational potential energy. This study also considers the heat exchange between the fluid in the wellbore and surrounding formation (Xu, 2012). A fully coupled numerical simulation for a wellbore and a reservoir is the best way to measure the water-heat process. This simulation discretizes and solves the partial differential equation of pressure and temperature at both the wellbore and the reservoir at the same time. T2Well follows this coupling approach (Pan et al., 2011; Pan and Oldenburg, 2014).
This study is based on the artificial heat storage of an HDR geothermal field of Zhacanggou in the Guide area and uses a T2Well simulator to build a coupled wellbore–reservoir model. This work is a trade-off study of the responses of the movement process and heat extraction rate to two working fluids and different flow rates. In this way, we will have a better understanding of influence of injection flow rates on heat extraction rates and system sustainability.
Model and simulation planning
Geologic conditions for the thermal reservoirs
Zhacanggou is a valley before low- and medium-height mountains, situated 15 km southwest of the Guide County. The basin foundation consists of ancient layers from the Triassic Age; granites of the Indo-Chinese Epoch piled up with mudstones, silty clay, sandstone, and glutenite formations; and Quaternary system loose strata from the Miocene and Pliocene Series of the Paleogene and Neogene Systems in the Cenozoic Erathem. The depth of the stones ranges from 1400 to 1700 m. The HDR DR1 well stands at the convergence of the northwest and northeast ruptures, revealing rather complete granite bodies that are 2800 m below the surface. The temperature at 3050 m below has been recorded at 151.34°C (Figure 1) (Report from Environmental and Geological Exploration Bureau of Qinghai Province).
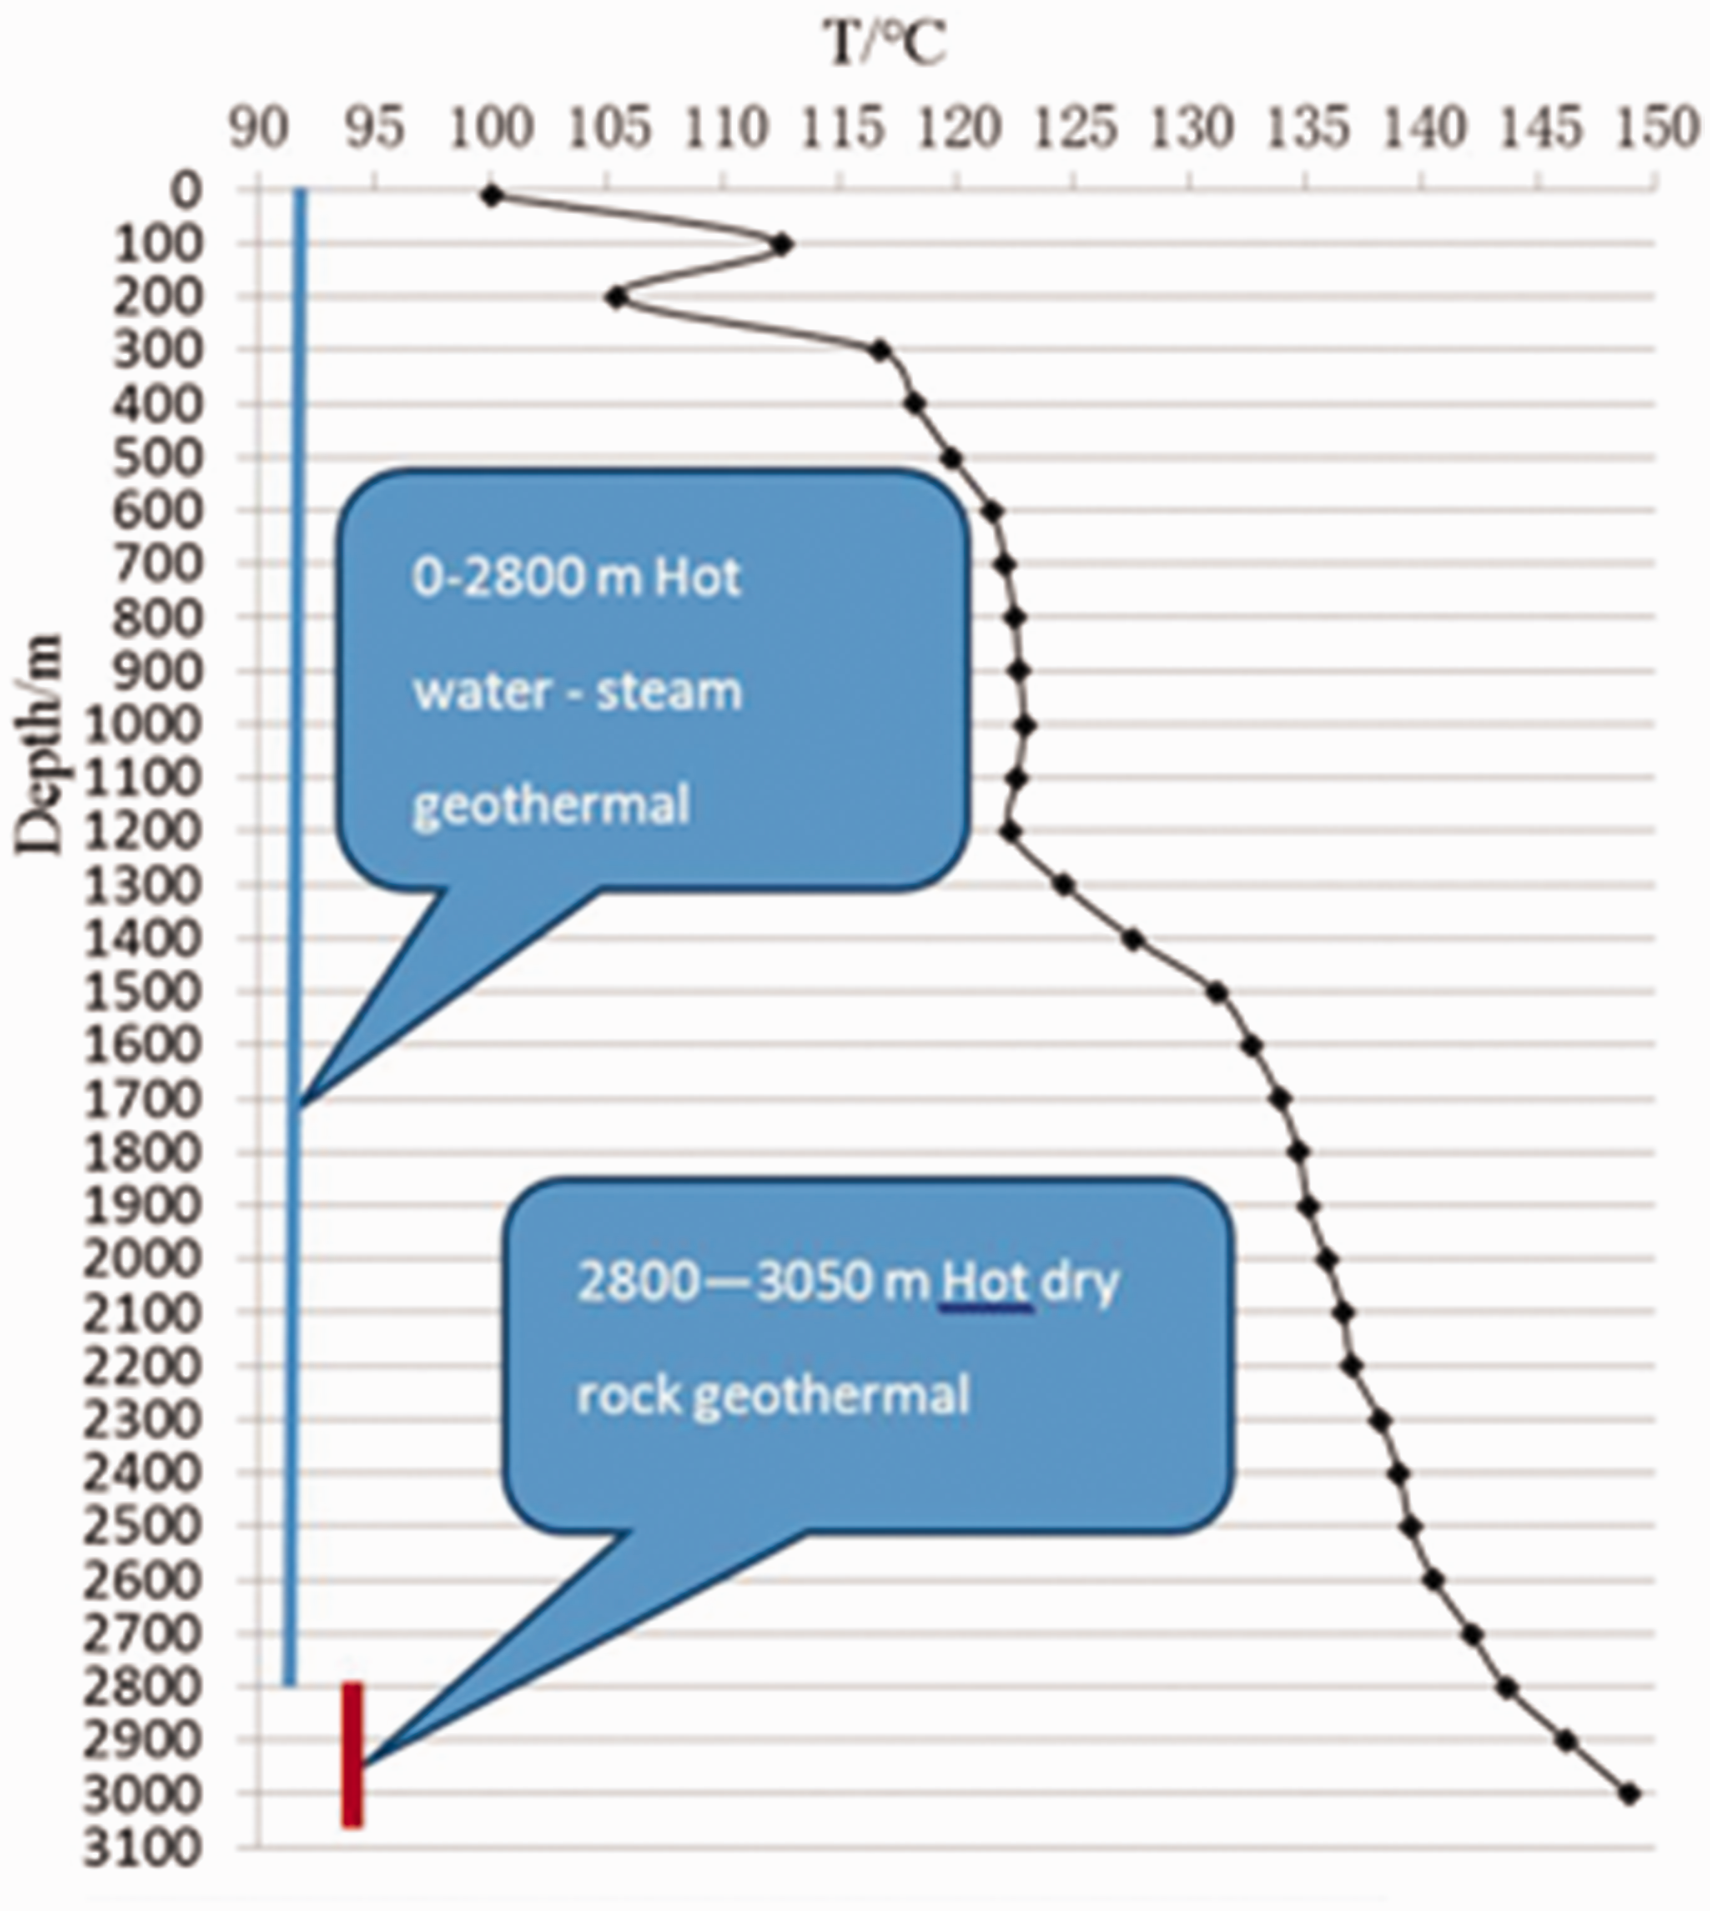
Geothermal gradient of DR1 well in Zhacanggou.
To meet the requirements of EGS engineering, artificial fracturing is needed to increase the permeability of reservoir. The paper treats the granite heat storage after reservoir modification as the target man-made reservoir.
Setting up the model
With reference to the HDR development projects in the USA and Japan and the geologic conditions in Zhacanggou, researchers have three wells (one for injection and two for extraction) deployed alongside the long axis of the HDR structures within 1 km2. The well in the middle is for injection and two production wells are built 500 m away from the injection well at two sides (see Figure 2(a)). The production well 500 m away from the injection well is defined as the water border. In the past research studies, the “five-spot” pattern is a classic well pattern. However, this pattern is an idealized model in a realistic project, and it is too expensive to build a well group; therefore, a more realistic pattern is chosen for this study. The paper assumes that the geothermal reservoir is a porous medium of 100 m in depth, and the parameters are shown in Table 1. The geothermal gradient and permeability are taken from the data measured, the wellbore parameter is from other scholars’ research (Pruess, 2008). The initial reservoir pressure is still at the water pressure with the temperature of 151.34°C. Since the paper focuses on the impact of different CO2 injections on heat extraction, the initial CO2 is saturated. Due to symmetry of the region, the paper only studies one-fourth of the area (with injection and productivity being one-fourth) and produces a model-based analysis. At the lateral side of the model are waterproof and heatproof borders with bottom and top of waterproof and thermal-conductive borders. The heat flow calculation refers to Vinsome and Westerveld (1980). For the wellbores, there are one-dimensional stable flows inside and their heat transfer with outside rocks resembles that of the bottom and top plates, hence the same calculation methods.
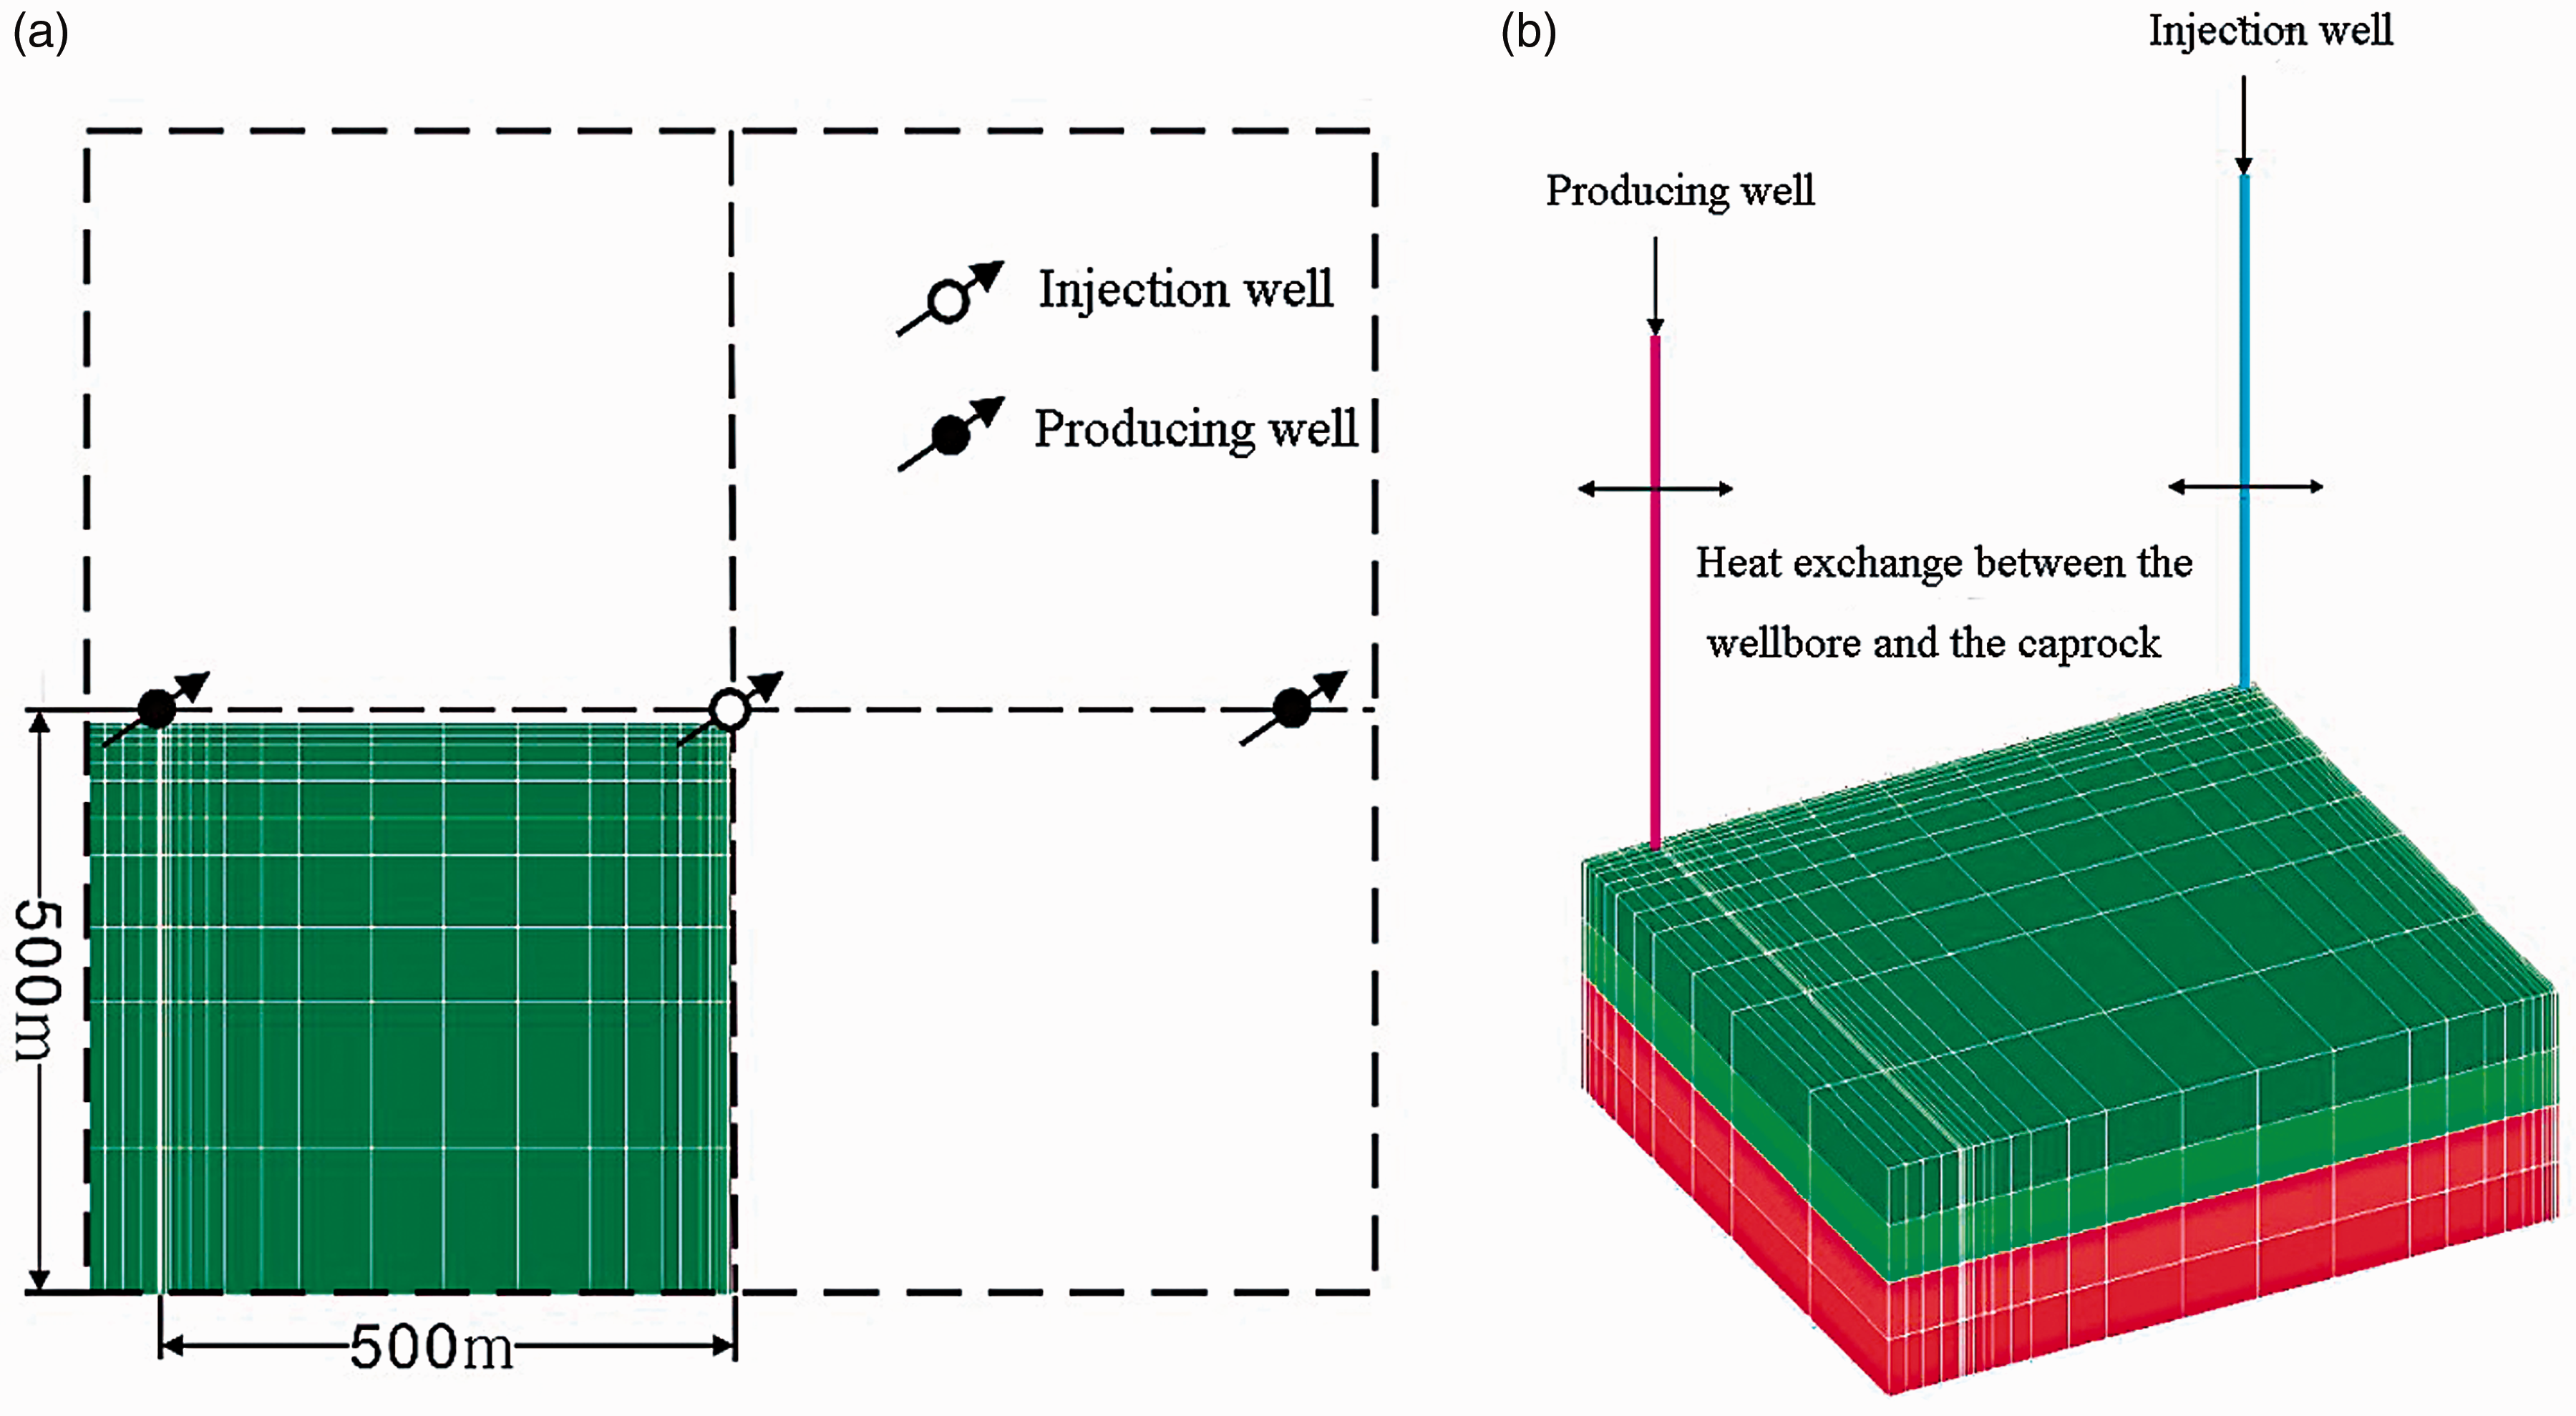
Conceptual model illustration.
Geological traits and initial conditions of the concept model.
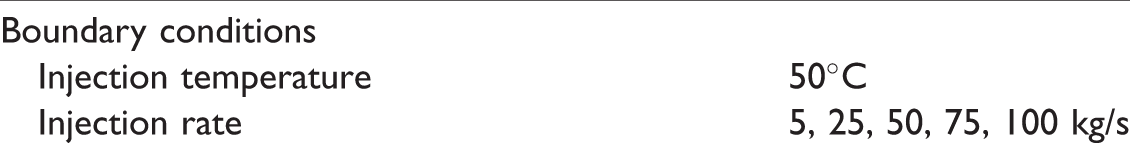
An irregular two-dimensional model (Figure 2(b)) is set up. The sizes of grid blocks range from 0.1 m for those near the wellbore to 50 m for those farther away, which offers an accurate picture of the changes in the flow fields (Figure 2(b)). The wellbore is set as a one-dimensional vertical model. The bottom is 3000 m from the ground, and the depth is divided into 30 grid blocks with the lower part connected to the reservoir. Based on geologic information about the research field, the parameters of man-made heat storage are set (Table 2). Since the paper focuses on the impact of different injection rates on the heat extraction system, five scenarios are set, i.e. 5, 25, 50, 75, and 100 kg/s.
Boundary conditions of the model.
Simulation method
The research adopts the wellbore–reservoir coupling software T2Well as the simulator. It is developed based on the multiphase multicomponent simulation program Tough2. ECO2N v2.0 module is used to simulate multiphase flows of CO2 and water under high temperature conditions.
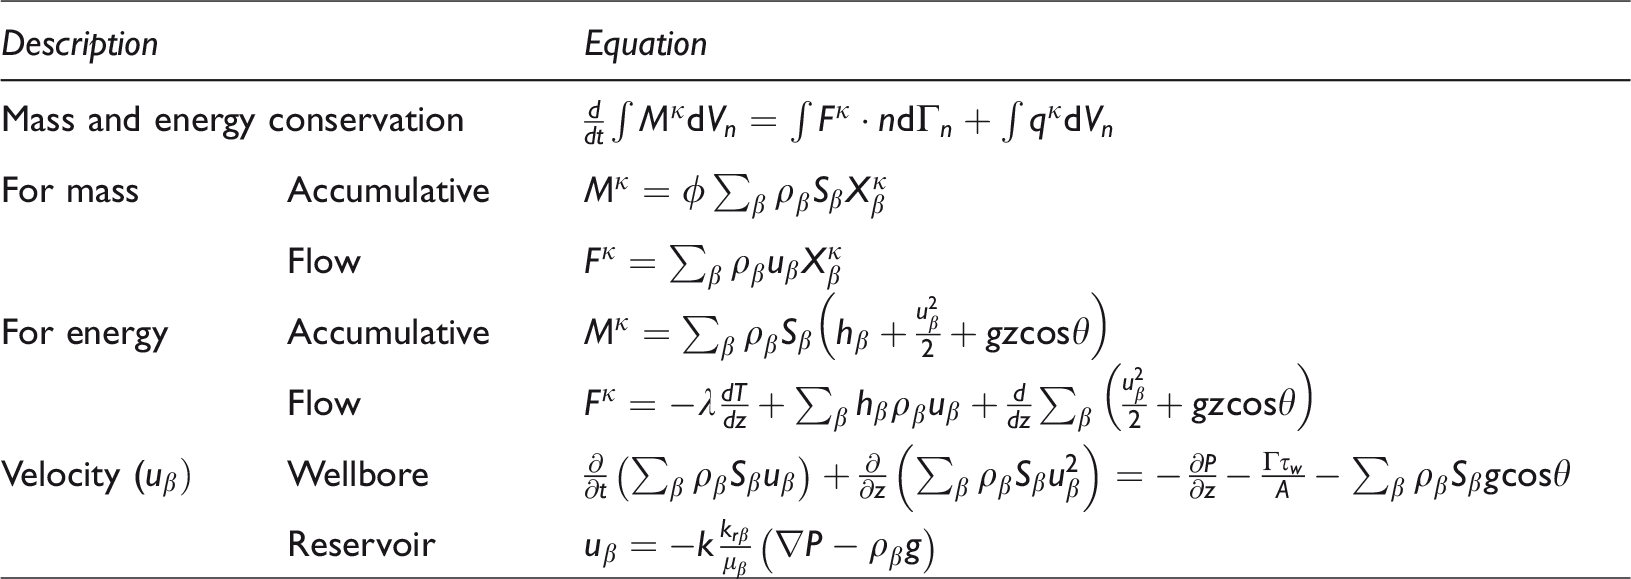
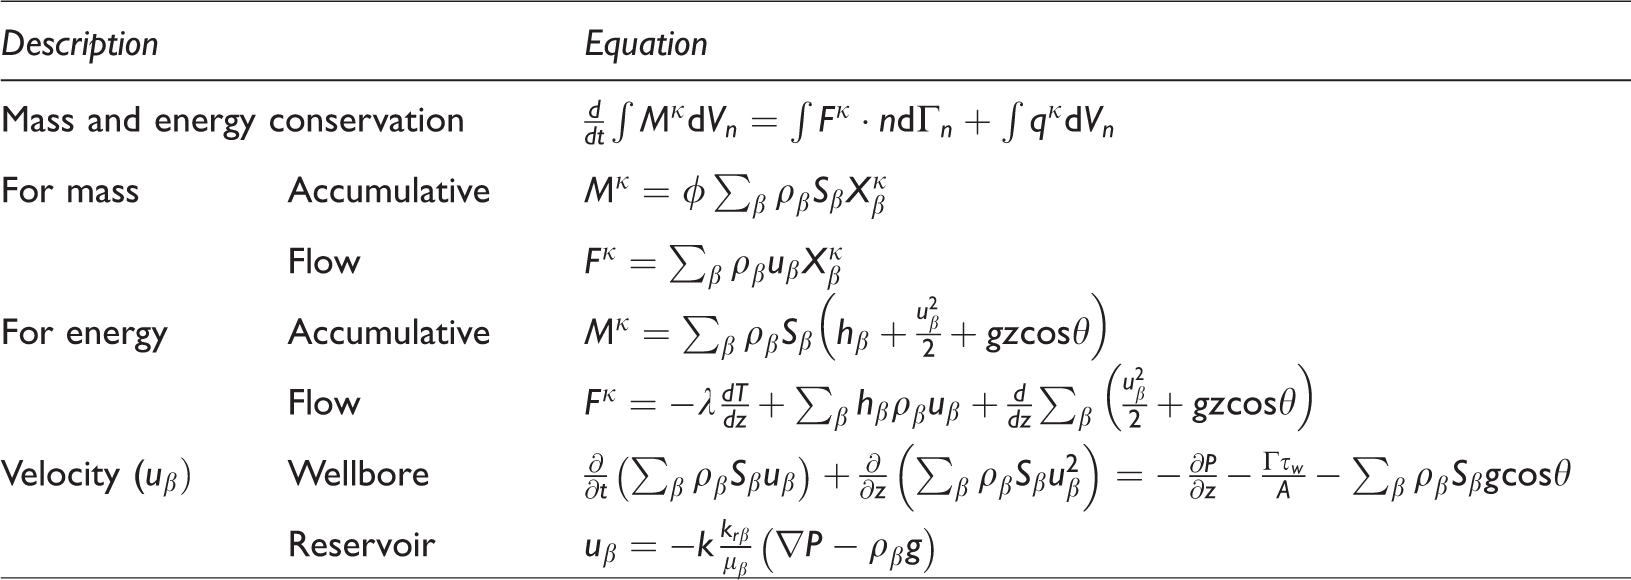
T2Well takes wellbores and reservoirs as a whole, and different governing equations are applied to the two subdomains. Traditional multiphase Darcy’s law is applied to the reservoir, and in the wellbore, one-dimensional conservation of momentum is applied. The primary variable of the multiphase mixture velocity is used for the calculation, the drift flux model (Zuber and Findlay, 1965) is used to obtain the different phases of rate, and the parameter for the drift flux model is taken from Shi (2005). Based on the conservation of energy, the kinetic energy and gravitational energy are ignored due to the slow flow rate in the reservoir. In the wellbore, the kinetic energy and gravitational potential energy need to be considered. The flow between wellbore and reservoir is described by Darcy’s flow. The governing equation is shown in Table 3, and the meanings of symbols are explained in the Appendix.
Governing equations for numerical simulation.
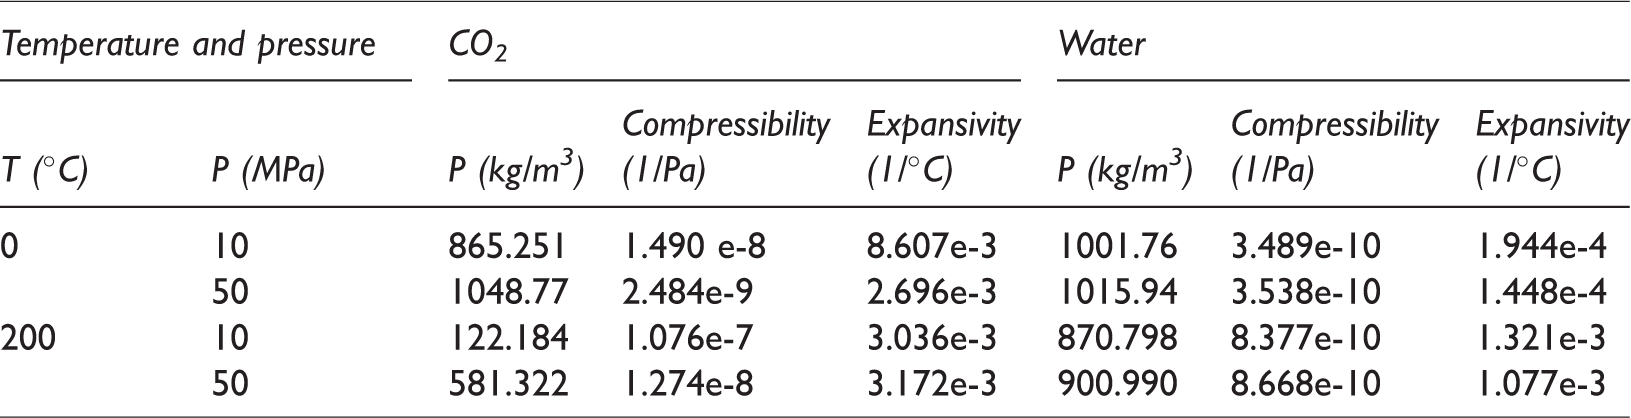
CO2 density, compressibility, and expansivity within designated temperatures and pressures ranges.
Results and discussions
Comparison of the thermophysical properties between CO2 and water
CO2, as a new alternative to the traditional working fluid for extracting geothermal heat, has less density, a lower viscosity, and a larger expansivity (Figure 3), which leads to greater mobility and buoyancy force. Thus, CO2 reduces the driving pressure of the fluid and conserves more energy generated by external pumping (Vukalovich and Altunin, 1968).
Fluid mass flow rate for a given driving force is proportional to the ratio of density to viscosity, namely, m = ρ/μ (Figure 3). Both temperature and pressure significantly influence the density and viscosity of CO2, and these properties of water are largely affected by temperature. Therefore, in the comparison of the ratio of density to viscosity, CO2 exceeds water. The ρ/μ of CO2 attains maximum values in a region that emanates from the CO2 saturation line and decreases for liquid-like CO2 (low T, high P) and gas-like CO2 (high T, low P). For (T, P) conditions relevant for fluid injection, T ≤ 50°C, and the ρ/μ of CO2 is 4–10 times that of water. For temperatures between 100 and 200°C, the ρ/μ of CO2 is approximately 2–3 times that of water (Table 4). It can be deduced that within the ranges of the temperature and pressure conditions for injection and production, CO2 demonstrates the larger ρ/μ values (Pruess, 2006).
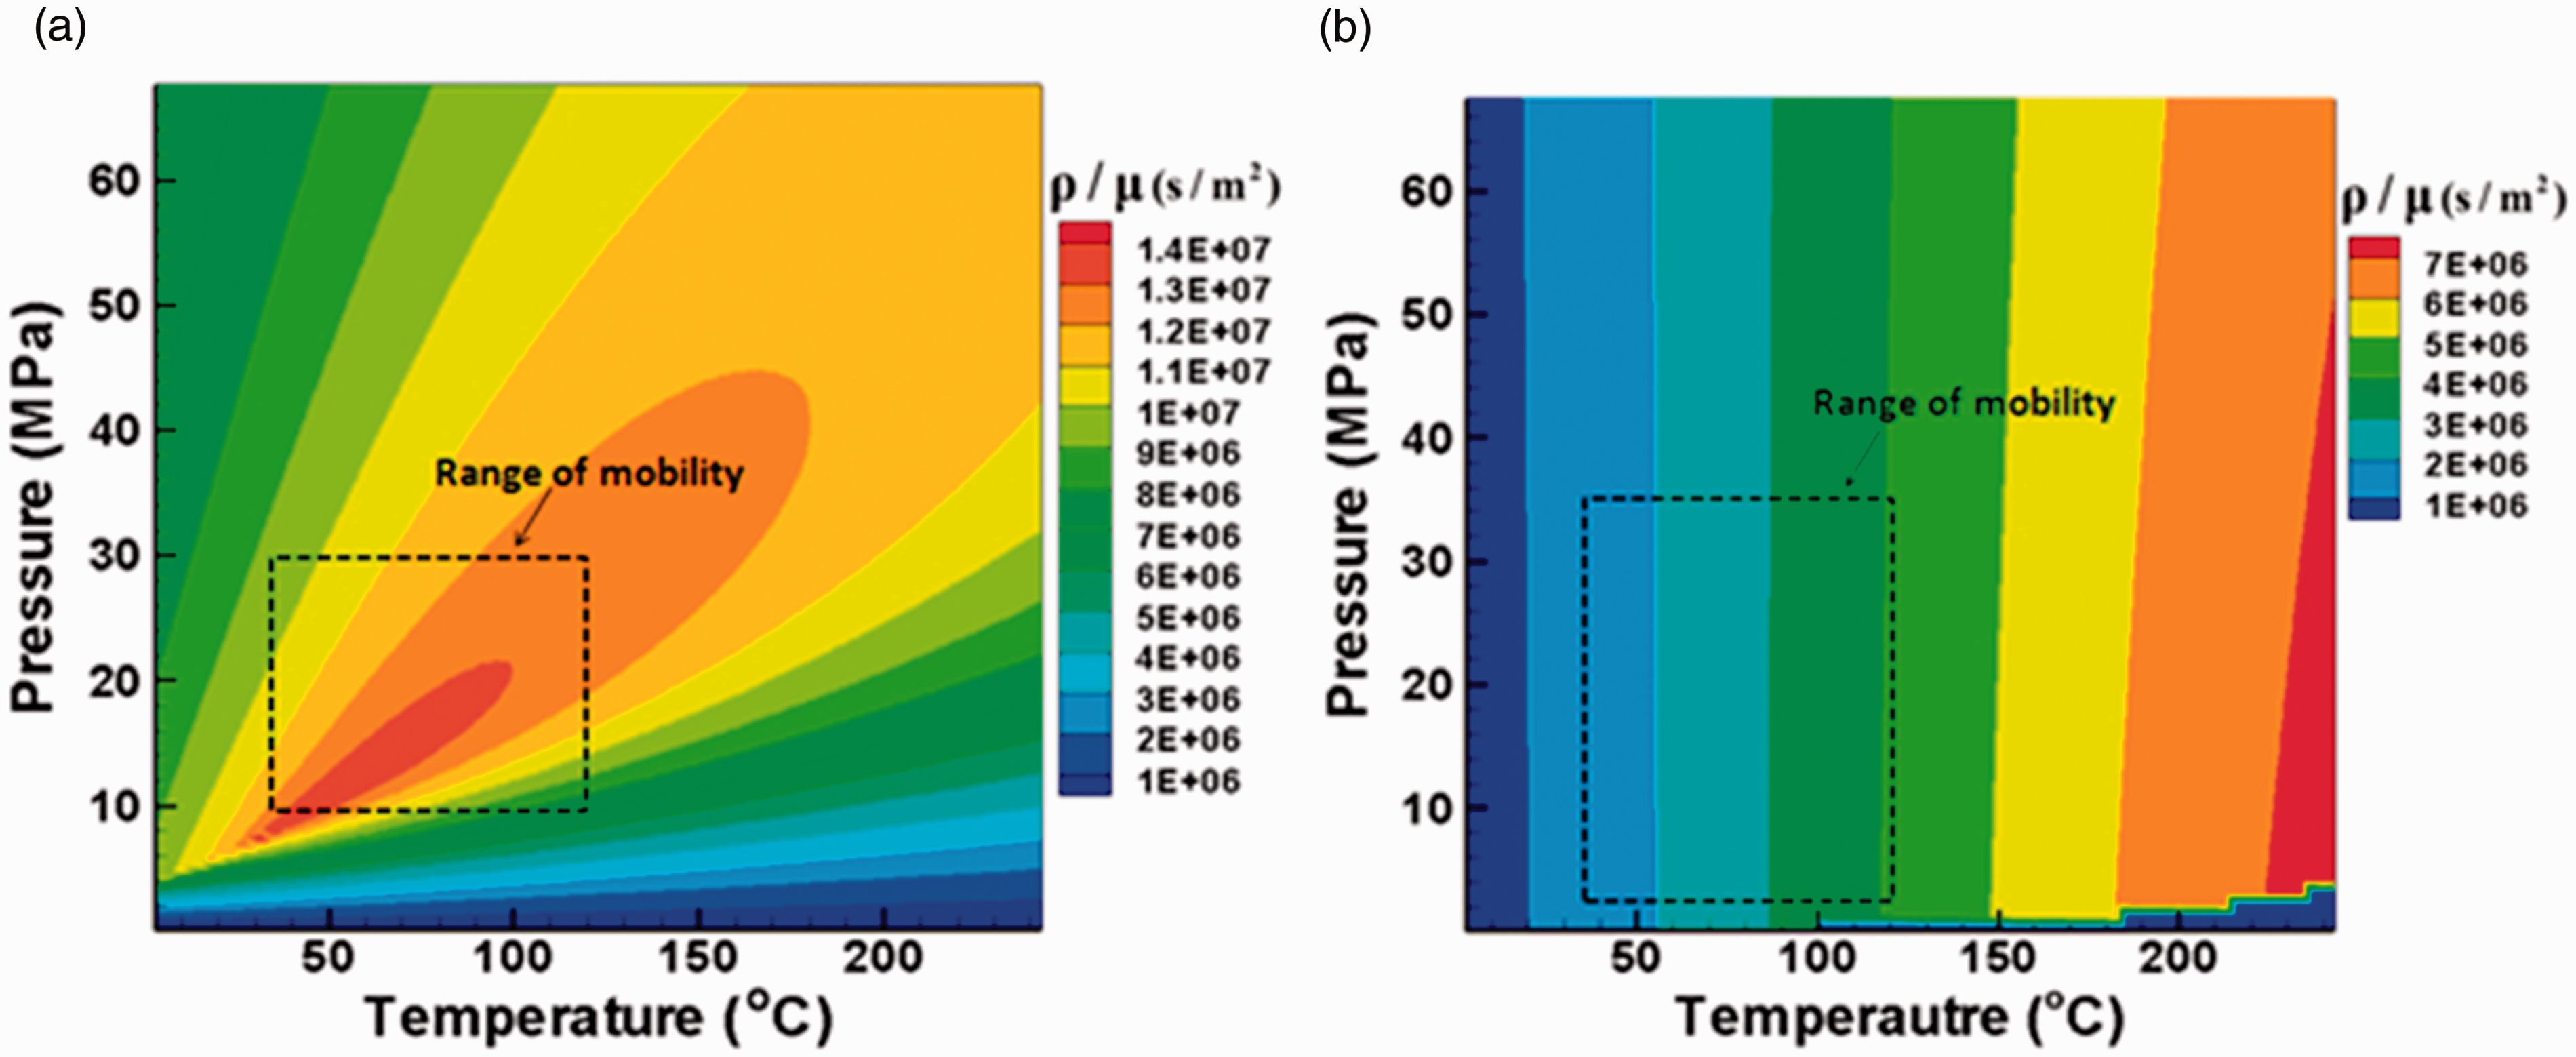
The influence of temperature and pressure on ρ/μ (CO2—left, water—right) (Pruess, 2006).
Figure 4 compares the specific enthalpies for CO2 and water. In both cases, the reference state was chosen as (T, P) = (20°C, 100 bar). In the high-pressure area, an increase in the specific enthalpy with temperature for CO2 is less than half of the increase for water, which means that more than twice the CO2 mass flow rate is needed to achieve the same rate of sensible heat transport. The specific enthalpy of liquid water depends primarily on temperature with only a weak pressure dependence but becomes increasingly stronger at lower pressures and higher temperatures. For adiabatic (thermal insulated) decompression, the thermodynamic conditions move along the lines of a constant specific enthalpy. Accordingly, the decompression of hot and high-pressure CO2 is accompanied by a substantial temperature decline, while for liquid water, there is a small temperature increase. However, the high ρ/μ of CO2 can compensate for its shortage in specific enthalpy.
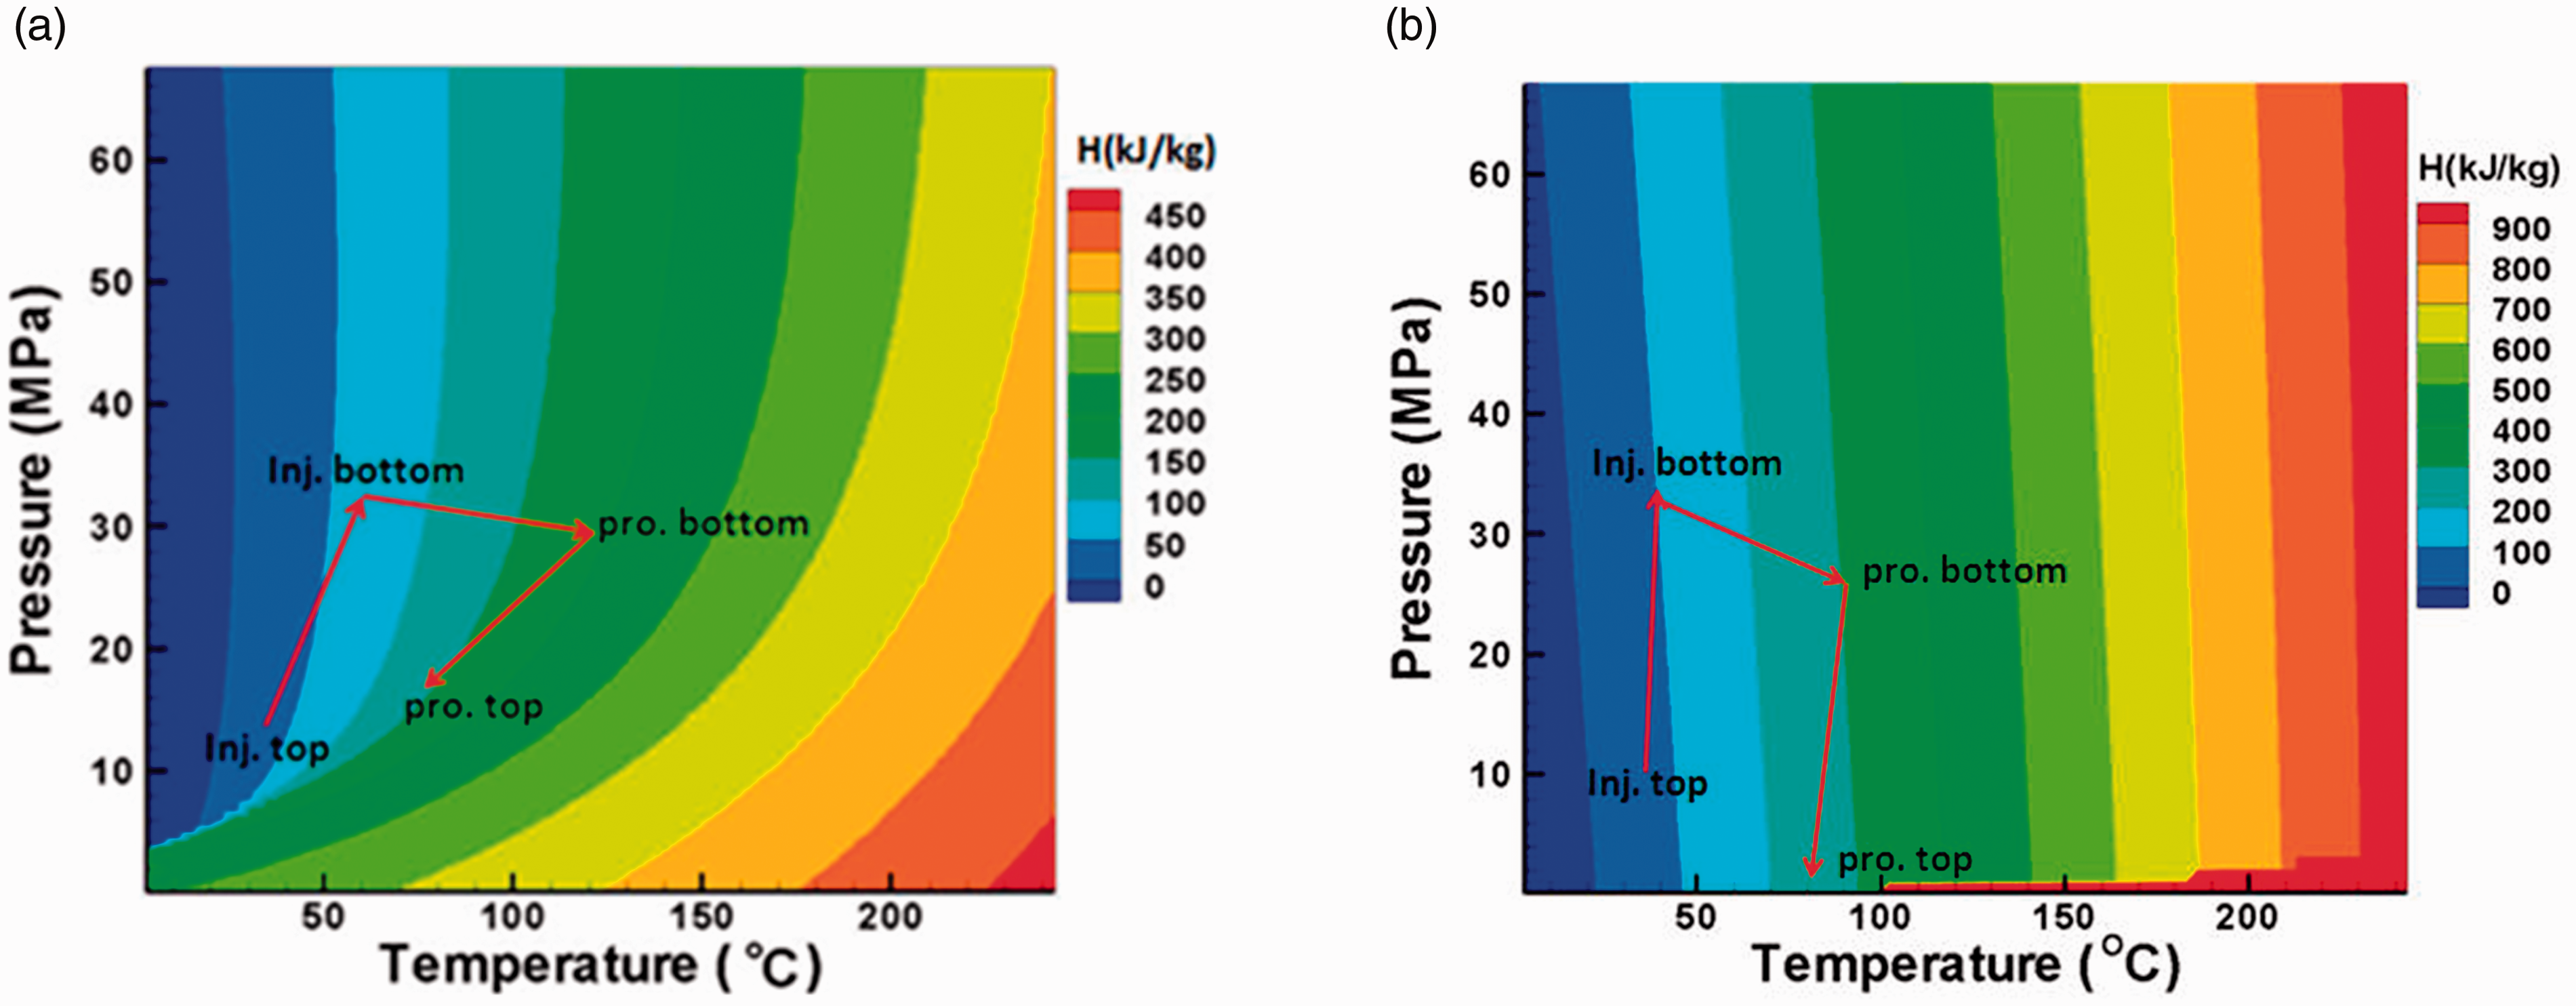
The specific enthalpies for CO2 (left) and water (right) (Pruess, 2006).
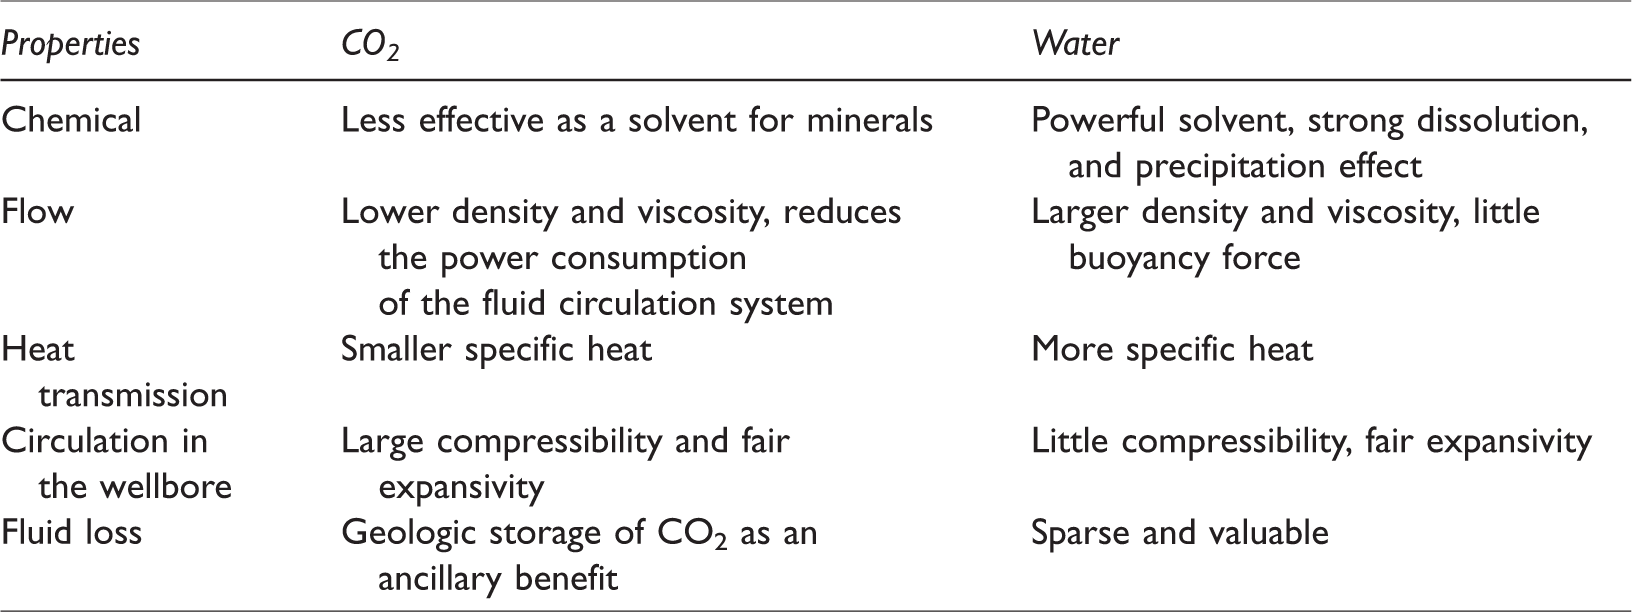
Generally, CO2 is vastly different from traditional working fluids with respect to its thermodynamic properties (Table 5) (Brown, 2000). CO2 has certain favorable and unfavorable properties, on which many scholars have conducted their studies. Due to the lack of field experience, the long timespan for excavating a geometric thermal model, difficult operation and supervision, and high costs, a numerical simulation has become an effective and cost-efficient method. Pruess (2006) first simulated the comparisons in the efficiency of using water and CO2 as the working fluids in an EGS under certain thermodynamics condition (T=200°C, P=50 MPa), and noted that under the same preliminary storage conditions, CO2 has a relatively lower viscosity, higher heat extraction efficiency, and mass flow efficiency than those of water. Within the range of research temperature and pressure, the injected condition does not greatly influence water because water is far from its critical point and is seen as a noncompressible fluid, barely affected by the temperature and pressure in the wellbore. However, the injected conditions of temperature and pressure influence the output of CO2 from the wellhead. Therefore, for the CO2–EGS, the optimized factors should be the injected conditions of temperature and pressure and the production pressure (Pruess, 2008).
Comparison of CO2 and water as heat transmission fluids.
The changes in the parameters in the circulation of the two working fluids and the analysis of their heat extraction
Wellbore
The wellbore and reservoir processes are highly coupled, and their interactions greatly impact and complicate the performance of a CO2-based geothermal heat extraction system. These effects are also found to be strongly flow rate dependent.
Figures 5 and 6 show the injection and bottom temperature and pressure changes in the CO2–EGS and water–EGS under five different flow rates conditions. The water–EGS has an increased injection pressure in the injection wellhead with increasing flow rate, displaying a fairly linear functional relationship. The CO2–EGS is different. Apart from the 5 kg/s flow rate, the remaining 11.5 MPa pressure during the entire production period and the injection pressure increases with flow. A flow rate of 5 kg/s suggests a higher injection pressure. Under certain conditions, small flows require more powerful injection pressures because small flows will cause heat loss to the surrounding rocks, thus less density and more influence from the buoyancy force. A low flow rate is harder to “inject” than a high-rate flow.
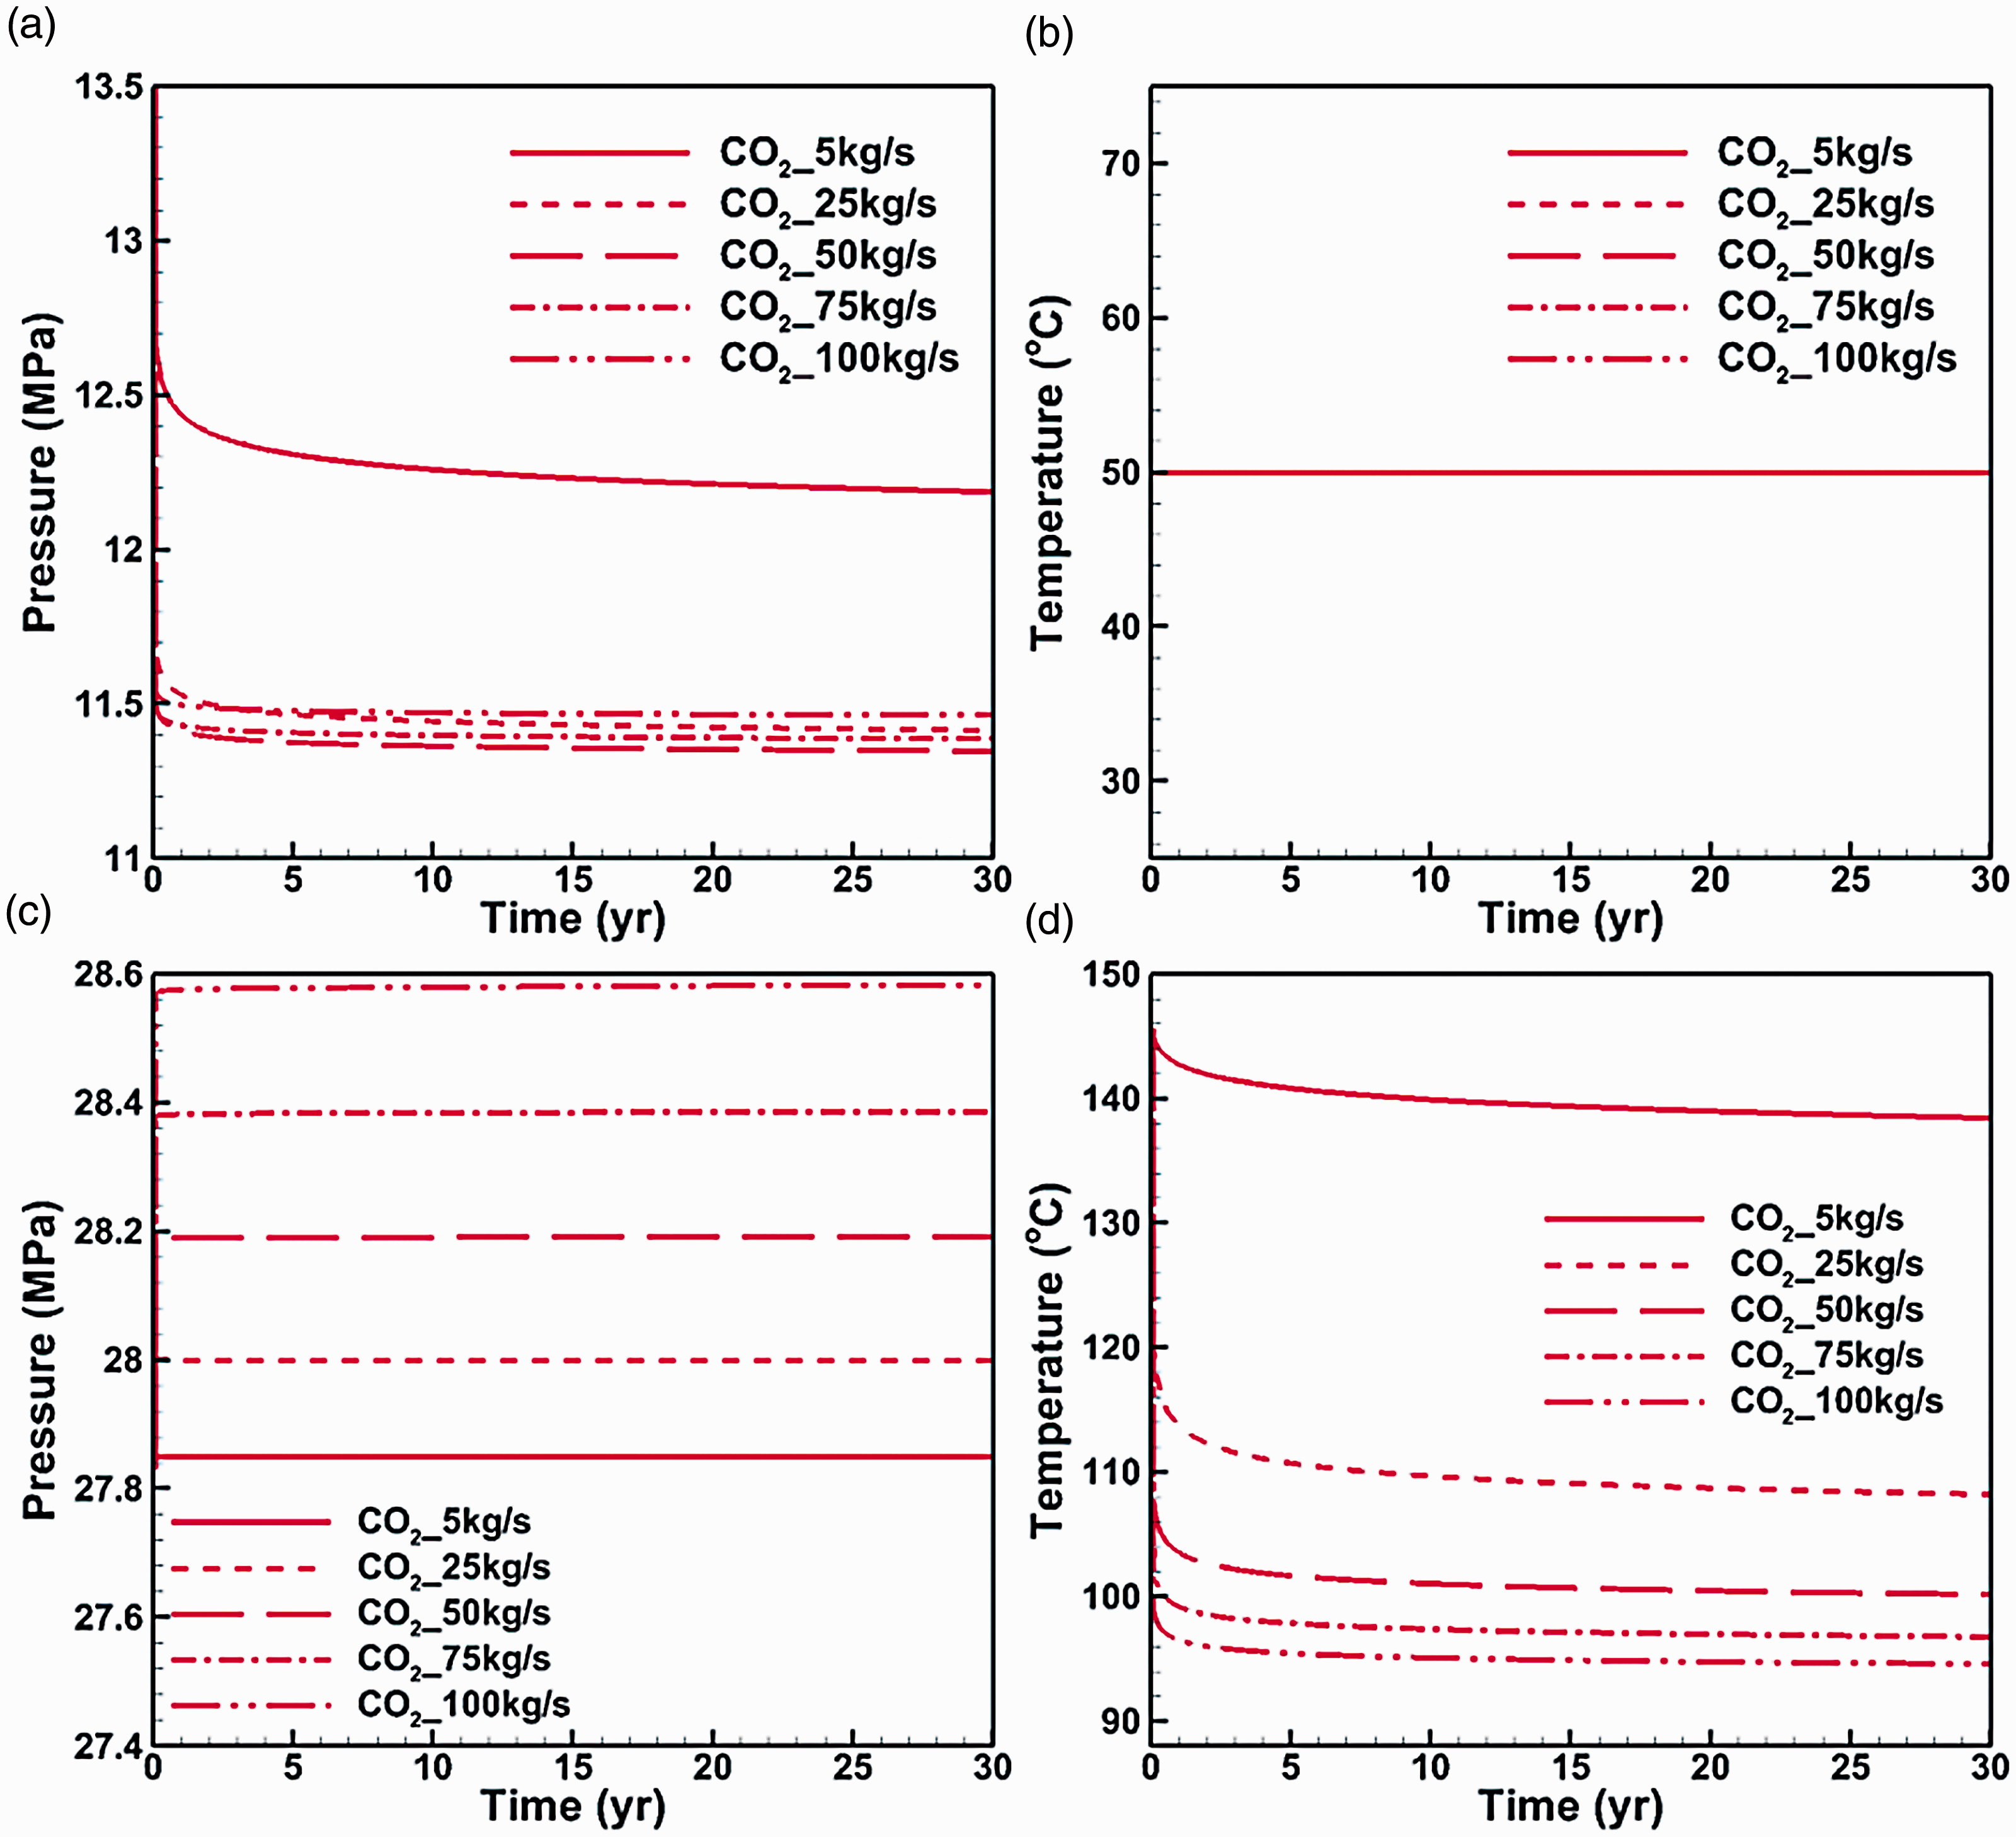
Under different flow conditions, the injection wellhead (a, b) and bottom (c, d) temperature and pressure changes in a CO2–EGS.
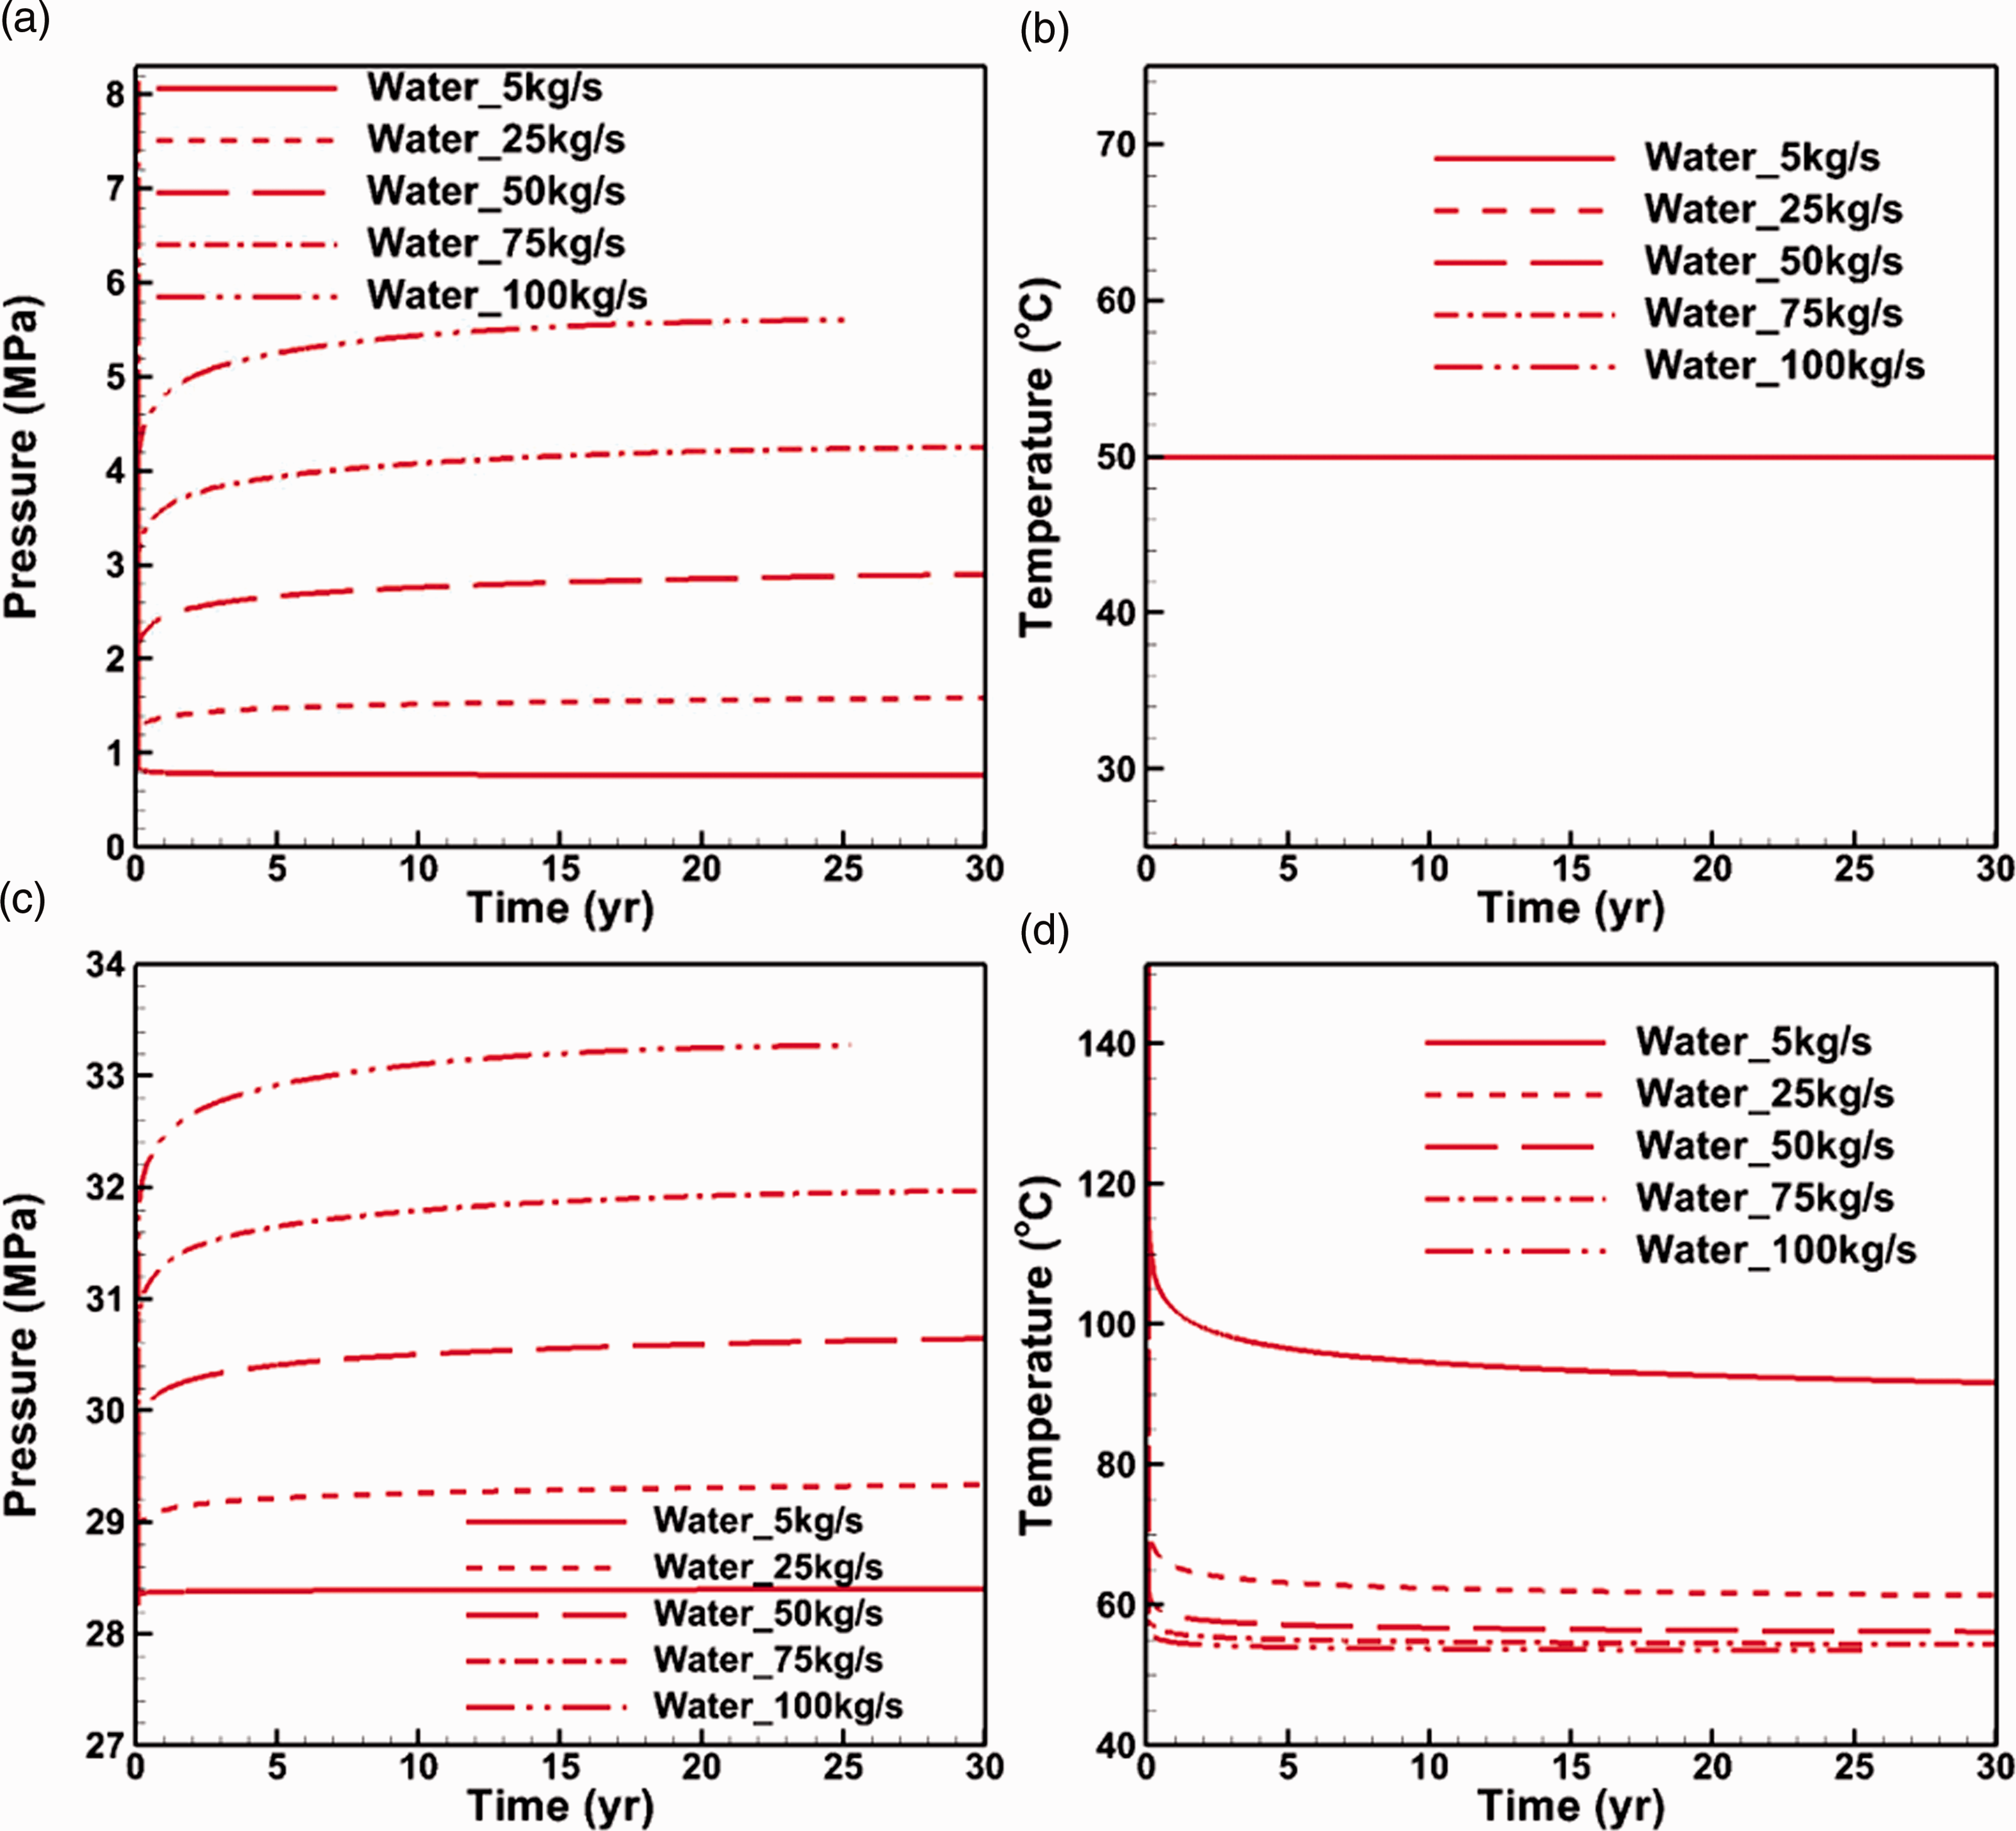
Under different flow conditions, the injection wellhead (a, b) and bottom (c, d) temperature and pressure changes in a water–EGS.
For the well bottom, the water–EGS is similar to the CO2–EGS: the pressure and flow are positively correlated in well-bottom injection (Figure 5(c)) but negatively correlated in the well-bottom production. Their difference is that the well-bottom pressure of the water–EGS in the injection well is higher than that of the CO2–EGS. This difference is mainly because during the injection, water has a slower rate and a larger density. For the CO2–EGS, the production pressure and flow in the well bottom almost have an arithmetic relation, which remains stable most of the time. This stability is because the fluid flow in the storage level obeys Darcy’s law. The difference in pressure is the only driving force of flow. In the storage level, the flow rate of CO2 may differ, but its density and dynamic viscosity are basically the same. Therefore, the relation can appear to be an arithmetic relation. For the temperature in the well bottom, the slower the flow is, the more heat is extracted from the external surface, and the higher the temperature of the bottom will be.
During the production of the wellheads of the water–EGS and CO2–EGS, the temperatures generally increase with flow. A flow slower than 5 kg/s has a significantly lower temperature than do other flow rate cases. The water–EGS is 10°C hotter than the CO2–EGS because the lower the flow rate is, the greater the heat loss to the external surface is. The specific enthalpy of water is larger than that of CO2, which leads to a decreased drop in temperature with the same amount of heat loss. Moreover, for high-rate flows (75 and 100 kg/s), the temperatures of the wellhead all show evident drops during the latter period (Figures 7 and 8). This decrease is because the heat consumption at the storage level has kept the density from growing, and thus the pressure of the wellhead was lowered. The density of CO2 is influenced by both the temperature and pressure, which forms a complicated functional relationship (Figure 7). Otherwise, it is worth noting that during the entire underground circulation, the injection pressure of water in the wellhead is larger than the production pressure, indicating that pressure loss is inevitable during the extraction of geothermal energy. Compared with water, the CO2–EGS production pressure in the wellhead is generally larger than in the injection well. This effect shows that the system can be operated through the siphon phenomenon. Note that this phenomenon more profoundly influences high-rate situations. The phenomenon is generated because of the compressibility of the CO2 temperature. The CO2 density largely depends on temperature. Compared with the injection well, CO2 in the production well has a higher temperature, a lower density, and a stronger buoyancy force. Therefore, the pressure of gravity in the production well is so much lower than in the injection well. When the difference of the pressures is large enough, the pressure in the production wellhead could be larger than the injection pressure. Therefore, the external device for consistent operation will not be needed.
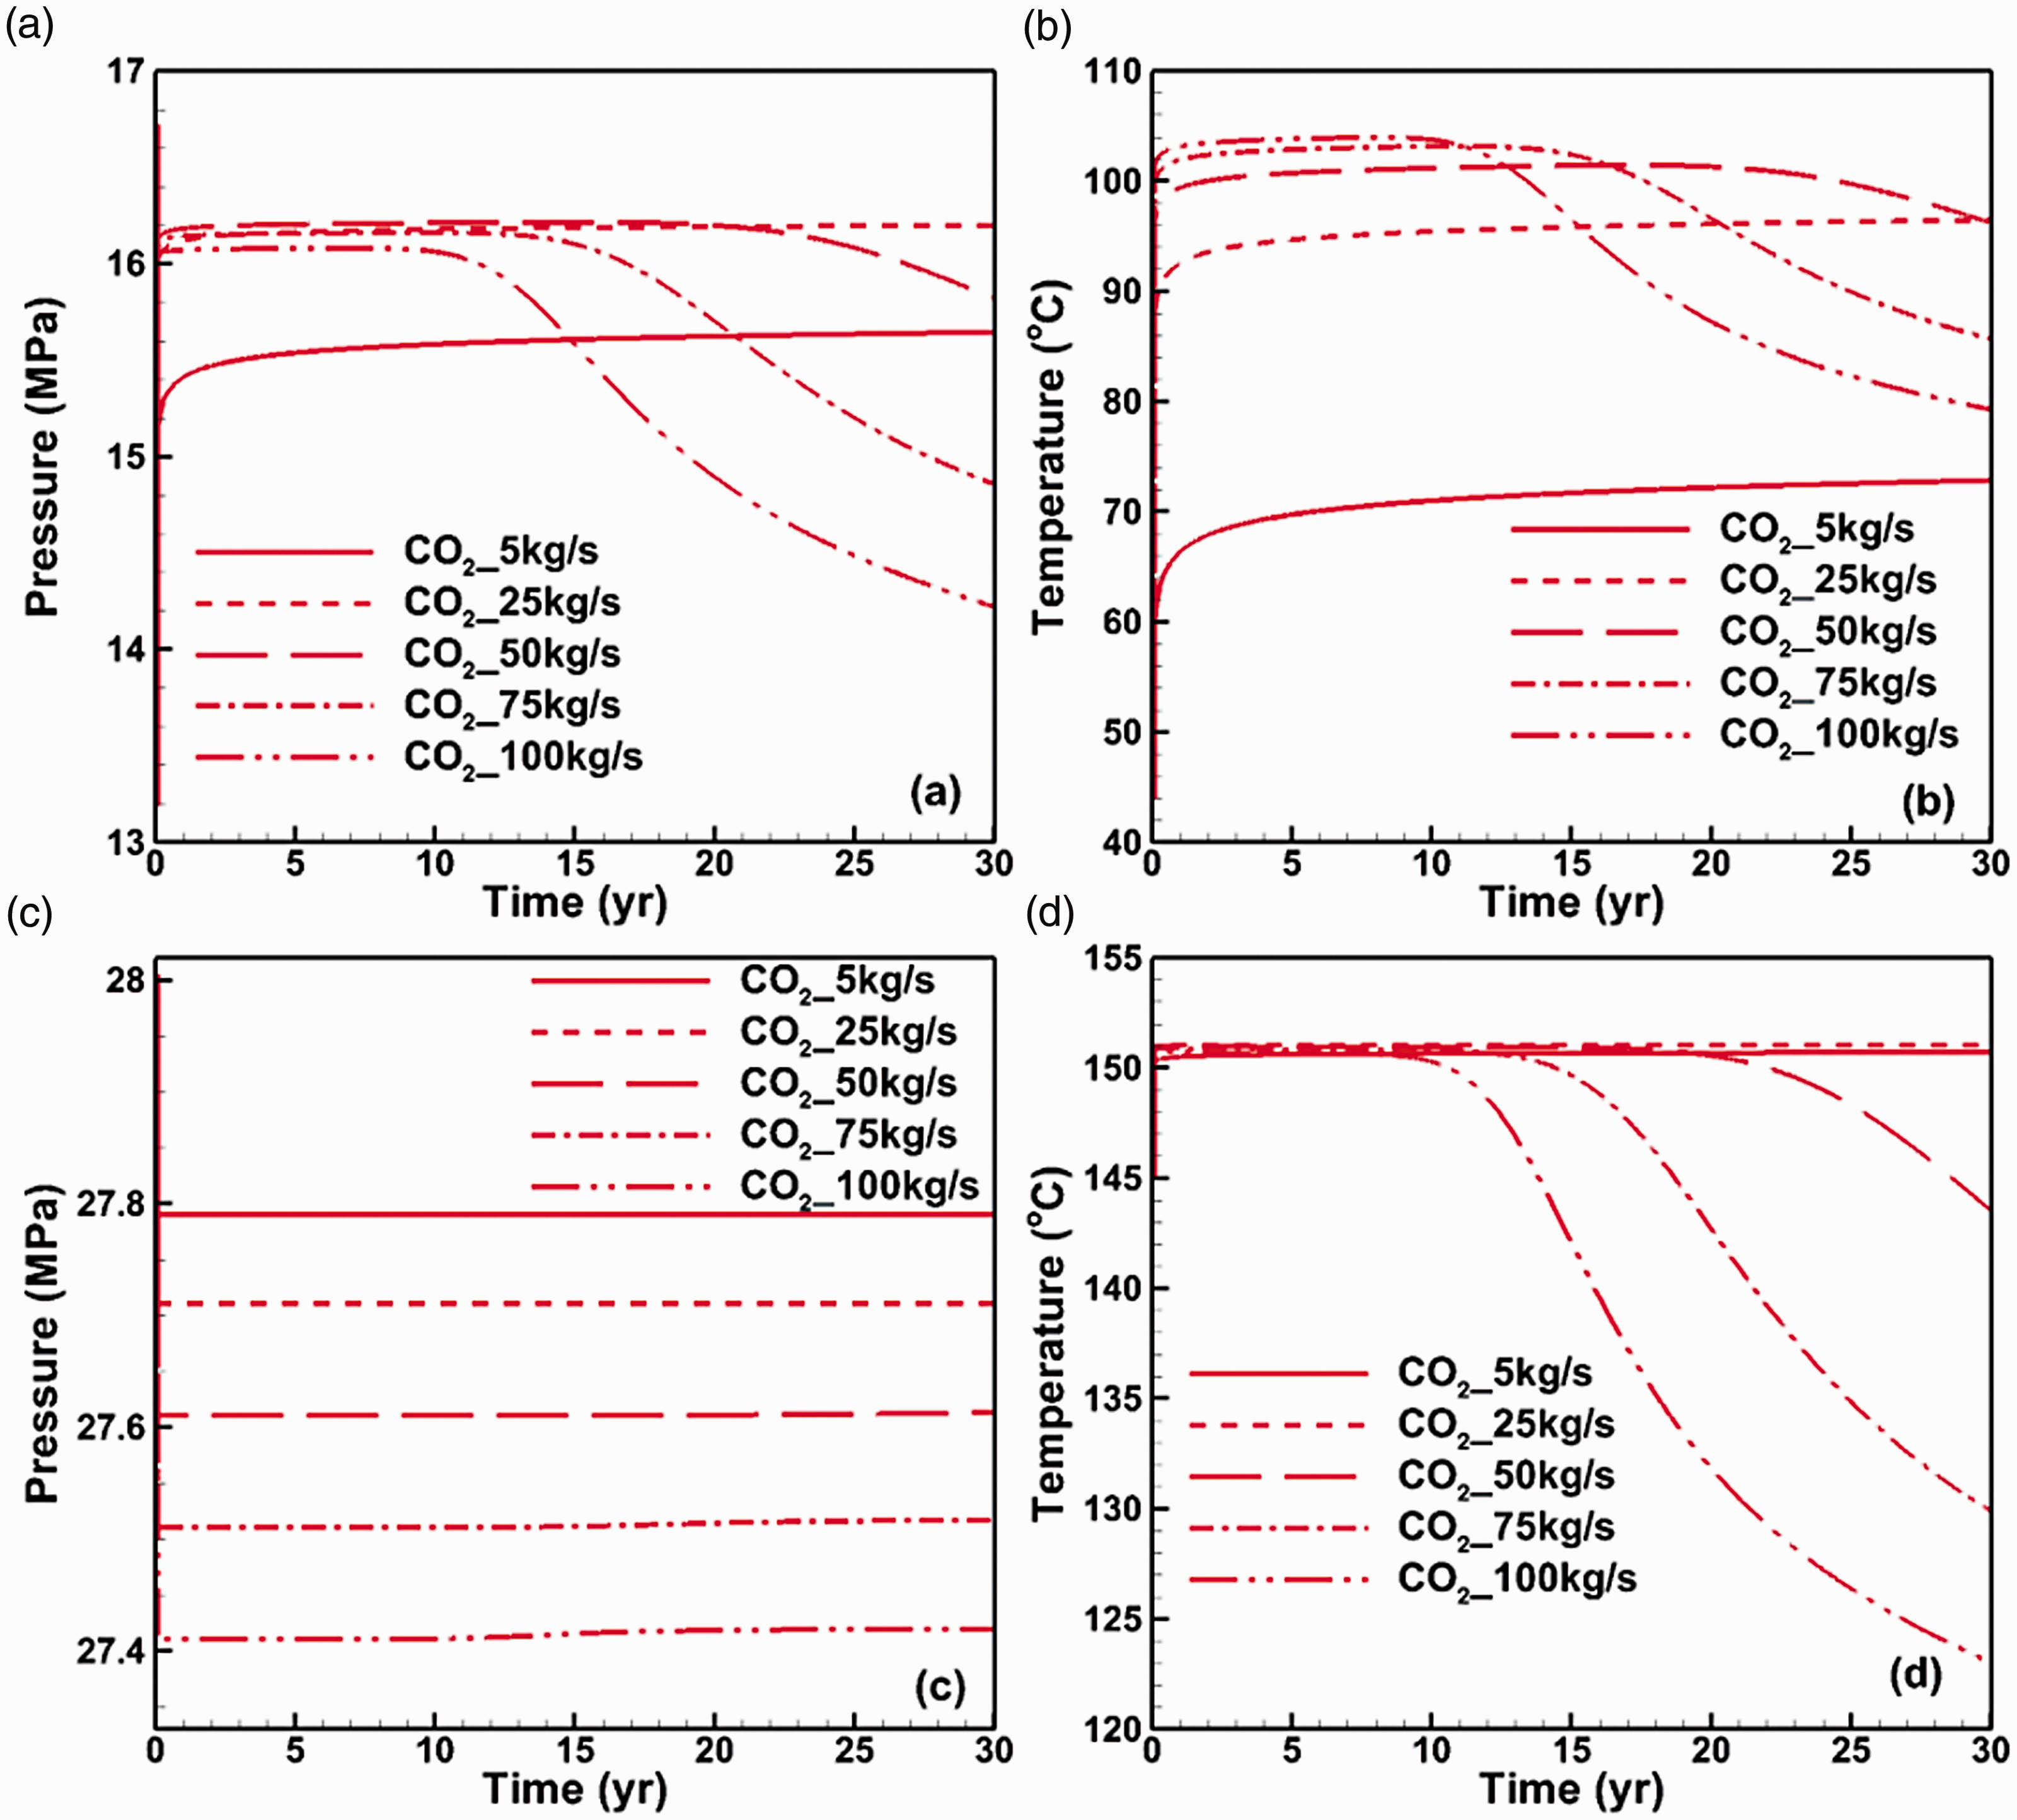
Under different flow conditions, the production wellhead (a, b) and bottom (c, d) temperature and pressure changes in a CO2–EGS.
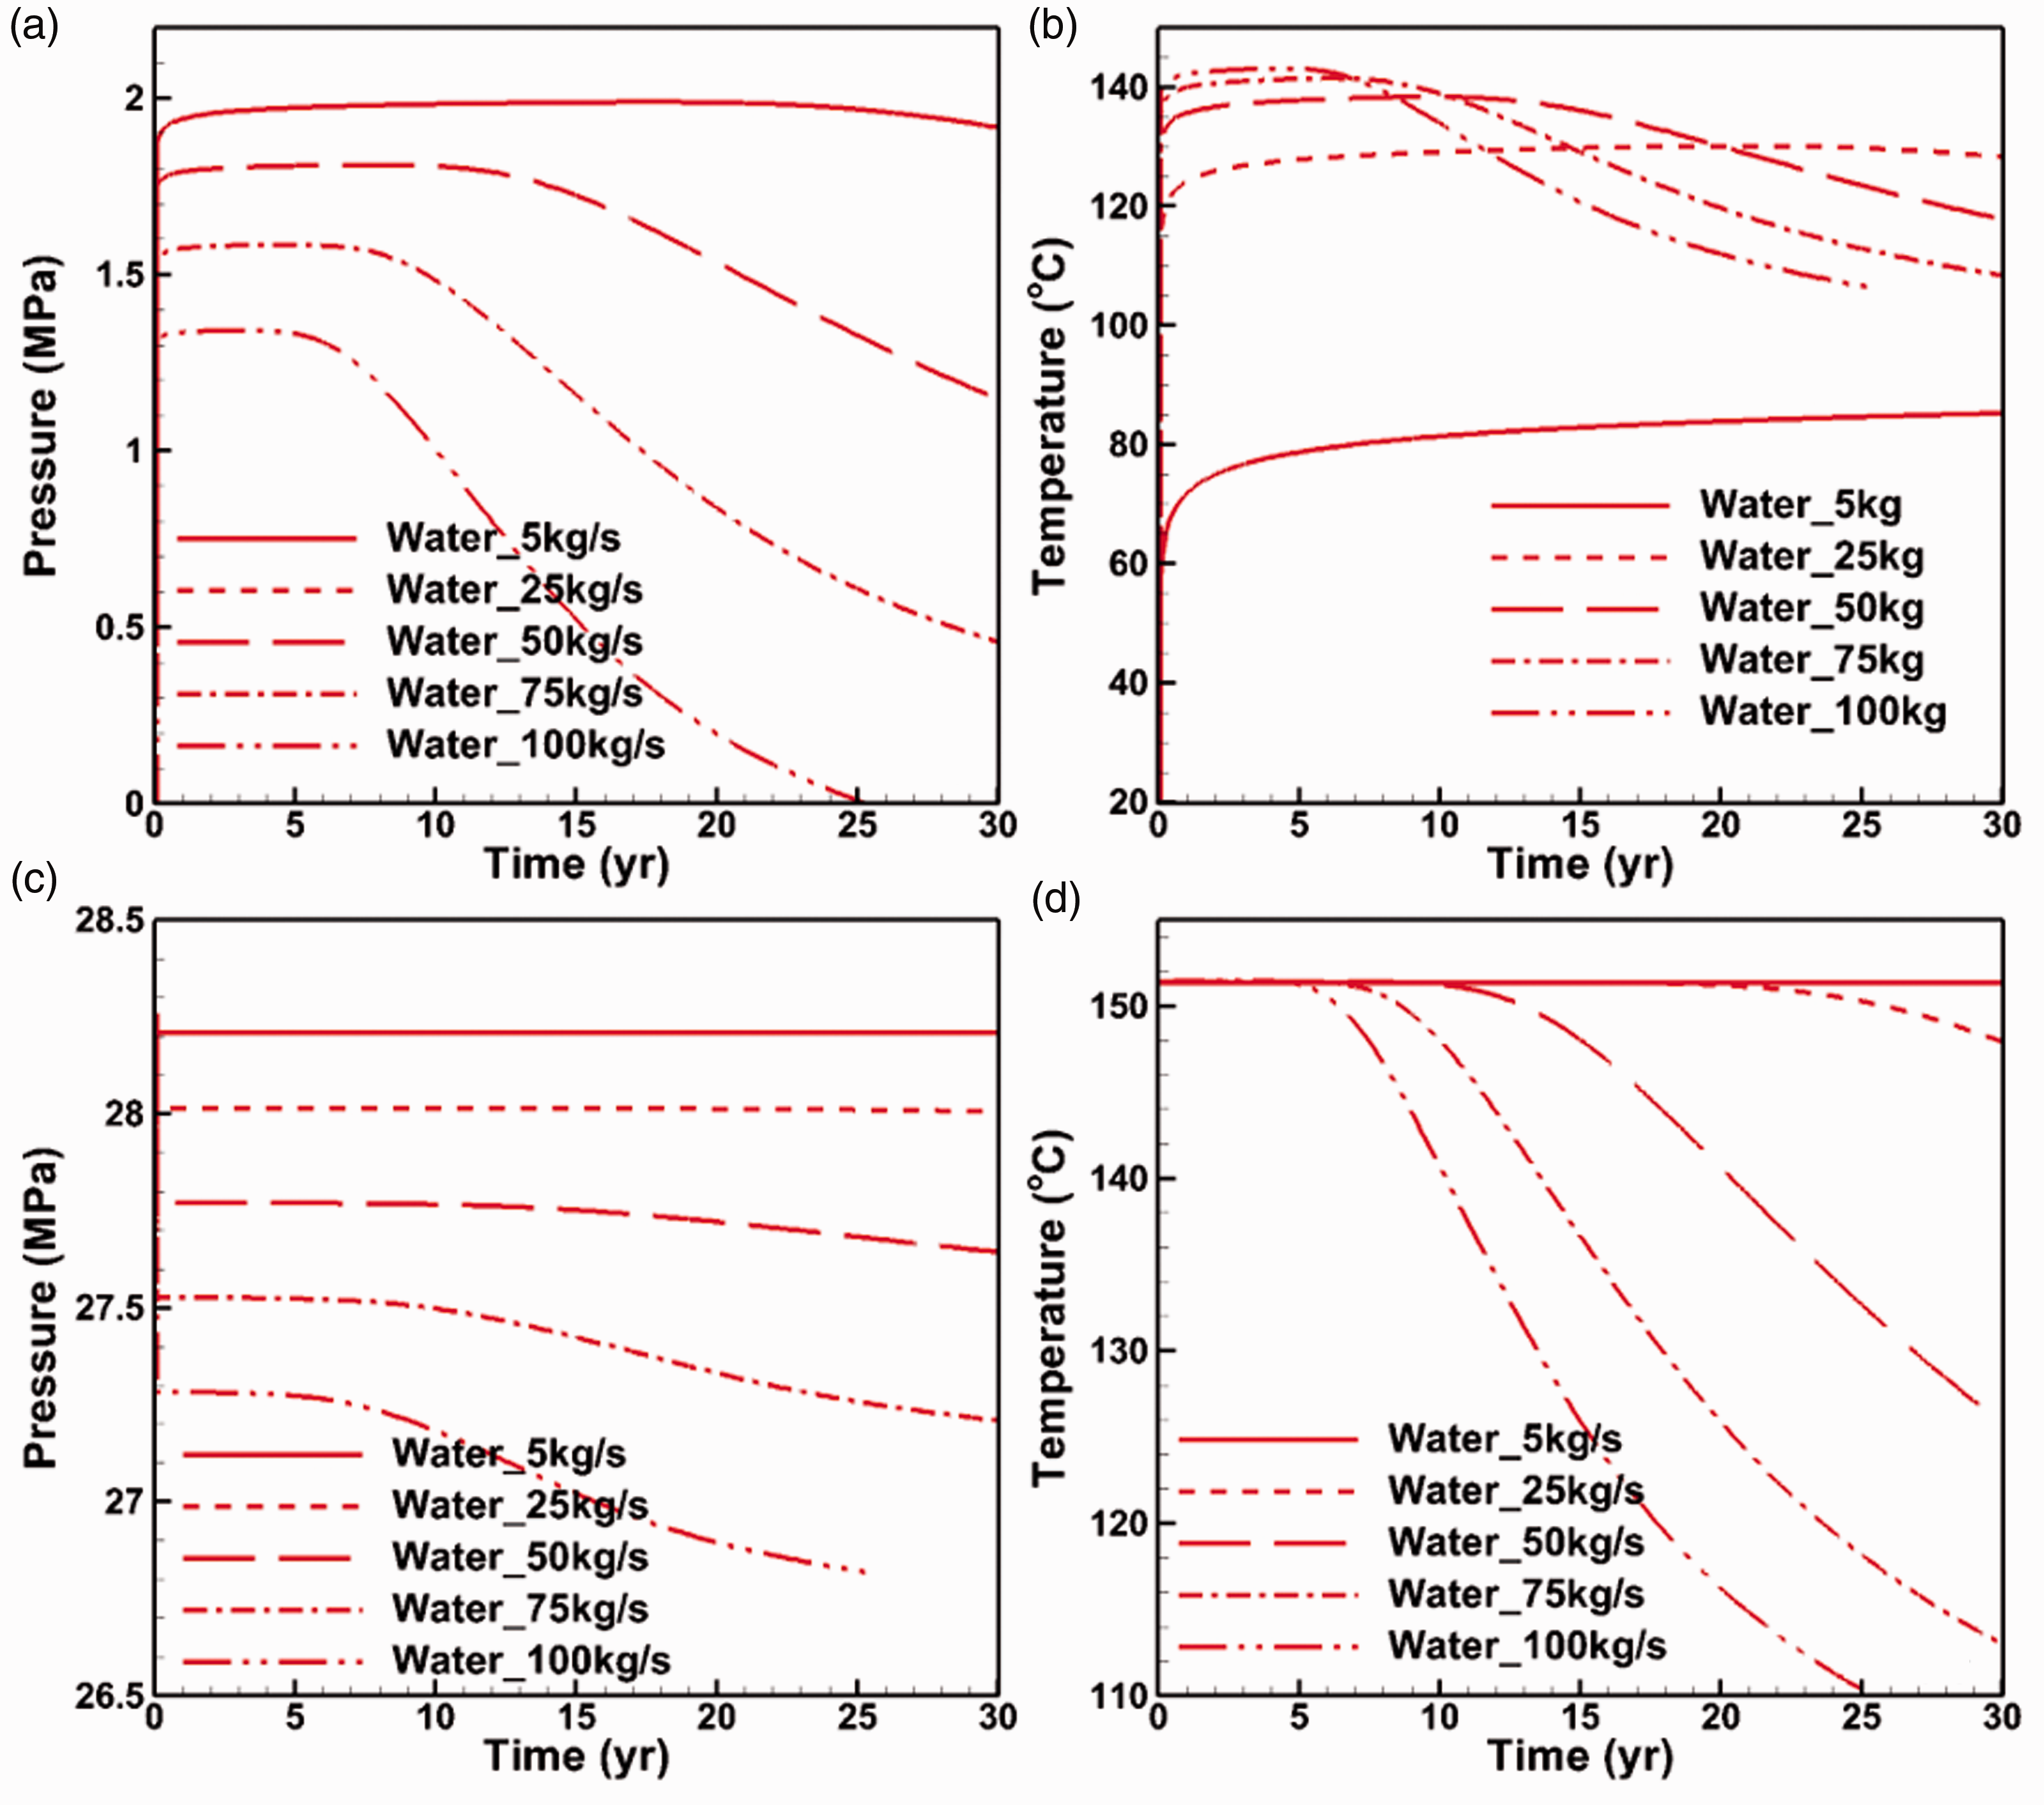
Under different flow conditions, the production wellhead (a, b) and bottom (c, d) temperature and pressure changes in water–EGS.
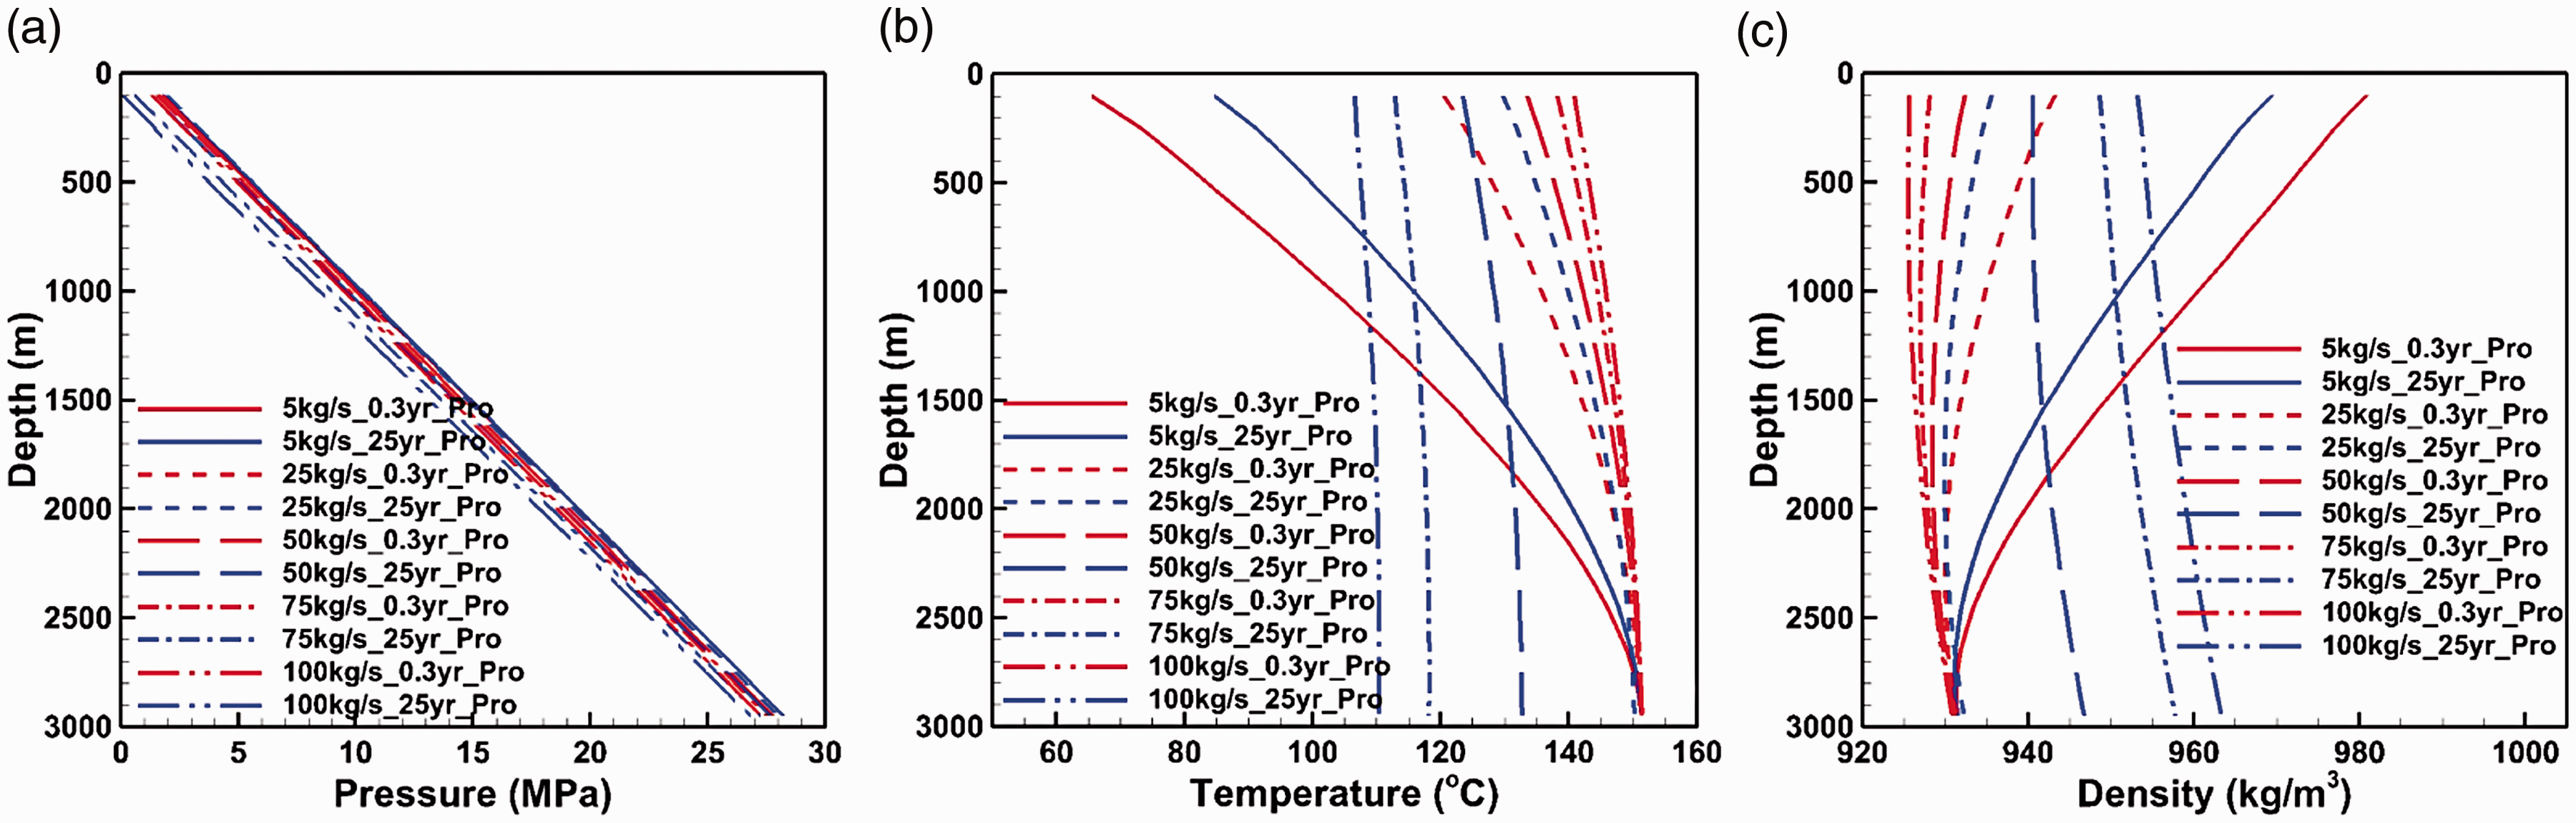
In addition to discussing the parameter variations, an analysis of the changes in the internal fluid pressure, temperature, and density, as illustrated in Figures 9 and 10, helps develop an in-depth understanding of the wellbore–reservoir model. In the injection well, the flow of water and CO2 from the wellhead to the bottom is not an isenthalpic process. Fluid absorbs heat from the outside rocks. At the same time, gravity is at work. The internal energy of the fluid increases. All the processes help propel the temperature of the working fluid to increase during the transfer (Figures 9(b) and 10(b)). During the process, the water temperature increases slightly. The increase in the temperature is much lower than that of CO2. Except for the situation in a 5 kg/s case, the CO2–EGS experiences similar relatively small changes in every situation. As the rate of the fluid is relatively slow at 5 kg/s, the CO2–EGS absorbs more heat and increases its temperature compared with other conditions as it reaches the bottom of the well. Different from the situation in water, the temperature inside the well changes dramatically as the density of CO2 changes (Figures 9(c) and 10(c)). For higher rate situations (except for 5 kg/s), the density increases as pressure increases and is determined by the compression. In the situation of a 5 kg/s case, the pressure increases in the shallow portion of the well. Then, the temperature effect plays a decisive role. Next, the density decreases dramatically and the fluid expands. After operation over three decades, the heat exchange between the wellbore and outside rocks is reduced, and the density increases.
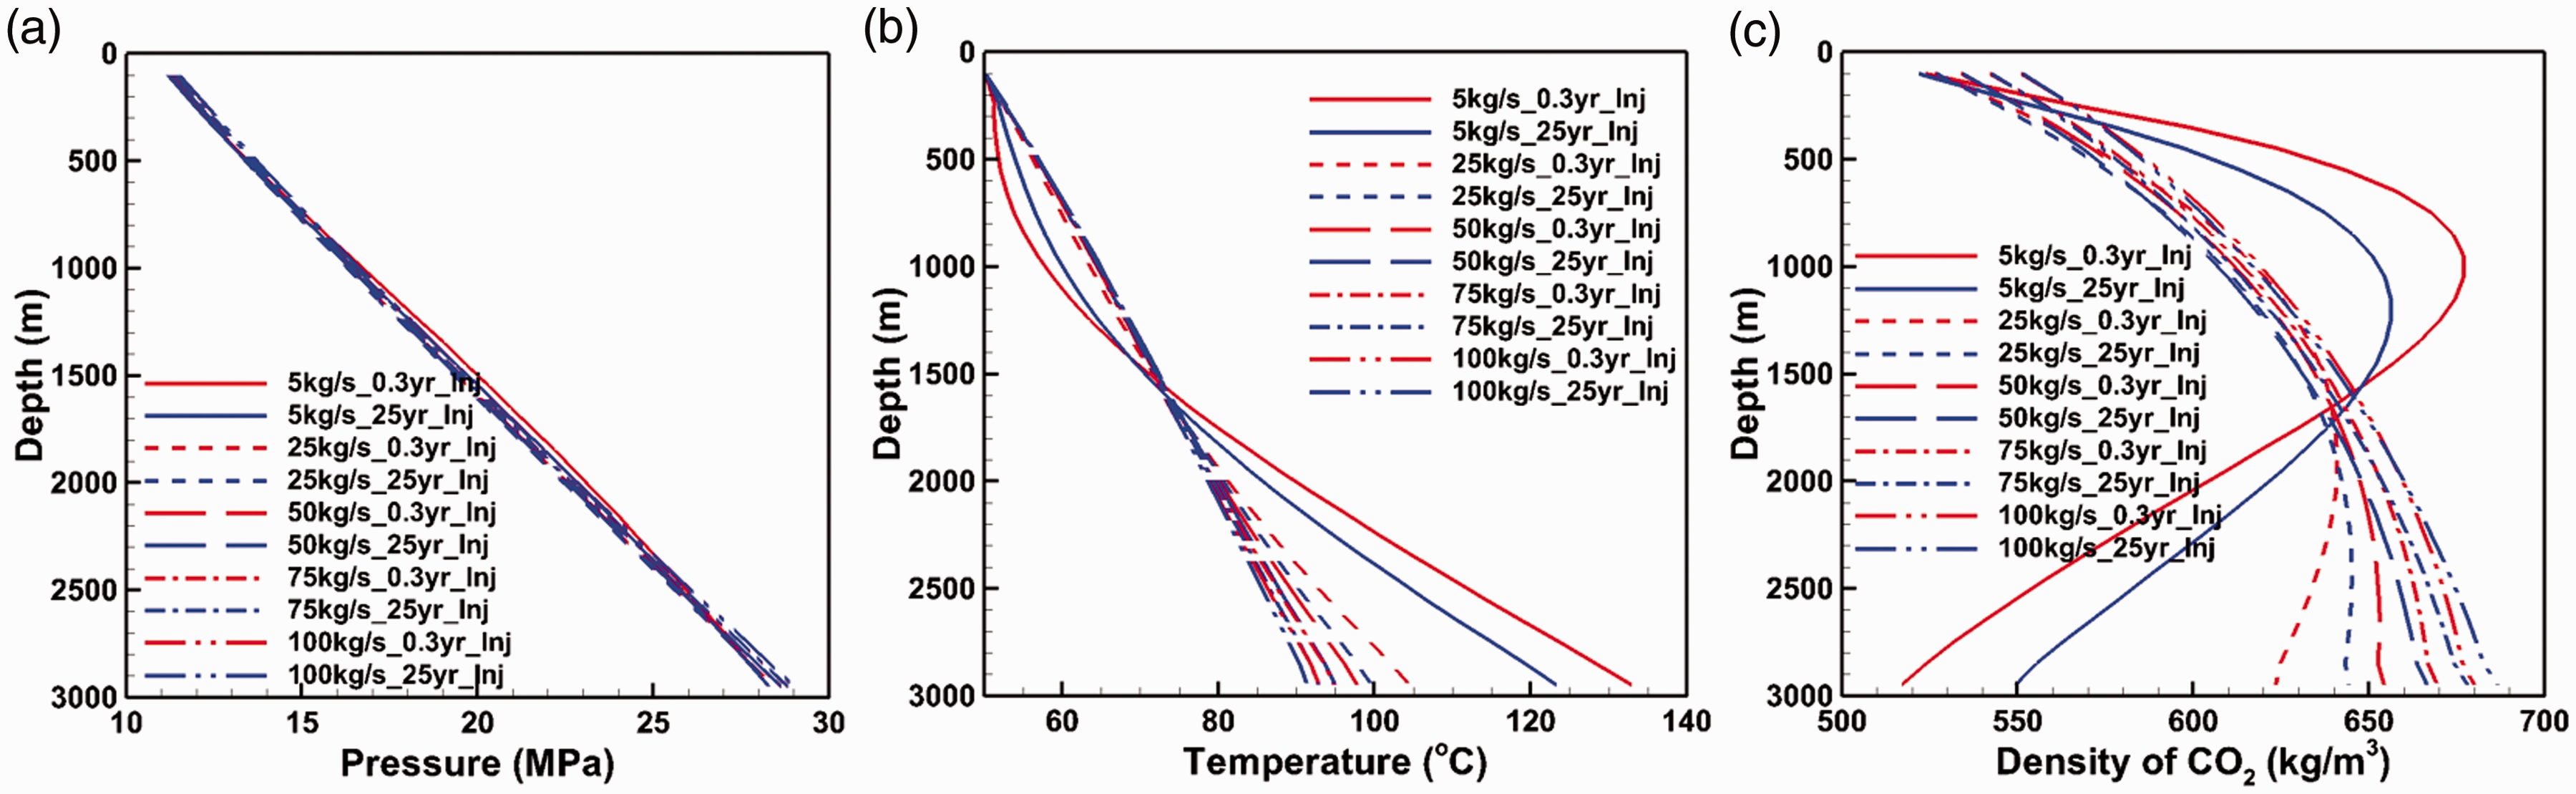
Vertical distribution of fluid pressure (a), temperature (b), and density (c) along the wellbore of the injection well after 0.3–25 years in a CO2–EGS.
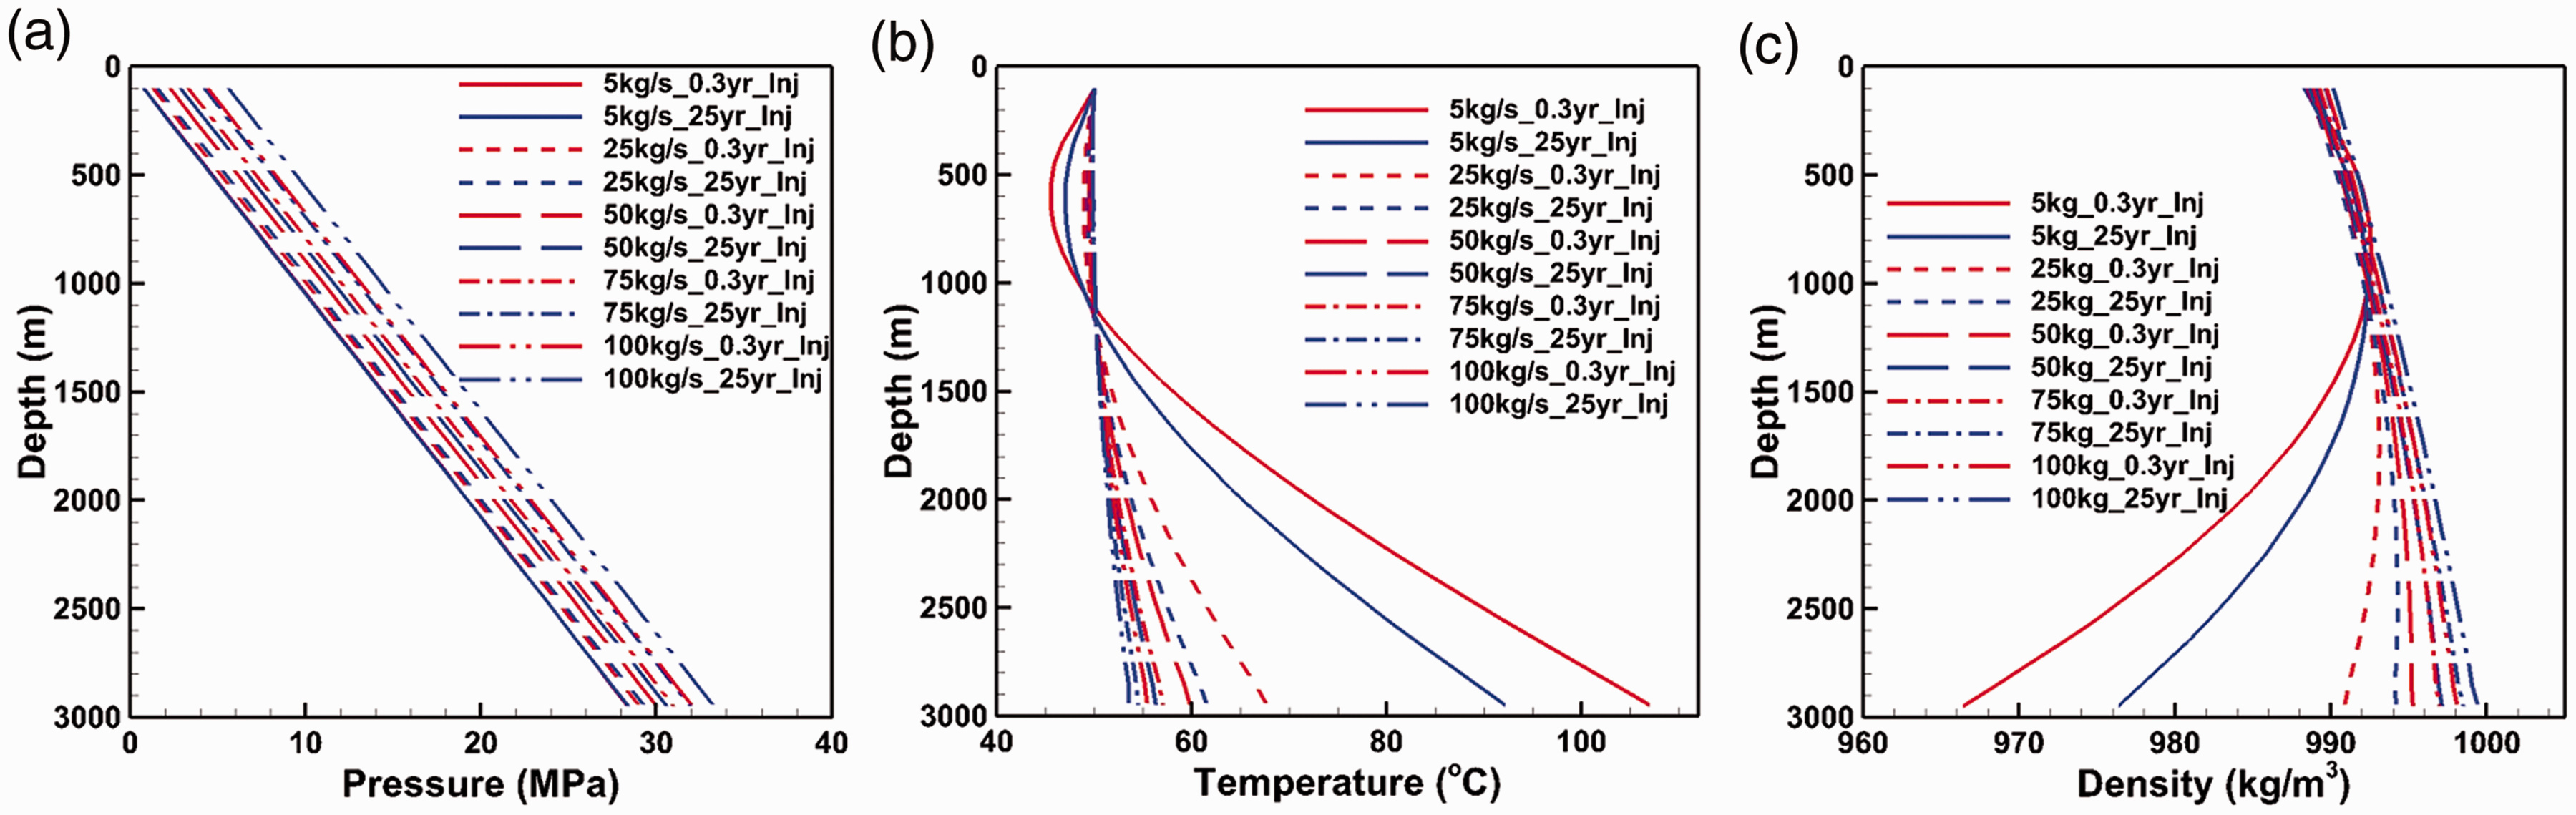
Vertical distribution of fluid pressure (a), temperature (b), and density (c) along the wellbore of the injection well after 0.3–25 years in a water–EGS.
In the production well, there is also a heat exchange between the fluid and the outside rock. Heat is dissipated to the outside world due to the higher temperature of the fluid. In addition, the internal energy is converted to the gravitational potential energy. The energy of the fluid is reduced. During the Joule–Thomson process, temperature of the fluid drops as the pressure drops. Combining the aforementioned processes, the temperature drops greatly as it flows from the wellhead to the bottom. In the early stage (first 0.3 year), the pressure distribution is basically the same. Due to the slow flow rate in the case of 5 kg/s, the temperature drop is much higher than that in the other cases. A large difference in density was formed. Except for the case of a 5 kg/s case, the fluid mainly experiences expansion. From the bottom to top, due to the interaction decreasing pressure and increasing temperature, the temperature density decreases. In the case of a 5 kg/s case, the compression process is dominant. From the bottom to top, the density increases. With the operation of the system, the energy transfer between the wellbore and the outside rocks decreases. The compression process of the fluid is weakened, and the temperature decreases, as shown in Figures 11(a) and 12(a). Because the coefficient of expansion of water is smaller than that of CO2, the dropping rate of the production temperature has always been small. For example, under the flow rate of 100 kg/s, the temperature of water drops no more than 5°C, and the temperature of CO2 reaches 50°C.
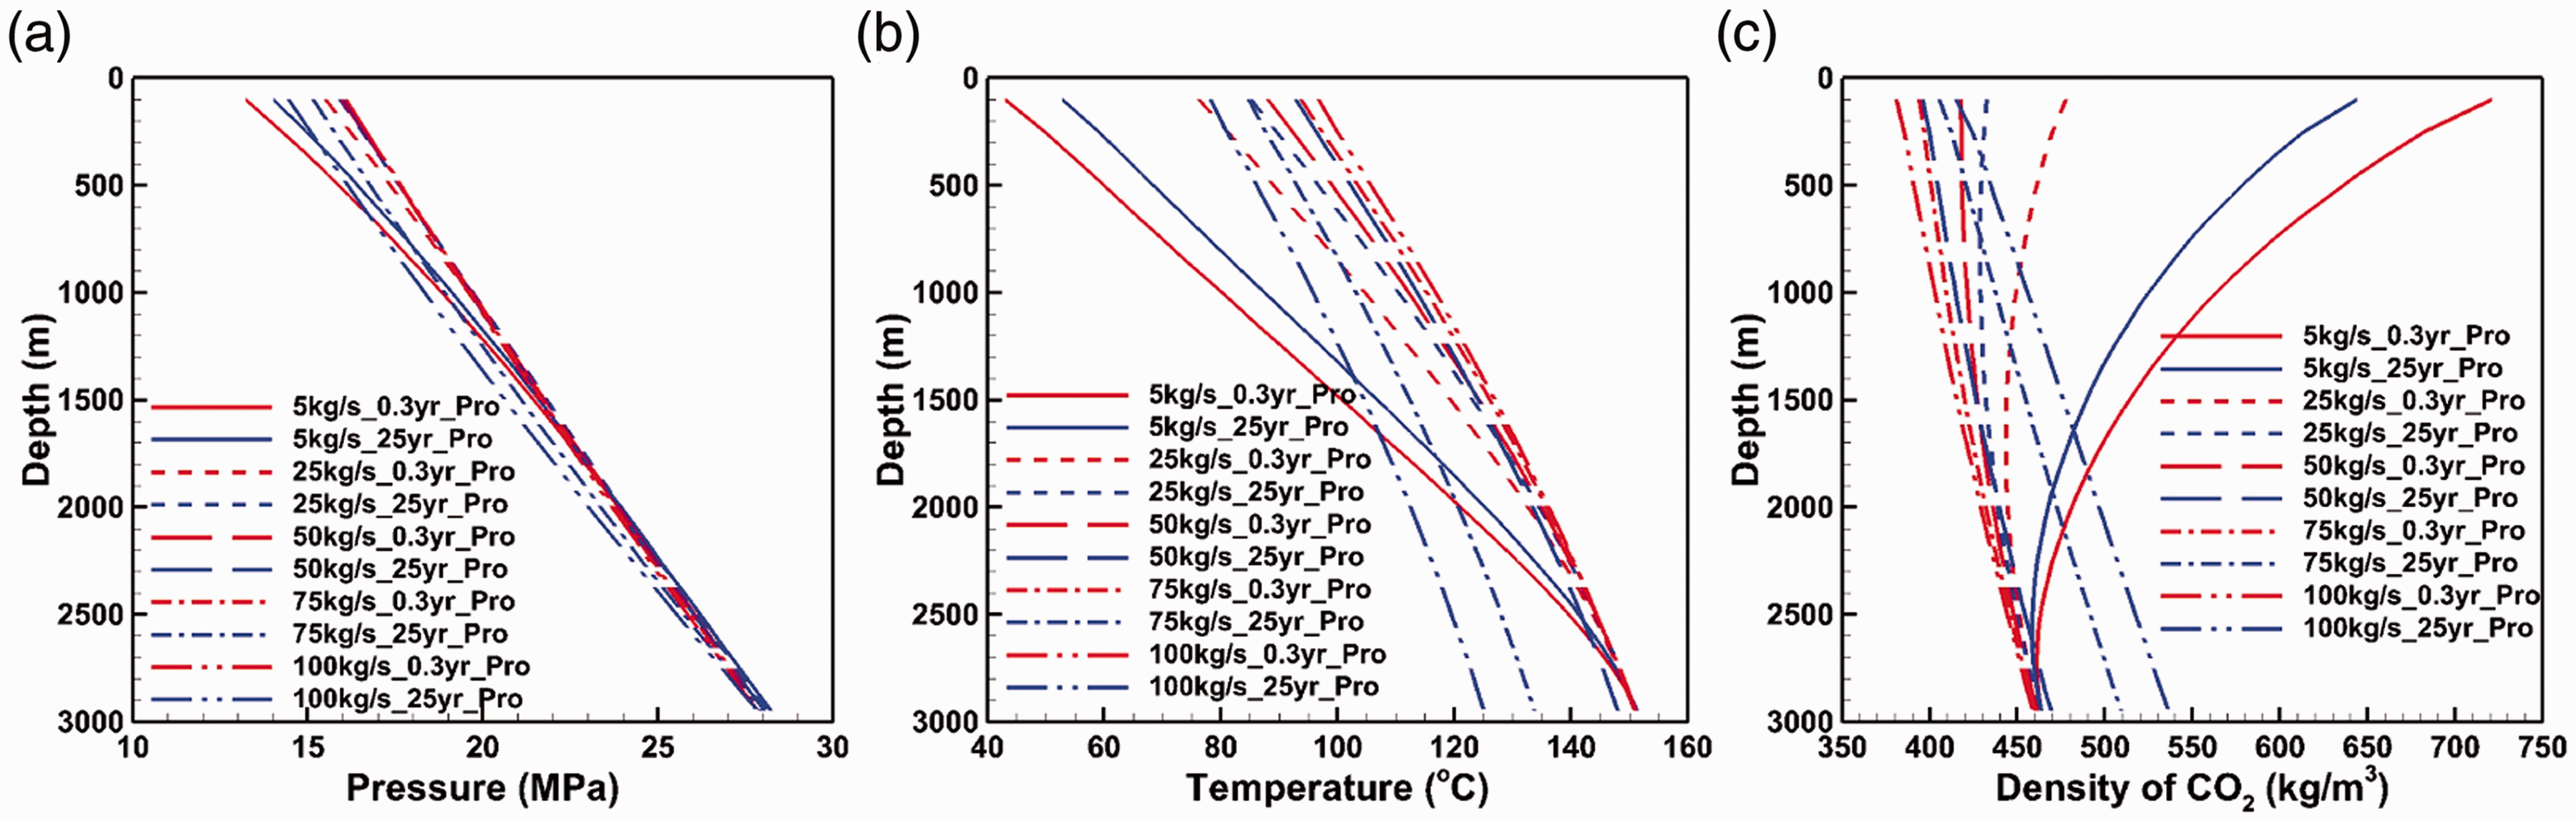
Vertical distribution of fluid pressure (a), temperature (b), and density (c) along the wellbore of the production well after 0.3–25 years in a CO2–EGS.
Vertical distribution of fluid pressure (a), temperature (b), and density (c) along the wellbore of the production well after 0.3–25 years in a water–EGS.
In conclusion, the density of water is mainly affected by temperature. The density of CO2 is both affected by temperature and pressure. For the CO2–EGS, in the injection and production wells, the temperature and pressure are negatively correlated with the fluid density. For the higher mass flow rates (25–100 kg/s), the dominant factor is the pressure change. The lower mass flow rate helps exchange greater heat with the outside rocks, so the temperature changes have a great impact on the density. The feedback of temperature and pressure brought by the density of CO2 leads to system complications.
In the in-depth study regarding the pressure changes of the internal wellbore, the pressure loss in a production well that has operated for 30 years is shown. The pressure loss includes both gravitational and nongravitational losses. The nongravitational loss includes the friction loss and compression or expansion loss caused by density changes. It can be seen that except for the case of a 5 kg/s case, the gravitational loss increases. The reason is that as the flow rate increases, the heat loss becomes greater, the temperature drops, and the density increases. In the case of a 5 kg/s case, the scale of heat radiation is large, so that the density is high. For the nongravitational loss, the friction loss is the major part. The friction loss is positively correlated with the flow rate. Therefore, the higher the flow rate is, the greater the nongravitational loss is.
The definition of the minimum flow rates is based on the fact that in the case of 5 kg/s (without thermal insulation capability or smaller diameter) the production temperature is too low. The definition is also based on the thermal loss that occurred in the latter stage. There is a nonlinear relationship between the heat extraction per unit and the flow rates. If the assumed conditions in the wellbore–reservoir parameters are different from those in this paper, then the relationship between the specific value of the CO2-based geothermal system and flow rates varies. It is true that the nonlinear relationship and the interaction between the wellbore and reservoir play a dominant role. The CO2-based geothermal system should be optimized and designed further.
Reservoir and heat extraction efficiency
The bottom of the injection well is the entrance of the reservoir, and the bottom of the production well is the outlet of the reservoir. During the process of the working fluid flowing from the bottom of injection well to the bottom of production well, the heat-carrier fluid overcomes the resistance and consumes the pressure energy through the high-temperature porous medium. The difference between the pressure at the bottom of injection well and that at the bottom of the production well is the pressure consumed by the heat-carrier fluid in the reservoir and the driving force for the heat transfer of heat-carrier fluid in the thermal reservoir. In Figure 13, at each time point, the pressure loss of the heat-carrier fluid increases with an increase in the flow rate. The maximum pressure loss of water in the reservoir is approximately 4 MPa. The maximum pressure loss of CO2 in the reservoir is approximately 1.2 MPa, which is lower than that of water. The reason is that the viscosity of CO2 is small. The small viscosity of CO2 helps reduce energy consumption.
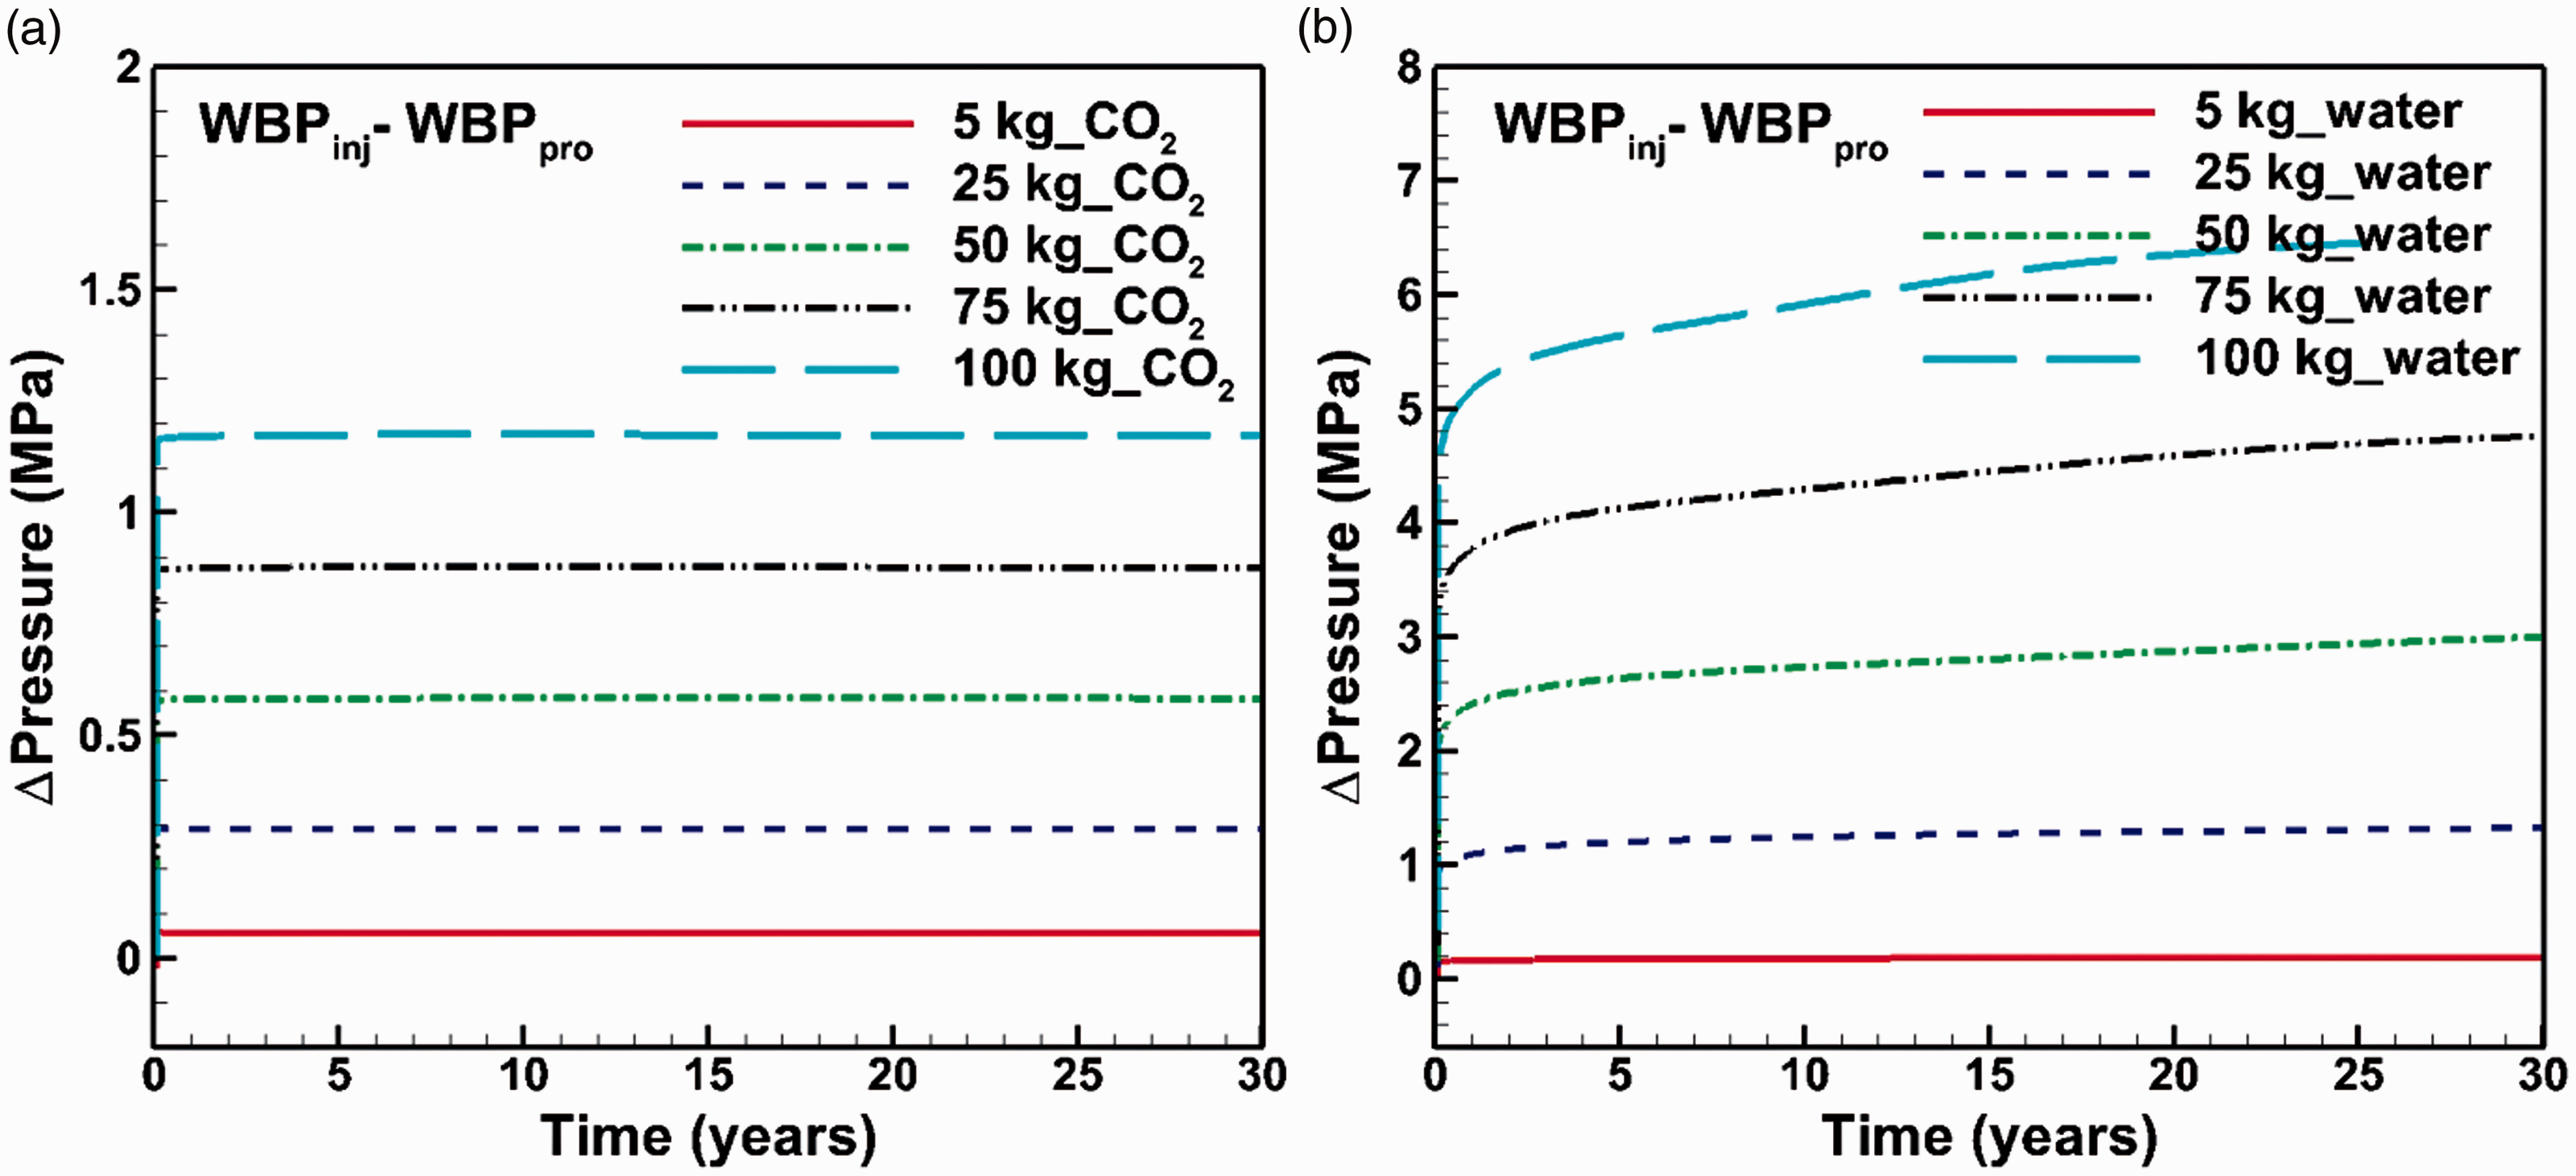
The gap of pressures between the injection well and production well changes as time passes: (a) CO2–EGS and (b) water–EGS.
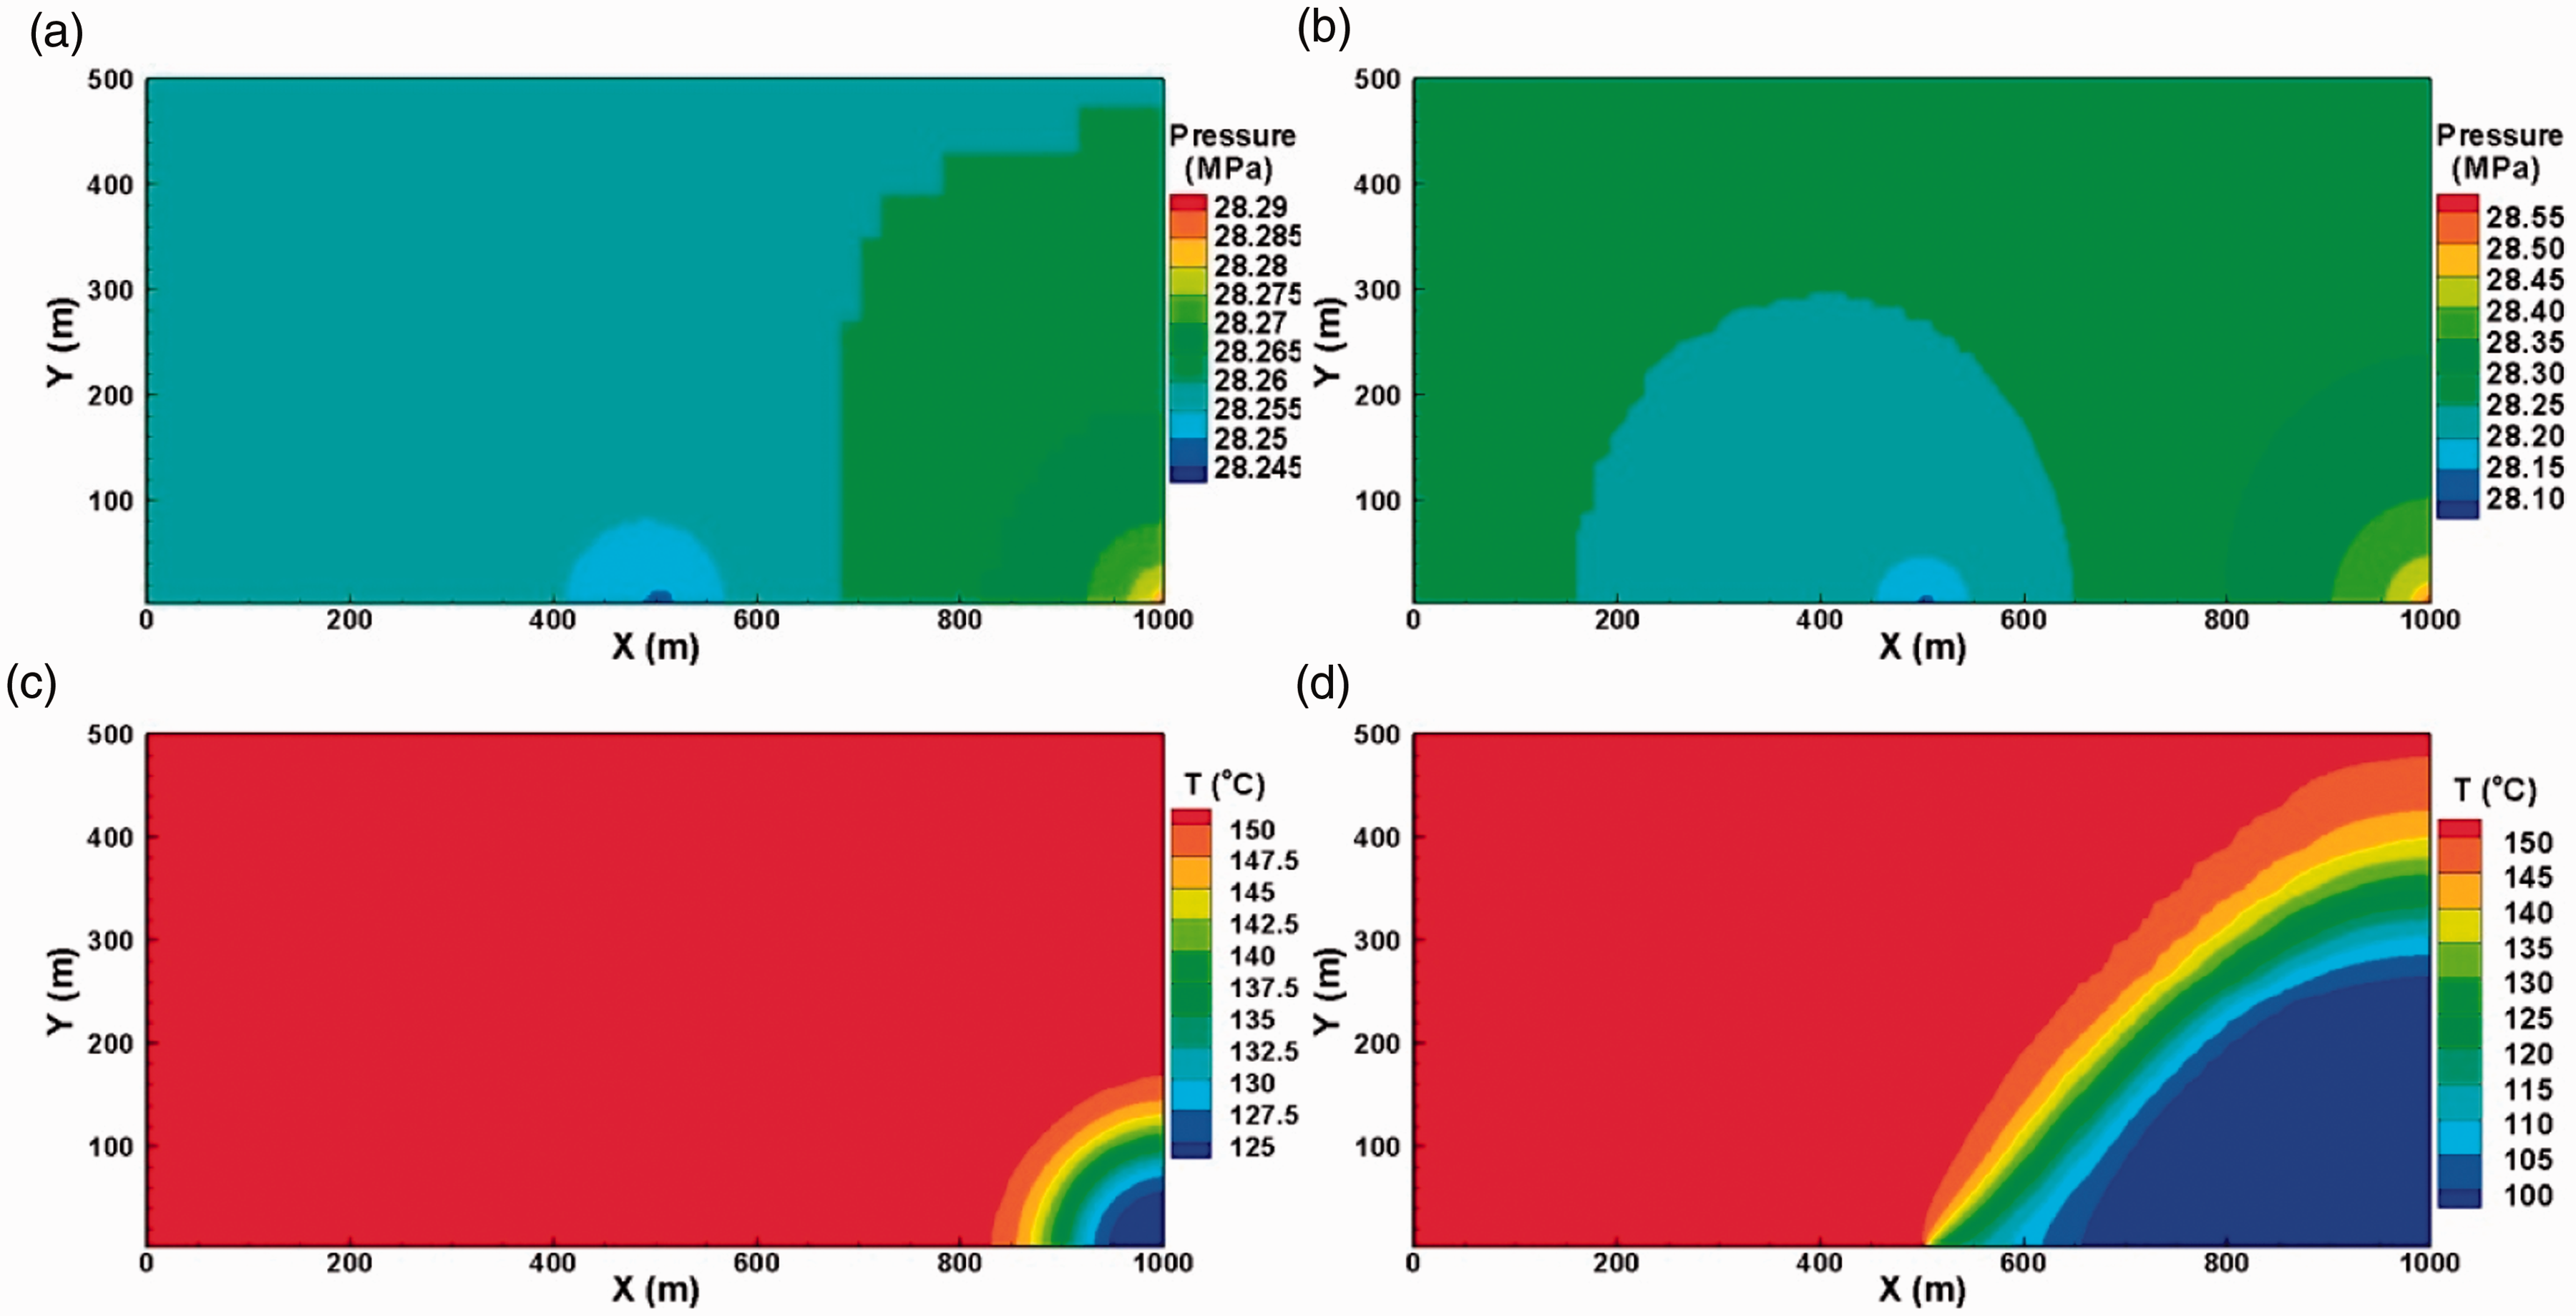
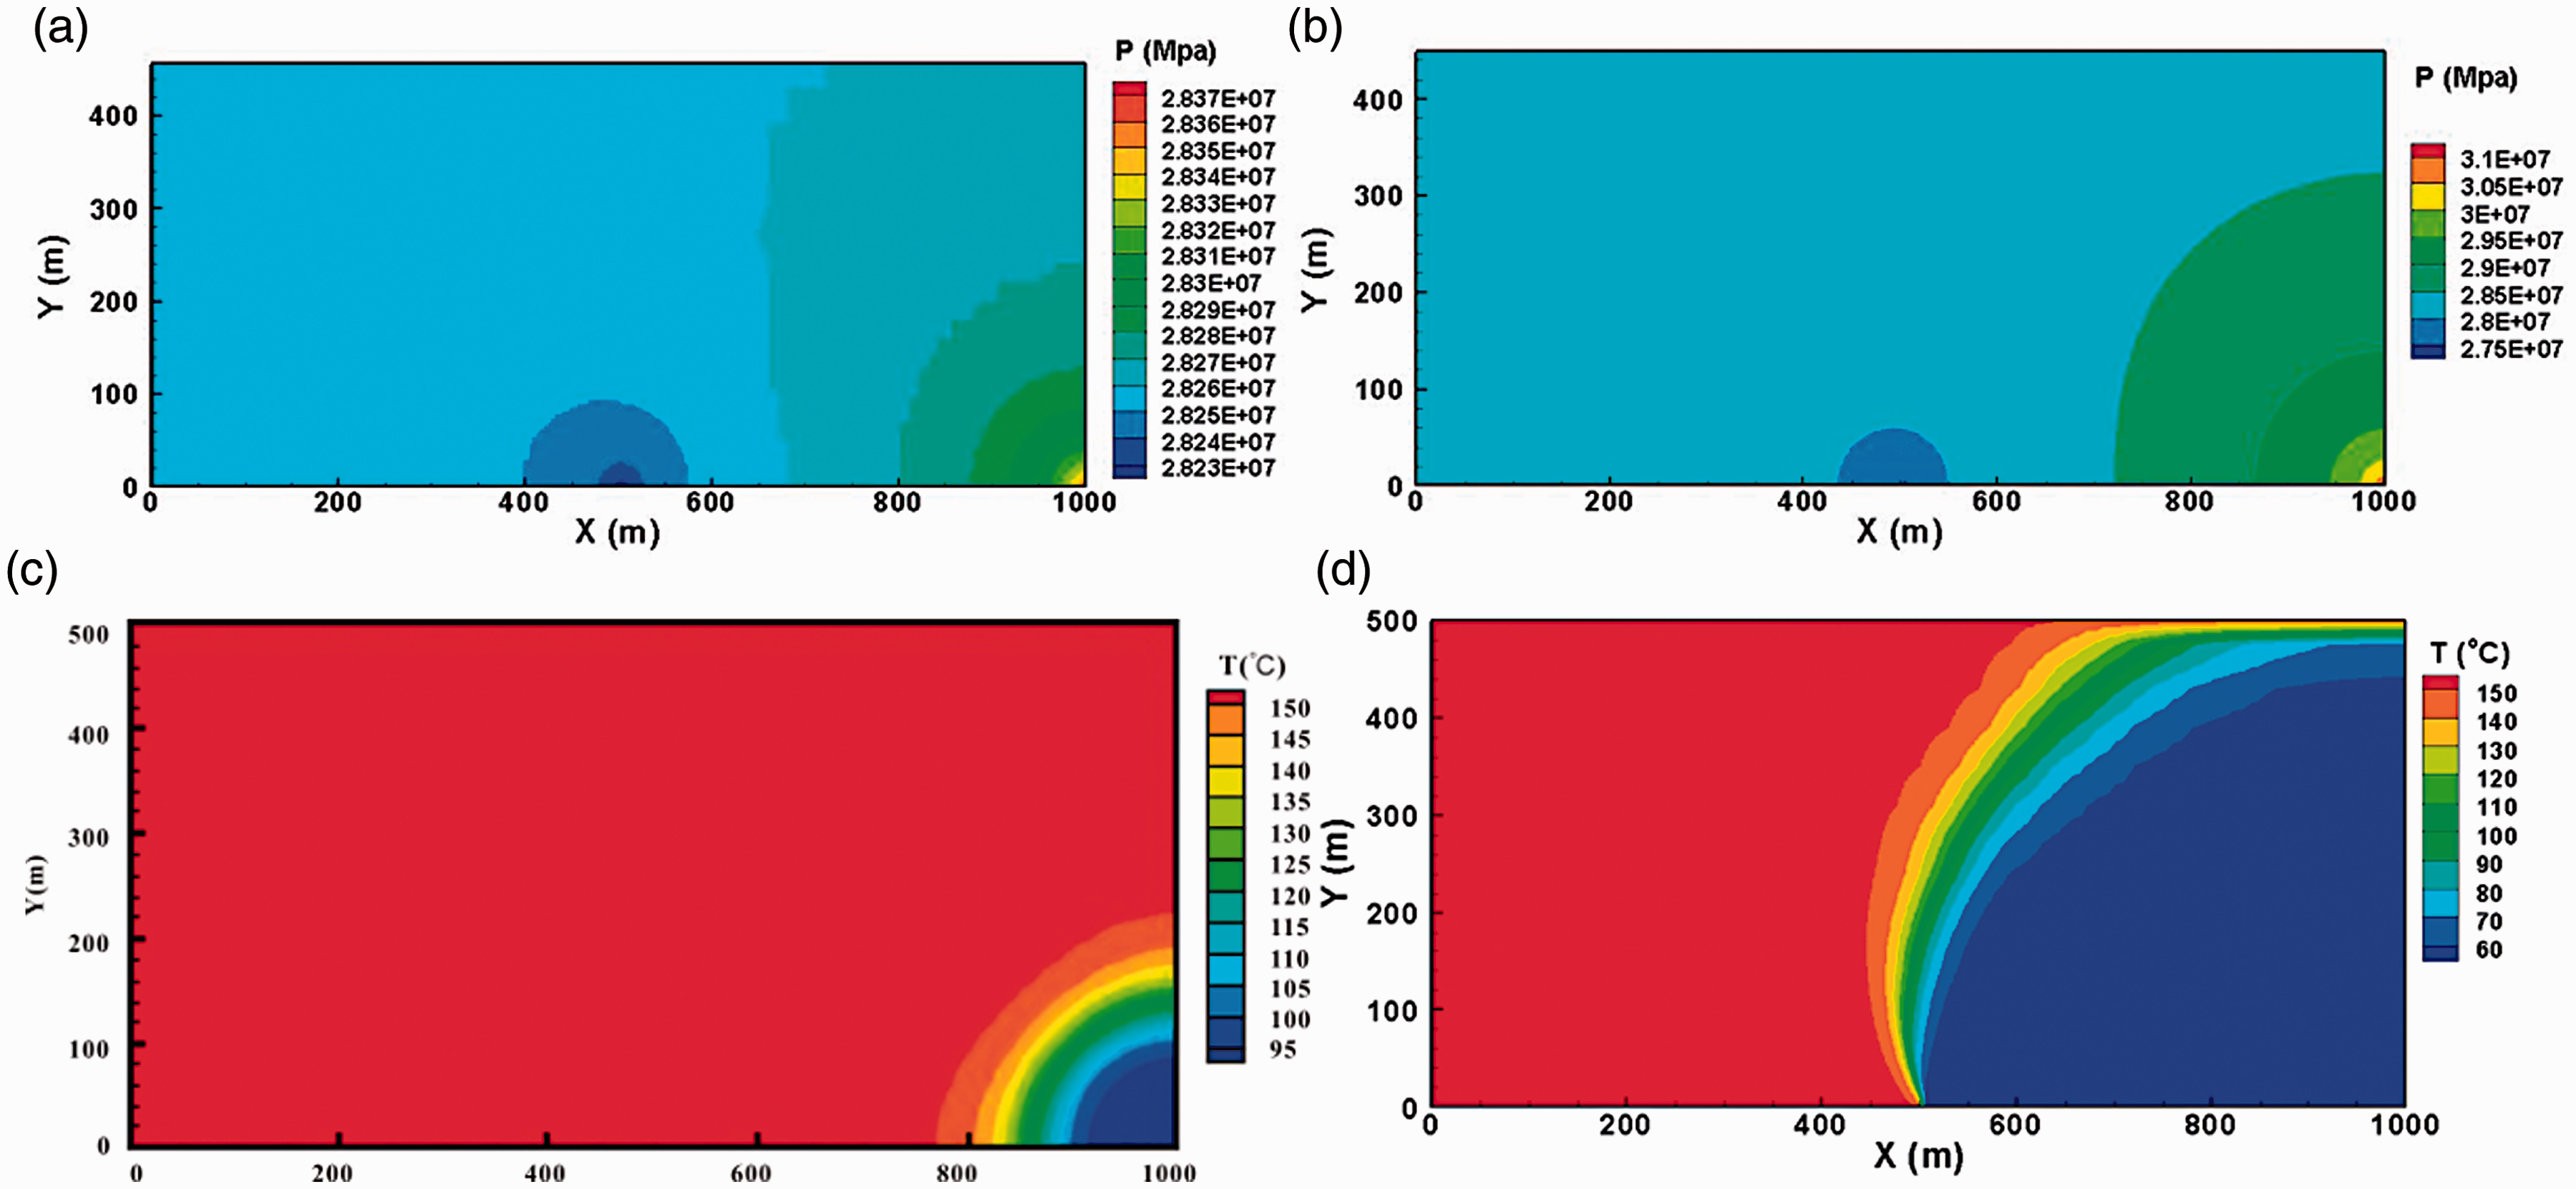
Figures 14 and 15 show the temperature and pressure distributions in the CO2–EGS and water–EGS at a rate of 5 and 50 kg/s after 30 years, respectively. During the circulation of a heat conducting fluid, if a quarter of the area between the injection and production wells is taken as a monitoring area, then with the complex effect of the cycle power, buoyancy, and gravity, the gas distribution is shaped in oral.
Time-related changes of the pressure gap between the head and bottom of CO2–EGS.
Time-related changes of the pressure gap between the head and bottom of the water–EGS.
Figure 16 shows the heat extraction efficiency under different flow rates. The calculation formula is shown in Formula (1). F represents mass flow and h represents the enthalpy of the fluid. Under the same flow rate conditions, the specific heat capacity of water is higher than that of CO2 (Figure 16); therefore, the net heat extraction capacity of water is higher than that of CO2. However, the pressure consumed in the underground circulation of water is relatively large. With an increase in water flow rate, the pressure of cyclic consumption increases, and the net heat extraction amount increases, but the temperature decreases as the well operates for a longer time. As a result, when the flow rates of the water and CO2 heat-carrier fluid increase, the thermal output of the water system becomes more unstable. Under the same flow rate, the net heat extraction of CO2 is lower than that of water, but the consumption amount of the pressure in the circulation is below zero

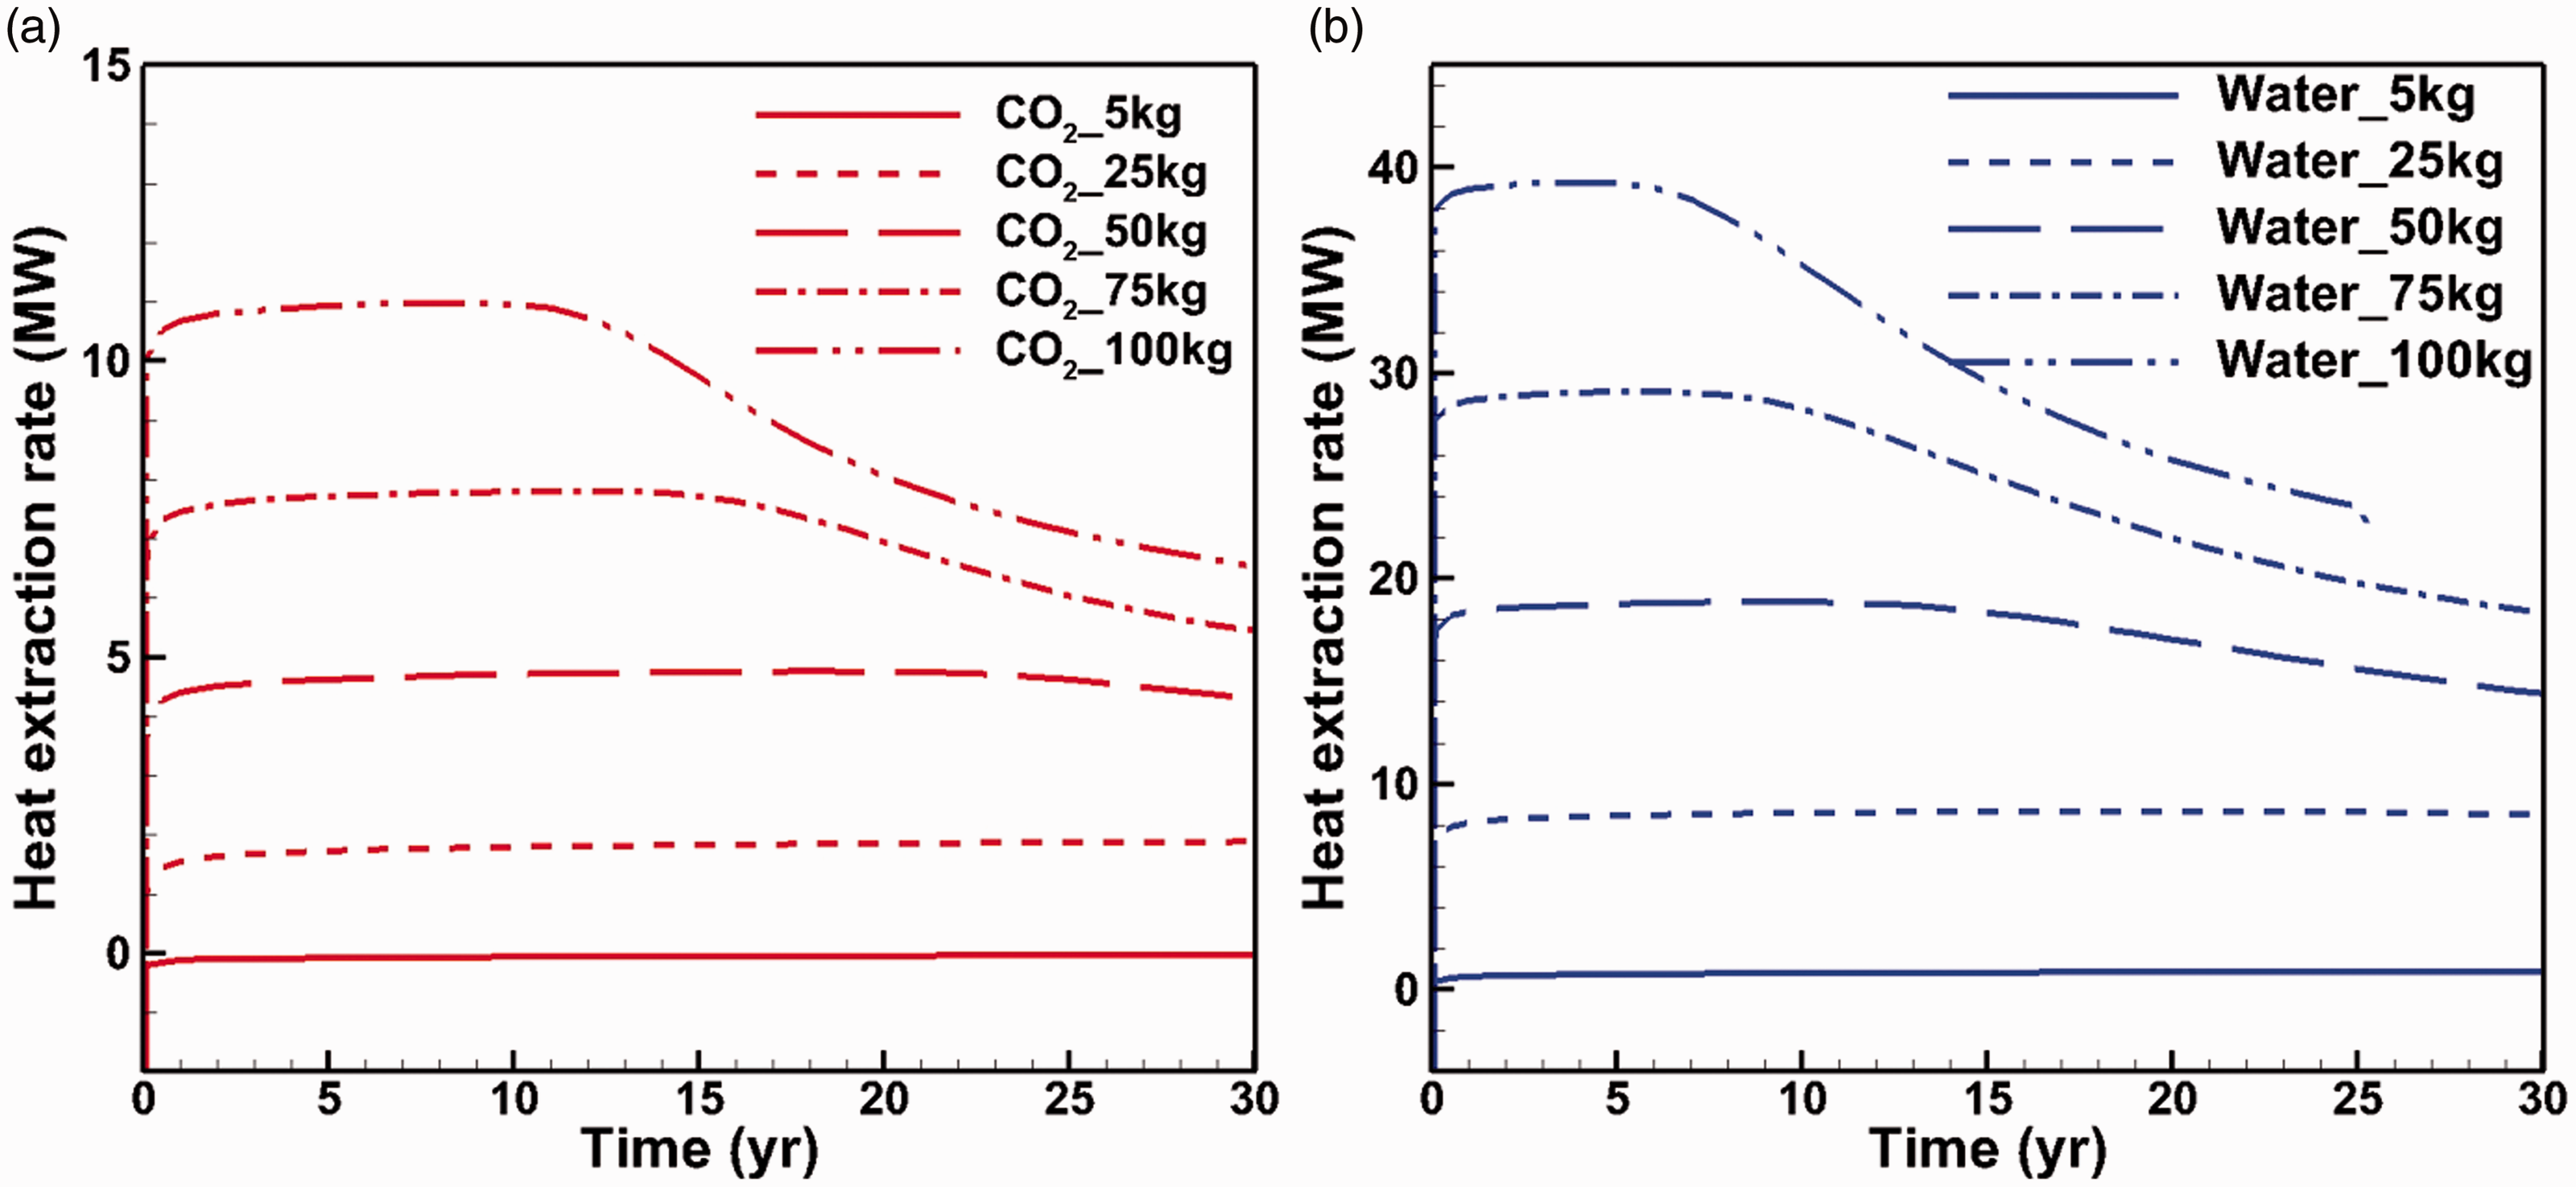
Curve of heat extraction efficiency: (a) CO2–EGS and (b) water–EGS.
According to the two systems, including the water–EGS and CO2–EGS, the amount of heat extraction increases as the fluid increases. In the case of more rapid flow rates (75 and 100 kg/s), the higher flow rates cause the reservoir to lose more energy and the heat extraction efficiency decreases dramatically. For the flow rates under 50 kg/s, the flow rates are basically stable. Therefore, we believe that a flow rate of 50 kg/s is more conducive to the stable operation of the Guide region’s geothermal energy system.
Conclusion
This paper analyzed the HDR geothermal field of the Guide area to set up a two-dimensional and three-spot model of a coupled wellbore–reservoir. This study characterized both water and CO2 as working fluids in a wellbore and a reservoir and their changing parameters. The maximum heat extraction capacity of the Guide area is also measured. The conclusions are as follows:
Under the conditions, the pressure of the CO2–EGS production well is higher than that of the injection well, so a thermosiphon can be set up for heat extraction. The higher flow rate case requires a lower injection pressure than does the lower flow rate case. This lower pressure resulted from CO2’s compressibility and the inverse dependence of the density of CO2 on temperature. A lower flow rate of CO2 gains more heat from surroundings and has less density and higher upward force. Therefore, it is easier to set up a siphon system for higher flow rate geothermal extraction than a lower flow rate extraction.
With slow flow rate, the system remains stable after 30 years of production and exhibits only a small decrease in temperature. However, with scenarios of higher flow rates, namely 50, 75, and 100 kg/s, the reservoir demonstrates greater heat loss. The reservoir’s production temperature and efficiency in extracting energy drop dramatically. Therefore, we believe that if either water or CO2 is used as the working fluid in the three-spot model, then a flow rate of 50 kg/s is more feasible for the Guide area for its geothermal extraction.
The parameters used for numerical modeling are all taken from the practical area, such as the permeability, geothermal gradient. Indeed this paper is closer to a theoretical study, whereas all the conclusions are directed against the specific research area.
Footnotes
Authors’ note
Any underlying research materials related to our paper (e.g. data, samples, or models) can be accessed.
Acknowledgements
The authors wish to thank Dr Guanhong Feng.
Declaration of conflicting interests
The author(s) declared no potential conflicts of interest with respect to the research, authorship, and/or publication of this article.
Funding
The author(s) disclosed receipt of the following financial support for the research, authorship, and/or publication of this article: This project was supported by the Chinese Academy of Geological Sciences Fund (No. YK201611, SK201501), the National Science Foundation for Young Scientists of China (No. 41502249, No. 41502336), and the Science and Technology Program of Hebei (No. 16214214).