
Abstract
A series of methane sorption isotherms were measured at 303 K, 313 K, 323 K, 333 K, and 343 K at pressures up to 12.0 MPa for two shale samples from the Upper Triassic Chang 7 Member in the southeastern Ordos Basin with total organic carbon content values of 5.15% and 4.76%, respectively. Both the Langmuir- and Dubinin–Radushkevich-based excess sorption models were found to well represent the excess sorption isotherms within the experimental pressure range. The maxima of absolute methane sorption capacity fitted by both models are not significantly different. In the current study, the effects of temperature and pressure on methane sorption capacity support the findings that under isothermal condition, methane sorption capacity of organic shale goes up with increasing pressure and under isobaric condition, while it goes down with increasing temperature. Good negative linear relationships between temperature and maximum sorption capacity exist both in the Langmuir and the Dubinin–Radushkevich models. In addition, a good positive linear relation exists between the reciprocal of temperature and the natural logarithm of Langmuir pressure, which indicate that temperature and pressure are really important for methane sorption capacity. The extended Langmuir and Dubinin–Radushkevich models have been improved to calculate the methane sorption capacity of shales, which can be described as a function of temperature and pressure. By means of using the two estimation algorithms established in this study, we may draw the conclusion methane sorption capacity can be obtained as a function of depth under geological reservoir. Due to the dominant effect of pressure, methane sorption capacity increases with depth initially, till it reaches a maximum value, and then decrease as a result of the influence of increasing temperature at a greater depth. Approximately, the maximum sorption capacity ranges from 400 m to 800 m.
Introduction
Facing a situation of severe energy shortage, shale gas exploration has drawn more and more attention worldwide. A global astounding “shale gas green revolution” has been booming in the past few years. Shale gas resource has already become a natural gas production target with great potential and significance (Chen et al., 2011, 2014; Guo et al., 2014; Yang et al., 2014, 2015, 2016). With the development of hydraulic fracturing and horizontal drilling technologies (Hao et al., 2013; Rexer et al., 2013, 2014), shale gas exploration from organic-rich shales now can be economically viable. China Government announced in 2011 to the public that shale gas will be a new type of mineral resource. The purpose is to encourage and speed up its exploration.
Shales are important unconventional gas reservoirs in which the natural gas is stored in three different types of geological environment (Tan et al., 2014; Wang et al., 2013, 2015; Yuan et al., 2014; Zhou et al., 2014). They are (1) free gas in pores and fractures, (2) adsorbed gas in organic matters and clay minerals, and (3) dissolved gas in residual oil and water (Curtis, 2002; Gasparik et al., 2012, 2014; Guo, 2013; Ross and Bustin, 2008, 2009). It is extremely important to quantify each type of gas storage not only because we need to figure out the potentiality of shales to store gas, but also to understand the rates and mechanisms by which gas transports from shale source rock to the production well. Unlike the conventional gas reservoirs that are characterized with free gas, the range of contribution of adsorbed gas to total gas capacity is usually between 20% and 85% in shale gas reservoirs (Curtis, 2002; Liu et al., 2016; Montgomery et al., 2005; Wu et al., 2015; Yang et al., 2015).
Many experiments on methane sorption capacity of shale samples have been carried out around the world. It is now quite clear that organic matter exerts main control on adsorbed gas content (Li and Wu, 2015; Merkel et al., 2015; Qajar et al., 2015; Tian et al., 2016; Xiong et al., 2016). Organic matter is the source of hydrocarbon gas (Hill et al., 2007; Rodriguez and Paul, 2010; Wang et al., 2013) and determines the intensity of gas generation. Furthermore, it can generally provide more adsorption sites and larger specific surface areas than other minerals (Tan et al., 2014). Meanwhile, the type of organic matter and their thermal maturity can greatly affect the methane sorption capacity (Bowker, 2007; Chalmers and Bustin, 2007, 2008; Lu et al., 1995; Zhang et al., 2012). The sequence of methane sorption capacity of different types of organic matter can be described as type I < type II < type III. This is mainly because of (1) higher sorption capacity of vitrinite compared with other macerals and (2) stronger methane sorption capacity on aromatic structures than aliphatic structures (Chalmers and Bustin, 2008; Zhang et al., 2012). The influence of thermal maturity on methane sorption capacity is quite complex. When normalized to organic matter content and type, shale samples generally show higher sorption capacity with increasing maturity (Chalmers and Bustin, 2008; Gasparik et al., 2014; Jarvie et al., 2007; Ross and Bustin, 2009). This may be caused by the formation of additional micropores in the organic matter during the process of hydrocarbon generation (Cao et al., 2015; Curtis et al., 2012; Mastalerz et al., 2013; Pan et al., 2015; Ross and Bustin, 2009; Valenza et al., 2013). In addition to organic matter, methane sorption capacity is also affected by (1) constituents of inorganic mineral (especially clay minerals, e.g., montmorillonite and kaolinite), (2) moisture content, (3) microscopic pore structure, and (4) experimental conditions, e.g. temperature and pressure (Chalmers and Bustin, 2007, 2008; Gasparik et al., 2012, 2014; Ji et al., 2012; Wang et al., 2013; Zhang et al., 2012).
The surface excess amount is usually measured in adsorption experiments. However, the actual adsorbed layer is represented by the absolute amount. Therefore we should focus on the absolute sorption quantity while not the surface excess. If the pressure goes larger than 1 MPa, the difference cannot be ignored between surface excess and absolute amount adsorbed. Therefore, the conclusion can be drawn as that the absolute amount adsorbed is more relevant than the surface excess to estimate and evaluate the potential gas resources in shale gas reservoirs (Rexer et al., 2013). On the other hand, in the process of shale gas production, the amount of gas desorbed is also related to the absolute desorption isotherm, which cannot be directly estimated from the surface excess adsorption. Above all, absolute isotherms are of key performance in the context of shale gas exploitation.
In high pressure adsorption measurements, only the surface excess can be obtained. As a result, proper methods are required to calculate the absolute isotherm from the surface excess. In order to access absolute sorption characteristics from high pressure adsorption isotherms, we can use the models such as the Langmuir model and the Dubinin–Radushkevich (DR) model. The Langmuir model and DR model are based on different theory and originally established for the purpose of subcritical adsorption (Rexer et al., 2013; Wang et al., 2016).
The surface excess isotherms can be directly measured in the experiments. Nevertheless, as discussed above, it is the absolute isotherms that represent the actual adsorbed layer and accurately describe the gas present in shale. As a result, they are required for the assessment and exploitation of methane in shales. In this paper, methane surface excess isotherms were measured at 303 K, 313 K, 323 K, 333 K, 343 K and pressures up to 12 MPa on two organic-rich, moisture-equilibrated shale samples. In the experiment, the obtained data were used to predict the absolute isotherms for the purpose of testing the applicability of the Langmuir and DR models. The effect of temperature on sorption capacity was also studied based on multiple-temperature sorption isotherms of the shale samples. Finally, the evolution of methane sorption capacity as a function of depth was analyzed.
Samples and experiments
Geological setting and samples
The Ordos Basin, located in the northern-central of China (Figure 1), is the second largest sedimentary basin with vast oil and gas reserves (Dai et al., 2005; Duan et al., 2008). It is an intracratonic depression basin with an area of more than 250,000 km2. It is also well-known by the world as one of the most tectonically stable basins in China (Dai et al., 2005). As a typical cratonic basin, it was developed on the base of Archean granulites and the lower Proterozoic greenschists of the North China block, and experienced four evolutionary stages. They belong to the Early Palaeozoic shallow marine platform, the Late Palaeozoic offshore plain, the Mesozoic intracontinental basin and the Cenozoic faulting and subsidence (Yang et al., 2005). During the Mesozoic, its structural framework of the basin was largely developed. While during the Late Triassic, the widespread intra-continental lacustrine shales developed (Liu et al., 2009). From the stage of Late Cretaceous there happened five reformation events in the Ordos Basin (Zhao et al., 2011). And after the stage of Cenozoic basin general subsidence, the present tectonic situation was formed ever since (Han et al., 2014; Tang et al., 2014).
Schematic map showing sampling location (modified from Ji et al., 2014).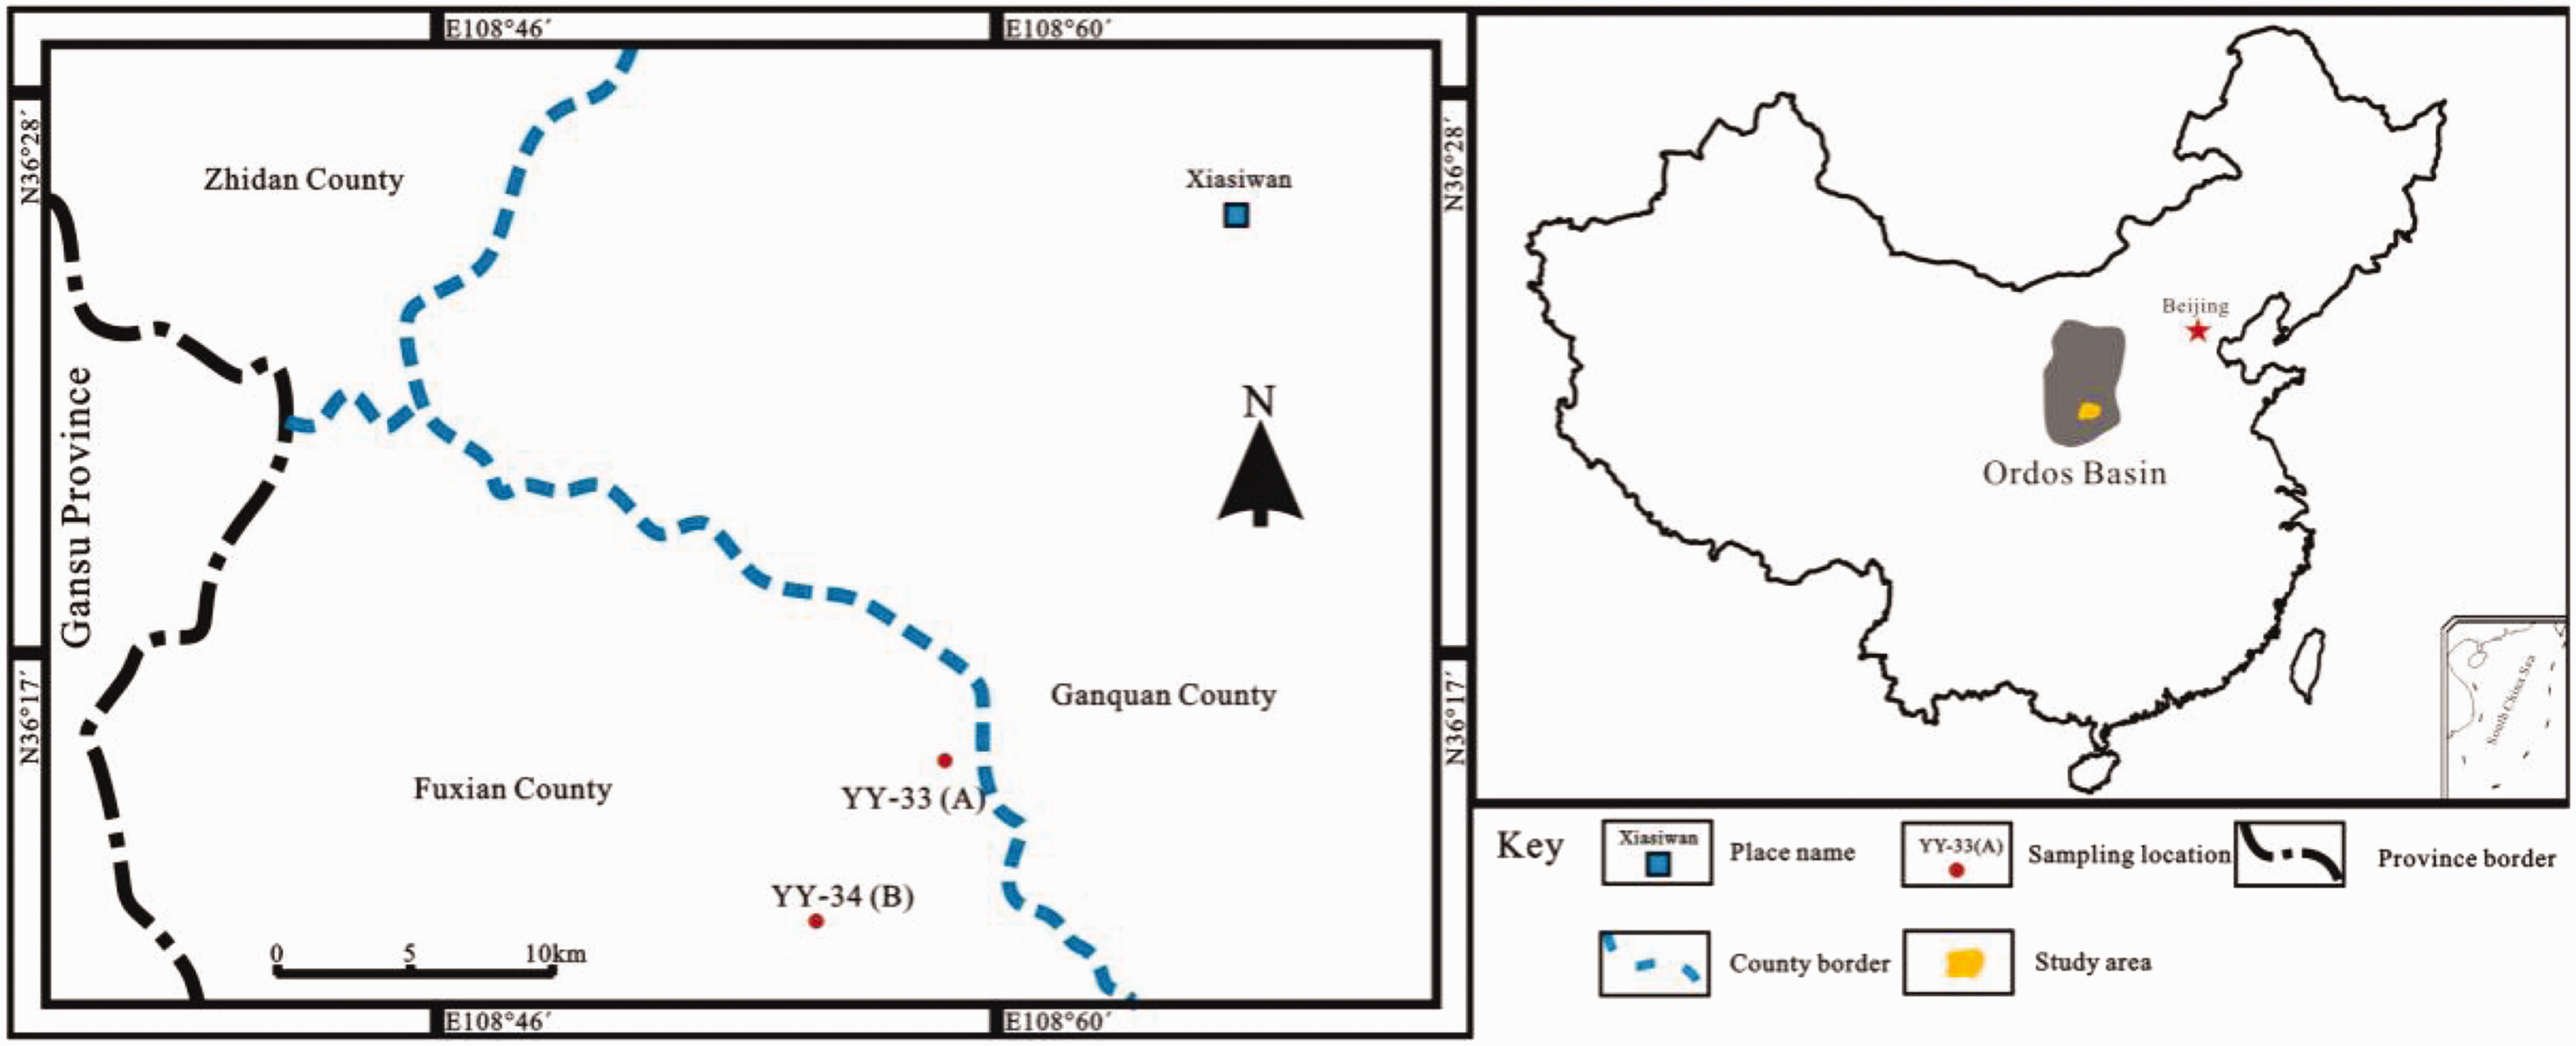
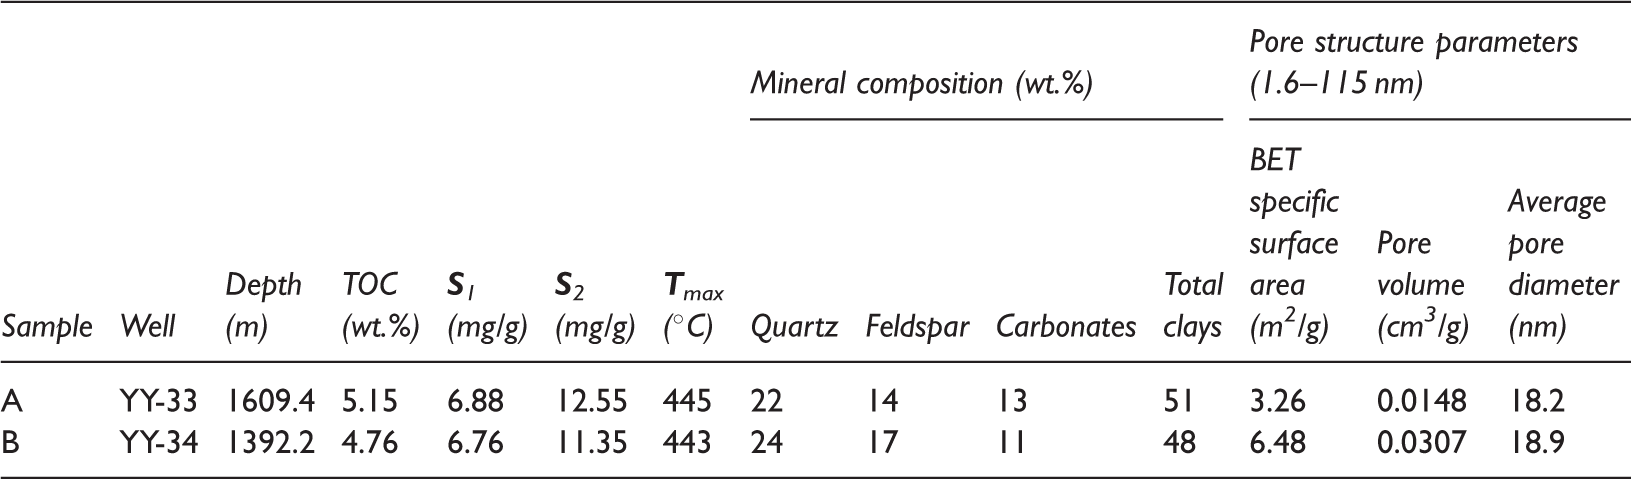
Geochemical characteristics and mineralogical composition of two shale samples.
Geochemical analysis
Geochemical analysis of the shale samples were performed at State Key Laboratory of Petroleum Resources and Prospecting in China University of Petroleum (Beijing). To remove carbonates, the samples were placed in a crucible with 5% HCl at the temperature of 80℃. A carbon analyzer with the model of Leco CS-230 was used to measure the TOC (in Table 1). The type, maturity, and hydrocarbon generation potential of the organic matter were obtained by an OGE-II rock pyrolyze from a sample of about 70 mg. During this process, the parameters were measured as following: (1) the amount of free hydrocarbons in the sample (S1); (2) the amount of hydrocarbons which was generated through thermal cracking of nonvolatile organic matter (S2); (3) the maximum temperature released from cracked hydrocarbons (Tmax), which is an indicator of the maturity of the sample (Rexer et al., 2014).
X-ray diffraction
Quantitative X-ray diffraction (XRD) analysis of randomly oriented powders was used for the mineralogy of the shale samples at Experimental Research Center of East China Branch, SINOPEC. The measurements were performed on Ultima IV diffractometer using Cu Kα-radiation (λ = 0.15418 nm) produced at a voltage of 40 kV and a current of 40 mA. A scan rate of 4° (2θ)/min was used in the range of 5°–45° for recording the XRD traces. In the beginning, the bulk mineral composition of the powder sample was determined, but at this stage only the total clay content was included. Then moving to the next stage, the individual mineral content of clay fractions, which was separated from the rock powder sample was determined. Please be noted that in this experiment both the bulk and individual contents were measured under exactly the same conditions.
Low-pressure N2 sorption
By using a Micromeritics ® Tristar II 3020 surface area analyzer, we performed low-pressure (<0.127 MPa, 77.35 K) N2 sorption analyses at State Key Laboratory of Heavy Oil Processing in China University of Petroleum, Beijing. Shale sample aliquots weighing 1 to 2 g were analyzed with N2 to obtain information about microscopic pore characteristics within the range of ∼1.6–115 nm. Samples were automatically degassed at about 110℃ under vacuum for about 14 h to remove adsorbed moisture and volatile matter before analyzing with N2. The sample was kept at the temperature of liquid nitrogen (77.35 K at 101.3 kPa) in order to quantify nitrogen gas adsorption. The equilibrium interval (time over which the pressure must remain stable within a very small range) was set at 30 s, and the pressure tolerance was set at 0.6666 kPa (5 mm Hg). The adsorption isotherms and calculated surface areas, pore volumes, and pore distributions were obtained based on multiple adsorption theories, namely, Langmuir, Brunauer–Emmett–Teller (BET), Barrett–Joyner–Halenda, DR, and Dubinin–Astakhov, among others (Mastalerz et al., 2012, 2013). A detailed description of these theories and techniques can be found in Gregg and Sing (1982).
High-pressure methane sorption isotherm
Experimental setup and procedure
The methane sorption isotherms (303–343 K; up to 12 MPa) were measured on HPVA-200 high-pressure gas sorption/desorption instrument adopting GB/T 19560-2008 (China national standard) testing standard at Experimental Research Center of East China Branch, SINOPEC. The measurements were carried out based on a manometric method, which has been described in detail in a series of publications (Gasparik et al., 2014; Guo et al., 2014; Weniger et al., 2010).
Parameterization of excess sorption isotherms
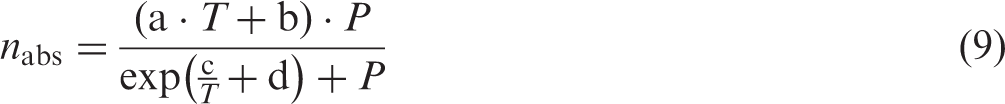
The experimentally measured excess adsorption isotherms were expressed by the following function

All the conventional isotherm equations were originally derived for absolute adsorption amount (nabs, cm3/g), therefore modified models should be used to parameterize the measured excess sorption data (Gasparik et al., 2012, 2014).
Langmuir model
The Langmuir model is based on a homogeneous distribution of sorption sites and monolayer formation on an open surface and it is used as a standard model to describe vapor isotherms on shales (Rexer et al., 2013). The original Langmuir equation is


DR model
The DR model is based on the Polanyi potential theory and applies when the adsorption process follows a pore filling mechanism, e.g. sorption in micropores (Rexer et al., 2013). The original DR equation is
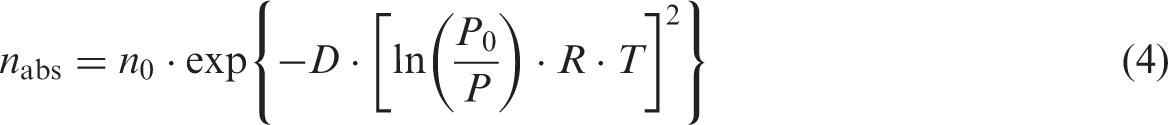
Since the critical temperature for methane is 190.6 K, methane is in the supercritical state in all shale gas reservoirs. Methane does not exhibit a saturated vapor pressure under supercritical conditions. Therefore, the original DR equation, which uses relative pressure as a parameter, cannot be used in this case. For the purpose of applying the DR equation to supercritical sorption processes, Sakurovs et al. (2007) proposed the replacement of the pressure term P0/P with ρads/ρgas, where ρads and ρgas represent maximum adsorbed and free gas phase densities, respectively
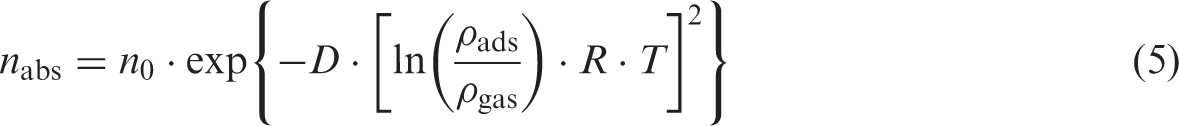
As a result, the experimentally measured excess adsorption isotherms used herein can be written as

In order to calculate the absolute sorption from the surface excess sorption, we must try to get the value of the adsorbed gas density (ρads). Considering that direct measurement of the adsorbed phase density is difficult, empirical methods are regularly used to calculate it (Sudibandriyo et al., 2003; Tian et al., 2016). In this study, we regarded the adsorbed phase density (ρads) as the liquid density at boiling temperature and ambient pressure (421 kg/m3 is used for CH4) (Dreisbach et al., 1999; Yang et al., 2014, 2015).
Results
Geochemical parameters and mineralogical composition
The results of geochemical parameters and mineralogical composition are listed in Table 1. The TOC tests obtained value of 5.15% for sample A, and 4.76% for sample B. Based on the measured TOC content, two samples were categorized as organic-rich shales. From their Rock-Eval Tmax values, we could infer that the thermal maturity of the organic matter is at a stage of mature oil-gas generation.
XRD results confirmed the dominant minerals in the samples are clay minerals and quartz. For example, in sample A, total clay minerals account for 51%, quartz account for 22%, feldspar account for 14%, and carbonates account for 13%.
Pore structure characterization by low-pressure nitrogen sorption
According to the International Union of Pure and Applied Chemistry (IUPAC) classification (Figure 2; Gregg and Sing, 1982), both the low-pressure nitrogen adsorption isotherms of the two samples studied belong to type IV. This type of isotherms are caused by micropore filling at low pressures, multilayer sorption at moderate pressures, and capillary condensation–evaporation at high pressures, which suggests that mesopores developed well in two shale samples. The hysteresis loops, formed by the adsorption and desorption branches, are of type H3, which always result from slit-shaped pores (Gregg and Sing, 1982). Figure 2 shows that the higher TOC content (sample A), the wider the hysteresis loops.
Low-pressure N2 adsorption–desorption isotherms for two shale samples.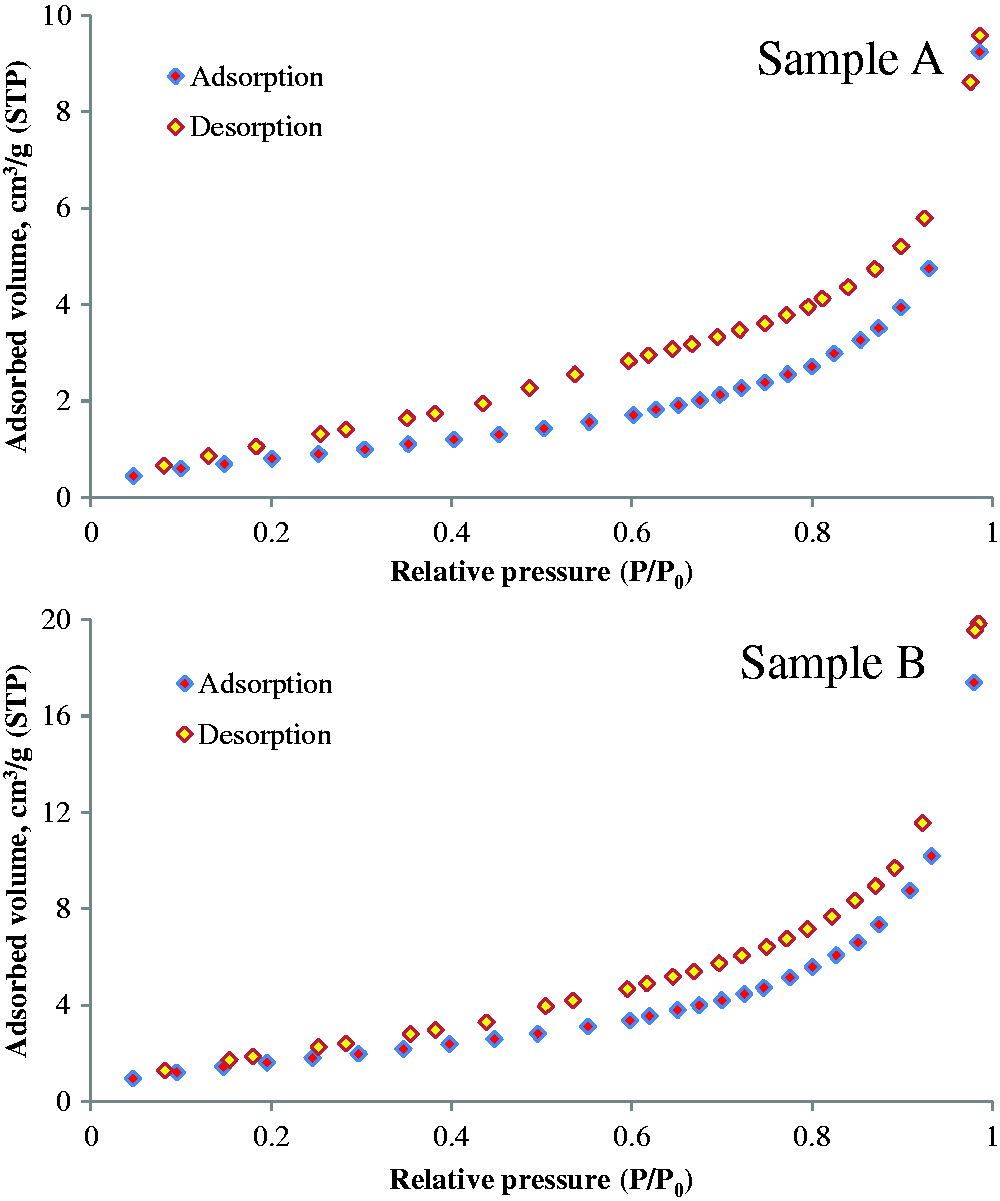
The pore structure parameters of two shale samples are reported in Table 1. The BET specific surface area of sample A is 3.26 m2/g, while sample B is 6.48 m2/g; the pore volume of sample A is 0.0148 cm3/g, while sample B is 0.0307 cm3/g; average pore diameter is 18.2 nm for sample A and 18.9 nm for sample B.
For pore volume distribution, dV/dW versus W, which is commonly regarded as the differential distribution plot and the pore volume in any pore width range is given by the area under the curve. With logarithmically compressed of the W-axis, dV/d log(W) versus W is frequently used to display the pore size distribution (Clarkson et al., 2013; Kuila and Prasad, 2013; Tian et al., 2013, 2015). As illustrated in Figure 3(a) and (b), dV/d log(W) versus W clearly reveals that the mesopores and part of macropores significantly contribute to the total pore volume. The reason lies in that that one large pore does have a volume correspondent to many small pores. Meanwhile, for the distributions of specific surface area with respect to pore size, the results are displayed in Figure 3(c) and (d). The pore volumes are mainly connected with larger pores, while the specific surface areas are primarily controlled by smaller pores.
Pore volume distribution with pore size (a, b) and specific surface area distribution with pore size (c, d) derived from the N2 adsorption branch for the isotherms of two shale samples.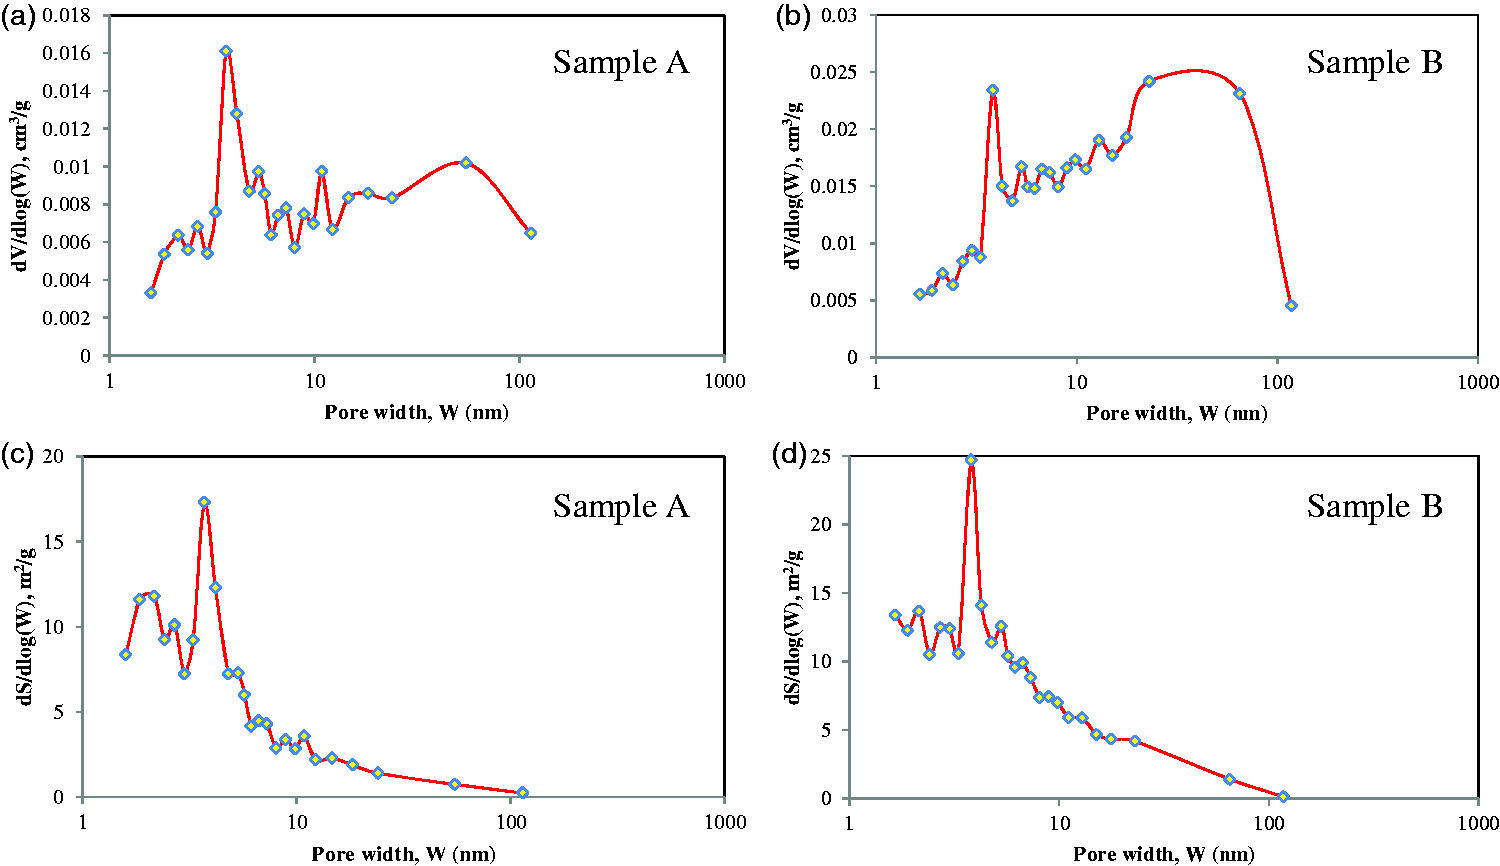
Methane sorption isotherms
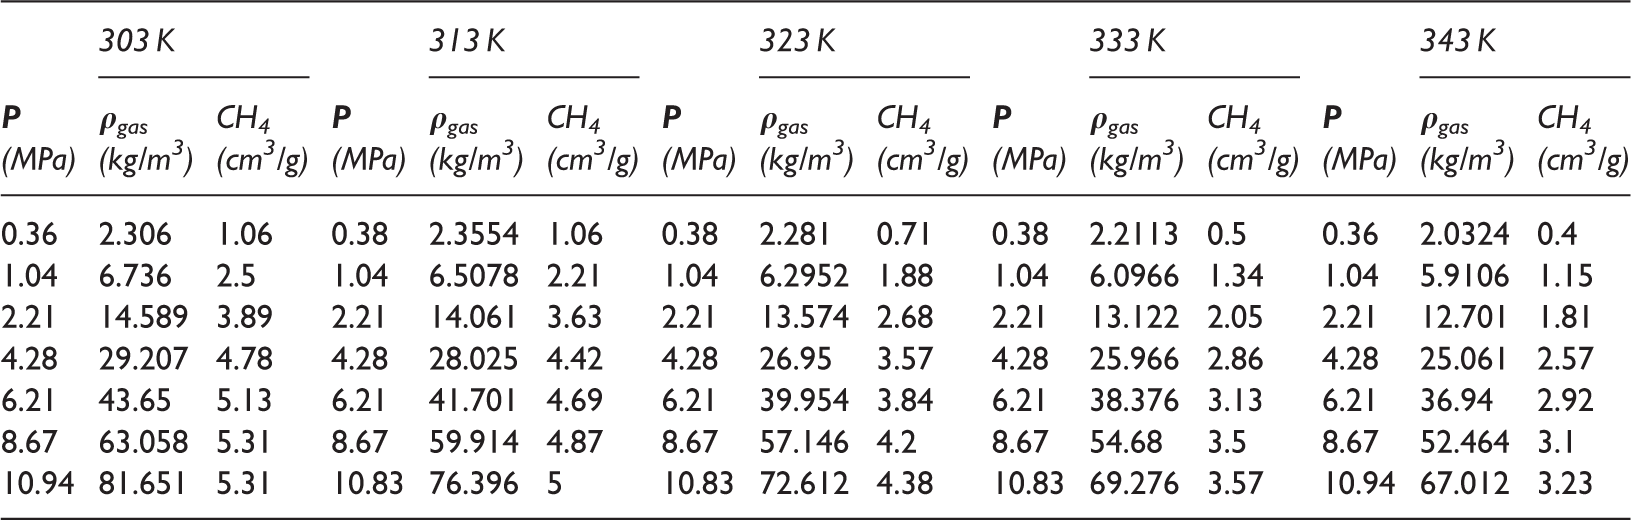
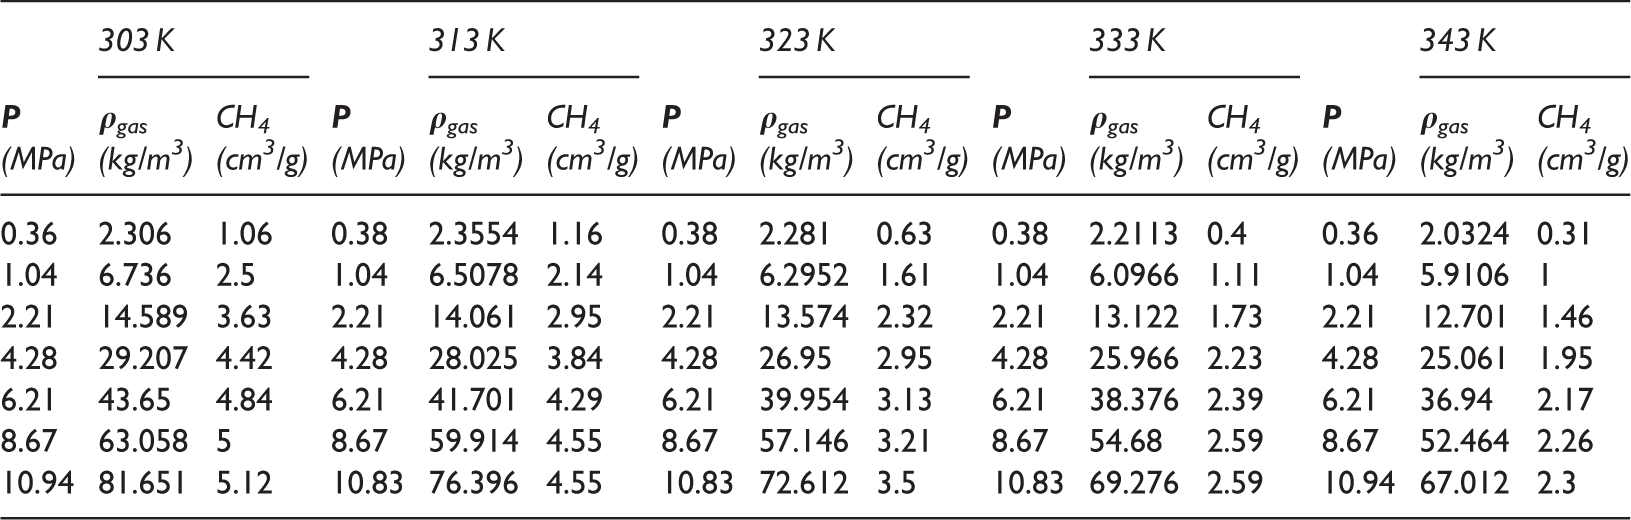
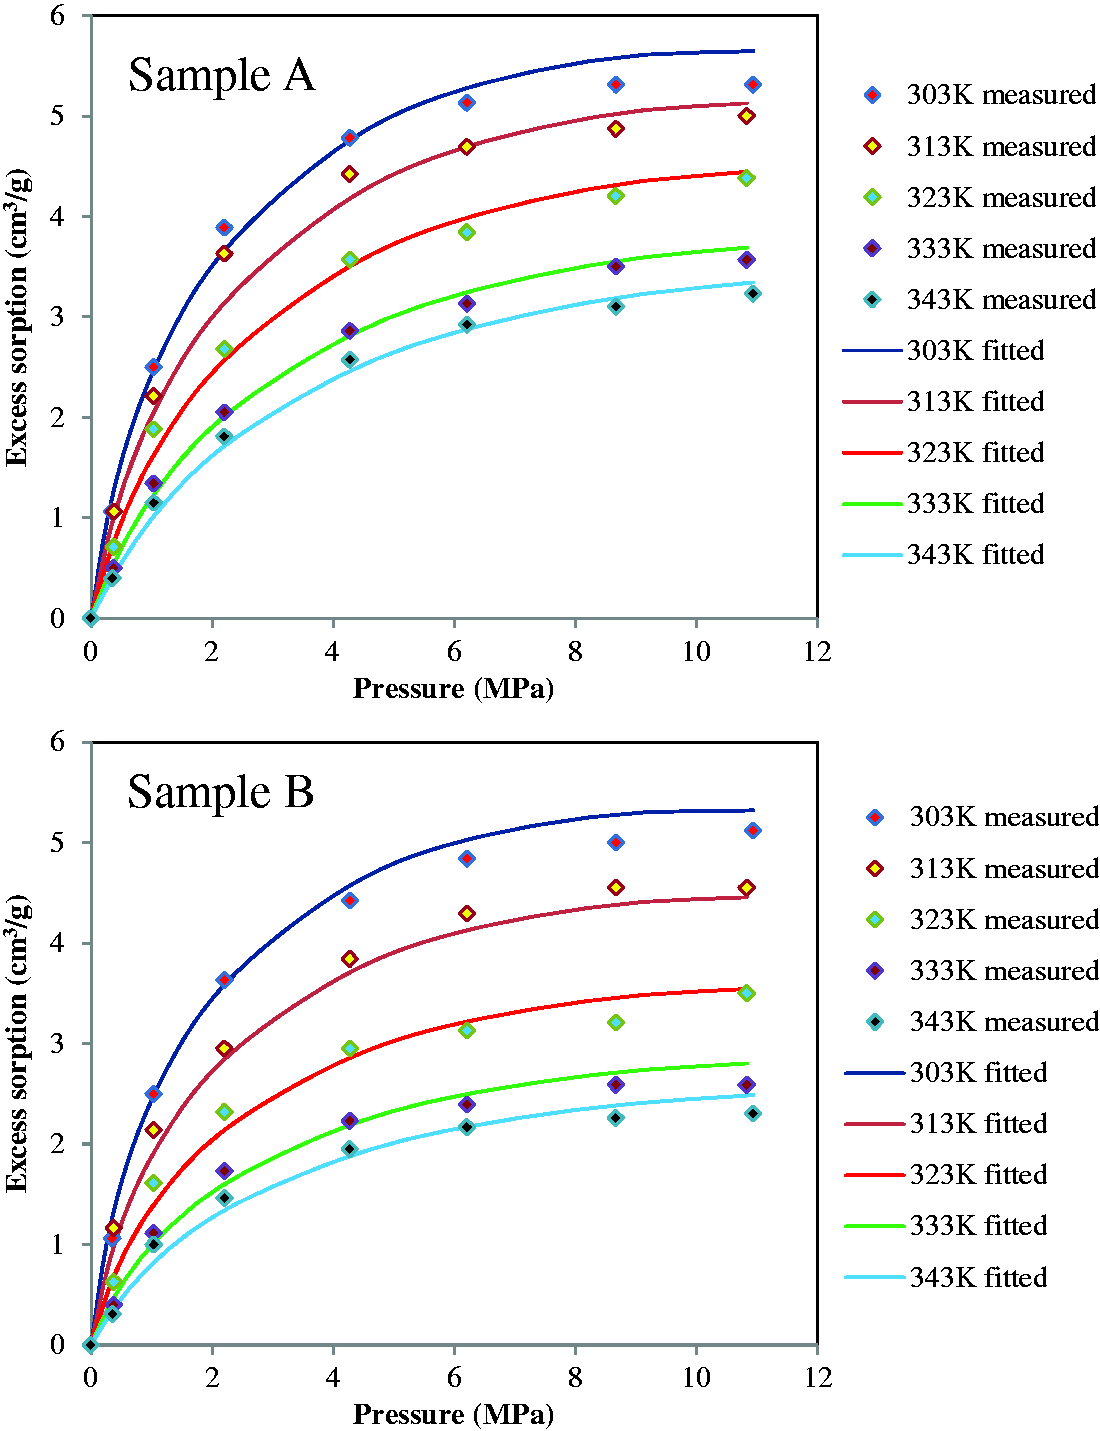
Methane excess sorption isotherms measured at 303, 313, 323, 333 and 343 K on two shale samples are shown in Figure 4, Tables 2, and 3. As shown in Figures 4 and 5, methane excess sorption amount can be well fitted by the modified Langmuir and DR models. The sorption isotherms show the typical trend of decreasing excess sorption capacity with increasing temperature. Moreover, when temperature keeps rising, the shape of the isotherms will be largely affected. At five different temperatures, essentially no maxima are evident in the excess sorption isotherms within the experimental pressure range. Isothermal adsorption quantity will surely decrease after it reached the maximum if the experimental pressure increased further (Gasparik et al., 2012, 2014; Rexer et al., 2013, 2014; Tan et al., 2014; Tian et al., 2016; Yang et al., 2015). This is due to the fact that at elevated pressures the density difference between the adsorbed phase ρads and the free gas phase ρgas diminishes, decreasing the term inside the brackets in equation (1).
Methane excess sorption isotherms of two shale samples measured at different temperatures (lines represent the fitted Langmuir-based excess sorption function, equation (3)). Excess adsorption data of sample A at different temperatures. Excess adsorption data of sample B at different temperatures. Methane excess sorption isotherms of two shale samples measured at different temperatures (lines represent the fitted Dubinin–Radushkevich (DR)-based excess sorption function, equation (6)).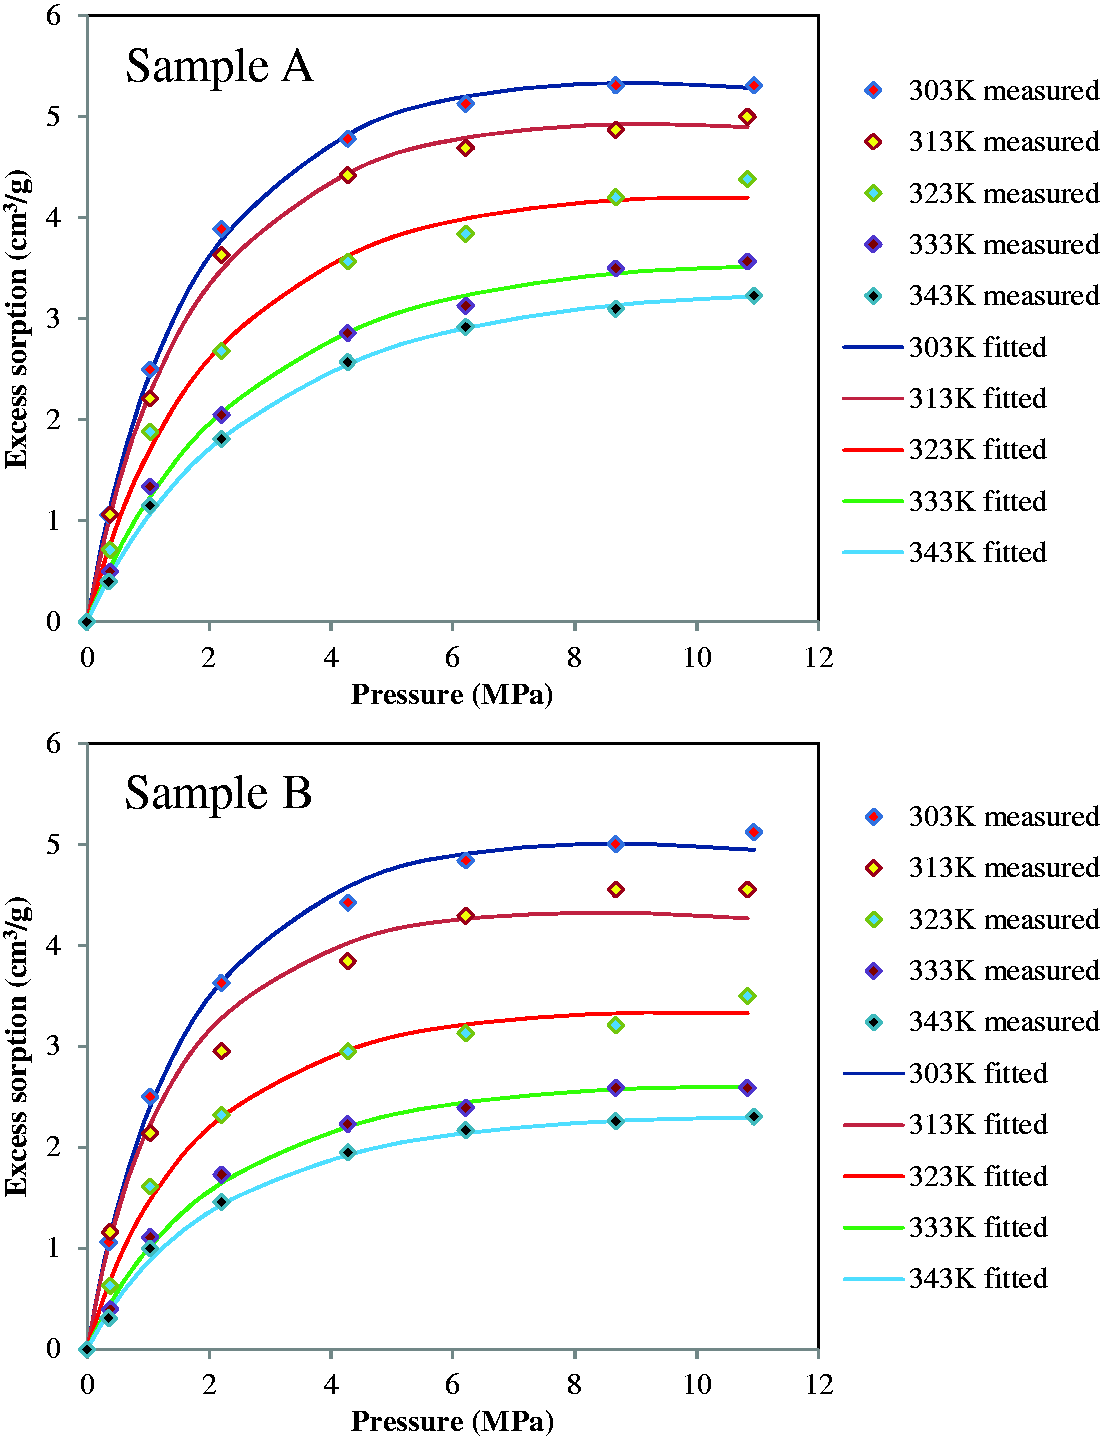
Fitted temperature-dependent parameters of the Langmuir- and DR-based excess sorption models (equations (3) and (6)) for methane on sample A.
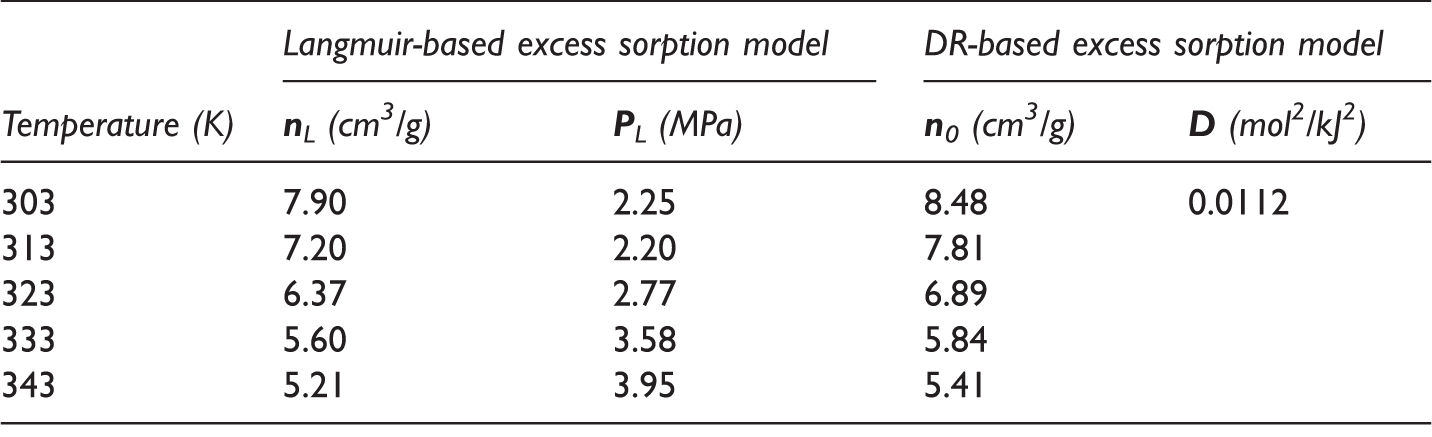
DR: Dubinin–Radushkevich.
Fitted temperature-dependent parameters of the Langmuir- and DR-based excess sorption models (equations (3) and (6)) for methane on sample B.
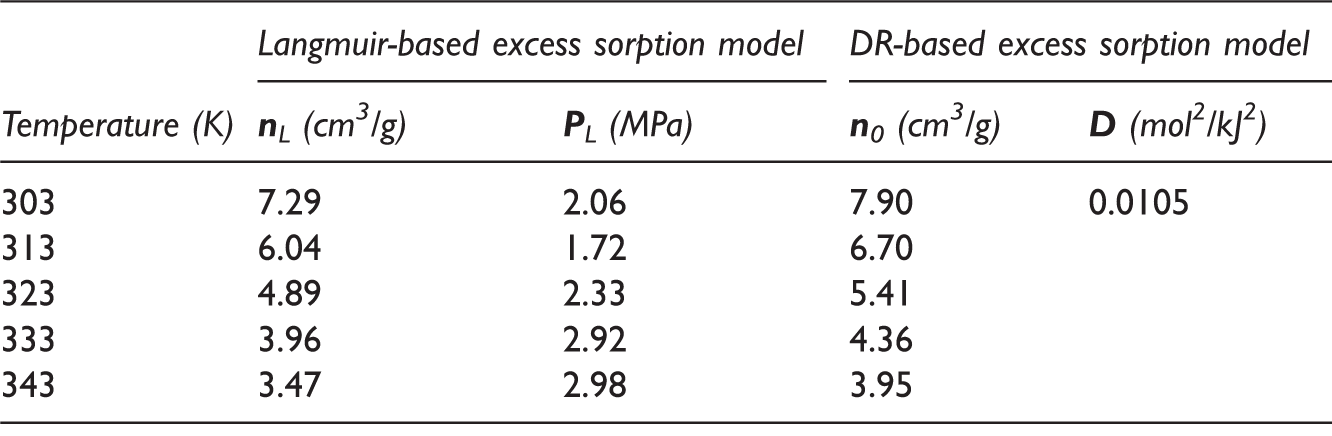
DR: Dubinin–Radushkevich.
Discussion
Effect of temperature on methane sorption capacity
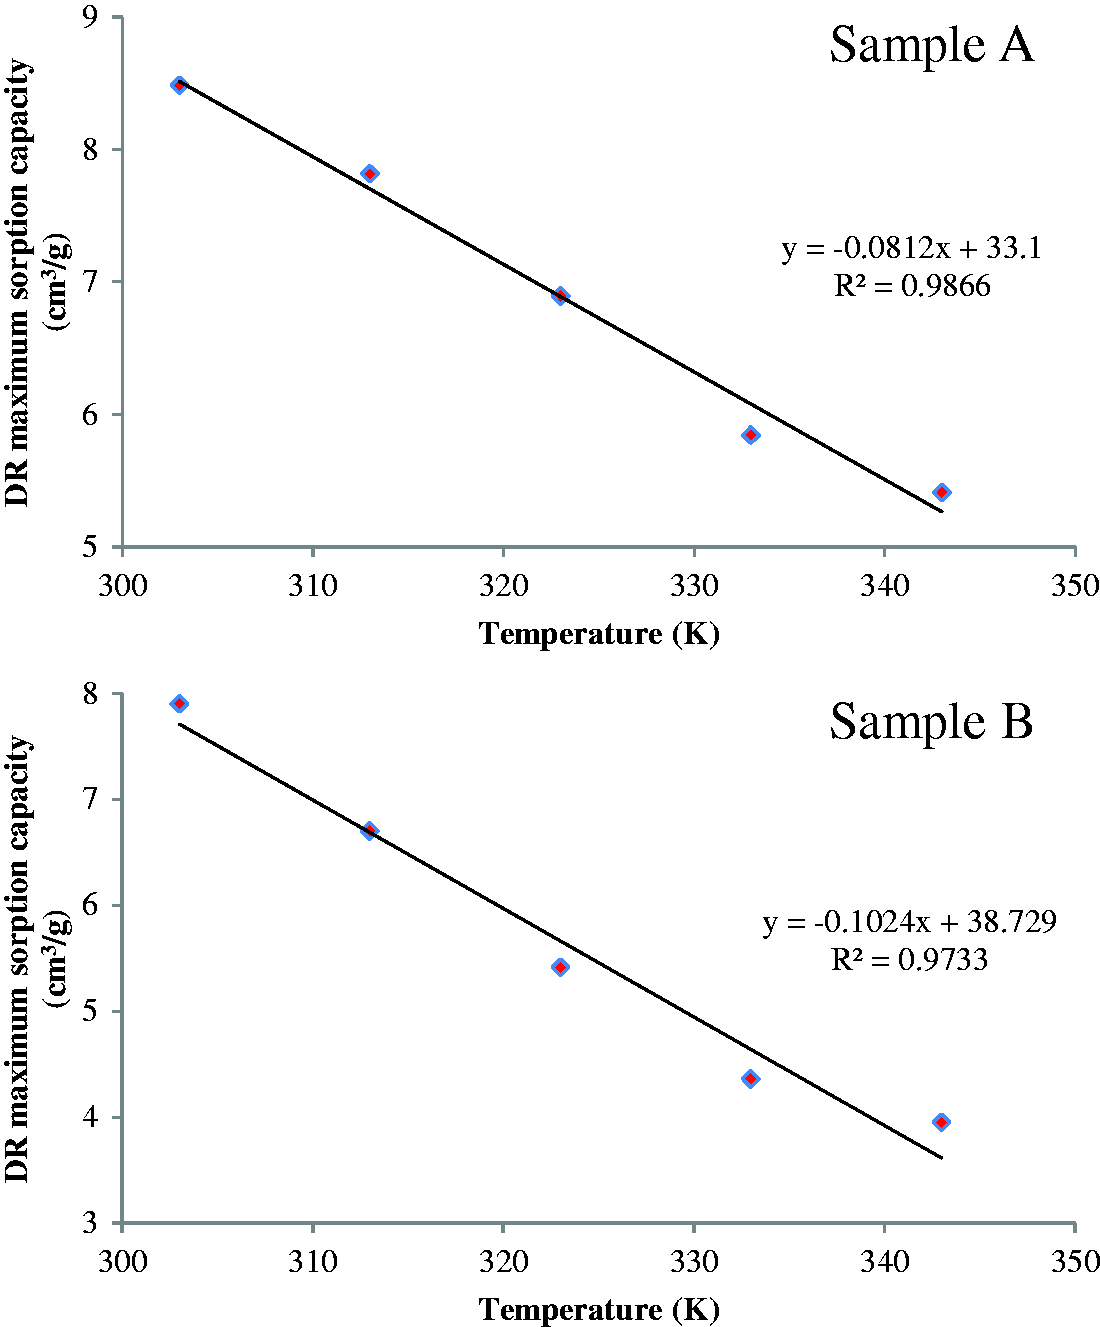
The effect of temperature on methane sorption capacity of shales has been extensively studied around the world (Gasparik et al., 2014; Guo, 2013; Ji et al., 2014, 2015; Rexer et al., 2013; Yang et al., 2015). Higher temperature favors gas in the free state more than in the adsorbed state. Gas sorption is an exothermic process in which sorption capacity of organic shales decrease with increasing temperature (Hao et al., 2013; Hildenbrand et al., 2006; Ross and Bustin, 2008). As shown in Figure 4, when temperature keeps increasing, methane sorption capacity will decrease very fast. In order to determine the Langmuir maximum sorption capacity (nL), Langmuir pressure (PL), DR maximum sorption capacity (n0), and interaction constant (D), a least squares fit was applied based on measured methane excess sorption isotherms. A good negative linear relationship between Langmuir maximum sorption capacity and temperature is obtained and shown in Figure 6 (R2 = 0.9876, 0.976, respectively). Such result was also reported by Ji et al. (2015) and Rexer et al. (2013). Similarly, a good negative linear relationship between the DR maximum sorption capacity and temperature is obtained and shown in Figure 7 (R2 = 0.9866, 0.9733, respectively), which was also reported by Rexer et al. (2013) and Tian et al. (2016).
Langmuir maximum sorption capacity (nL) as a function of temperature for two shale samples. Dubinin–Radushkevich (DR) maximum sorption capacity (n0) as a function of temperature for two shale samples.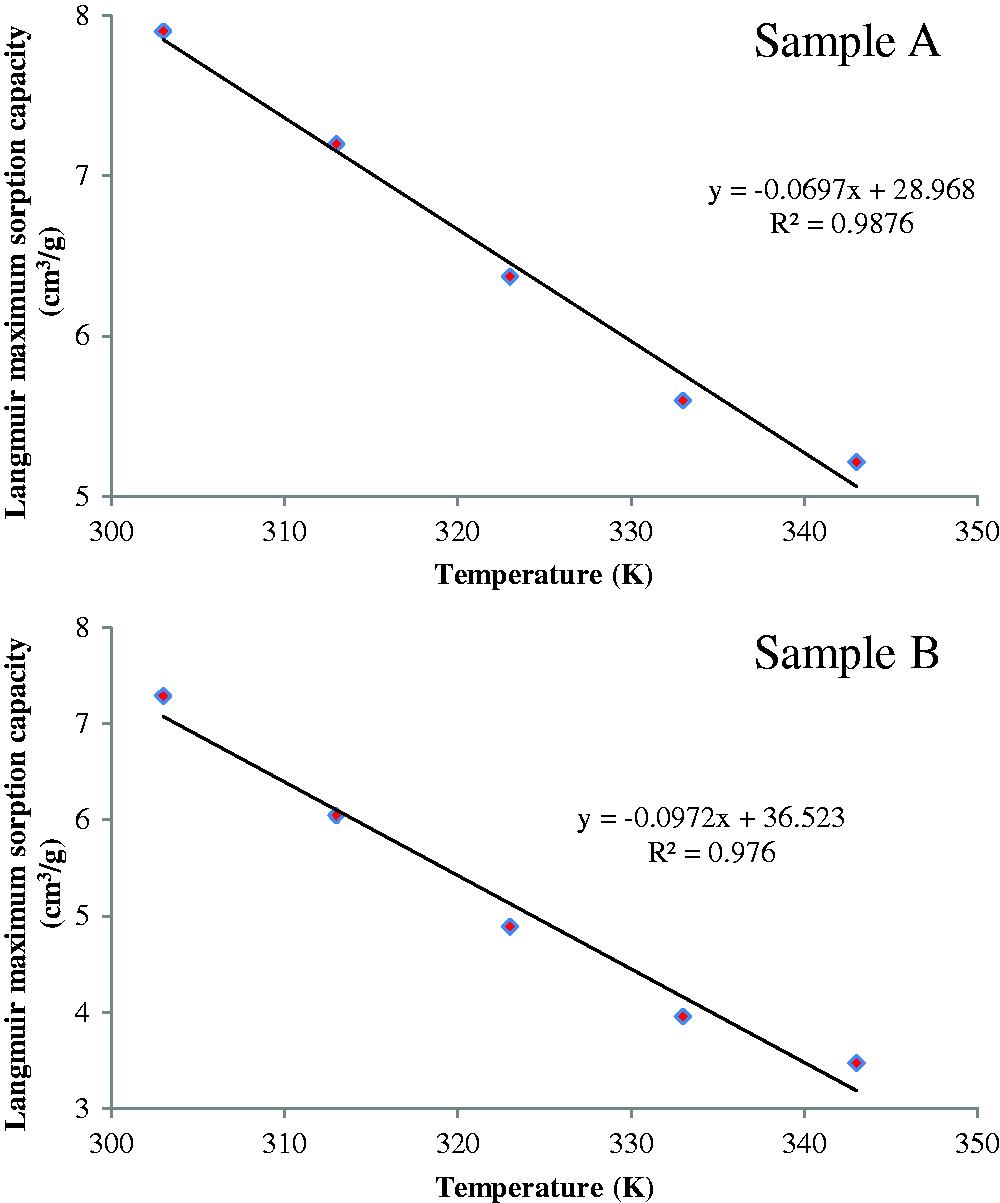
Effect of pressure on methane sorption capacity
Pressure has important influence on shale gas adsorption capacity (Gasparik et al., 2012, 2014; Guo, 2013; Ji et al., 2014, 2015; Zhang et al., 2012). In general, prior to reaching the maximum adsorption, as pressure rises, the adsorption rate is greater than the desorption rate, represented by an increase in adsorbed gas content. Similar trends were also observed in shale samples from other places using high-pressure methane sorption (to 20–25 MPa) (Gasparik et al., 2012, 2014). Note the maxima cannot be observed in many sorption isotherms because they were conducted in relatively lower pressure conditions (to 6–15 MPa) (Ross and Bustin, 2009; Wang et al, 2013; Zhang et al., 2012). Figure 8 shows a clear linear relationship between the natural logarithm of the Langmuir pressure (lnPL) and the reciprocal of temperature (1/T) for each sample (R2 = 0.911, 0.7243, respectively). In previous studies, we found out a similar exponential relationship between the Langmuir pressure and temperature (Gasparik et al., 2014; Ji et al., 2015; Rexer et al., 2013; Zhang et al., 2012).
Linear relation between the natural logarithm of the Langmuir pressure (lnPL) and the reciprocal of temperature (1/T).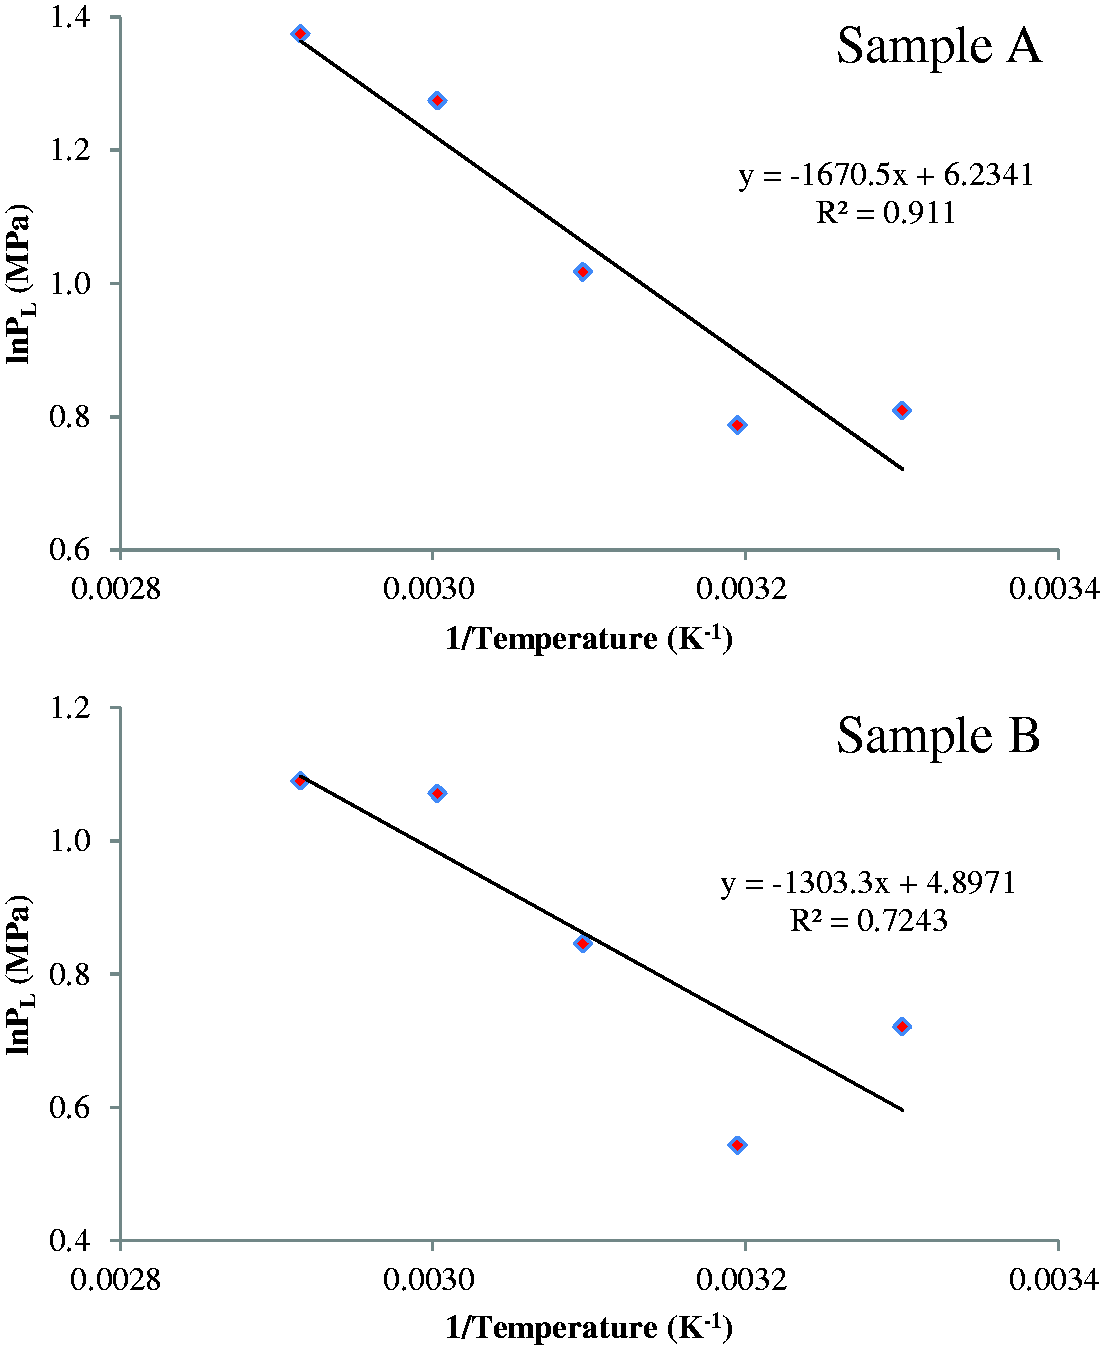
Estimation algorithms of methane sorption capacity
Extended Langmuir model
As outlined above, temperature greatly affects the Langmuir maximum sorption capacity in two shale samples (Figure 6). Their relation can be well represented by the standard form of linear regression

In addition, the Langmuir pressure is greatly controlled by temperature (Gasparik et al., 2014; Ji et al., 2015). Based on the notable linear relationship between the natural logarithm of the Langmuir pressure (lnPL) and the reciprocal of temperature (1/T) (Figure 8), their relation can be indicated by the following equation

Substituting equations (7) and (8) into the Langmuir equation (2), we can obtain an extended Langmuir model for methane sorption capacity under geological conditions
Based on the experimentally measured excess adsorption isotherms data of sample A (Table 2), an algorithm for methane sorption capacity estimation was determined

Similarly, an algorithm for methane sorption capacity estimation of sample B was determined

Extended DR model
As discussed previously, the DR maximum sorption capacity in two shale samples is greatly affected by temperature (Figure 7). Their relation can be well described by the standard form of linear regression

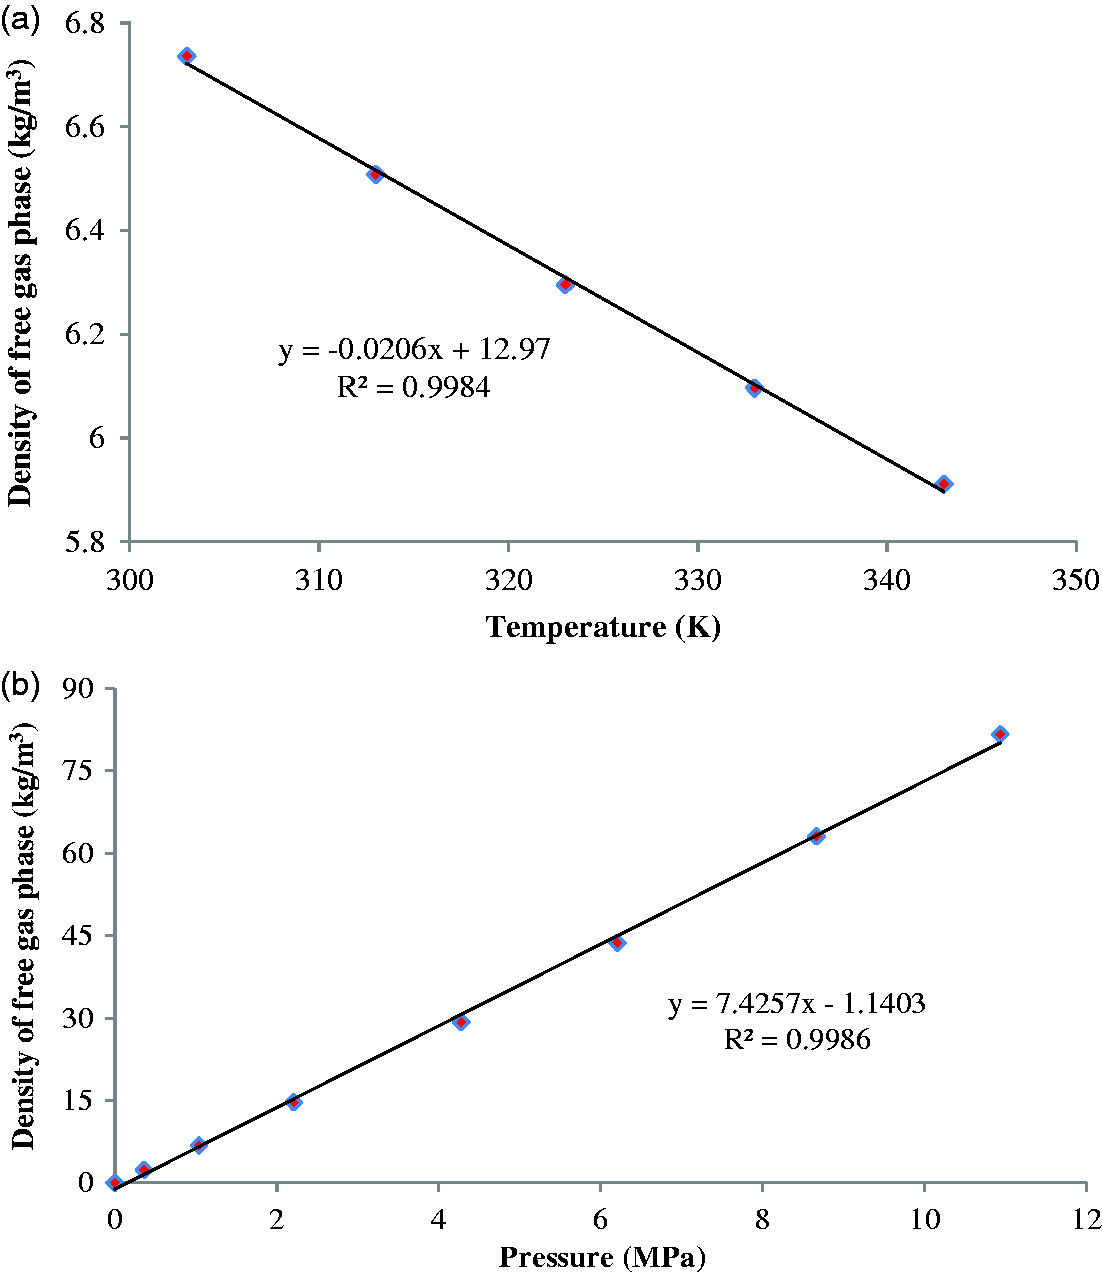
In addition, to calculate the methane sorption capacity by DR model, it is necessary to find out the effect of temperature and pressure on the free gas phase density (ρgas). As illustrated in Figure 9, the free gas phase density of the two shale samples both show good linear relationships with temperature and pressure. Therefore, a multiple regression approach was used to relate the free gas phase density to the combined effects of the independent variables (temperature and pressure). The free gas phase density was expressed using the standard form of multiple linear regressions
Density of free gas phase as a function of temperature (a) and pressure (b).
Substituting equations (12) and (13) into the DR equation (5), we can obtain an extended DR model for methane sorption capacity under geological conditions as shown below

Based on the experimentally measured excess adsorption isotherms data of sample A (Table 2), an algorithm for methane sorption capacity estimation was determined
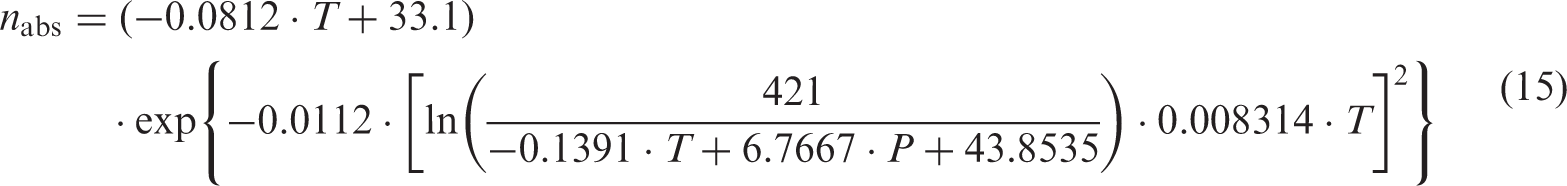
Similarly, an algorithm for methane sorption capacity estimation of sample B was determined
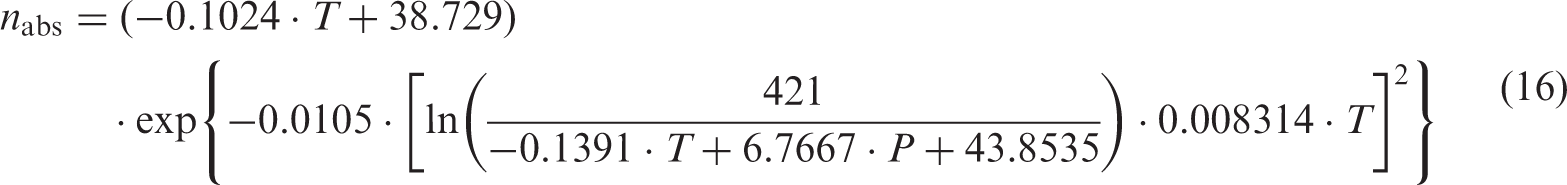
Methane sorption capacity as a function of depth
With a surface temperature of 12℃ (i.e. 285 K), a thermal gradient of 30 K/km (Ji et al., 2014) and a hydrostatic pressure gradient of 10 MPa/km for the present investigation on the southeastern Ordos Basin of China, methane sorption capacity of sample A versus depth profiles can be calculated using equation (10) and equation (15), respectively, and methane sorption capacity of sample B versus depth profiles can be calculated using equation (11) and equation (16), respectively.
Considering the negative effect of increasing temperature and the positive effect of increasing pressure, methane sorption capacity varies with depth non-monotonically. As shown in Figure 10, methane sorption capacity initially increases with depth, till it reaches a maximum value, and then decreases as a result of increasing temperature at a greater depth. Approximately, the maximum sorption capacity ranges from 400 m to 800 m. The pattern explains why the shale has the highest adsorbed gas content under a certain value of P–T, which is quite analogous to previous studies (Hao et al., 2013; Hildenbrand et al., 2006; Ji et al., 2014, 2015).
Methane sorption capacity as a function of depth by the Langmuir and Dubinin–Radushkevich (DR) models for two shale samples.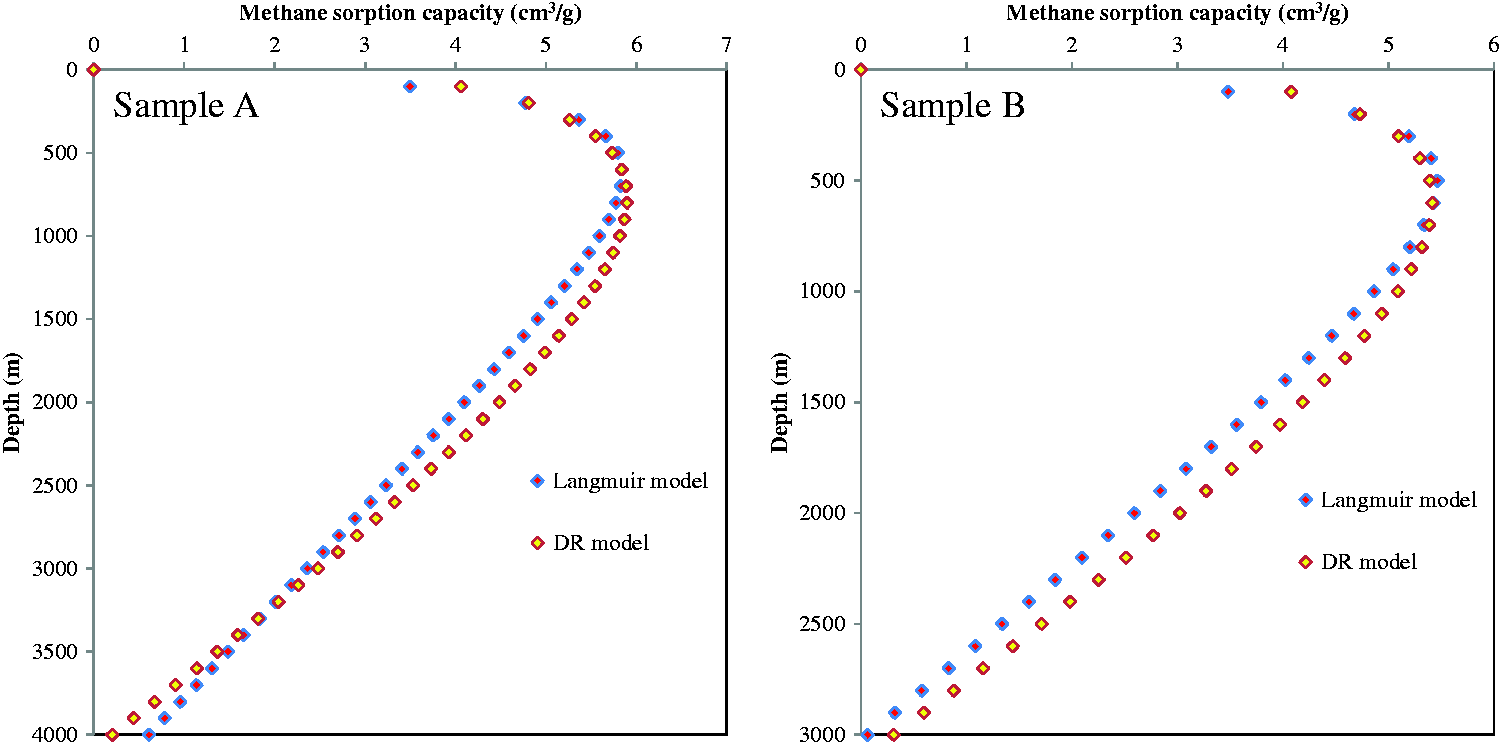
Conclusions and suggestion
High-pressure methane sorption isotherms were measured on two shale samples from the Upper Triassic Chang 7 Member in the southeastern Ordos Basin, China. Supercritical adsorption was modeled using both the Langmuir and DR models, in which the effects of temperature and pressure on methane sorption capacity have been investigated. Two extended models considering the contribution of temperature and pressure have been developed to estimate the methane sorption capacity, and its evolution as a function of depth was established. The following conclusions can be drawn:
When pressure rises under isothermal condition, methane sorption capacity of organic shale will increase accordingly, while it will decline with increasing temperature under isobaric condition. For individual shale sample, the Langmuir maximum sorption capacity and the DR maximum sorption capacity both have good negative linear relationships with temperature. In addition, a clear negative linear relation was obtained for the natural logarithm of Langmuir pressure and the reciprocal of temperature, which indicate that both temperature and pressure have significant effects on methane sorption capacity. Based on the effects of temperature and pressure on methane sorption capacity of Upper Triassic Chang 7 Member shale, this article presented the extended Langmuir and DR models (equations (9) and (14)) and established the empirical formulas (equations (10) and (15)) for sample A and the empirical formulas (equations (11) and (16)) for sample B, respectively. Using these empirical formulas, methane sorption capacity as a function of depth under geological reservoir conditions can be estimated with reasonable accuracy. Due to the dominant effect of pressure, methane sorption capacity increases with depth initially, till it reaches a maximum value, and then decreases as a result of the influence of increasing temperature at a greater depth. Approximately, the maximum sorption capacity ranges from 400 m to 800 m.
As discussed in the previous section, both the Langmuir and DR models fitted well with the experimental data of the two shale samples. In fact, the Langmuir model is simpler, and therefore commonly used for describing the adsorption behavior of shales. Our study suggests it is adequate for most of the practical reservoir assessments since it gave quite similar results with the DR model.
Other geological parameters affecting methane sorption capacity such as organic matter, mineral composition, pore structure, and moisture need to be further studied to provide better estimation algorithm and more accurate evolution pattern of methane sorption capacity. Meanwhile, more shale samples are needed to conduct relevant experiments to provide a better understanding between Langmuir model and DR model.
Footnotes
Acknowledgment
We thank the anonymous reviewers for their critical and constructive comments.
Declaration of conflicting interests
The author(s) declared no potential conflicts of interest with respect to the research, authorship, and/or publication of this article.
Funding
The author(s) disclosed receipt of the following financial support for the research, authorship, and/or publication of this article: National Science and Technology Major Project (No. 2016ZX05034-001) and National Natural Science Foundation of China (No. 41472112).