
Abstract
W4 block of Sichuan Basin is a pioneer in shale gas exploration and development in China. But geophysical prospecting is just at its beginning and thus has not provided enough information about how sweet spots distribute for the deployment of horizontal well. This paper predicted sweet spots based on logging and 3D seismic data. Well logging interpretation method was used to get the key evaluation parameters of shale reservoir and determine the distribution of sweet spots in vertical direction. Rock physics analysis technology was used to define the elastic parameters that were sensitive to the key evaluation parameters, such as TOC and gas content of shale gas reservoir. At the same time the quantitative relationships between them were established. Based on the result of seismic rock physics analysis, prestack inversion was carried out to predict the transverse plane distribution of the key evaluation parameters of shale reservoir. These research results are integrated to determine the distribution of sweet spots. The results show that sweet spots in this area were characterized by high TOC content, high gas content, high GR, high Young’s modulus, low Poisson’s ratio, low density, and low P-wave velocity. Density was the most sensitive elastic parameters to TOC of the reservoir. The optimal combination for predicting the gas content is composed of six parameters include density, Poisson’s ratio, and so on. Sweet spots in this block vertically concentrate within 30 m above the bottom of Longmaxi Formation. Two classes of sweet spots have been predicted in this area, class I sweet spots are recommended to be prioritized for development. This study effectively predicted the spatial distribution of sweet spots, which provide important guidance for the development of the area.
Introduction
The shale gas success in North America has a great impact on natural gas supply in North America and LNG (liquefied natural gas) supply around the world (Jarvie, 2012; Newell, 2010). Some key technologies have emerged, such as prediction of sweet spots based on 3D seismic data, horizontal well volume fracturing, and microseismic monitoring (Fu, 2014; Jiang et al., 2008). Recent efforts have focused on sedimentary environment, lithology, nano-pore microstructure, and shale gas occurrence in nano-pores (Loucks et al., 2012).
Shale gas potential is similar in China and the US (Li et al., 2009). But geologic setting in China is more complex than that in North America, so many of the key technologies can not be completely copied to China, shale gas production is more challenging in China (Zhang et al., 2008). Shale gas exploration and development just began in recent years in China, and seismic-based prediction of sweet spots is still in its infancy (Zhang and Yang, 2013).
Prediction of sweet spots is significant for extensive and efficient shale gas production in China (Nie et al., 2011). It is a vital activity in shale gas exploration and development. Sweet spots can be classified into geologic sweet spots and engineering sweet spots. The former refers to the zones with moderate buried depth, high TOC content, high maturity, good preserving conditions, and high gas content. The latter refers to the zones with high content of brittle minerals and high fracturability to form a fracture network. Sweet spots are preferred for purpose of effective development and high and stable production of shale gas (Aliouane and Ouadfeul, 2014; Fan et al., 2011). Usually, their distributions are predicted vertically using logging techniques and horizontally using seismic techniques. The results of prediction are useful for horizontal well deployment and wellbore trajectory design, so as to improve economic benefits and reduce production cost.
Zhang et al. made a systematic comparison on shale gas geology in China and the US, and they proposed that marine shale formations in southern China, including the Longmaxi Formation, were promising for shale gas development (Liu and Wang, 2013). Wang et al. (2009) compared the geochemical features of Cambrian and Longmaxi shales in respect of maturity, migration, accumulation conditions, mineral components, and presented that the Lower Silurian Longmaxi shale was the top choice for shale gas exploration and development. Dong et al. (2016) discussed key parameters for shale gas evaluation in some large basins in China and presented that shale gas exploration within China should concentrate in the Sichuan Basin. Wang et al. (2009) after regional geology study, proposed that the southern Sichuan Basin was favorable for shale gas exploration, where the best shale gas accumulation conditions existed in Lower Silurian. Through analysis of core, logging, testing, and geochemical data, Wang et al. (2009) concluded that the recent shale gas exploration and development could focus on the Lower Silurian Longmaxi Formation in Weiyuan and Changning blocks in southern Sichuan Basin, and they also suggested to reexamine old wells and conduct sand frac test and to define W4 block as the core prospect. In 2010, PetroChina initiated the first 3D seismic survey in Weiyuan for shale gas exploration, and deployed the first exploratory well based on structure interpretation results.
Currently, most of studies focus on macro geologic aspects, such as shale gas accumulation, sedimentary facies, and geologic reservoir evaluation. Because the surface of this block is very complex, so the first 3D seimic acquisition was carried out in 2015. Promising and core prospects have been defined, but no sweet spots have been determined for commercial production by horizontal wells. On the other hand, geophysical studies now mainly concentrates in single well testing and well logging interpretation. But the study of how to prospect sweet spots using seismic data is just at its beginning, resulting in low precision of sweet spots prediction for areas without wells drilled, where sweet spots can not be determined effectively. The solution to this issue is the integration of logging and seismic techniques which may provide accurate information for prediction of sweet spots, thereby guiding horizontal well deployment and wellbore trajectory design.
In this paper, vertical shale gas sweet spots are firstly defined based on logging data and the relationships between shale properties and elastic parameters are established through rock physics analysis. Next, 3D prestack seismic inversion is conducted to predict TOC content, brittleness, and formation pressure. Finally, sweet spots are located by comprehensive analysis.
Geologic setting of the research area
The Sichuan Basin covering an area of 1,180,000 km2 is among the largest petroliferous basins in China. It has the largest proved reserves and cumulative production of conventional gas (Dai et al., 2001) and the largest proved reserves and yield of shale gas nowadays in China (Zhang et al., 2008).
Structures
The Sichuan Basin is surrounded by Daloushan, Dabashan, Micangshan, and Longmenshan orogenic belts. It includes six tectonic units, that is, Chuandong high-steep fold belt, Chuanbei low-flat fold belt, Chuanxi low-steep fold belt, Chuanzhong flat fold belt, Chuannan low-steep fold belt, and Chuandong high-steep fold belt (Zhai, 1989). W4 block lies in Chuannan low-steep fold belt, as shown in Figure 1.
Regional structures of the study area.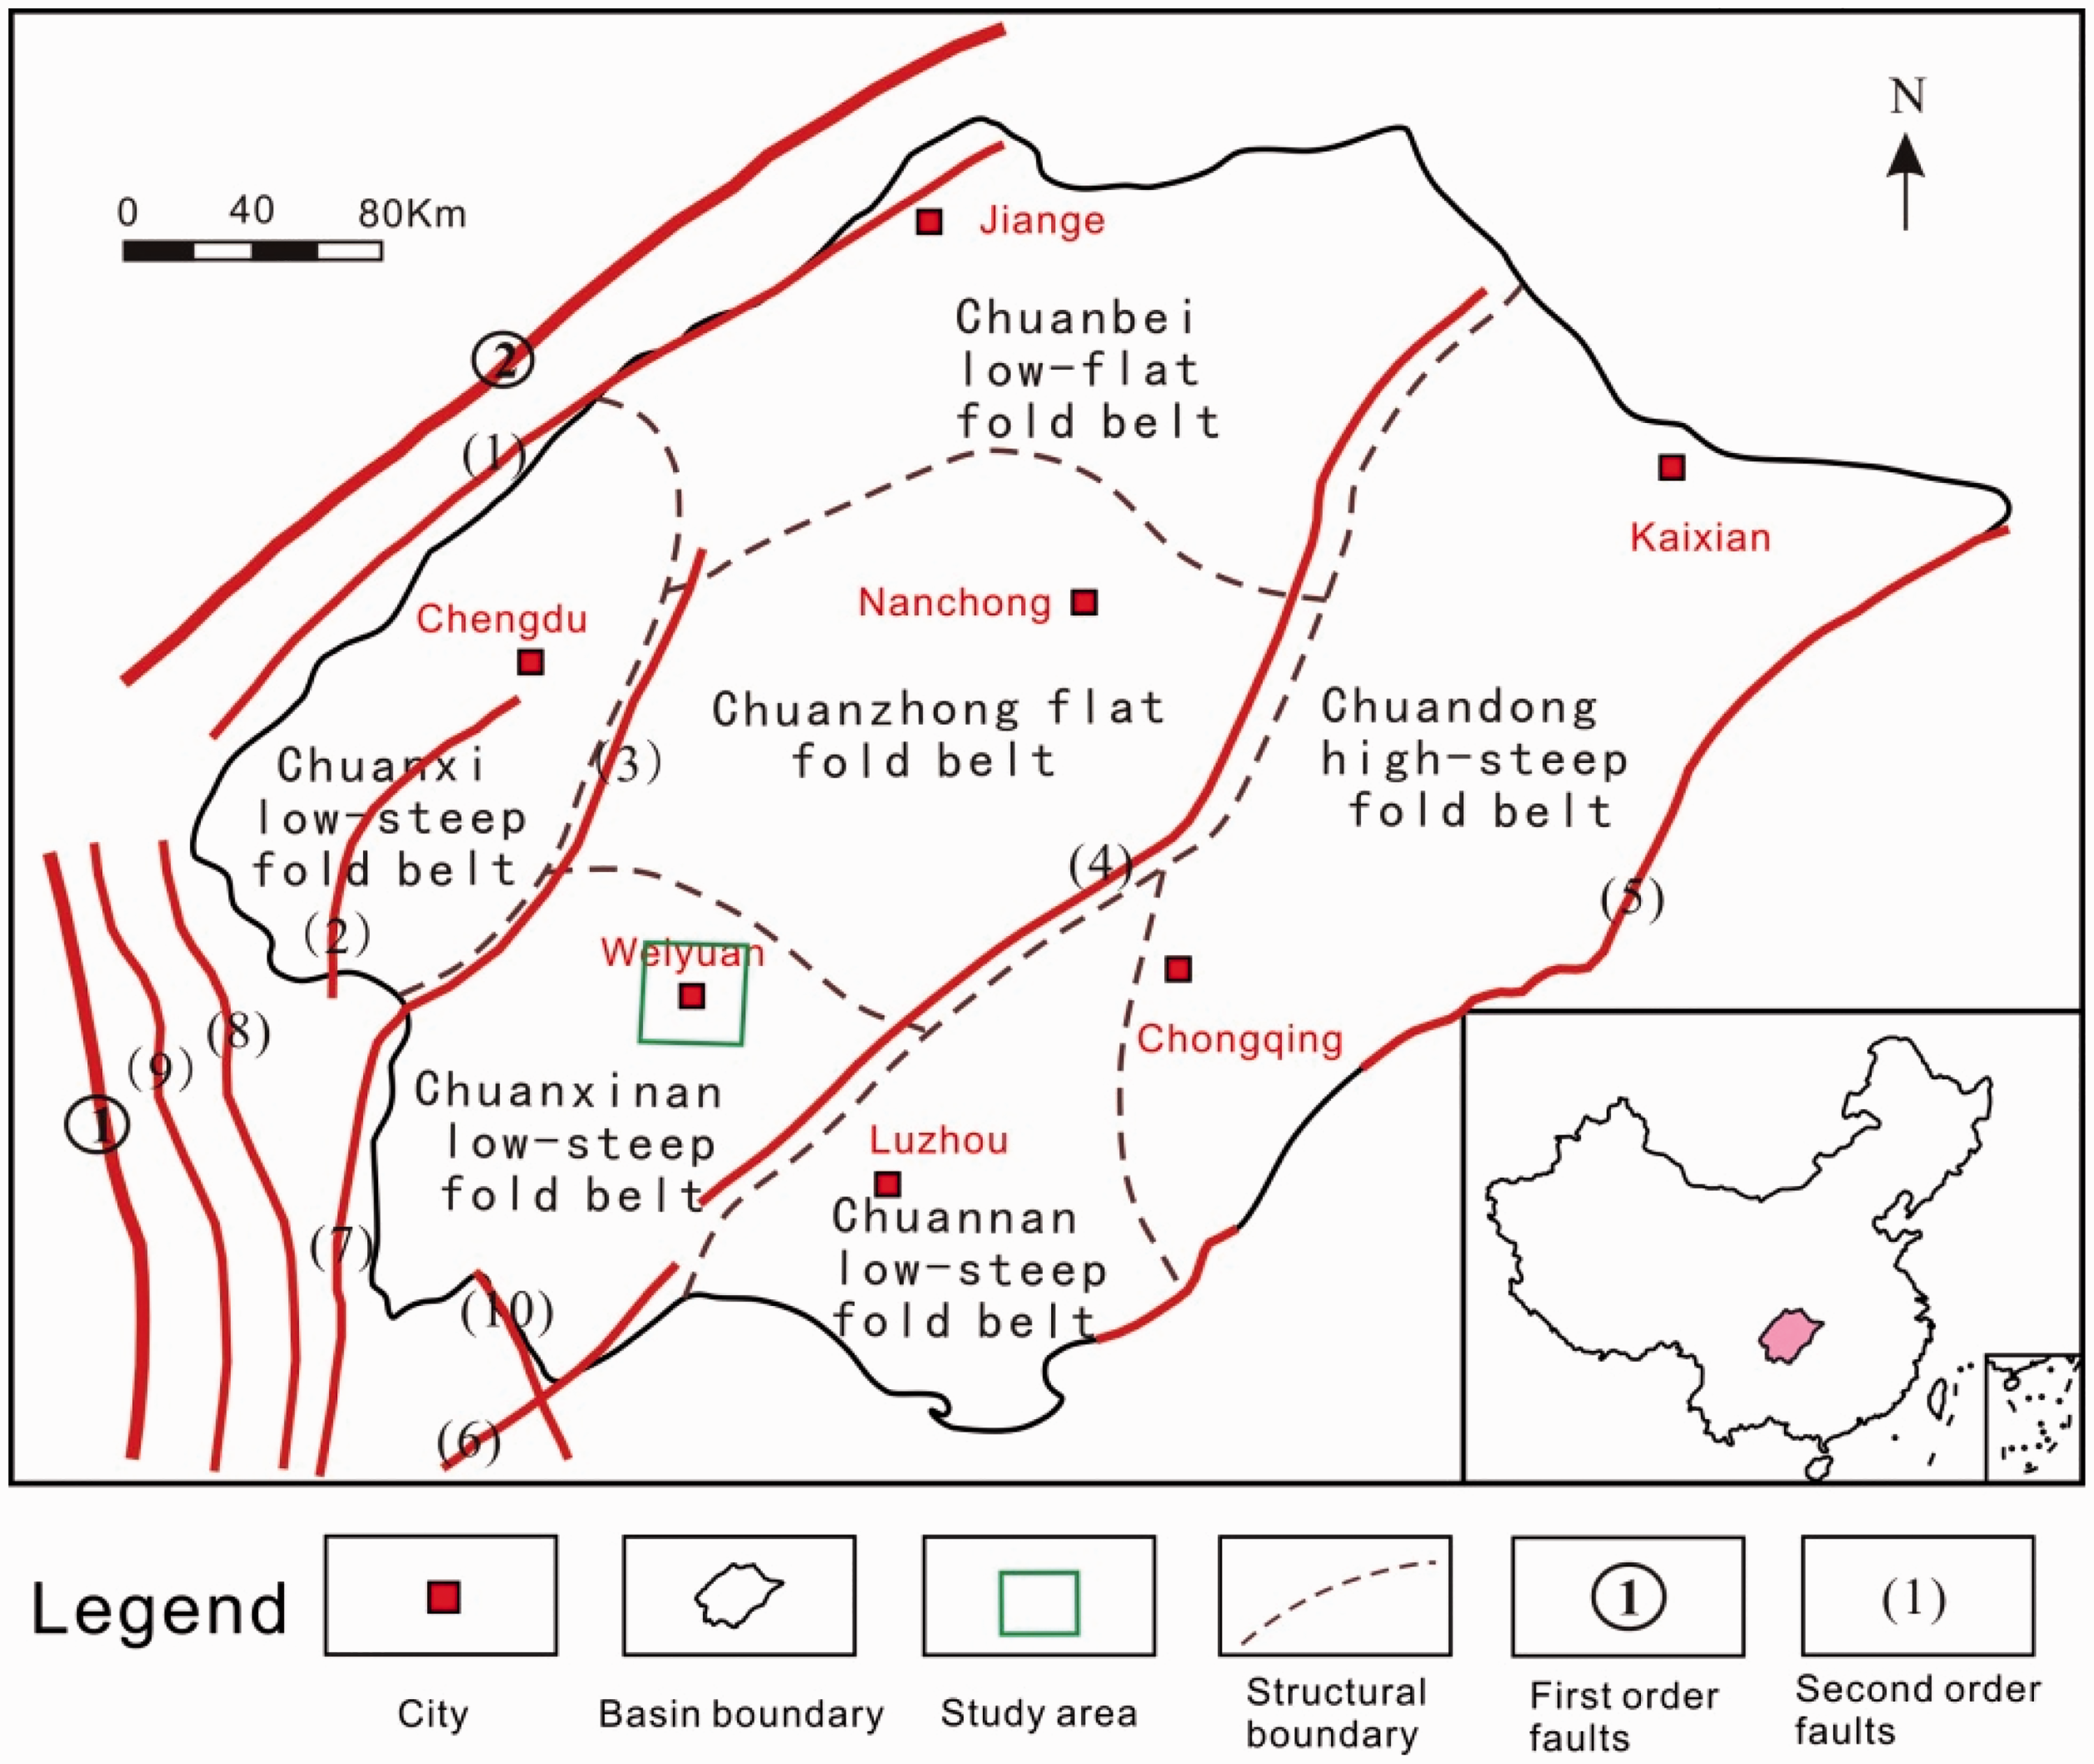
Stratigraphy and shale reservoirs
As per previous studies, the Sichuan Basin is a multi-series petroliferous basin (Zhu et al., 2006) composed of pre-Sinian metamorphic basement, Sinian-Middle Triassic marine carbonate formations, and Late Triassic-Cretaceous continental clastic formations from the bottom up (Zhang et al., 2005, 2010). Two suites of high-quality shale exist in the Lower Cambrian Qiongzhusi Formation and the Lower Silurian Longmaxi (S1l) Formation (Pu, 2008). The latter is discussed in this paper. The Lower Silurian Longmaxi black shale and overlying Shiniulan limestone constitute a good reservoir-seal assemblage (Zhang et al., 2008) as shown in Figure 2 (left). The entire Longmaxi Formation has abundant graptolite of about 500 m thick throughout the block, which is a product of deepwater shelf deposition (Chen et al., 2016) indicating a strong reducing environment. The Longmaxi Formation comprises two distinctive sections. The upper section, that is, the Long2 Member, is composed of some siliceous streaks and limestone with TOC content less than 2%. The lower section, that is, the Long1 Member, encompasses carbonaceous shale and black shale rich in lamellae, with TOC content higher than 2%. The Long1 Member is subdivided into two submembers as per TOC content, that is, Long1-1 (40 m thick, with TOC content mostly above 3%) and Long1-2 (with TOC content mostly around 2%), as shown in Figure 2 (right).
Stratigraphic column of Lower Paleozoic (left) and Lithologic column of Longmaxi Formation (right). 1: sandstone; 2: shale; 3: loess; 4: limestone; 5: muddy limestone; 6: marlite; 7: source rock; 8: reservoir rock; 9: caprock; 10: carbonaceous shale; 11: carbonaceous and siliceous shale; 12: siliceous shale; 13: marlite; 14: coquina.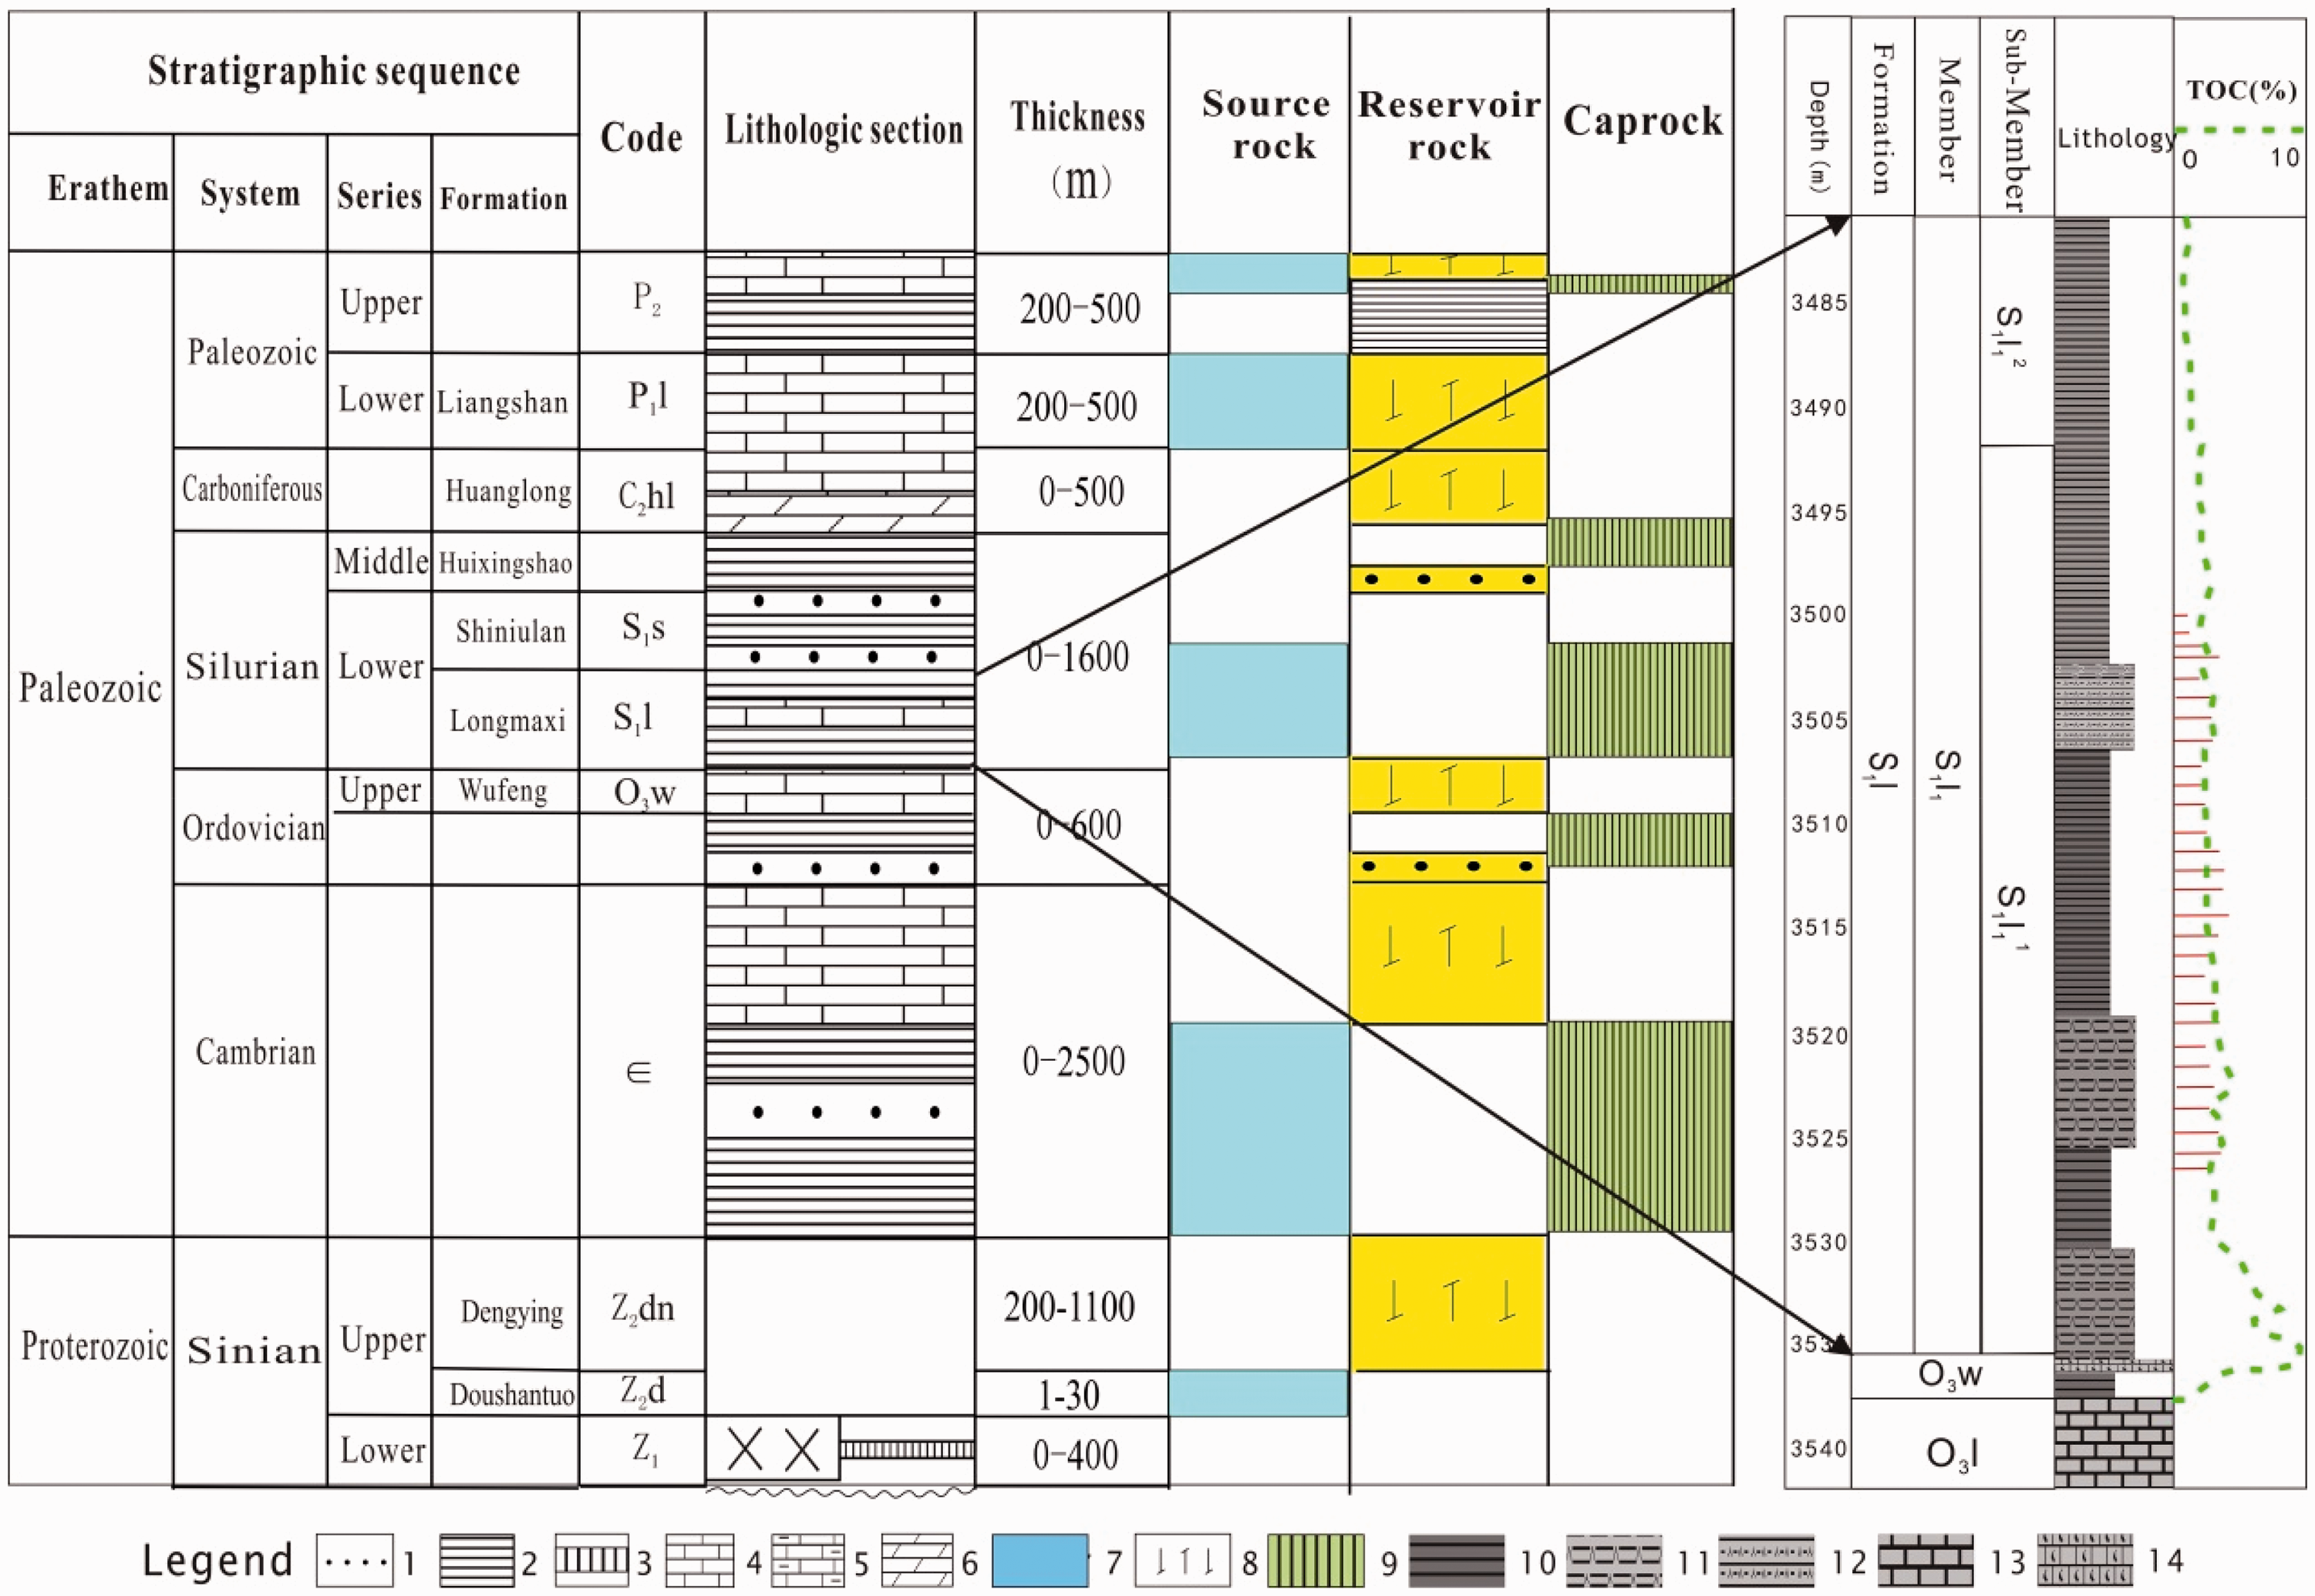
Data and methods
Research route
Logging and seismic data are combined for prediction of sweet spots in core prospects. First, structure interpretation is conducted with seismic data and logging data interpretation and, rock physics analysis are carried out. In this way, petrophysical properties of shale reservoirs are defined and vertical distribution of sweet spots is determined. Besides, elastic parameters sensitive to shale properties are defined and the relationships between shale properties and elastic parameters are established. Then, prestack seismic inversion is conducted with both logging and seismic data to predict geologic and engineering sweet spots. Finally, the prediction results are integrated to locate sweet spots for shale gas development, thereby guiding the horizontal well deployment and wellbore trajectory design. The workflow is shown in Figure 3.
Sweet spots prediction workflow using logging and 3D seismic data.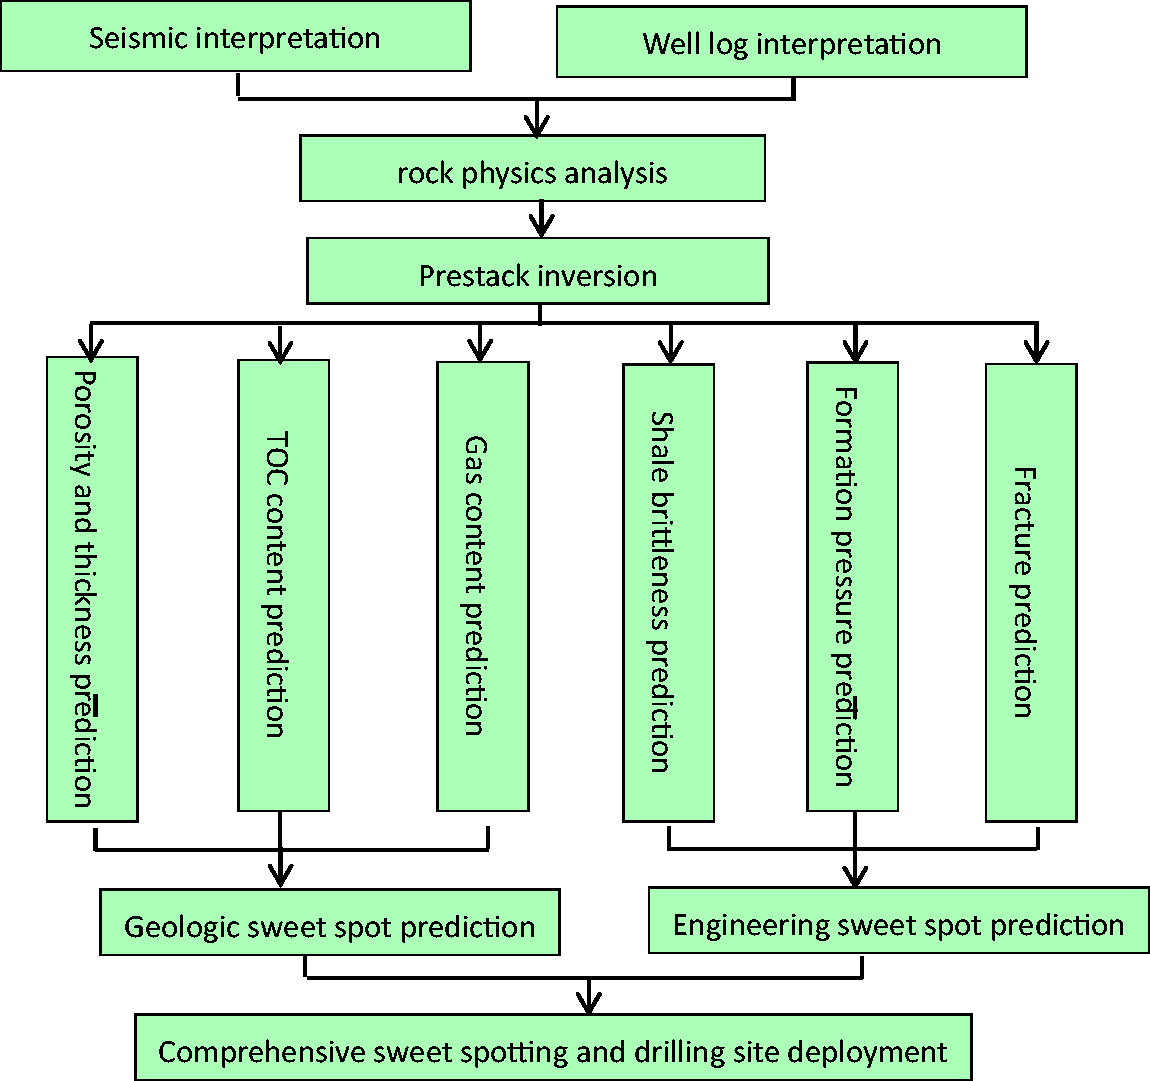
Well longing and seismic data
Only one exploratory well, W4, has a complete data set including gamma rays (GR), density, P-wave, and S-wave logs in this block. The 3D seismic area is 200 km2 with inline in E-W direction and crossline in N-S direction. Figure 4(a) shows the top structure map of the shale formation and well sites in this seismic area. Figure 4(b) shows log curves and interpreted profiles of Longmaxi Young’s modulus, Poisson’s ratio, porosity, TOC content, gas content, brittleness, for Well W4. Three horizons, that is, Longmaxi top, Longmaxi bottom, and Long1-1 bottom, were interpreted on seismic data.
(a) Structure map and well sites in the study area. (b) Well log interpretation of W4.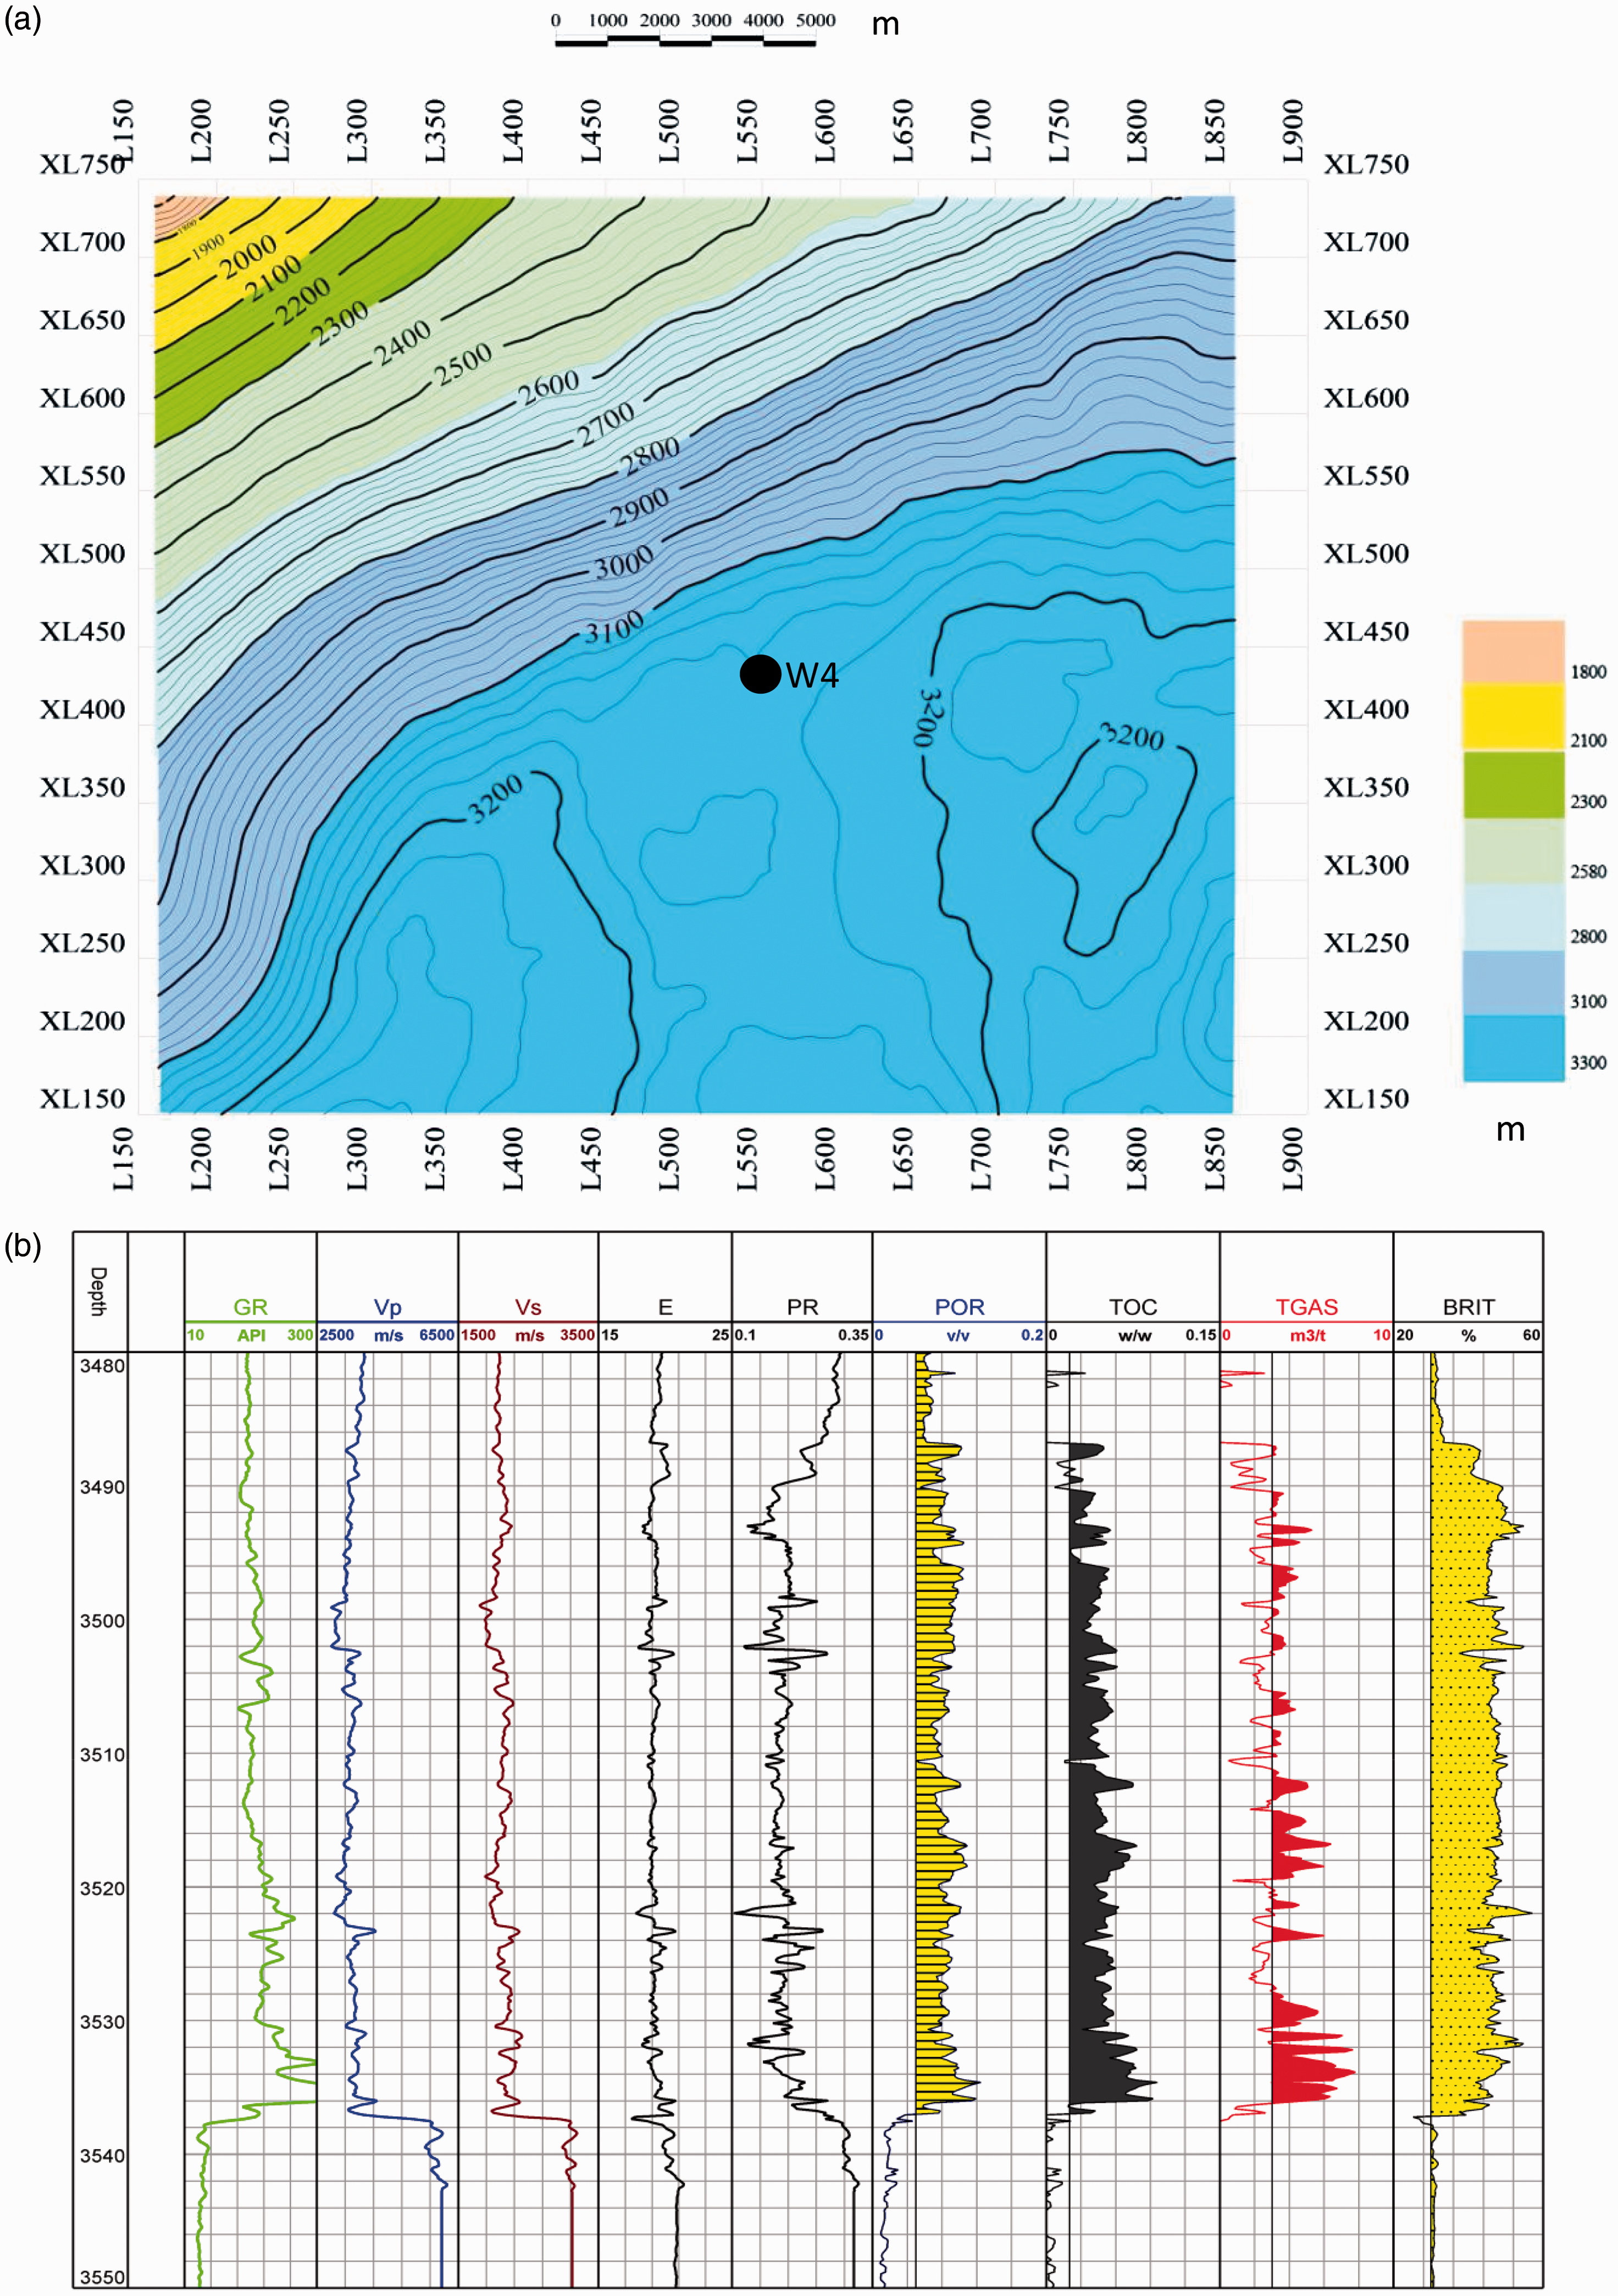
Rock physics analysis methods
Rock physics analysis aims at locating shale gas sweet spots and defining shale petrophysical properties using logging data. All the elastic parameters ware calculated from P-velocity, S-velocity, and density logs. The key evaluation parameters like porosity, TOC, and so on were also calculated from the logging datas. The elastic parameters sensitive to TOC content, gas content, and other evaluation parameters were determined by cross plotting. The quantitative relationships between sensitive elastic parameters and evaluation parameters were established by statistical methods.
The volumes of elastic parameters, including P-velocity, S-velocity, and others, can be derived from prestack simultaneous inversion on seismic gathers (Arcangelo et al., 2011; DE Miller, 2012). The parameters were then used to estimate shale properties.
Prediction methods of geologic sweet spots
We used reservoir thickness, TOC content, and gas content to predict geologic sweet spots. According to the study of Caineng Zou et al., a Longmaxi shale sweet spot is defined to be a region thicker than 30 m with TOC content above 3% and gas content above 2.5 m3/t (Zou et al., 2016). This definition was used as a standard in shale prediction in Sichuan Basin.
Shale porosity and thickness were predicted with inverted P-velocity by the relationships derived from rock physics analyses. The relationship between porosity and P-velocity shown in Figure 4 is formulated as follows. And the porosity in Figure 4 was obtained by the composition of shale mineral, based on the formula proposed by Sondergeld (2010).

The correlation coefficient between P-velocity
TOC content is among the most crucial parameters for shale reservoir evaluation. It may be tested by lab experiments or interpreted with log data. Lateral distribution of TOC content may only be predicted with seismic data. The correlation coefficient between TOC and density (DEN) is 94%. TOC content volume was estimated as a function of density in accordance with the linear relationship derived from rock physics analysis.

Gas content was predicted by multivariate stepwise regression, which method was first proposed by Hampson et al. (2001). In this method, the objective parameter is estimated by statistical methods with a portfolio of attributes. In our study, the objective parameter was single-well gas content, which was estimated by multivariate stepwise regression. The best agents used in the regression were determined by error analyses from a population of candidates derived from seismic inversion.
Prediction methods of engineering sweet spots
An engineering sweet spot was defined to be a region with high brittleness, high formation pressure, and abundant natural fractures (Aybar, 2015; Oppermann, 2012).
Shale gas production is closely related to shale brittleness. Brittleness evaluation is technically significant to well drilling and fracturing design. Rock brittleness is generally estimated with brittle mineral contents or rock mechanical parameters. The latter was used in this study. As per the study of a mass of experiments and production data by Goodway et al. (2010; Khandelwal, 2016). Rock brittleness increases with Young’s modulus and decreases with Poisson’s ratio. Young’s modulus and Poisson’s ratio were normalized and then averaged to calculate brittleness index. The formula is shown as follows.

Formation pressure is the driving force for hydrocarbon migration and accumulation. Both high-pressure and low-pressure shale gas reservoirs have been found in North America. But so far, as per production data in China, almost all shale gas reservoirs sweet spots in China have excessive pressure (Zou et al., 2016). Thus, pressure prediction is significant to prediction of shale gas sweet spots. Formation pressure is usually predicted through equivalent depth, compaction equilibrium equation, Eaton method, and Fillippone method on the assumption that interval velocity drop is caused by overpressure. Fillippone method (Dutta, 2006; Fillippone, 1982; Opara, 2011) was employed in this study because this method with few parameters is more practical for a prospect area with insufficient well data.

Fracture detection is usually accomplished by curvature, coherence, and variance. Curvature attribute was used here to predict natural fractures. Subsurface formations bendunder stress to generate cracks. The larger the stress the more intense the distortion is; thus more fractures occur. Therefore, the attribute of curvature is more sensitive to fractures than coherence and variance. A region with large curvature may be more fractured with relatively high porosity. This technique has ever been used in shale fracture prediction with good results (Lee Hunt et al., 2011; Marfurt and Chopra, 2006).
Sweet spot evaluation
Comprehensive sweet spot evaluation is based on the prediction of geologic sweet spots and engineering sweet spots. A geologic sweet spot coinciding with engineering sweet spot is ranked to be of Grade-I. A geologic or engineering sweet spot aloneis ranked to be of Grade-II. Other regions are excluded from sweet spots.
Result and discussion
Geologic sweet spots
Porosity and thickness prediction
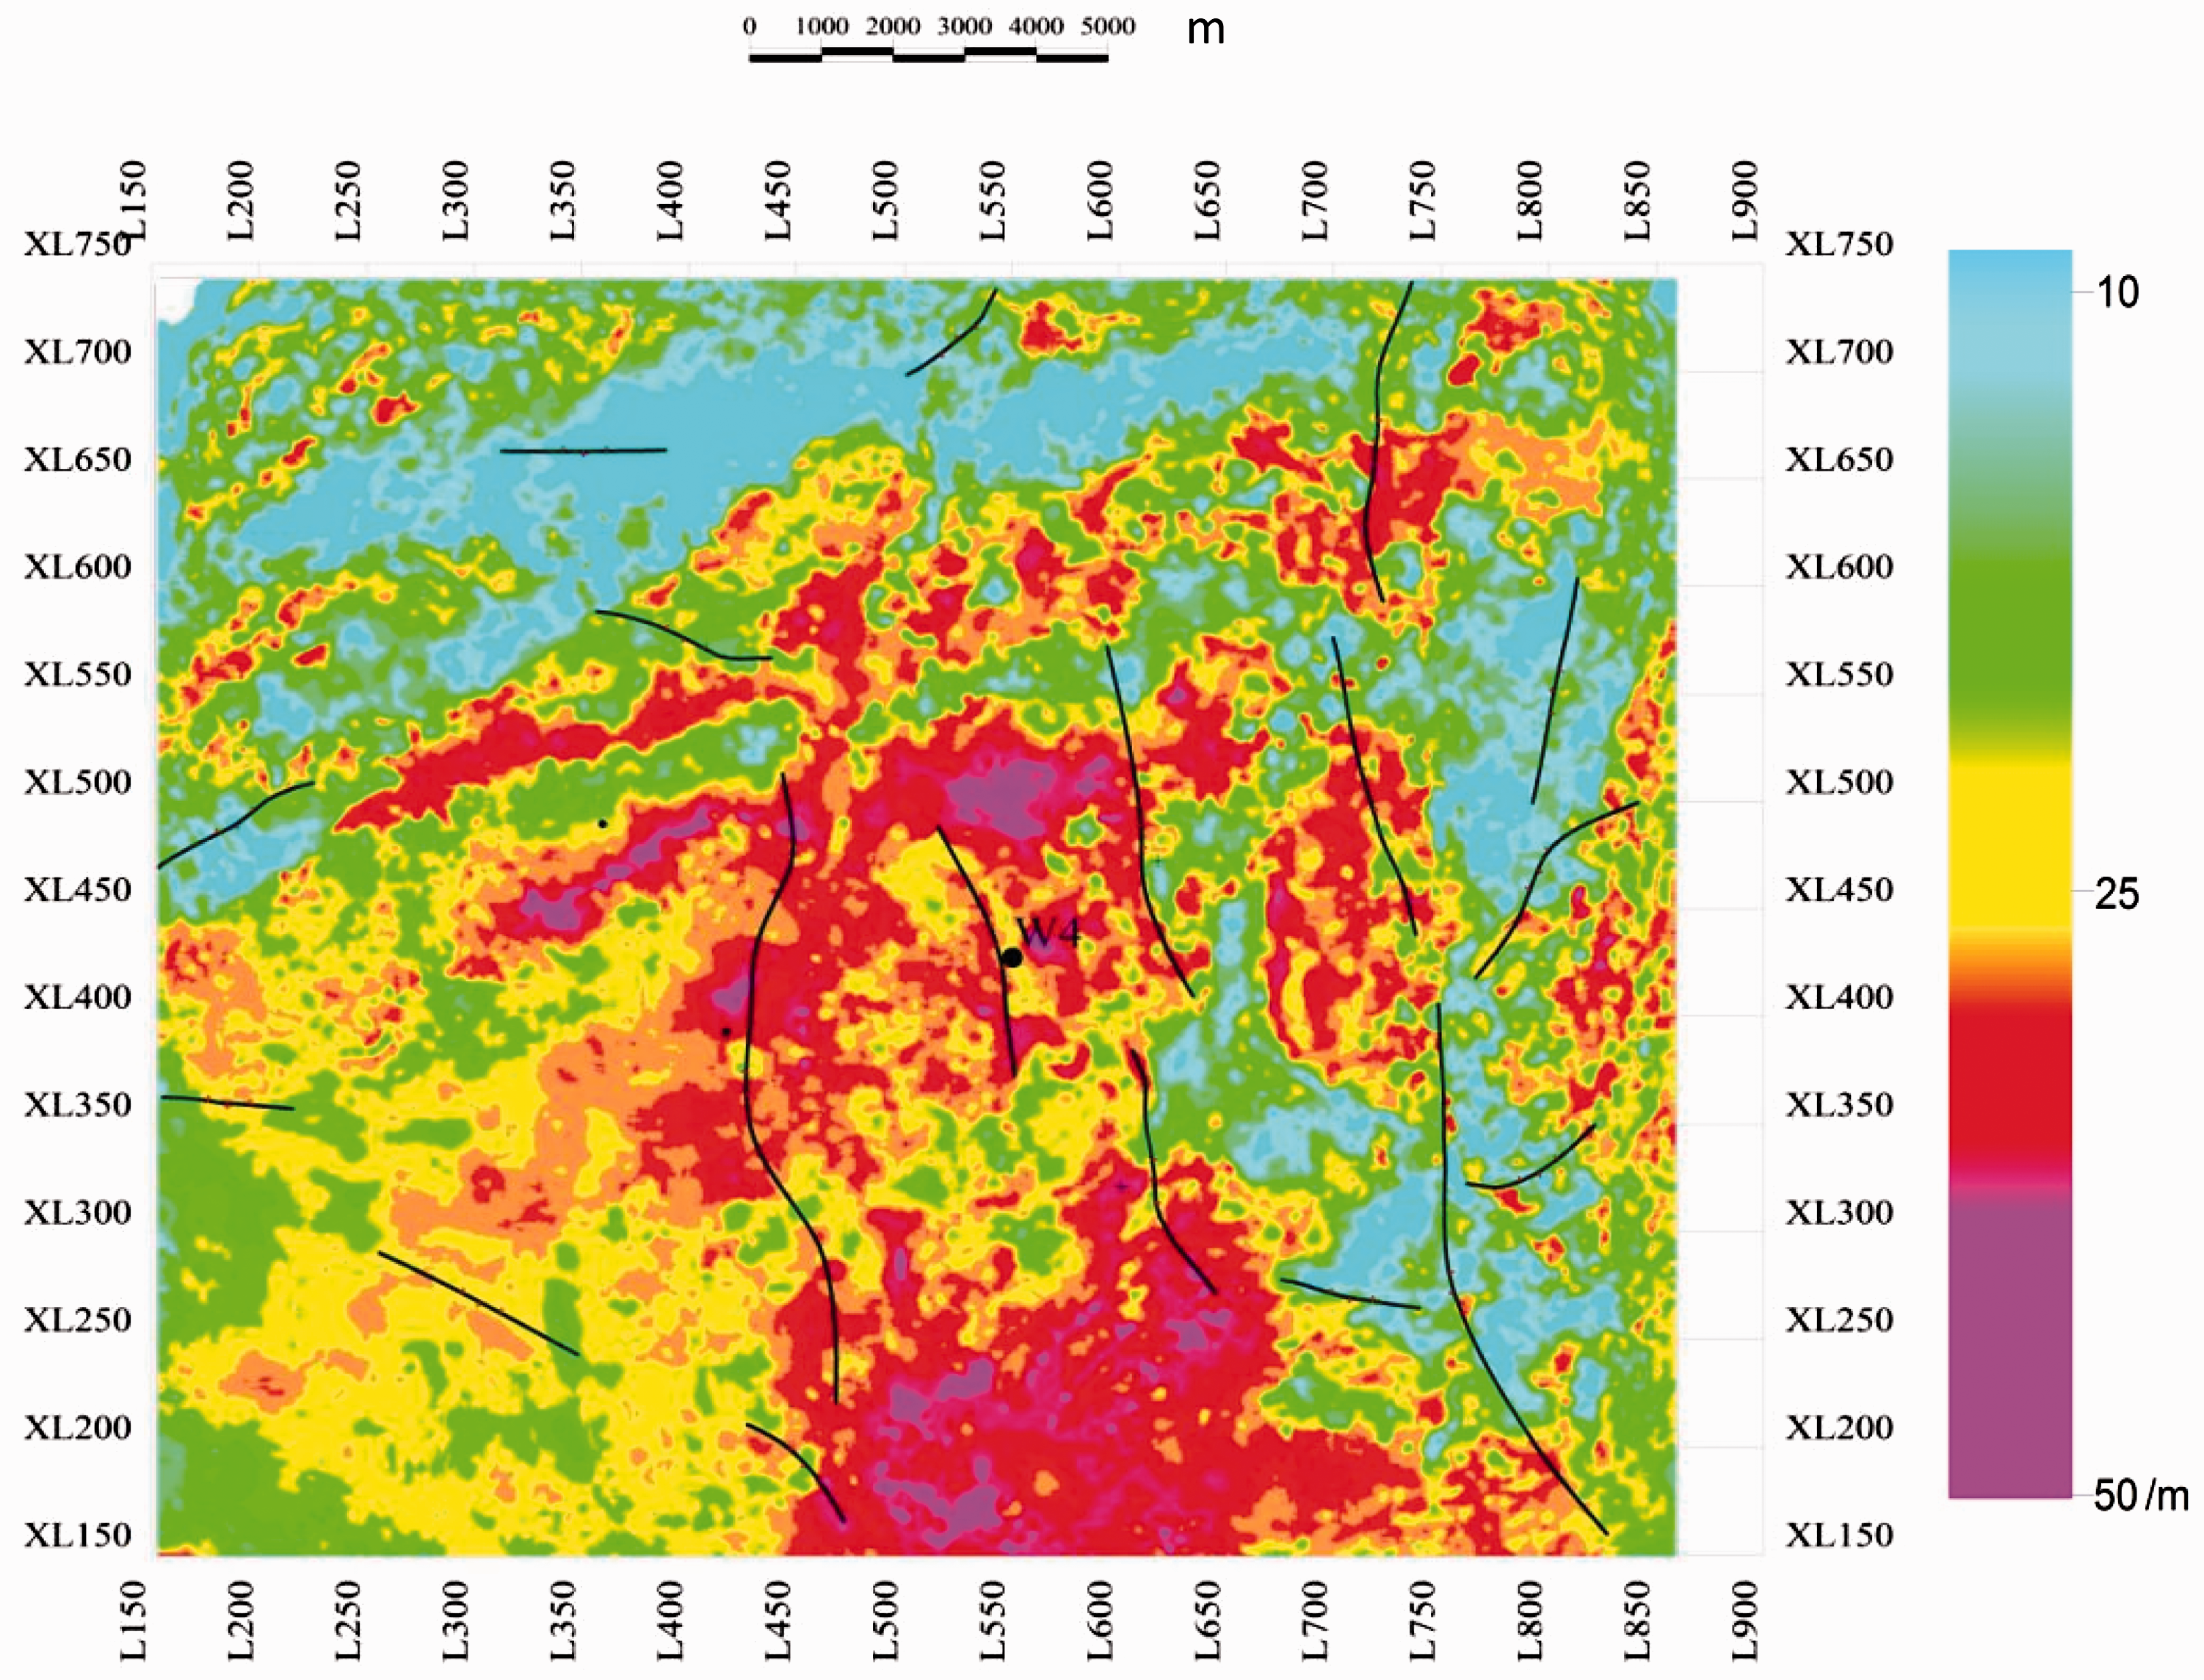
Shale porosity was calculated as the function of P-velocity, as shown in Figure 5(b). A high correlation coefficient was observed between P-velocity and porosity; P-velocity decreases with porosity increase. Figure 5(a) shows an inverted velocity profile, the interval of interest with low velocity is plotted in green. The target interval has a P-velocity between 3000 and 3500 m/s. And the bottom of the interval has lower velocity than the top. Figure 5(c) shows a section of seismic porosity converted from inverted velocity; the curve inserted is log interpreted porosity. The results of seismic prediction and logging interpretation show an acceptable goodness of fit. Seismic porosity is higher than 3% in the entire interval of interest and higher than 8% at the bottom. As per the lower bound of 3% for high-quality shale reservoirs (Han et al., 2015), the sampling points with the porosity above 3% within window between Long1-1 top and Long1-1 bottom were included in the calculation of reservoir thickness, as shown in Figure 6. The regions with high average porosity are plotted in warm colors and the regions with low porosity plotted in cool colors. As shown in the figure, high-quality reservoir thickness is mostly above 30 m and locally above 50 m.
(a) P-velocity inversed from seismic data (the black curve is log interpreted porosity of well W4). (b) Relationship between P-velocity and porosity of Longmaxi shale. (c) Porosity converted from prestack inverted P-velocity (the black curve is log interpreted porosity of well W4). Reservoir thickness map of Long11 shale.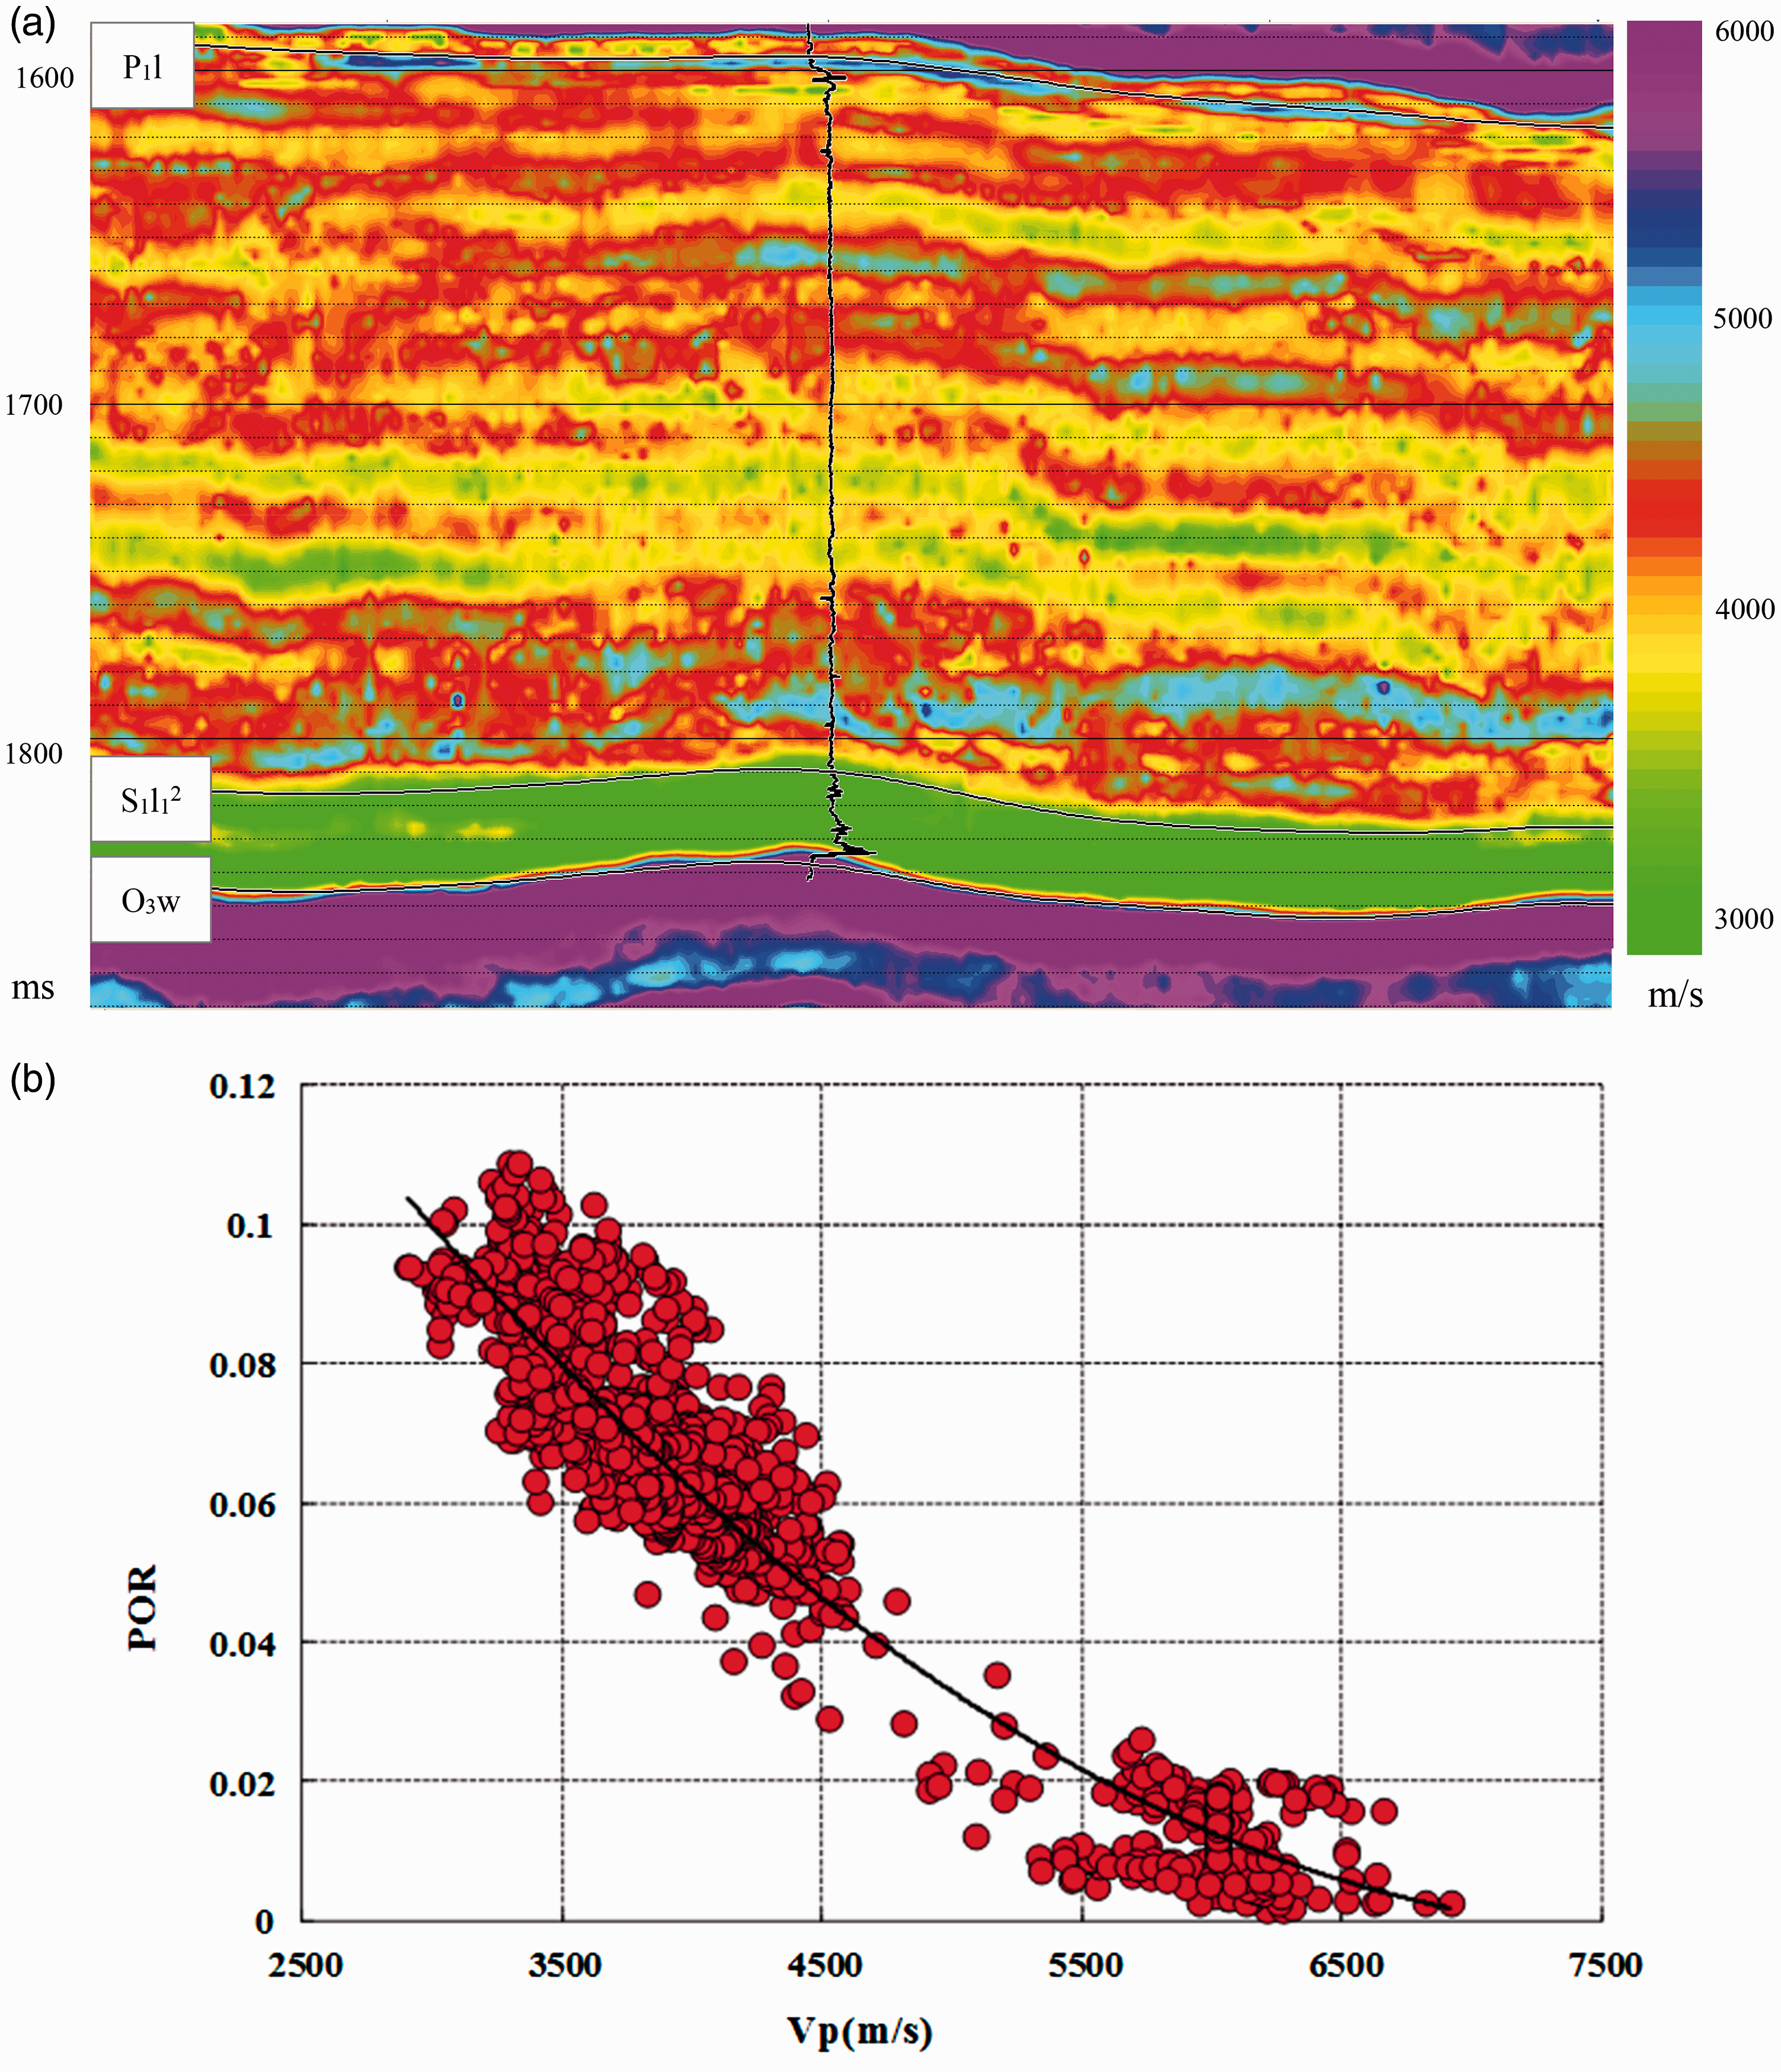
TOC content prediction
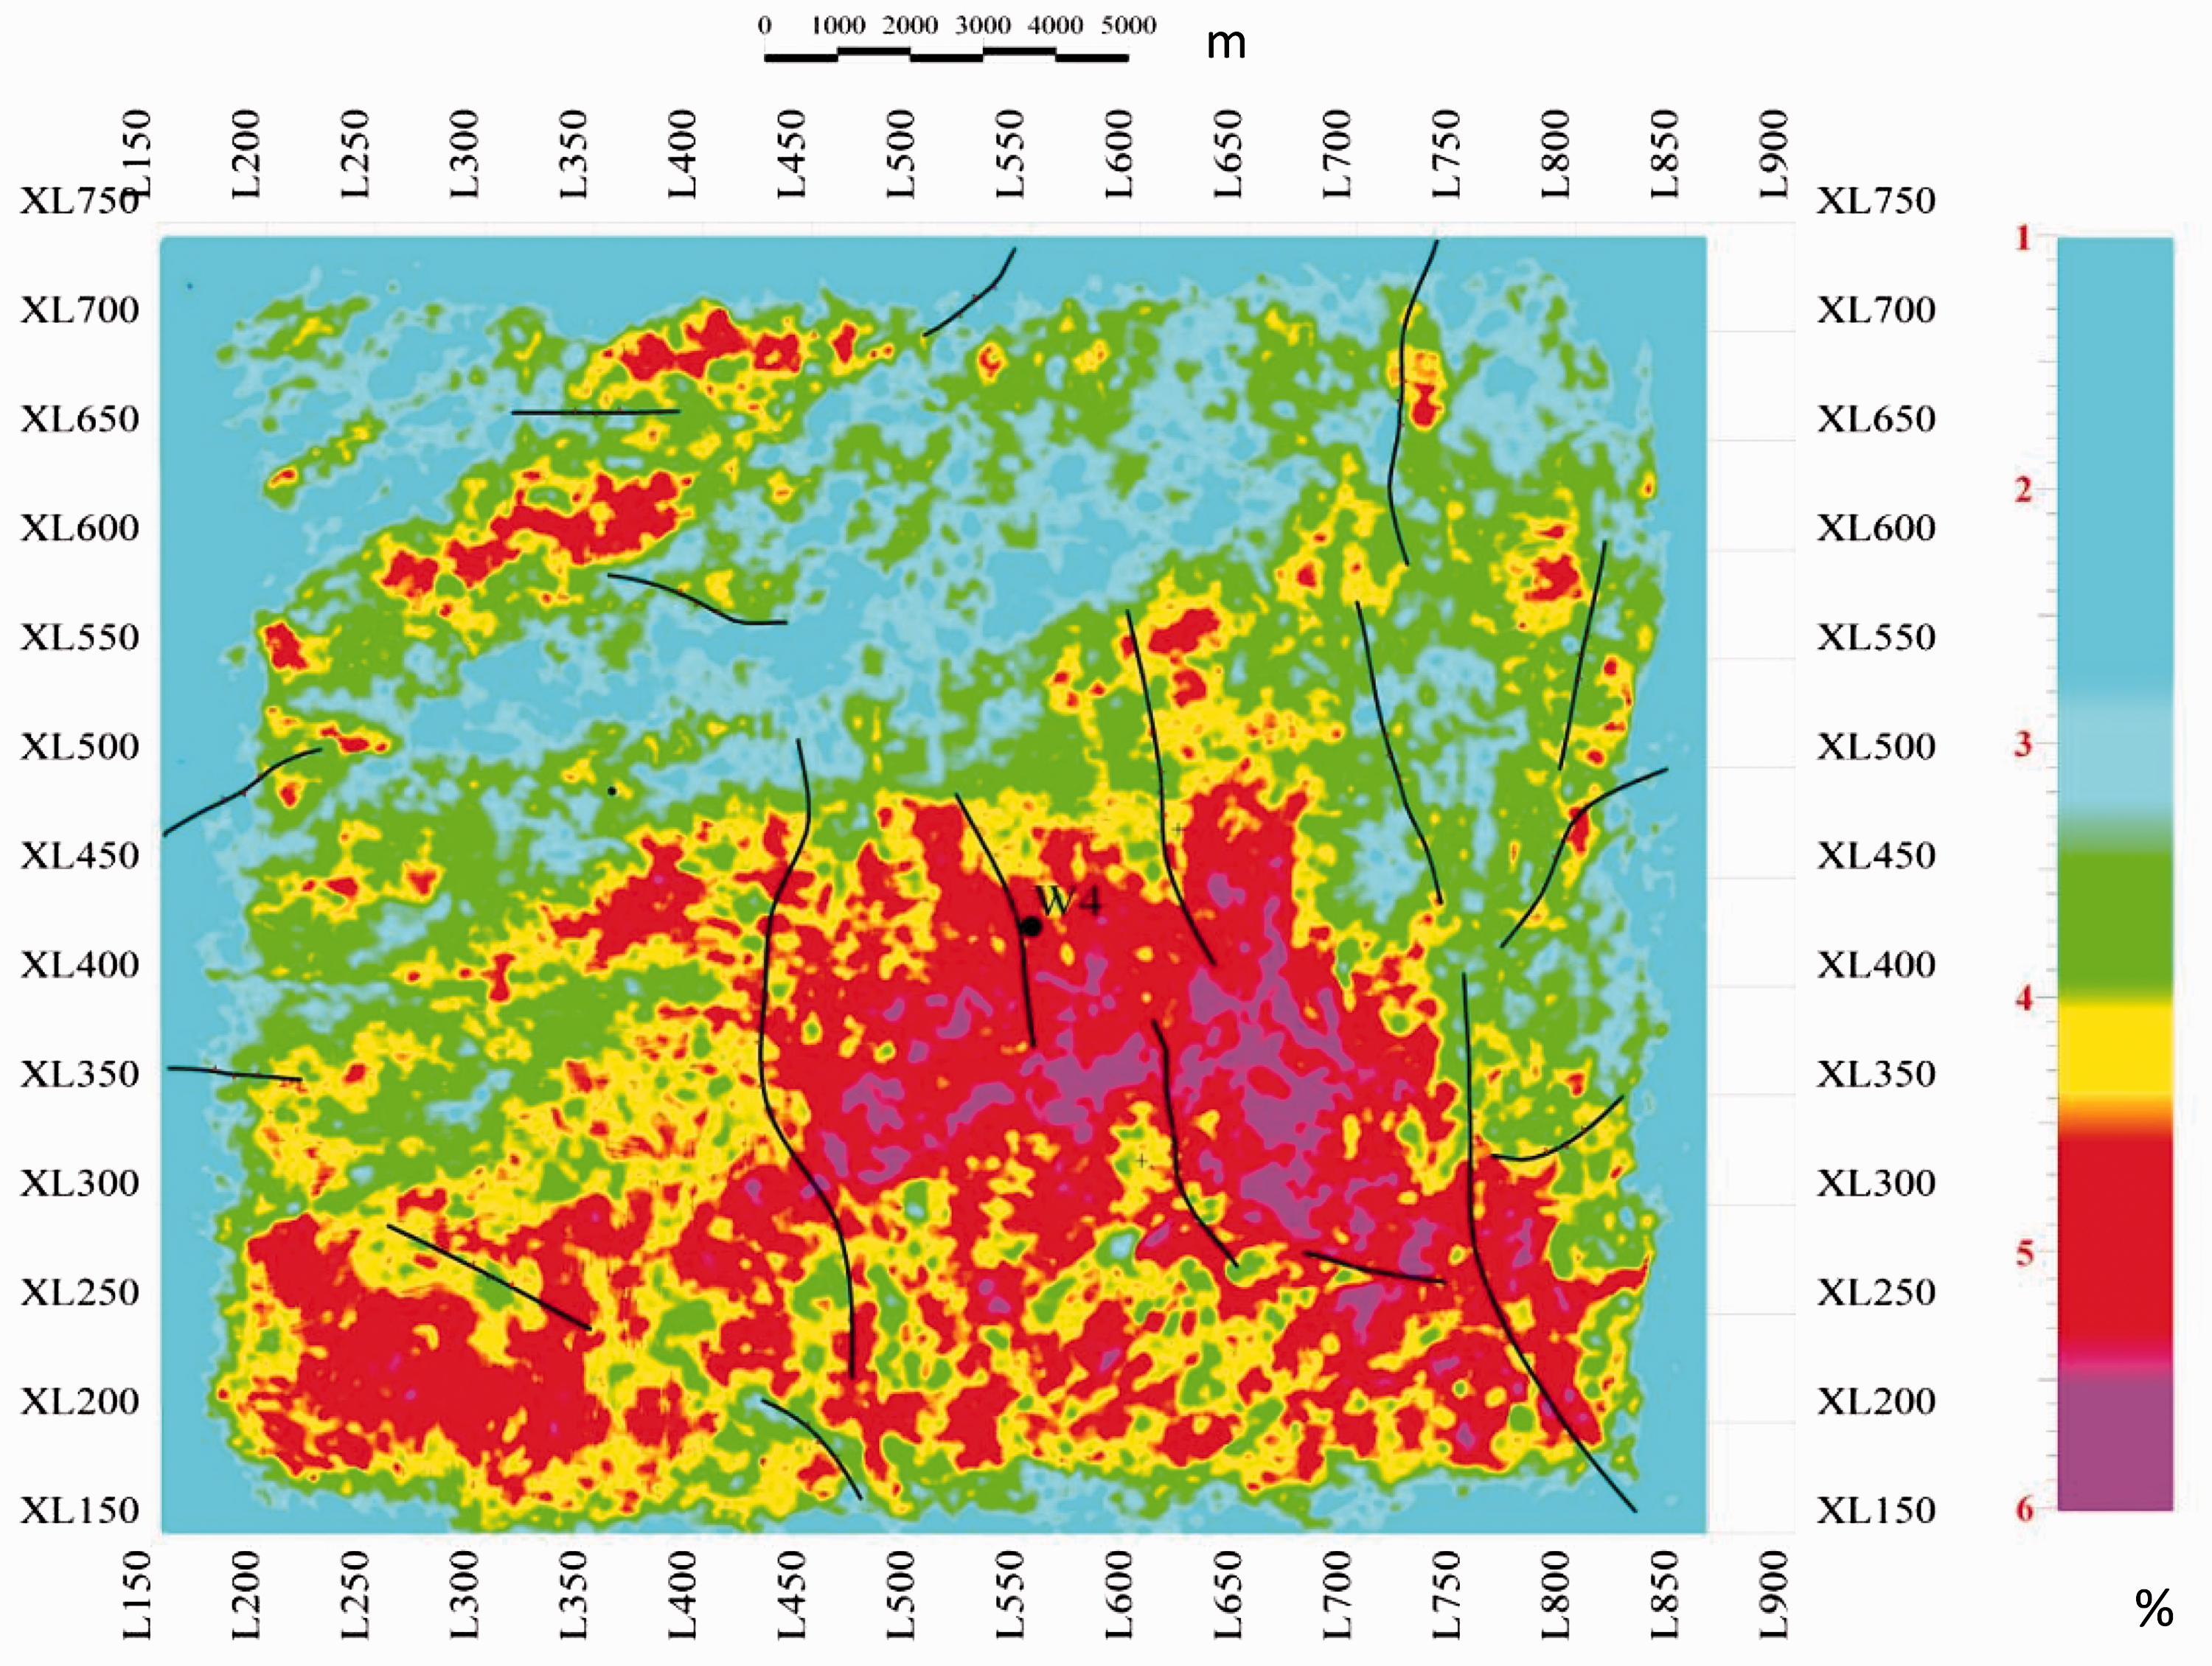
As per rock physics analysis, there is a good linear correlation between TOC content and density. Thus, we converted density data from prestack inversion into TOC content, as shown in Figure 7. Figure 7(a) shows a density profile across Well W4; low density, which is related to high TOC content, occurs at the bottom of the Longmaxi Formation. The targer interval has a low density value between 2.35 and 2.45 g/cm3. Figure 7(b) shows the linear correlation between TOC content and density log. Figure 7(c) shows a section of TOC content converted from density data shown in Figure 7(a). TOC content at the bottom of the Longmaxi Formation is above 3% and reaches 7% at most. Figure 8 shows average TOC content distribution in the block. Red regions with average TOC content of 5% may be promising for shale gas production.
(a) Density inversed from seismic data (the black curve is log interpreted TOC content of well W4). (b Relationship between Density and TOC content of Longmaxi shale. (c) TOC content converted from prestack inverted Density (the black curve is log interpreted TOC content of well W4). Average TOC content map of Long11 shale.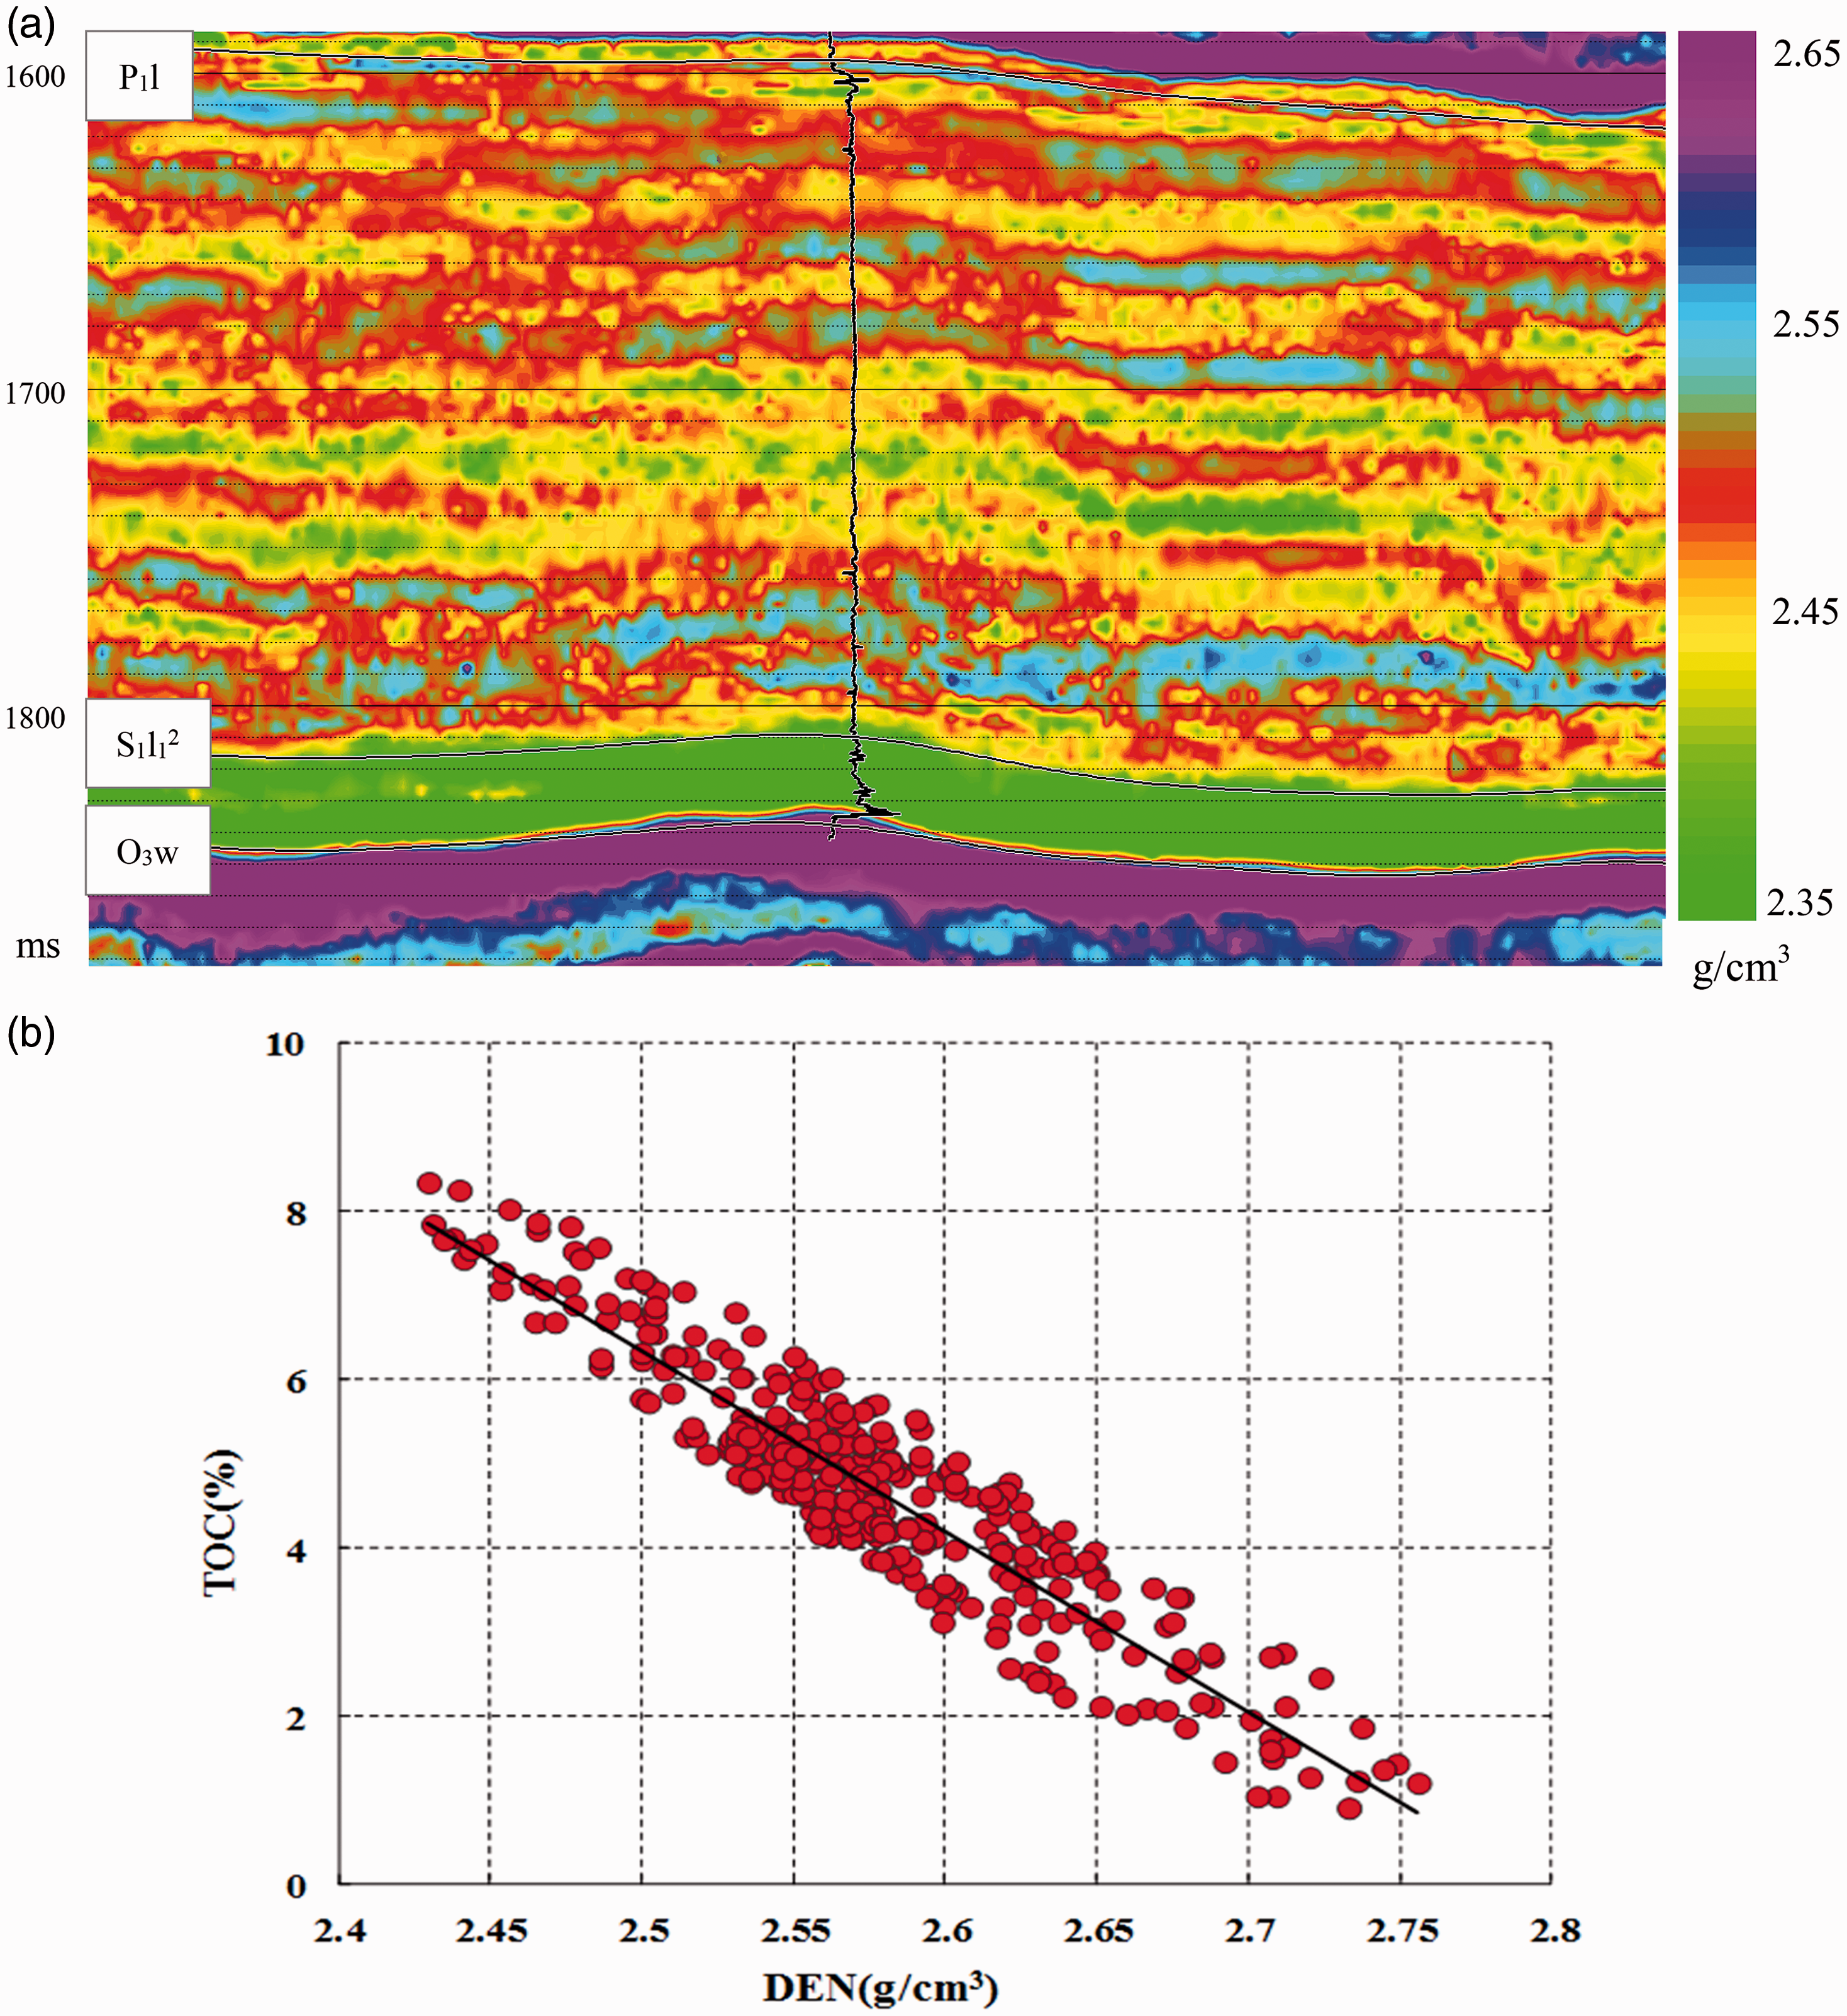
Gas content prediction
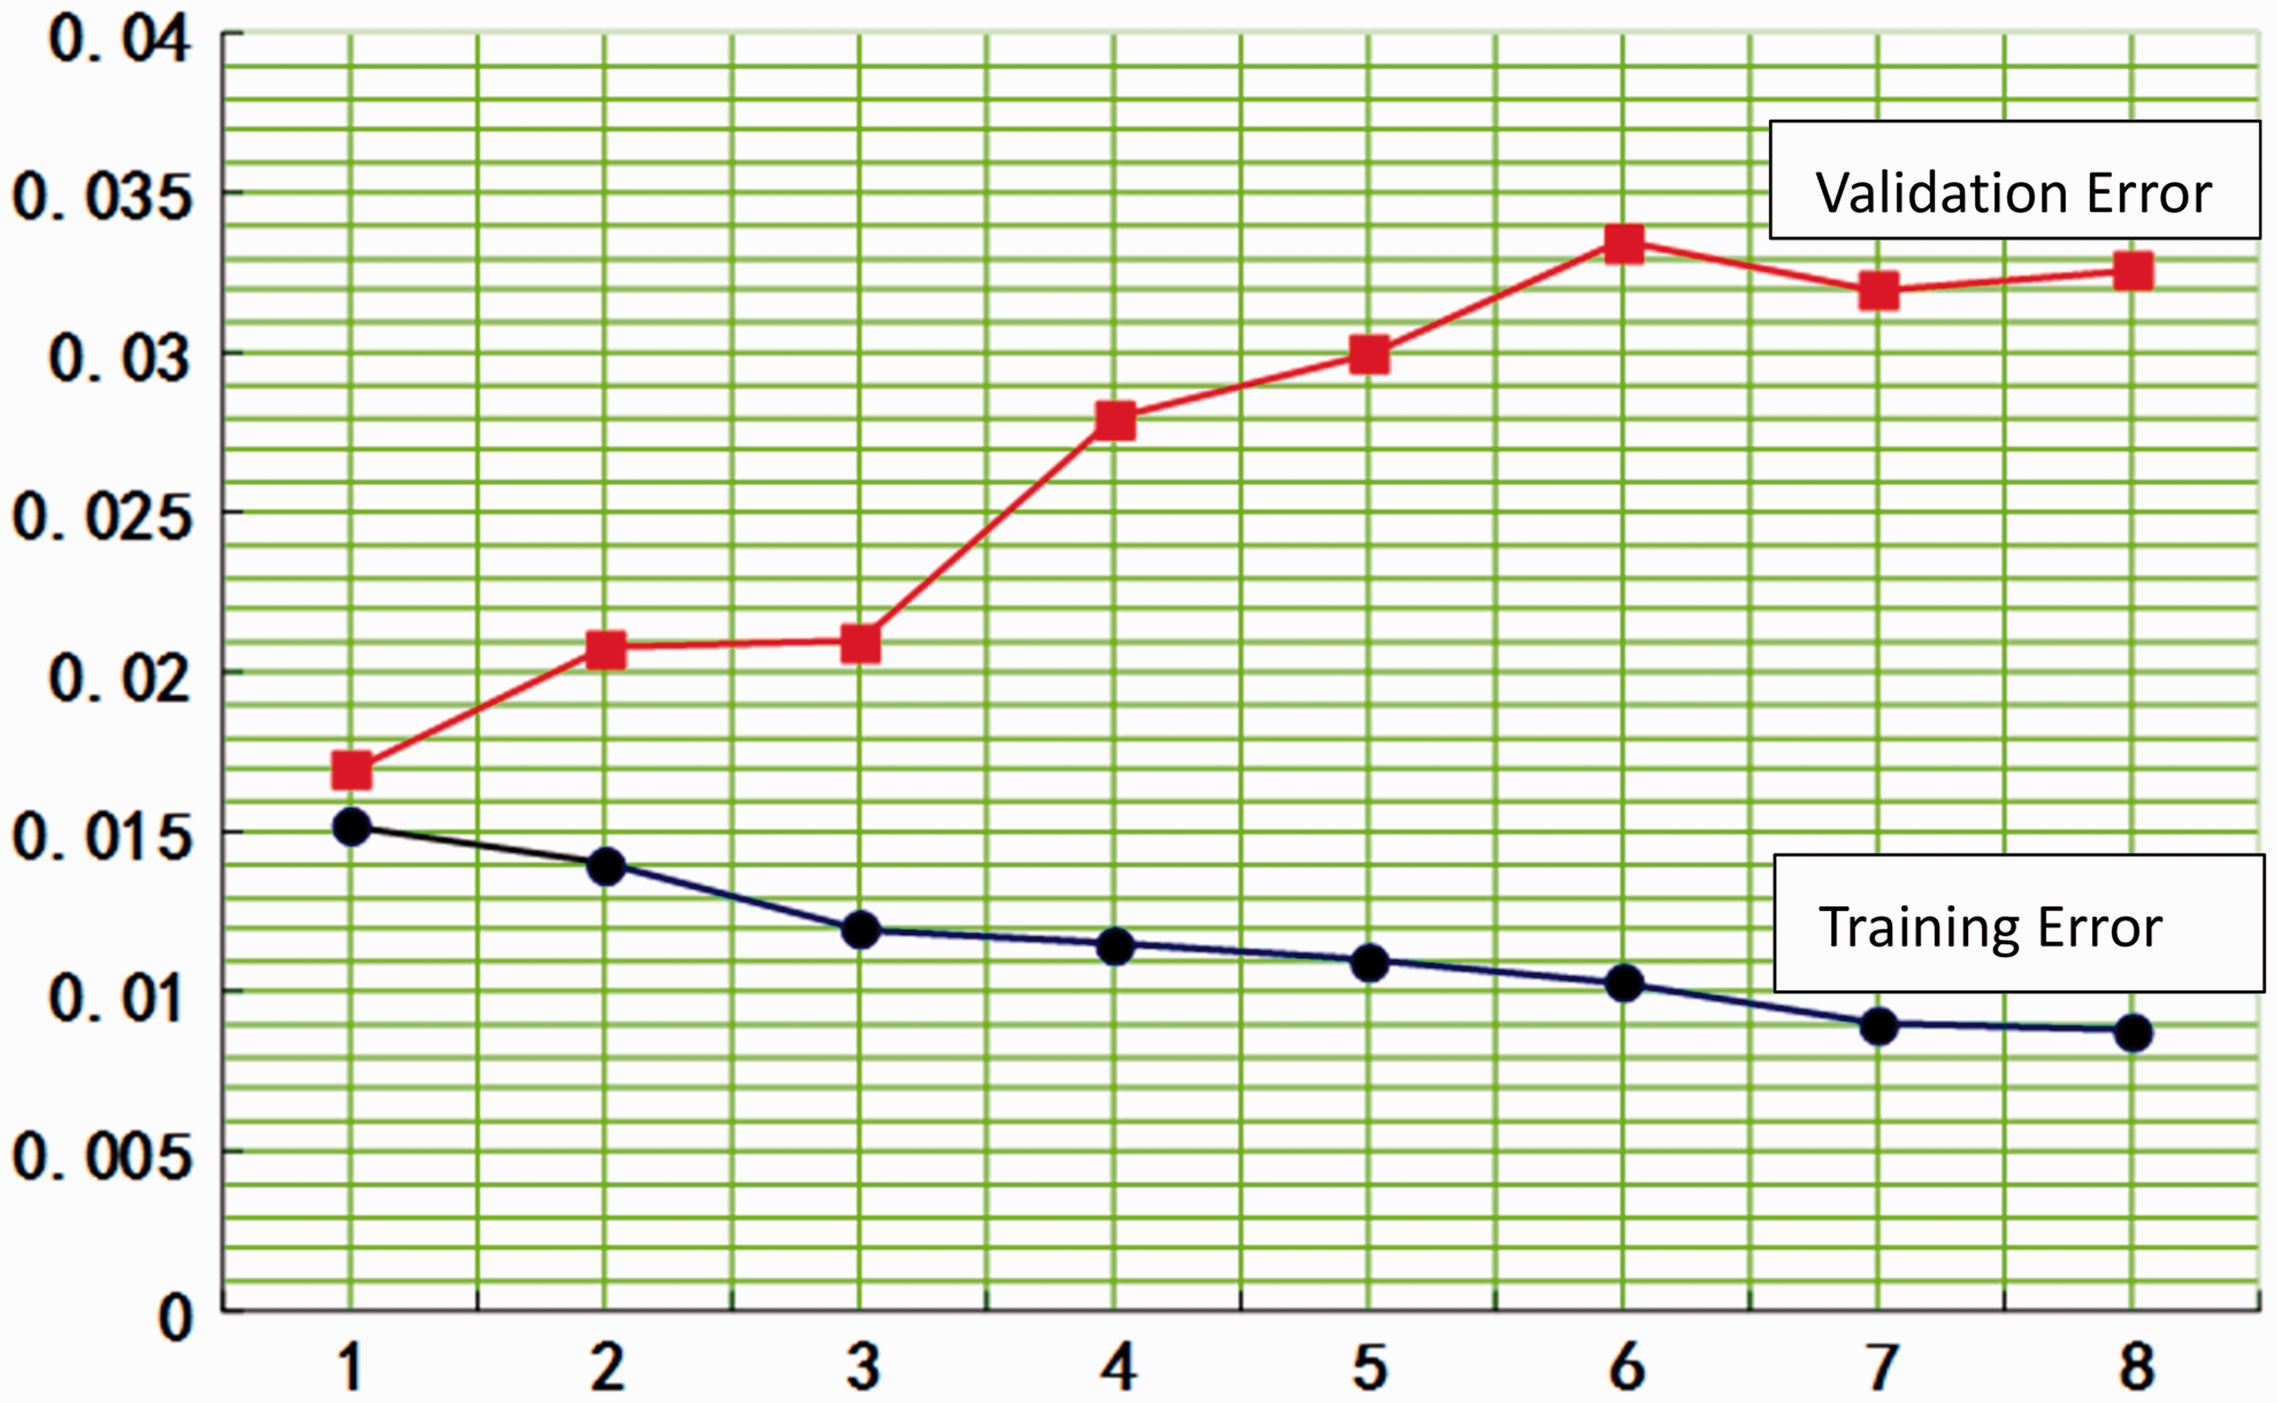
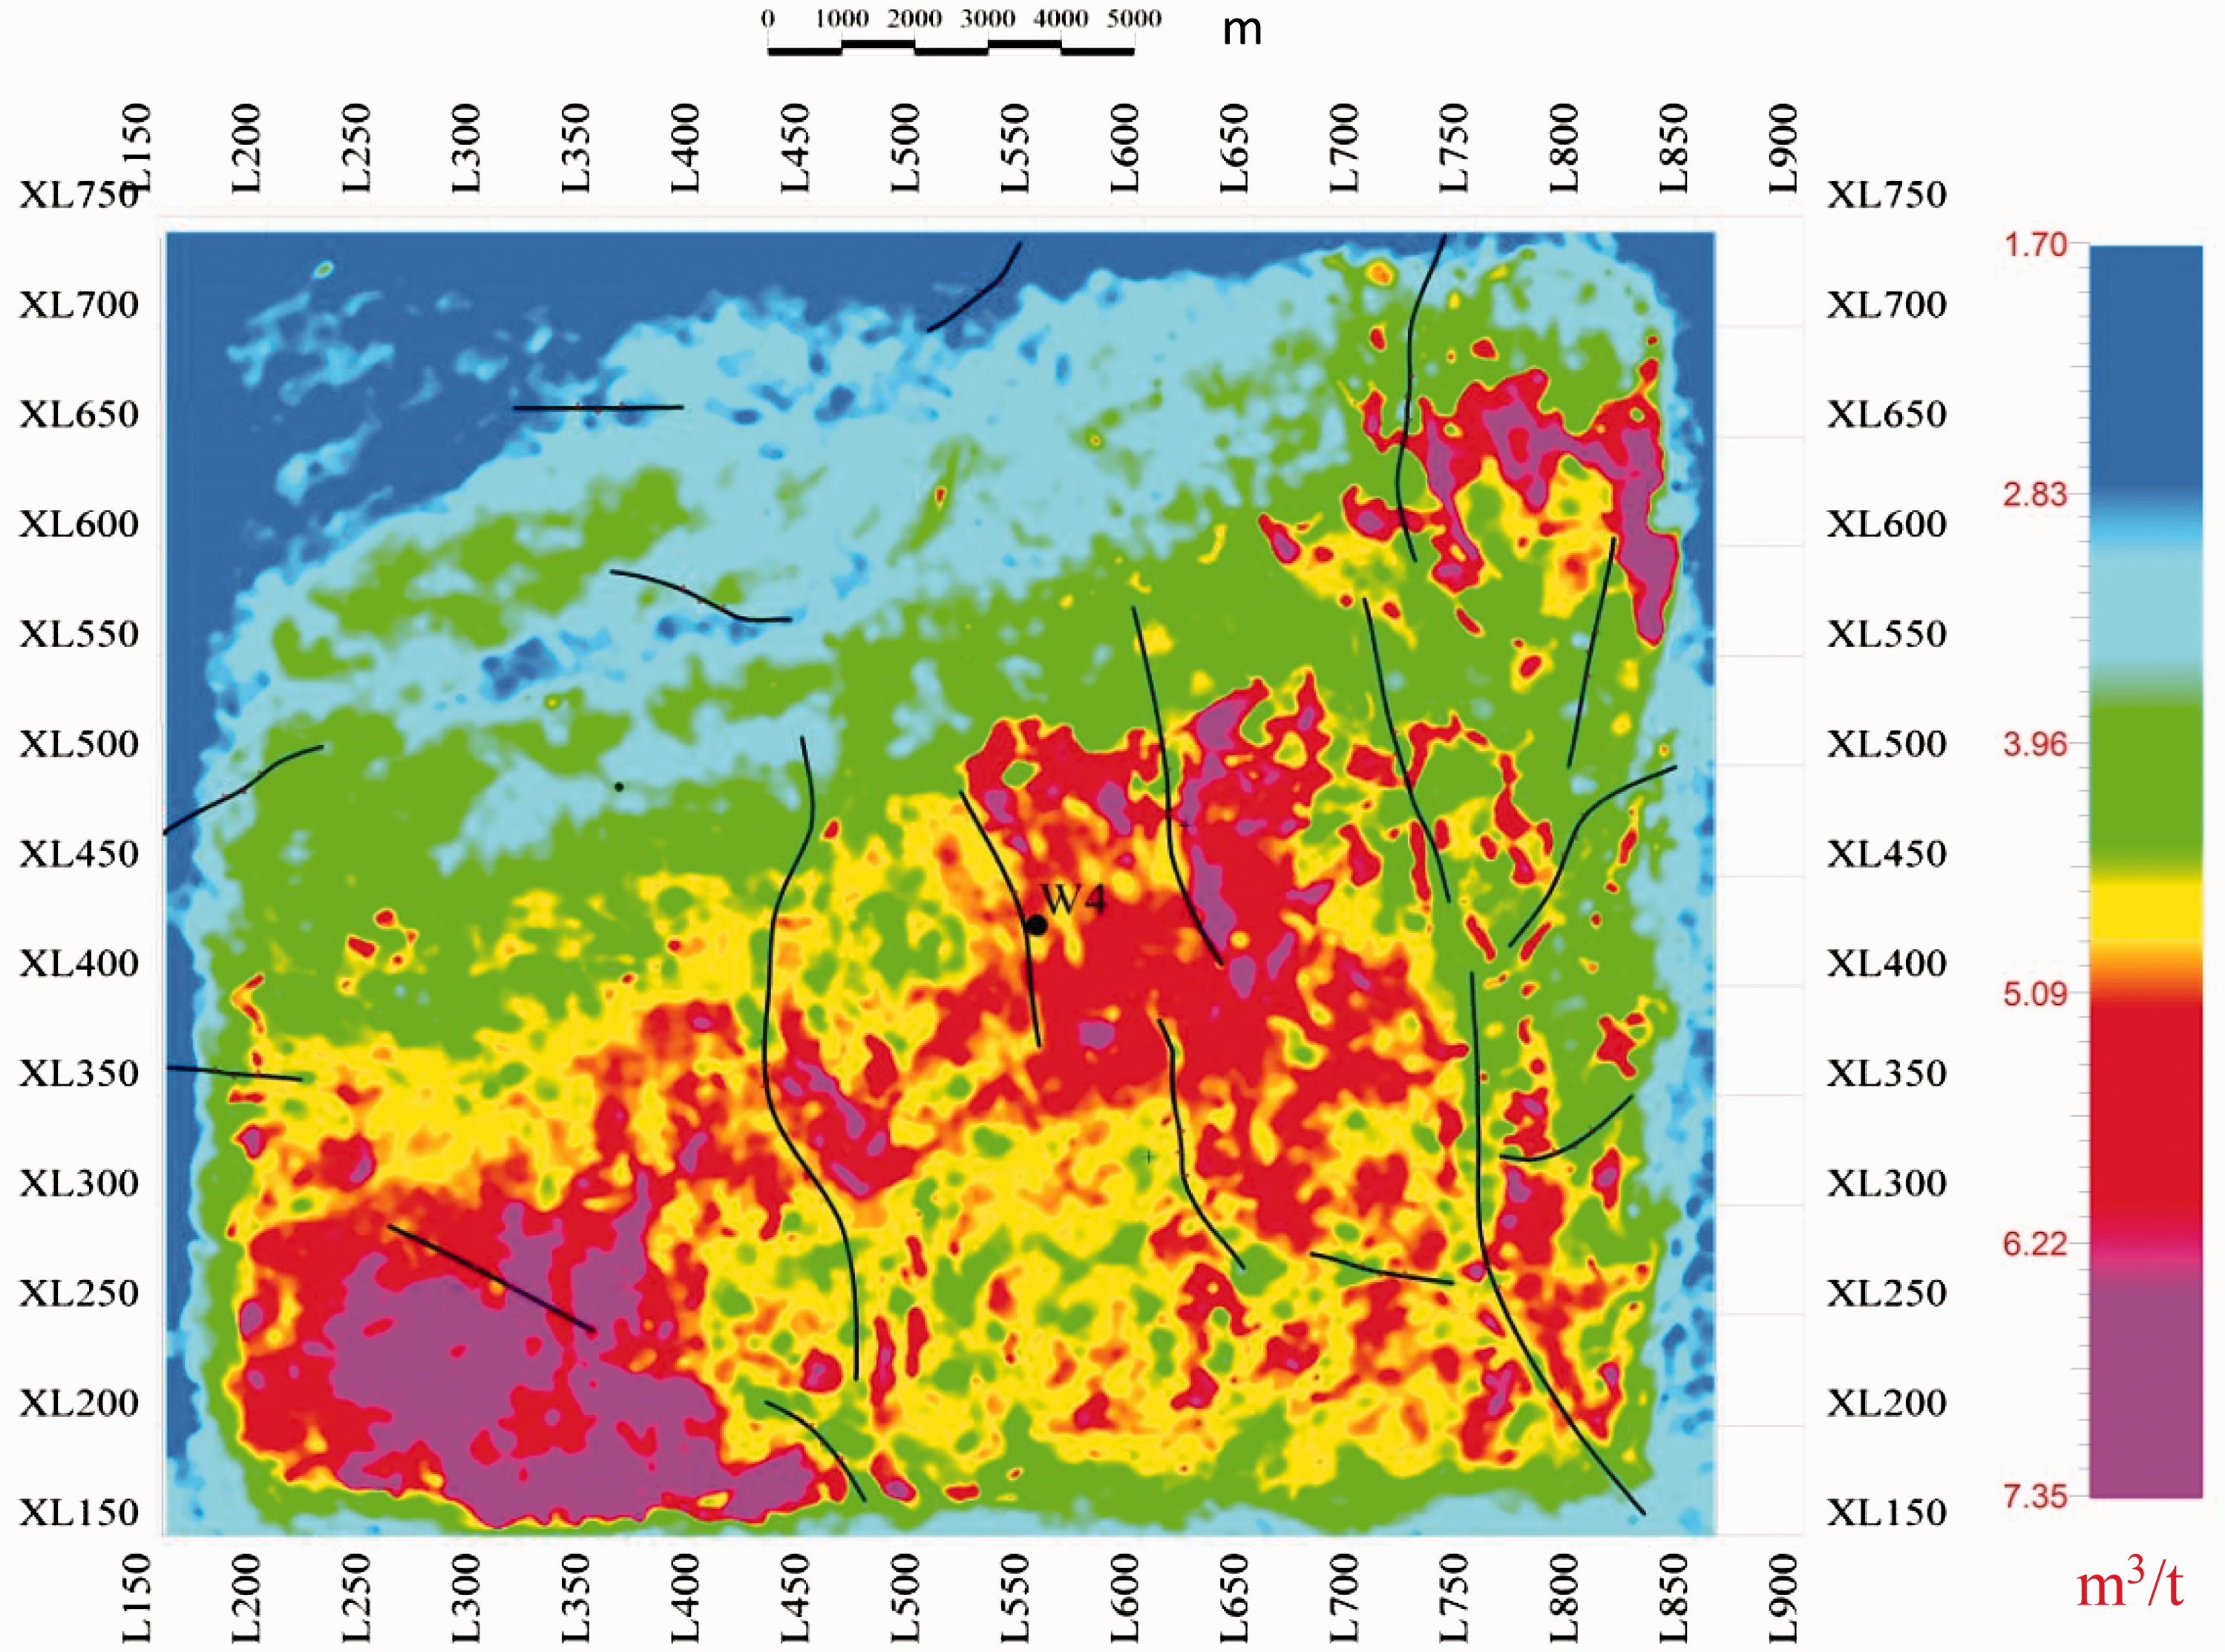
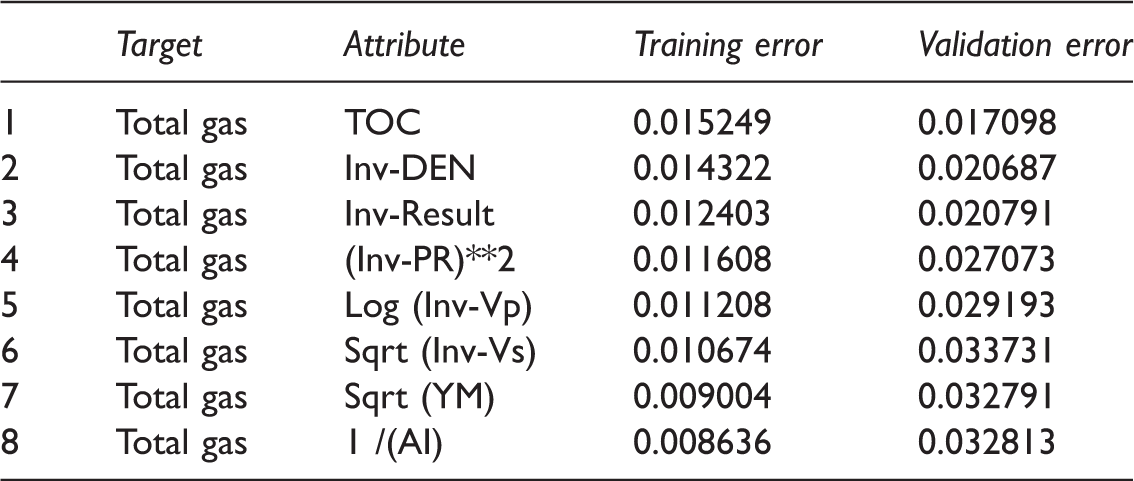
Shale gas may occur freely inside cracks and pores or be adsorbed in rocks (Curtis, 2002). Gas content is related to many factors and cannot be formulated with a single parameter. As shown in Figure 9, no distinct relationships could be found between gas content and a single elastic parameter. Thus, gas content was predicted by multivariate stepwise regression. Table 1 shows the errors of prediction for different portfolios of attributes. Validation error reaches the minimum of 0.50–0.52% for six seismic attributes. As shown in Figure 10, average error decreases with the number of attributes, while validation error decreases and then increases with the number of attributes. When the seventh attribute is included in the regression, validation error begins to increase. Therefore, the best portfolio includes six attributes for gas content prediction. Figure 11 shows average gas content distribution in Long1-1. Average gas content is usually higher than 4 m3/t. Warm colors indicate the content over 4.25 m3/t; the maximum content is higher than 5.5 m3/t. The reservoir with high gas content many distributes in the central and southwestern area of this block.
Relationship between gas content and elastic parameters of Longmaxi shale. (a) Gas content versus density. (b) Gas content versus porosity. (c) Gas content versus P-impedance. (d) Gas content versus P-velocity. Error analysis figure for multivariate stepwise regression of Longmaxi shale. Average gas content map (average gas content map for Long1-1 submember, Longmaxi Fm., W4 block). Error analysis for multivariate stepwise regression for gas content of Longmaxi shale.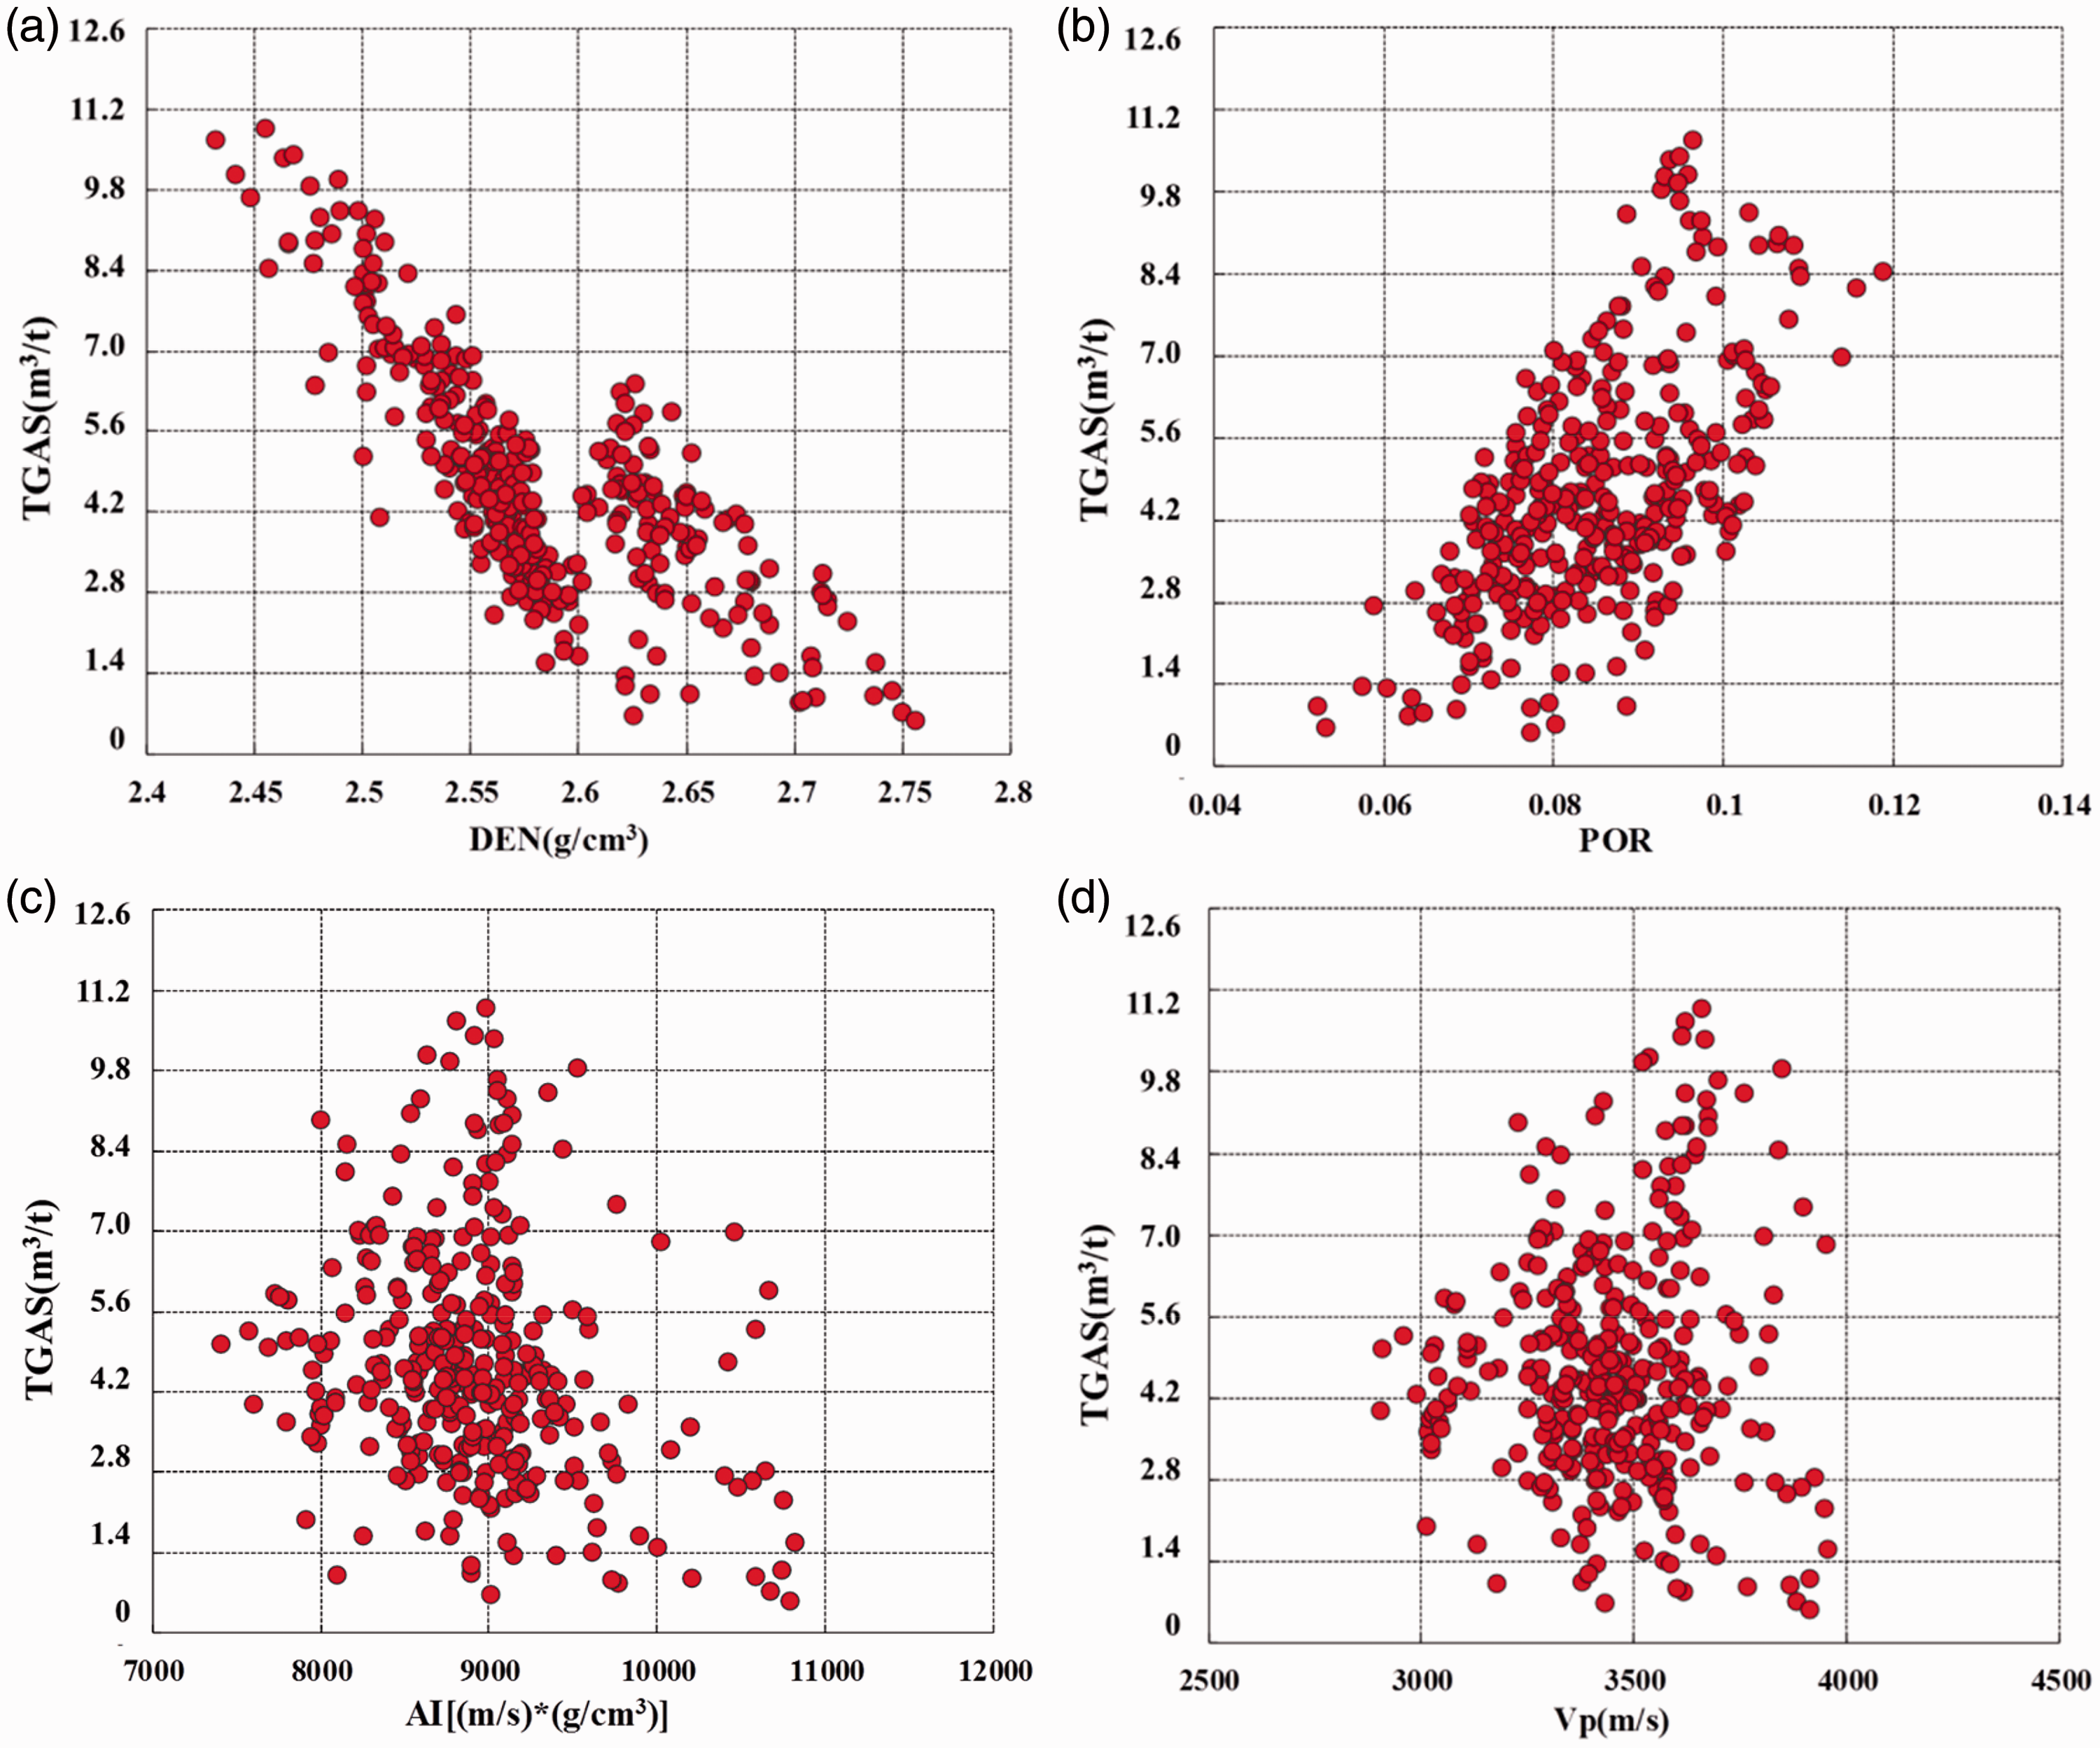
Engineering sweet spots
Shale brittleness prediction
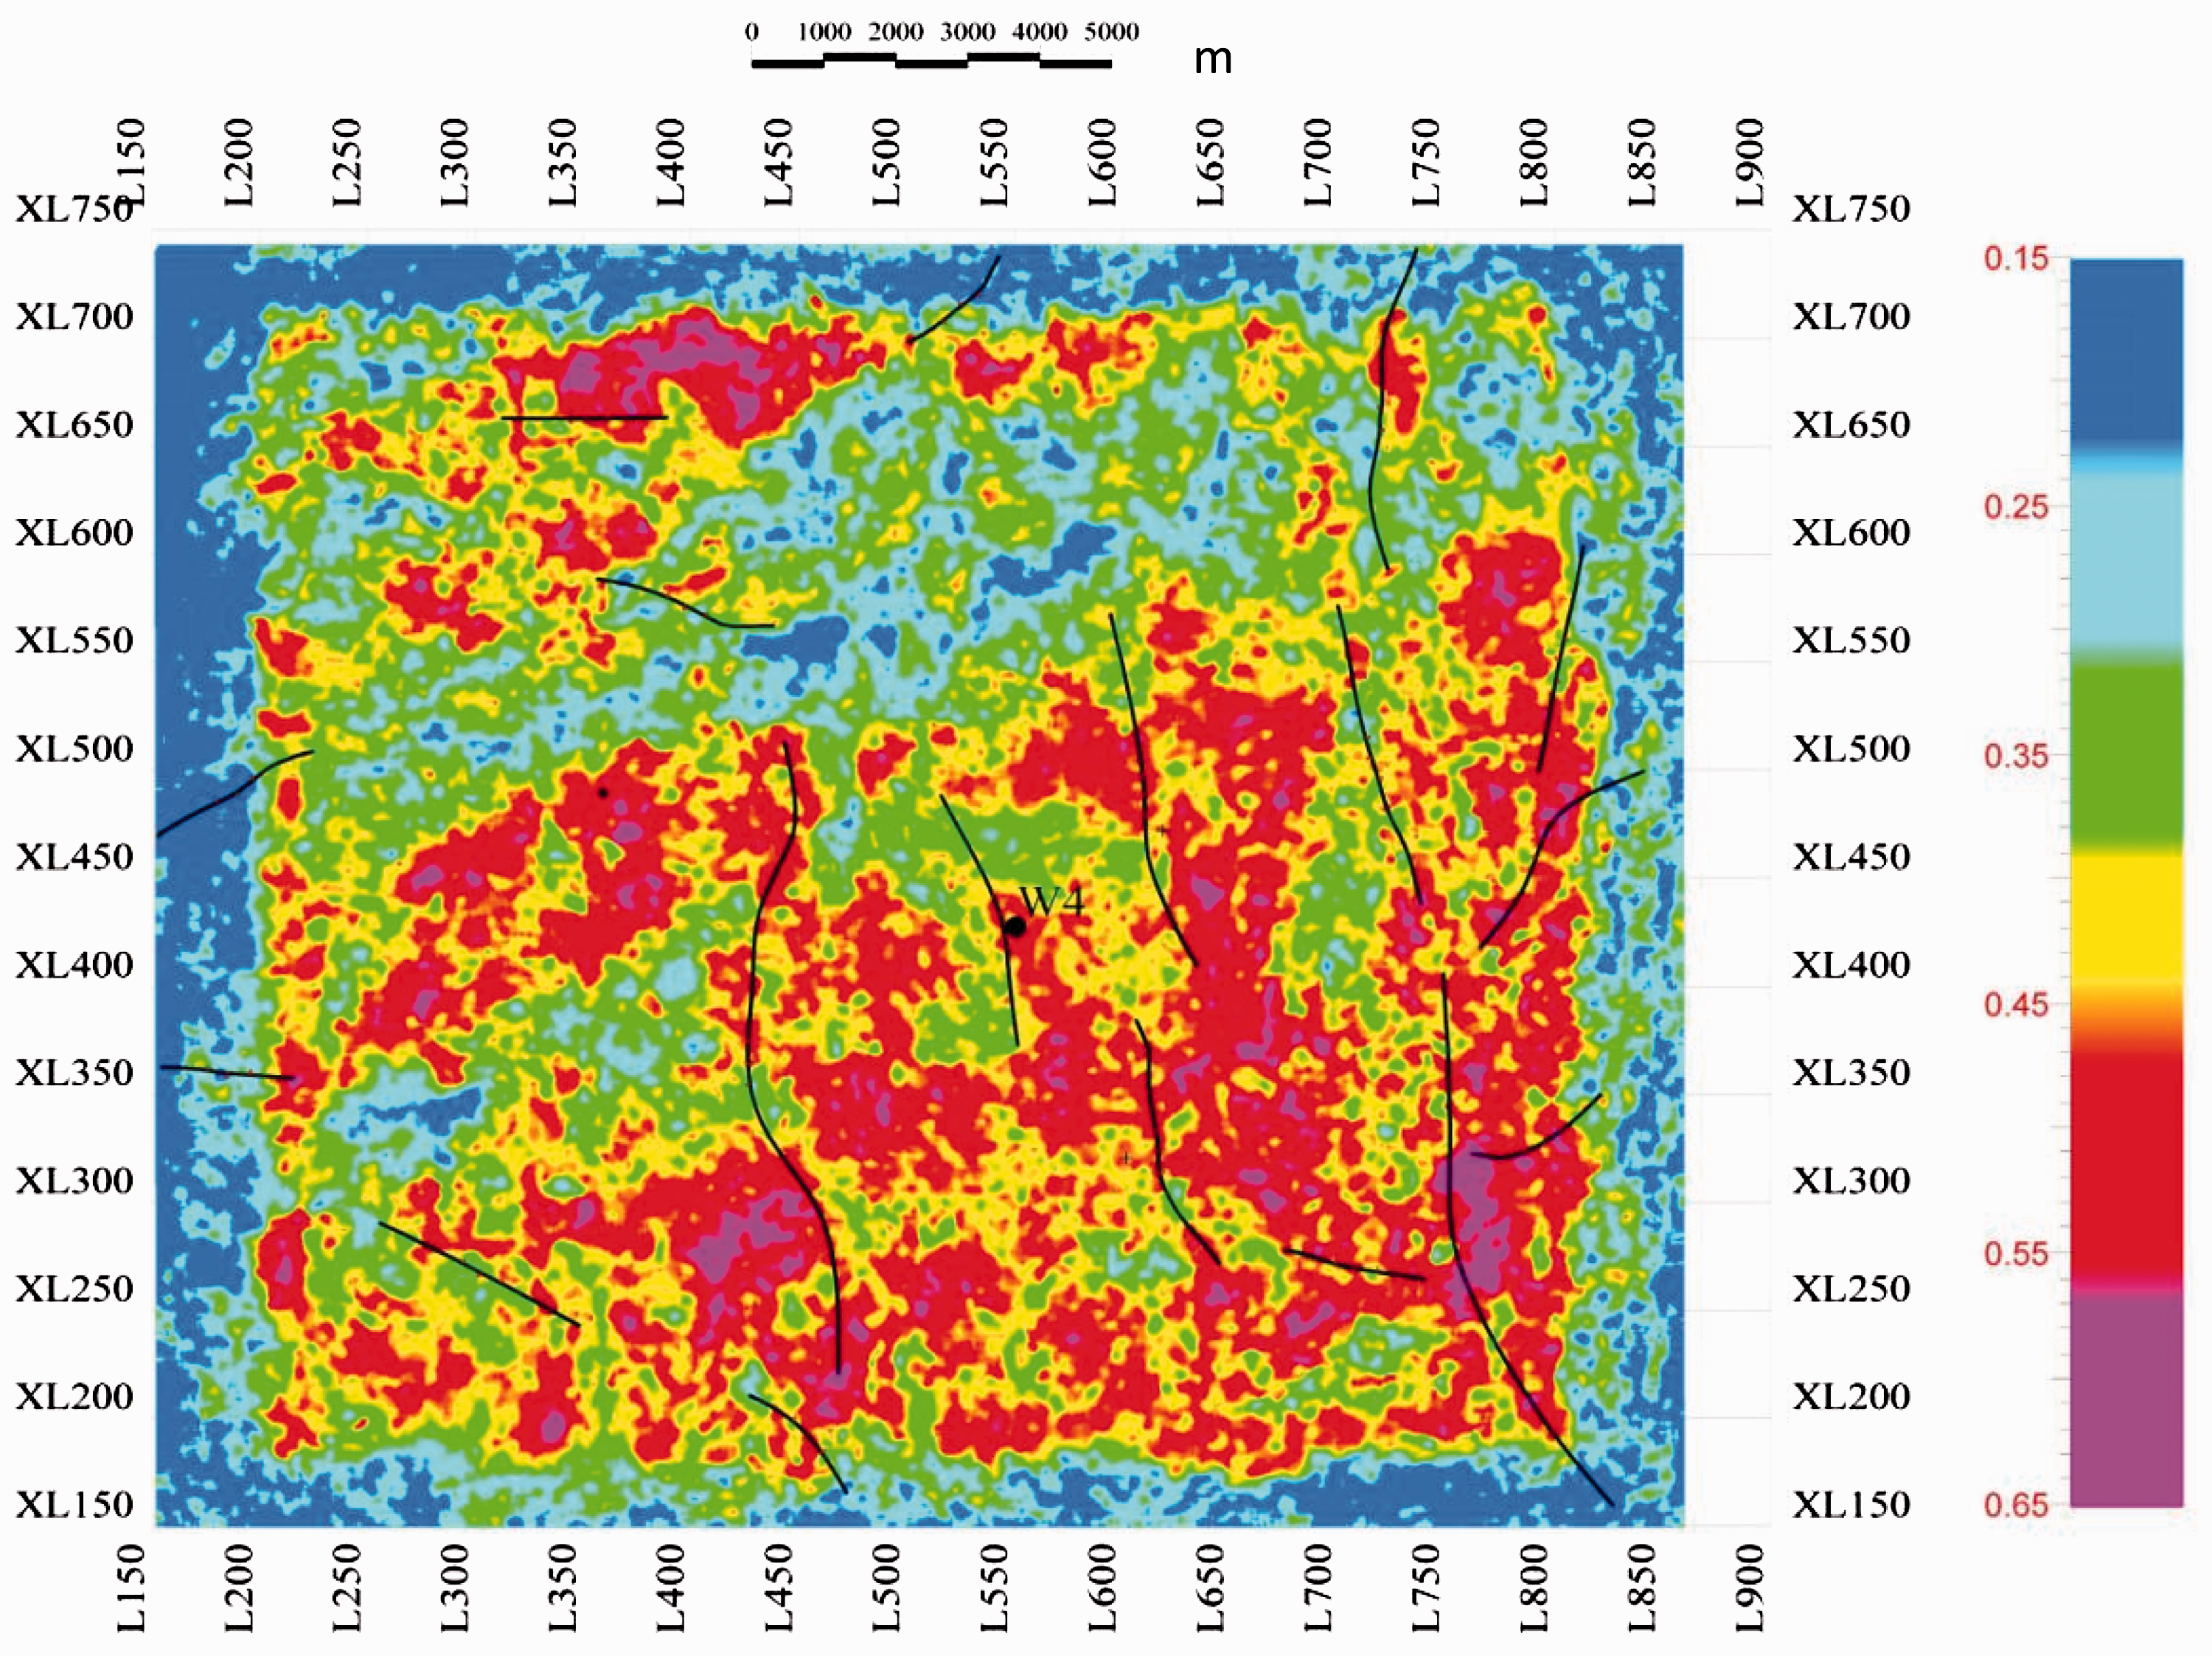
Sweet spots of shale reservoirs exhibit high Young’s modulus and low Poisson’s ratio (Grieser and Bray, 2007). Brittleness index is more practical for the characterization of rock brittleness (Rickman, 2008). In this study, we used this method to evaluate shale brittleness. The sections of Young’s modulus, Poisson’s ratio, and brittleness index were calculated and shown in Figure 12(a), (b), and (c), respectively. The sweet spots shale interval at the bottom of Long1-1 exhibit high Young’s modulus, low Poisson’s ratio, and consequent high brittleness. The sweet spots have the value of Young’s modulus above 45 Gpa, and value of Poisson’s ratio below 0.25. Figure 13 shows the average brittleness index map for Long1-1. Brittleness index in this block ranges 0.25–0.65 with an average of 0.45.
Young’s modulus (a) Poisson’s ratio (b) brittleness index, and (c) sections of Longmaxi shale (the black curve is Gamma Ray log of well W4). Brittleness index map (average brittleness index map for S1l11 submember, Longmaxi Fm., W4 block) predicted by 3D seismic data.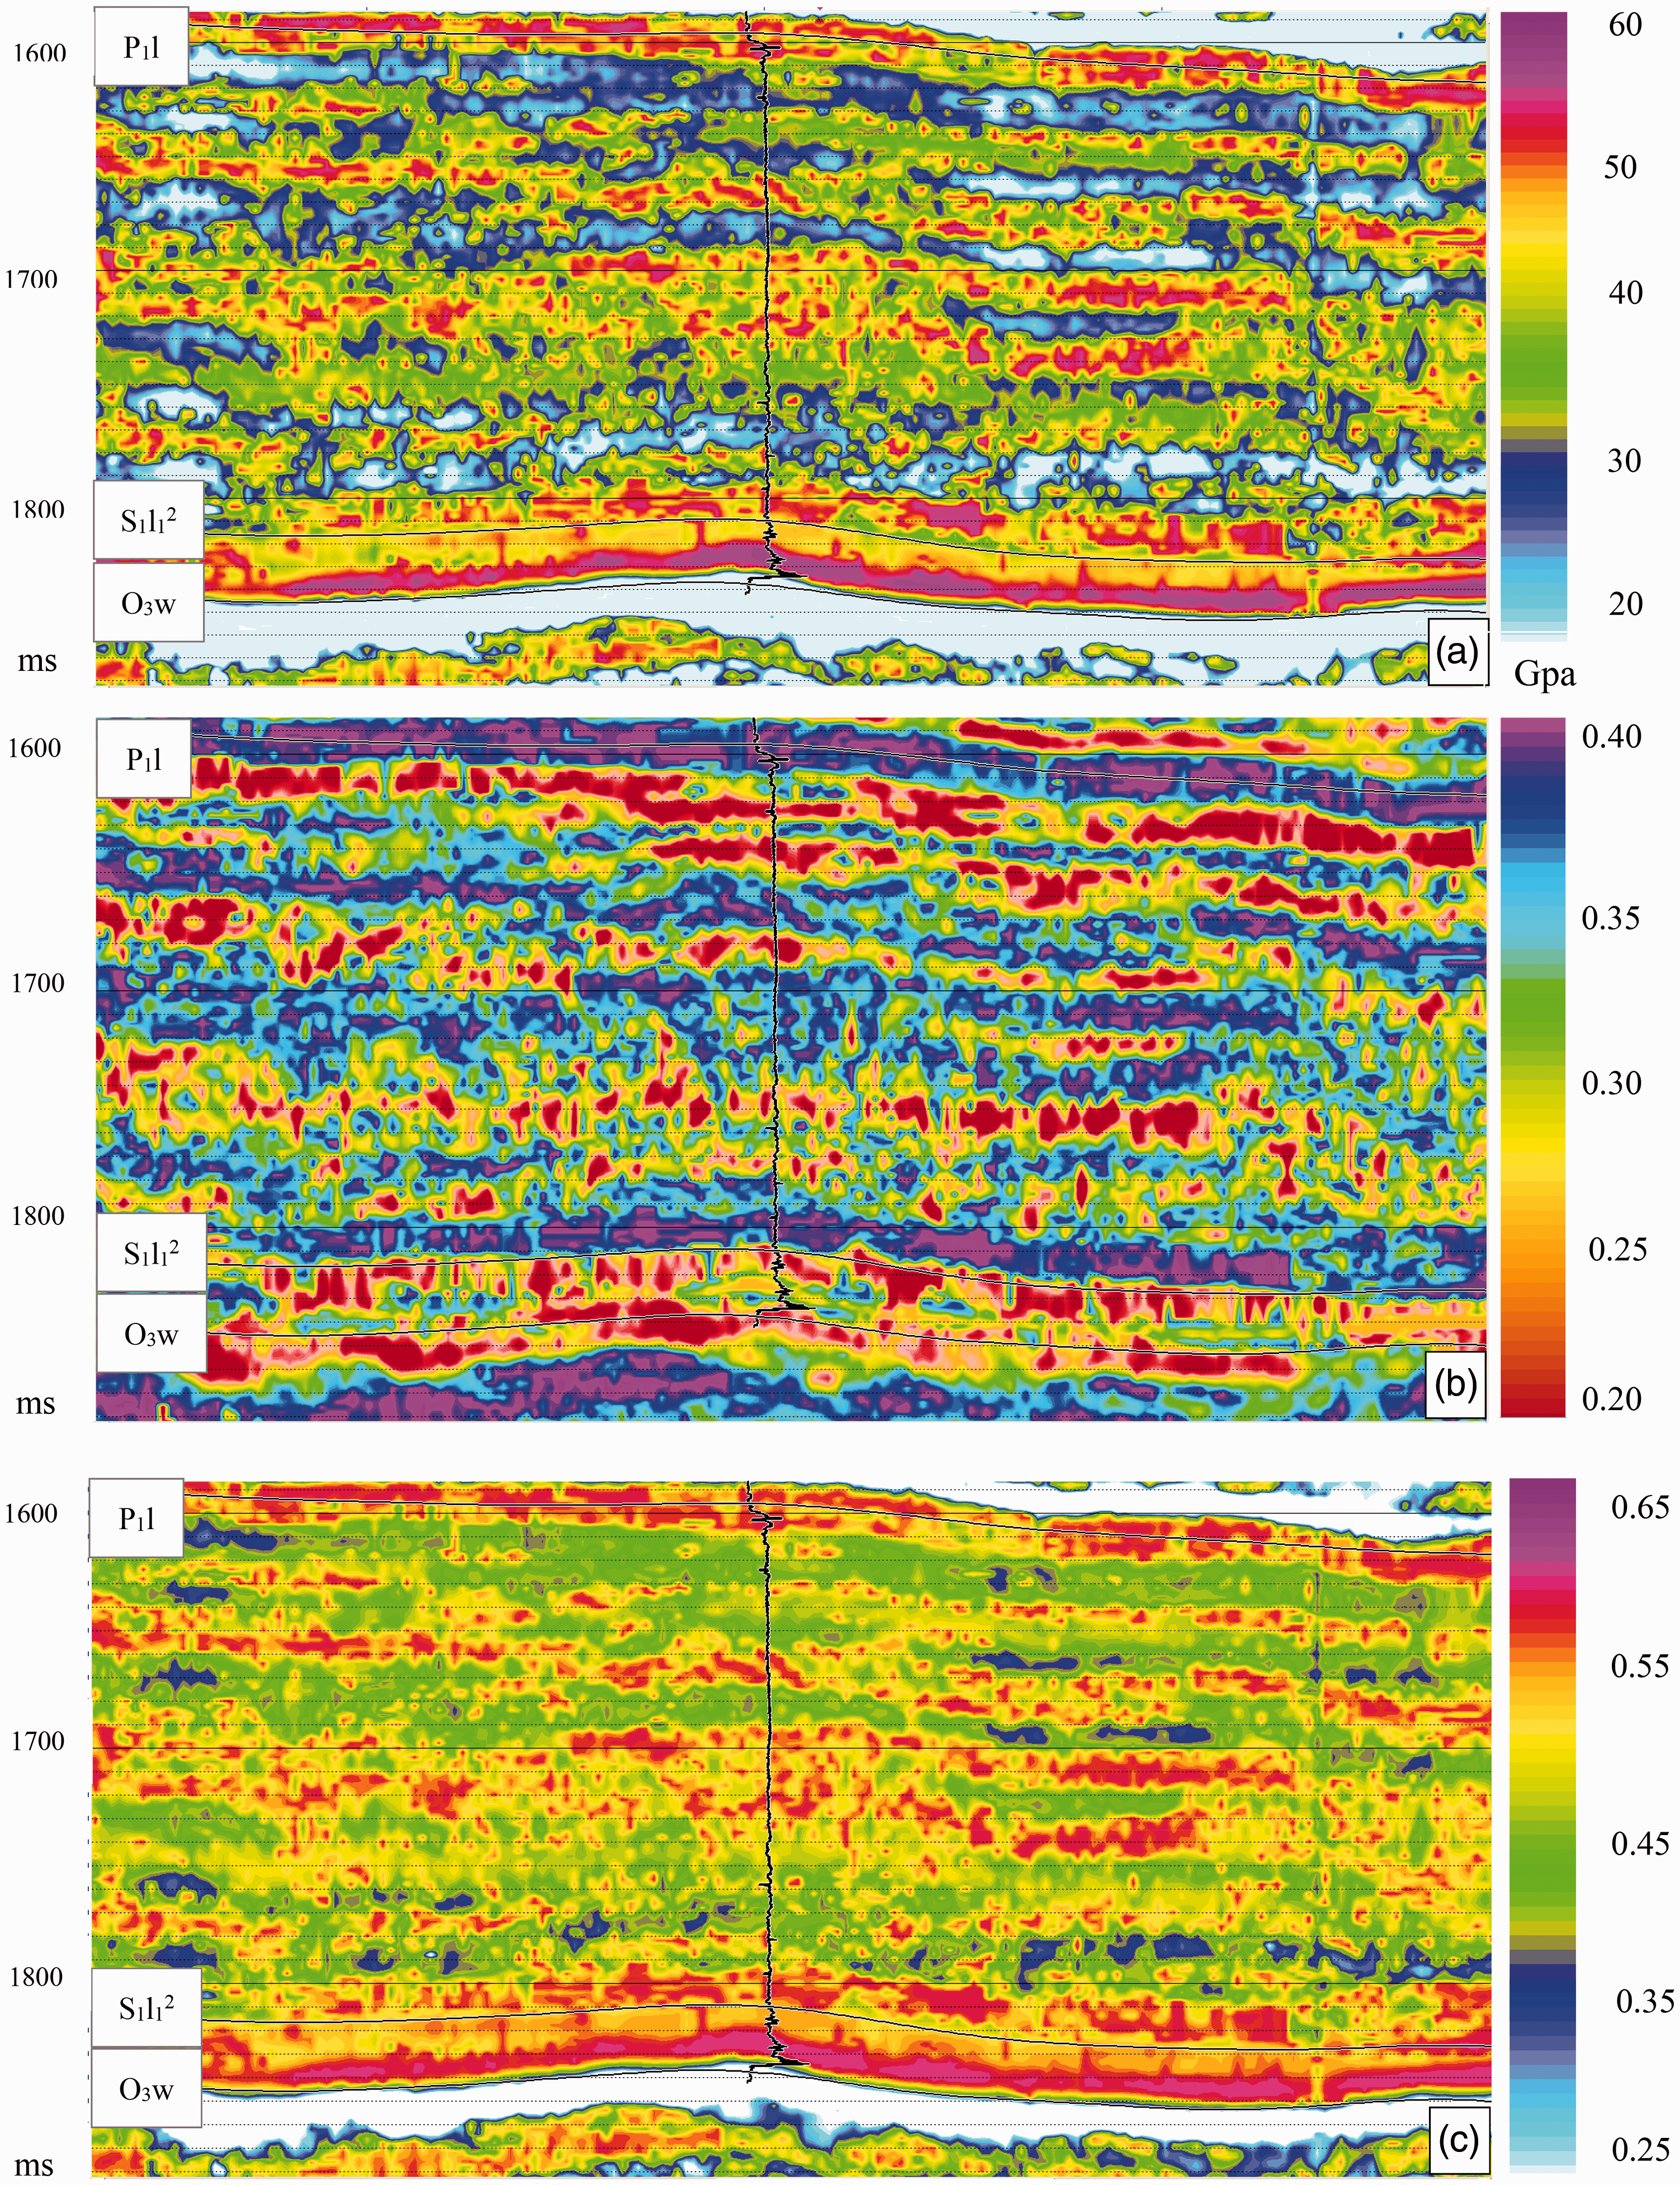
Formation pressure prediction
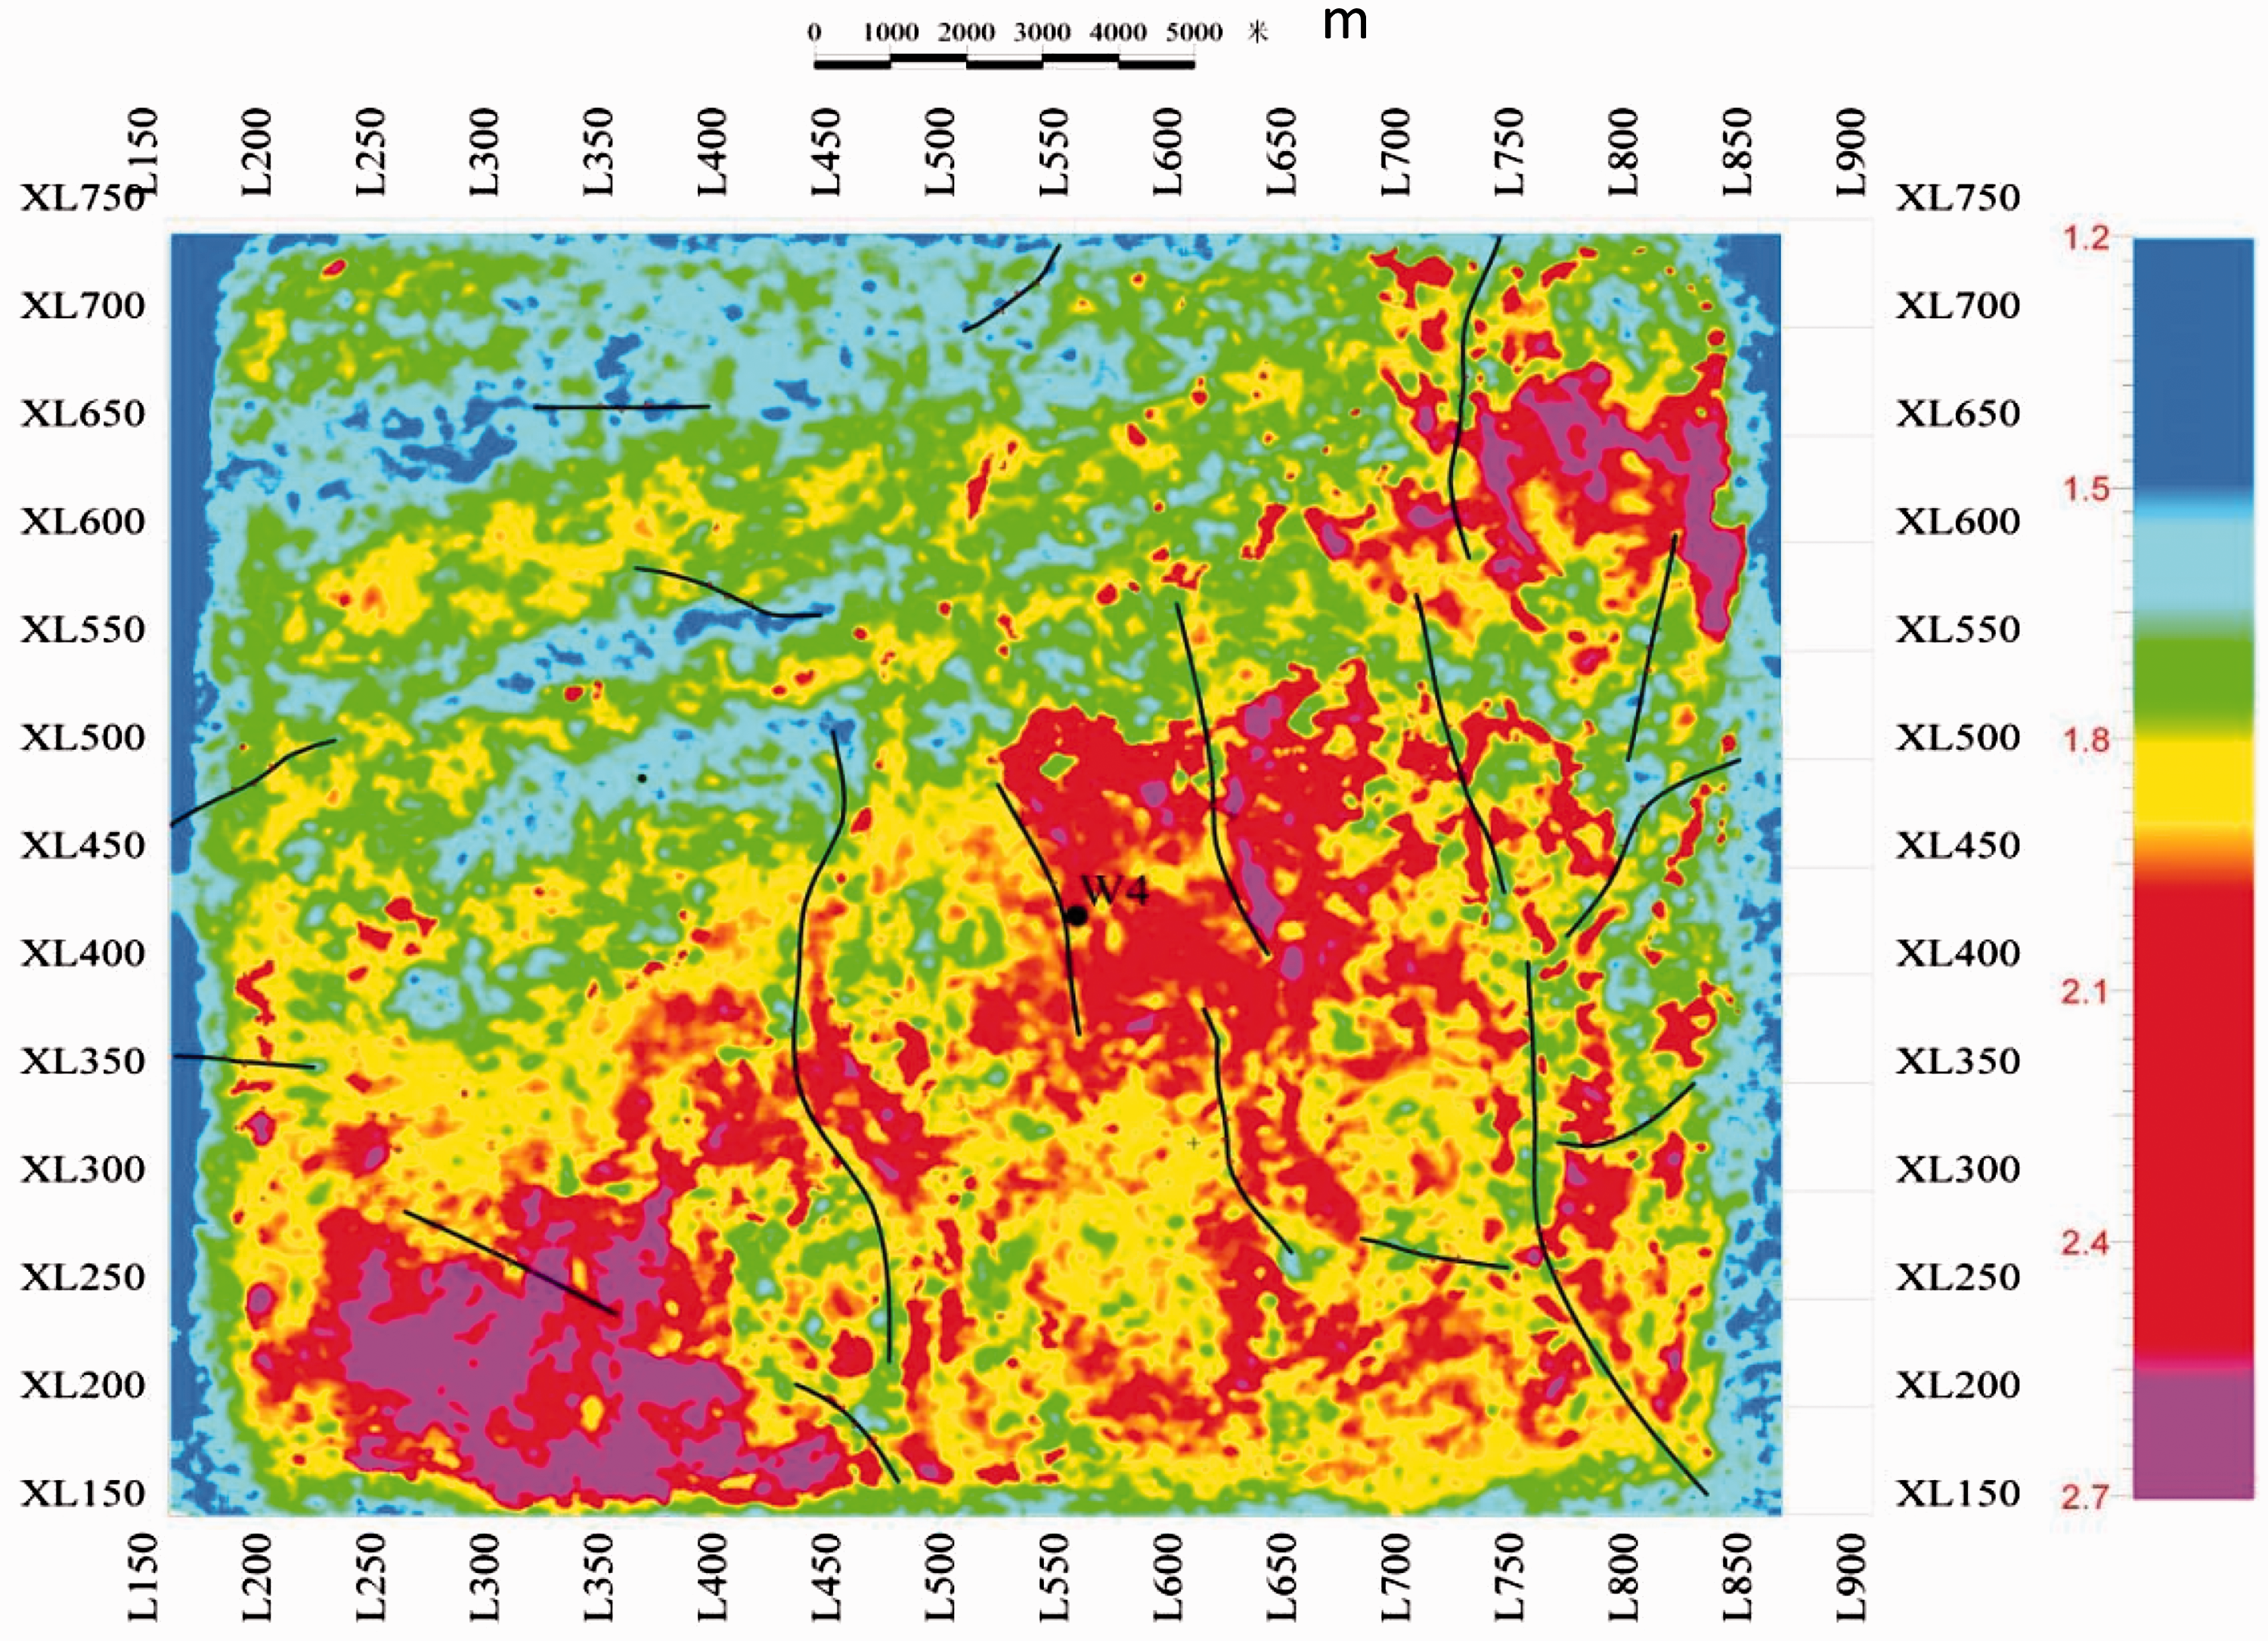
Almost all shale gas reservoirs with high yield discovered in China have excessive formation pressure, which has been found to be a prerequisite to high shale gas production in China (Guo and Zhang, 2014). Formation pressure was predicted by Fillippone method, as shown in Figure 14(a). Figure 14(b) shows the result of predicted pressure coefficient. Long1-1 exhibits remarkable high abnormal pressure; its pressure coefficient is generally larger than 1.5 and reaches 2.3 at the bottom. Figure 15 shows average pressure coefficient for Long1-1. Pressure coefficient is generally larger than 1.5 and locally larger than 1.8. Red and magenta regions with the coefficient over 2.0 may be promising for shale gas production.
Seismic prediction of formation pressure (the black curve is Gamma Ray log of well W4). (a) Formation pressure sections. (b) Pressure coefficient sections. Pressure coefficient map (average pressure coefficient map for S1l11 submember, Longmaxi Fm., W4 block) predicted by 3D seismic data.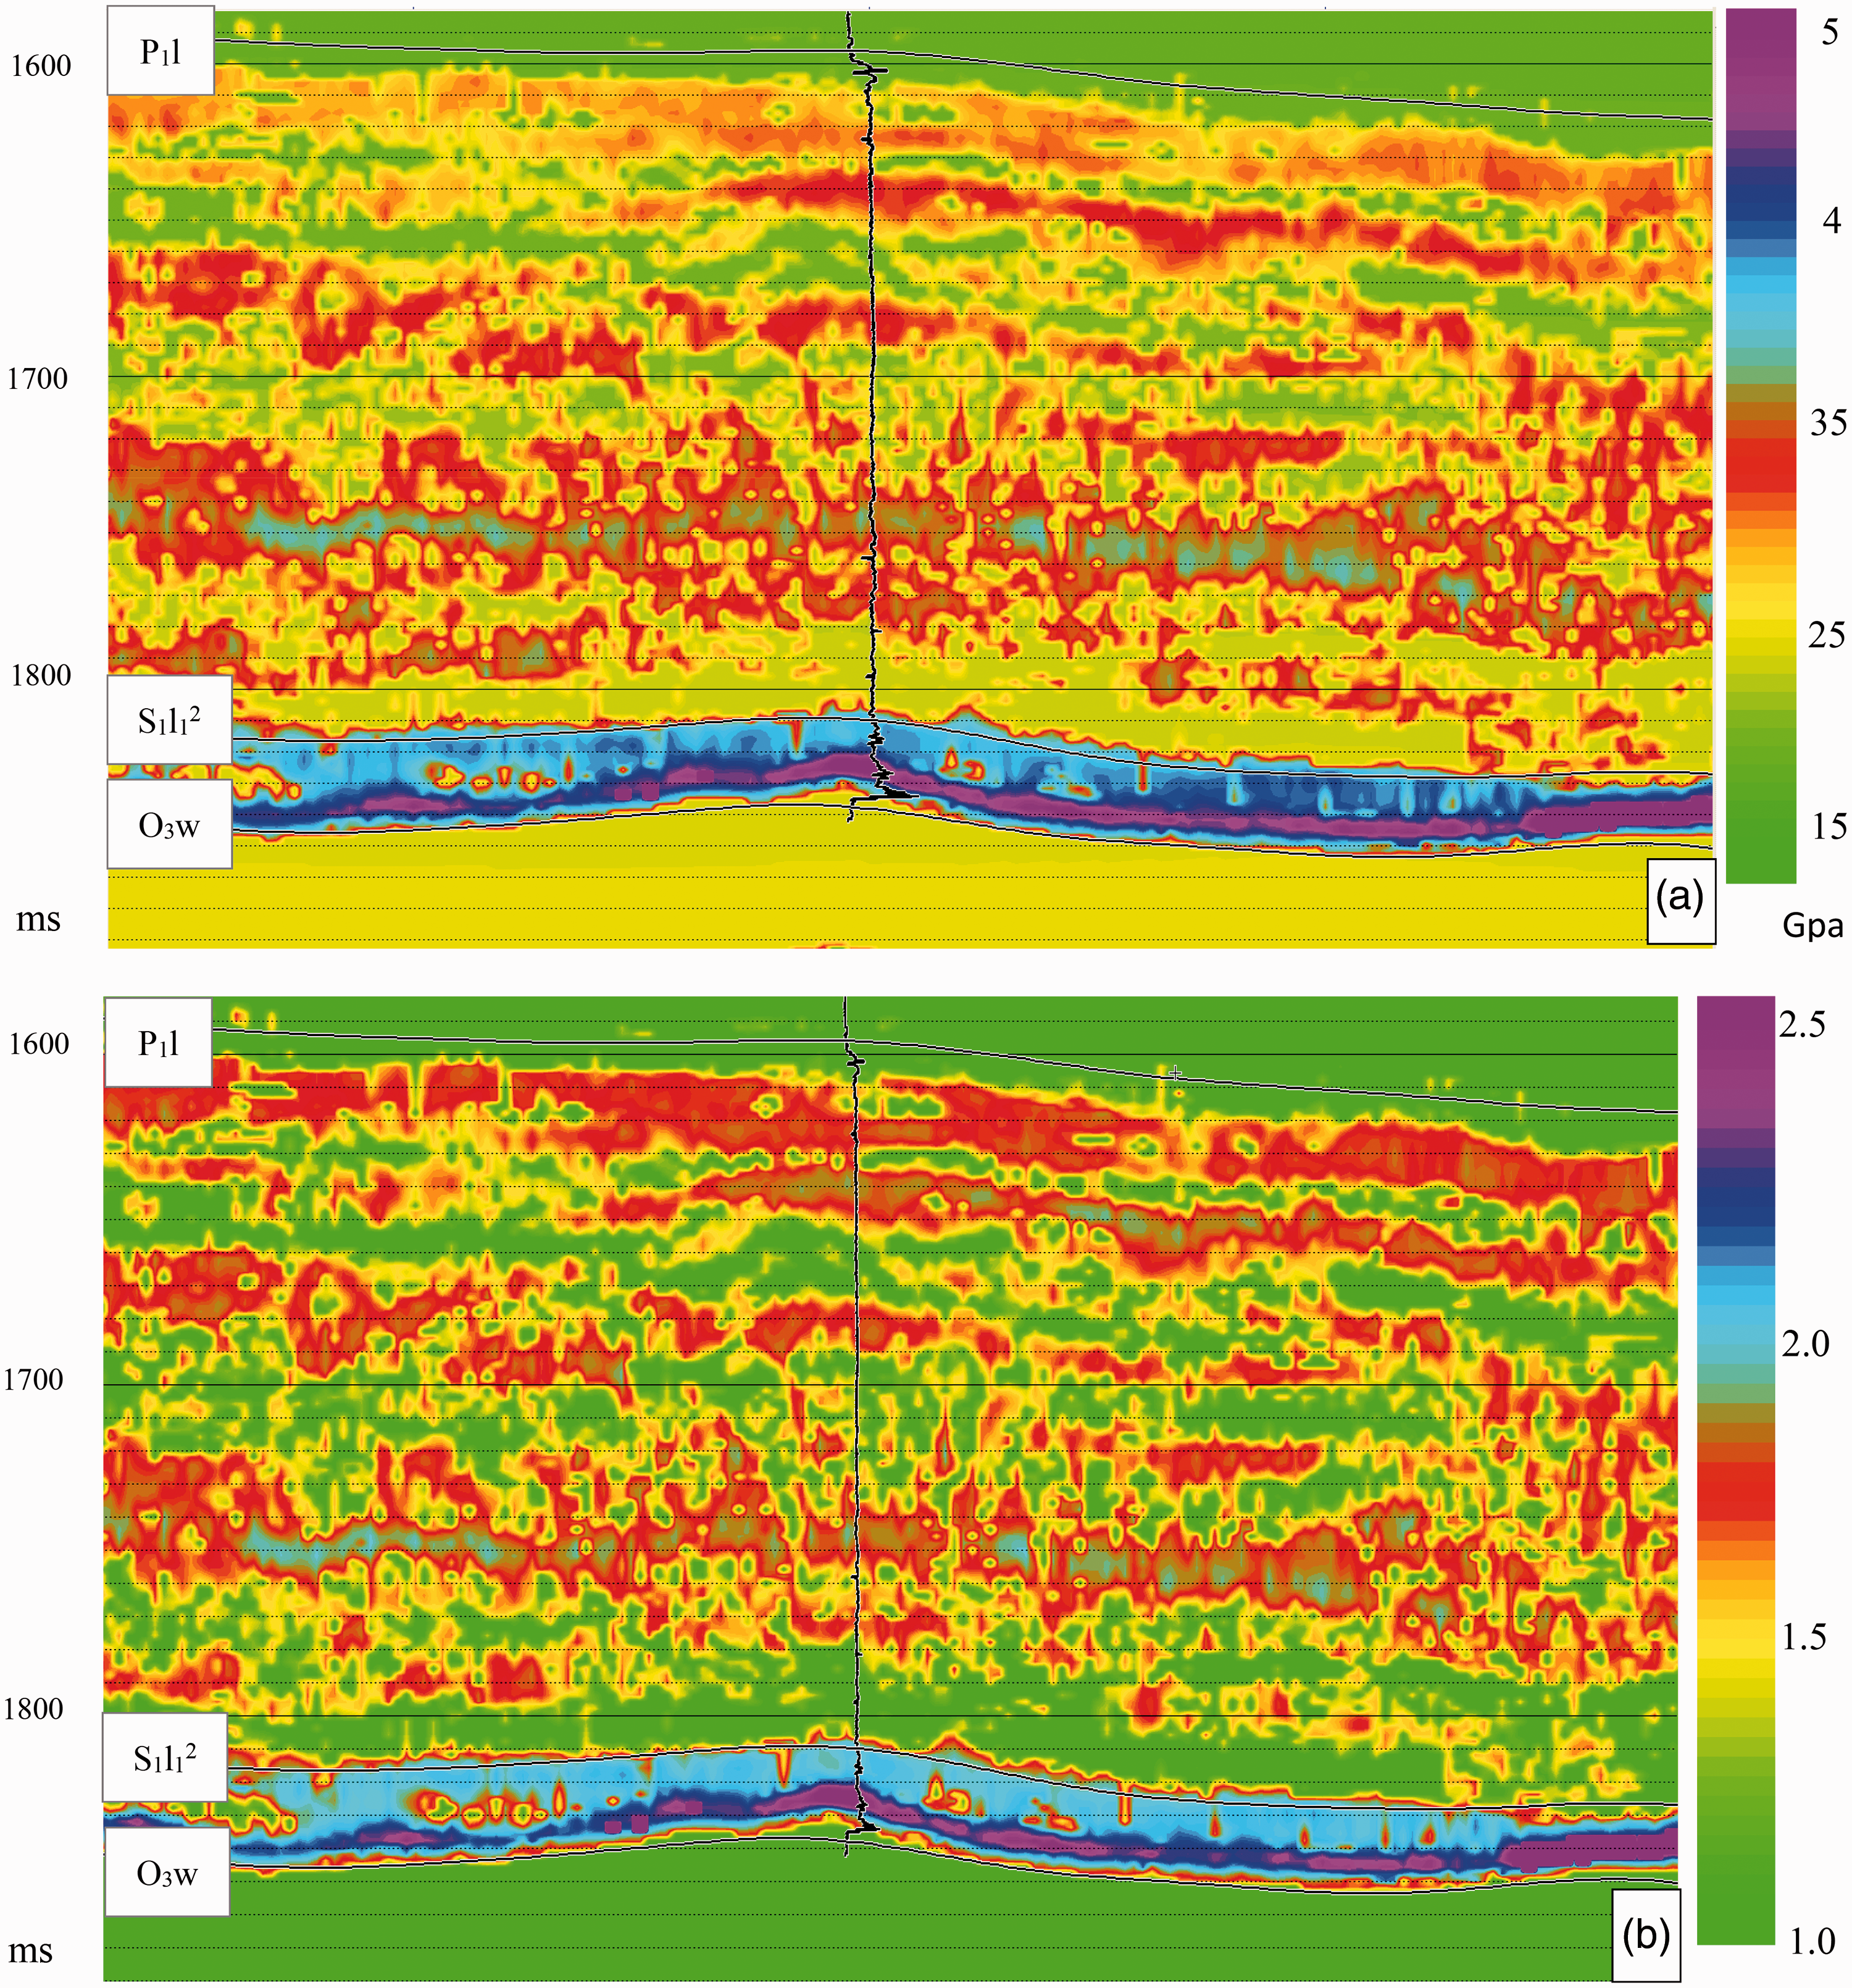
Natural fractures
Natural fractures provide pore space for shale gas accumulation. On the other hand, natural fractures and hydraulic fractures may constitute a complicated network to realize a large stimulated reservoir volume (SRV) (King, 2010). The technique of curvature was used to predict natural fractures. Figure 12 predicted result, it shows a maximum curvature slice extracted along the bottom. Red and white colors indicate large curvature; these regions may be promising for natural fractures and high shale gas production. We can find from the Figure 12 that the natural fractures distribute widely in this block. Most fractures extend in nearly north-south direction and others in nearly east-west direction.
Comprehensive evaluation
A shale gas sweet spot must be 30 m thick at least in this prospect. The lower bound of porosity is 3%; shale reservoirs with porosity higher than 3% mainly concentrate within 30 m above the bottom of the Longmaxi Formation. On the thickness map shown in Figure 6, shale reservoirs are mostly thicker than 30 m and may reach 50 m at most.
TOC content is among the most crucial parameters for shale reservoir evaluation. In North America, TOC content in a commercial gas accumulation is higher than 2% (Ross and Bustin, 2008). Chen et al. (2012) presented that a sweet spot in Longmaxi shale should have TOC content over 3%; as per well data, TOC content in lower Longmaxi is above 2%. Seismic prediction shows that TOC content varies greatly in lateral direction and high-quality reservoirs with average TOC content over 3% mainly distribute in the middle and south parts.
Gas content is closely related to TOC content. Generally, there is a positive correlation between gas content and TOC content. Chen et al. proposed that commercial gas content in Longmaxi shale is higher than 3 m3/t. As shown on the map, average gas content is mostly higher than 3 m3/t in the middle and south parts.
The effect of hydraulic fracturing and consequent shale gas production are dependent on shale brittleness. In North America, the brittleness index of a sweet spot is generally larger than 40% (Mayerhofer et al., 2008). For shale reservoirs at the bottom of the Longmaxi Formation, average brittleness index ranges 30–80% and reaches its maximum in the middle and south parts.
Both high-pressure and normal-pressure shale gas reservoirs have been found in North America, but in China almost all gas reservoirs discovered have excessive pressure. Overpressure is a prerequisite to high shale gas production (Editorial Committee of “shale gas geology and exploration and development practice series,” 2009). In this prospect, formation pressure is generally high, especially in the middle and south parts. Pressure coefficient ranges 1.2–1.8 in the north and is above 1.8 in the south. These regions may be promising for shale gas production.
Natural fracture prediction is important to geologic and engineering sweet spot evaluation because natural fractures provide pore space for gas accumulation and also help to generate a complicated fracture system by hydraulic fracturing. As shown in Figure 16, this block is rich in natural fractures.
Curvature slice (average pressure coefficient map for S1l11 submember, Longmaxi Fm., W4 block).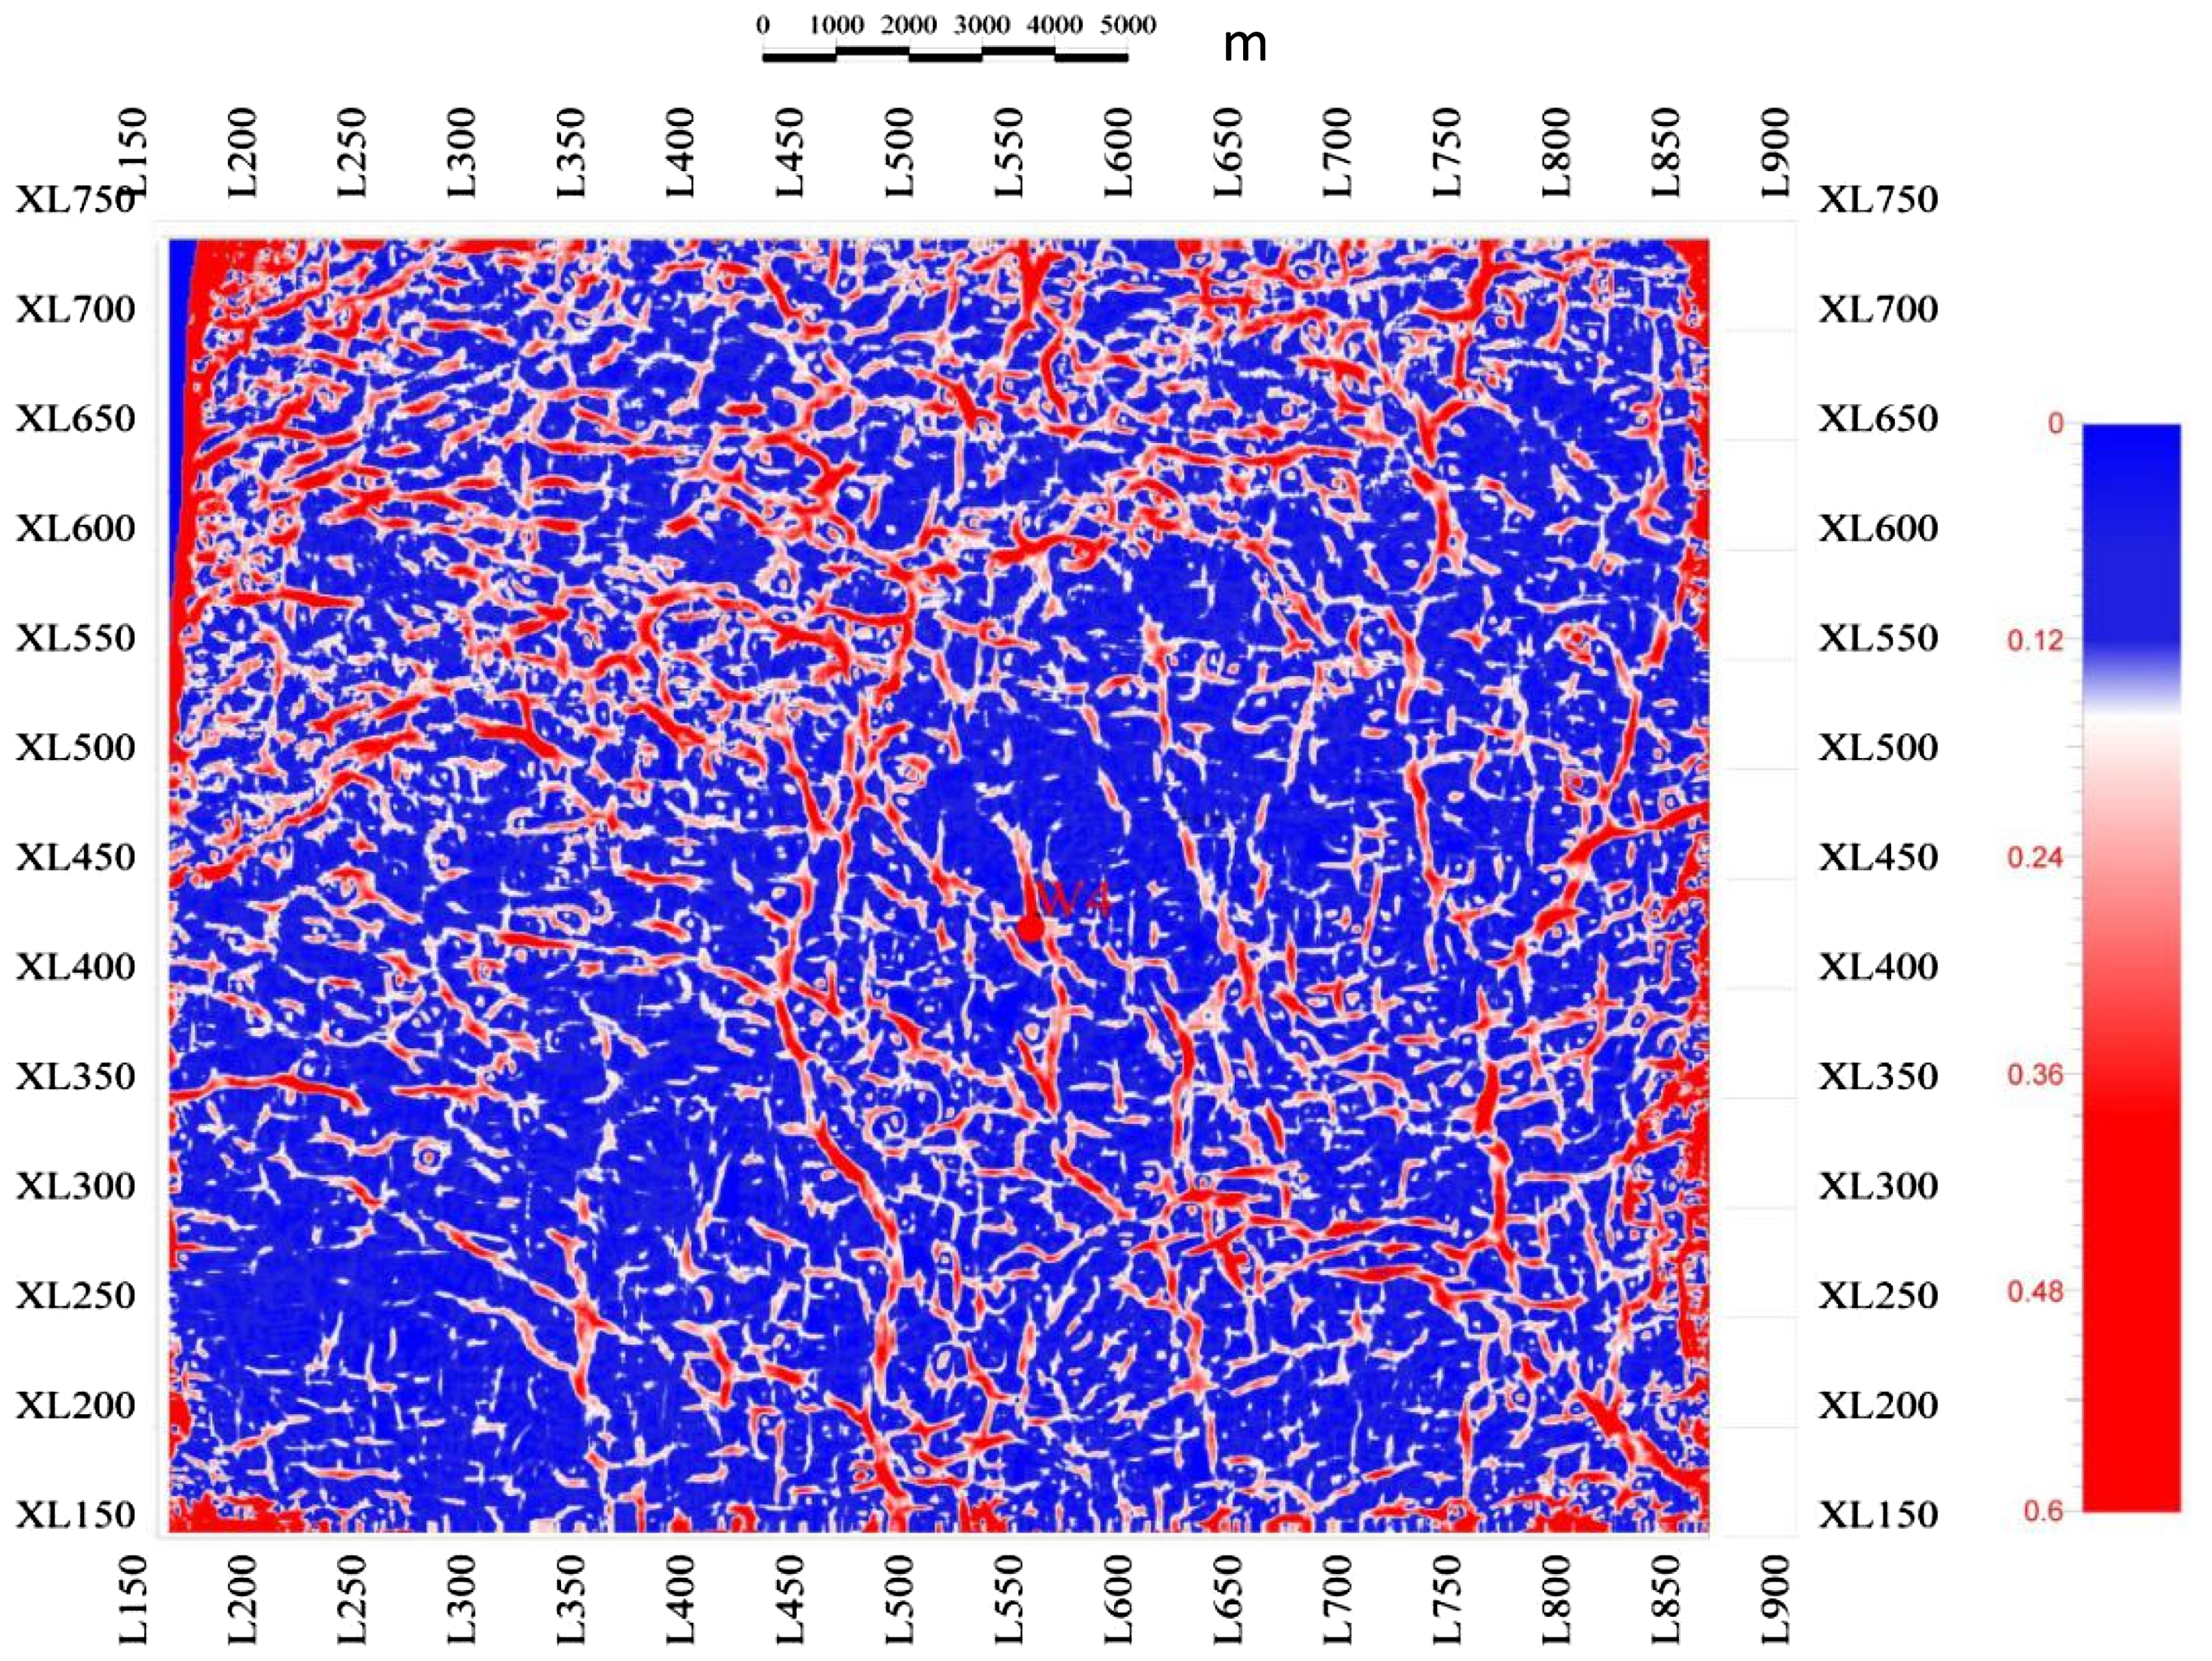
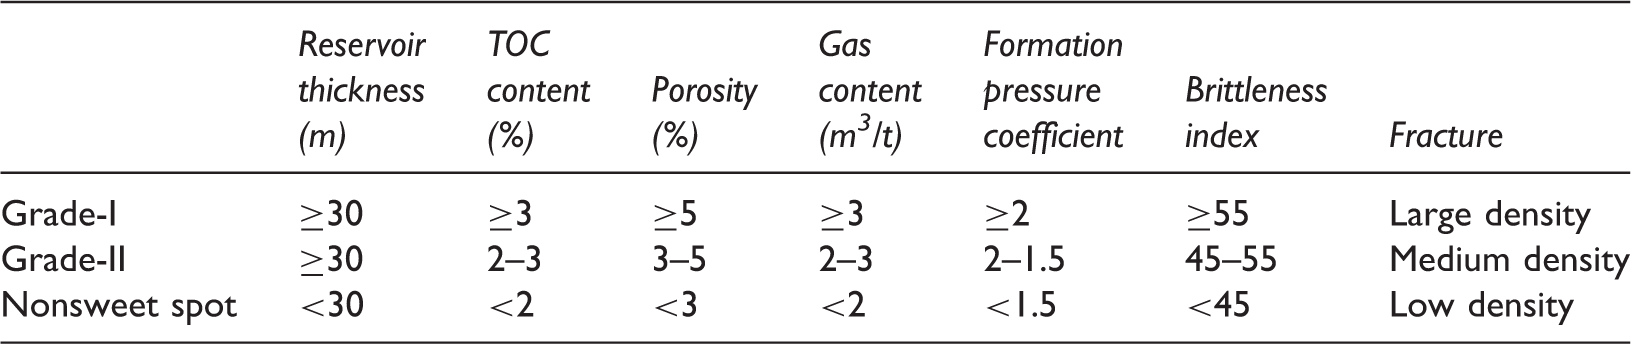
An evaluation scheme is drafted in accordance with shale gas production in this block and neighboring prospects, as shown in Table 2. Sweet spots have been evaluated to be of two grades, as shown in Figure 17. Grade-I sweet spots which are in very warm color (purple and red) have good properties for gas production, and Grade-II sweet spots which are in warm color (brown and yellow) are taken as the successor which may be exploited in the future. It is suggested not to deploy development wells in other regions.
Comprehensive prediction of sweet spots. Sweet spot grading and evaluation scheme for Longmaxi shale.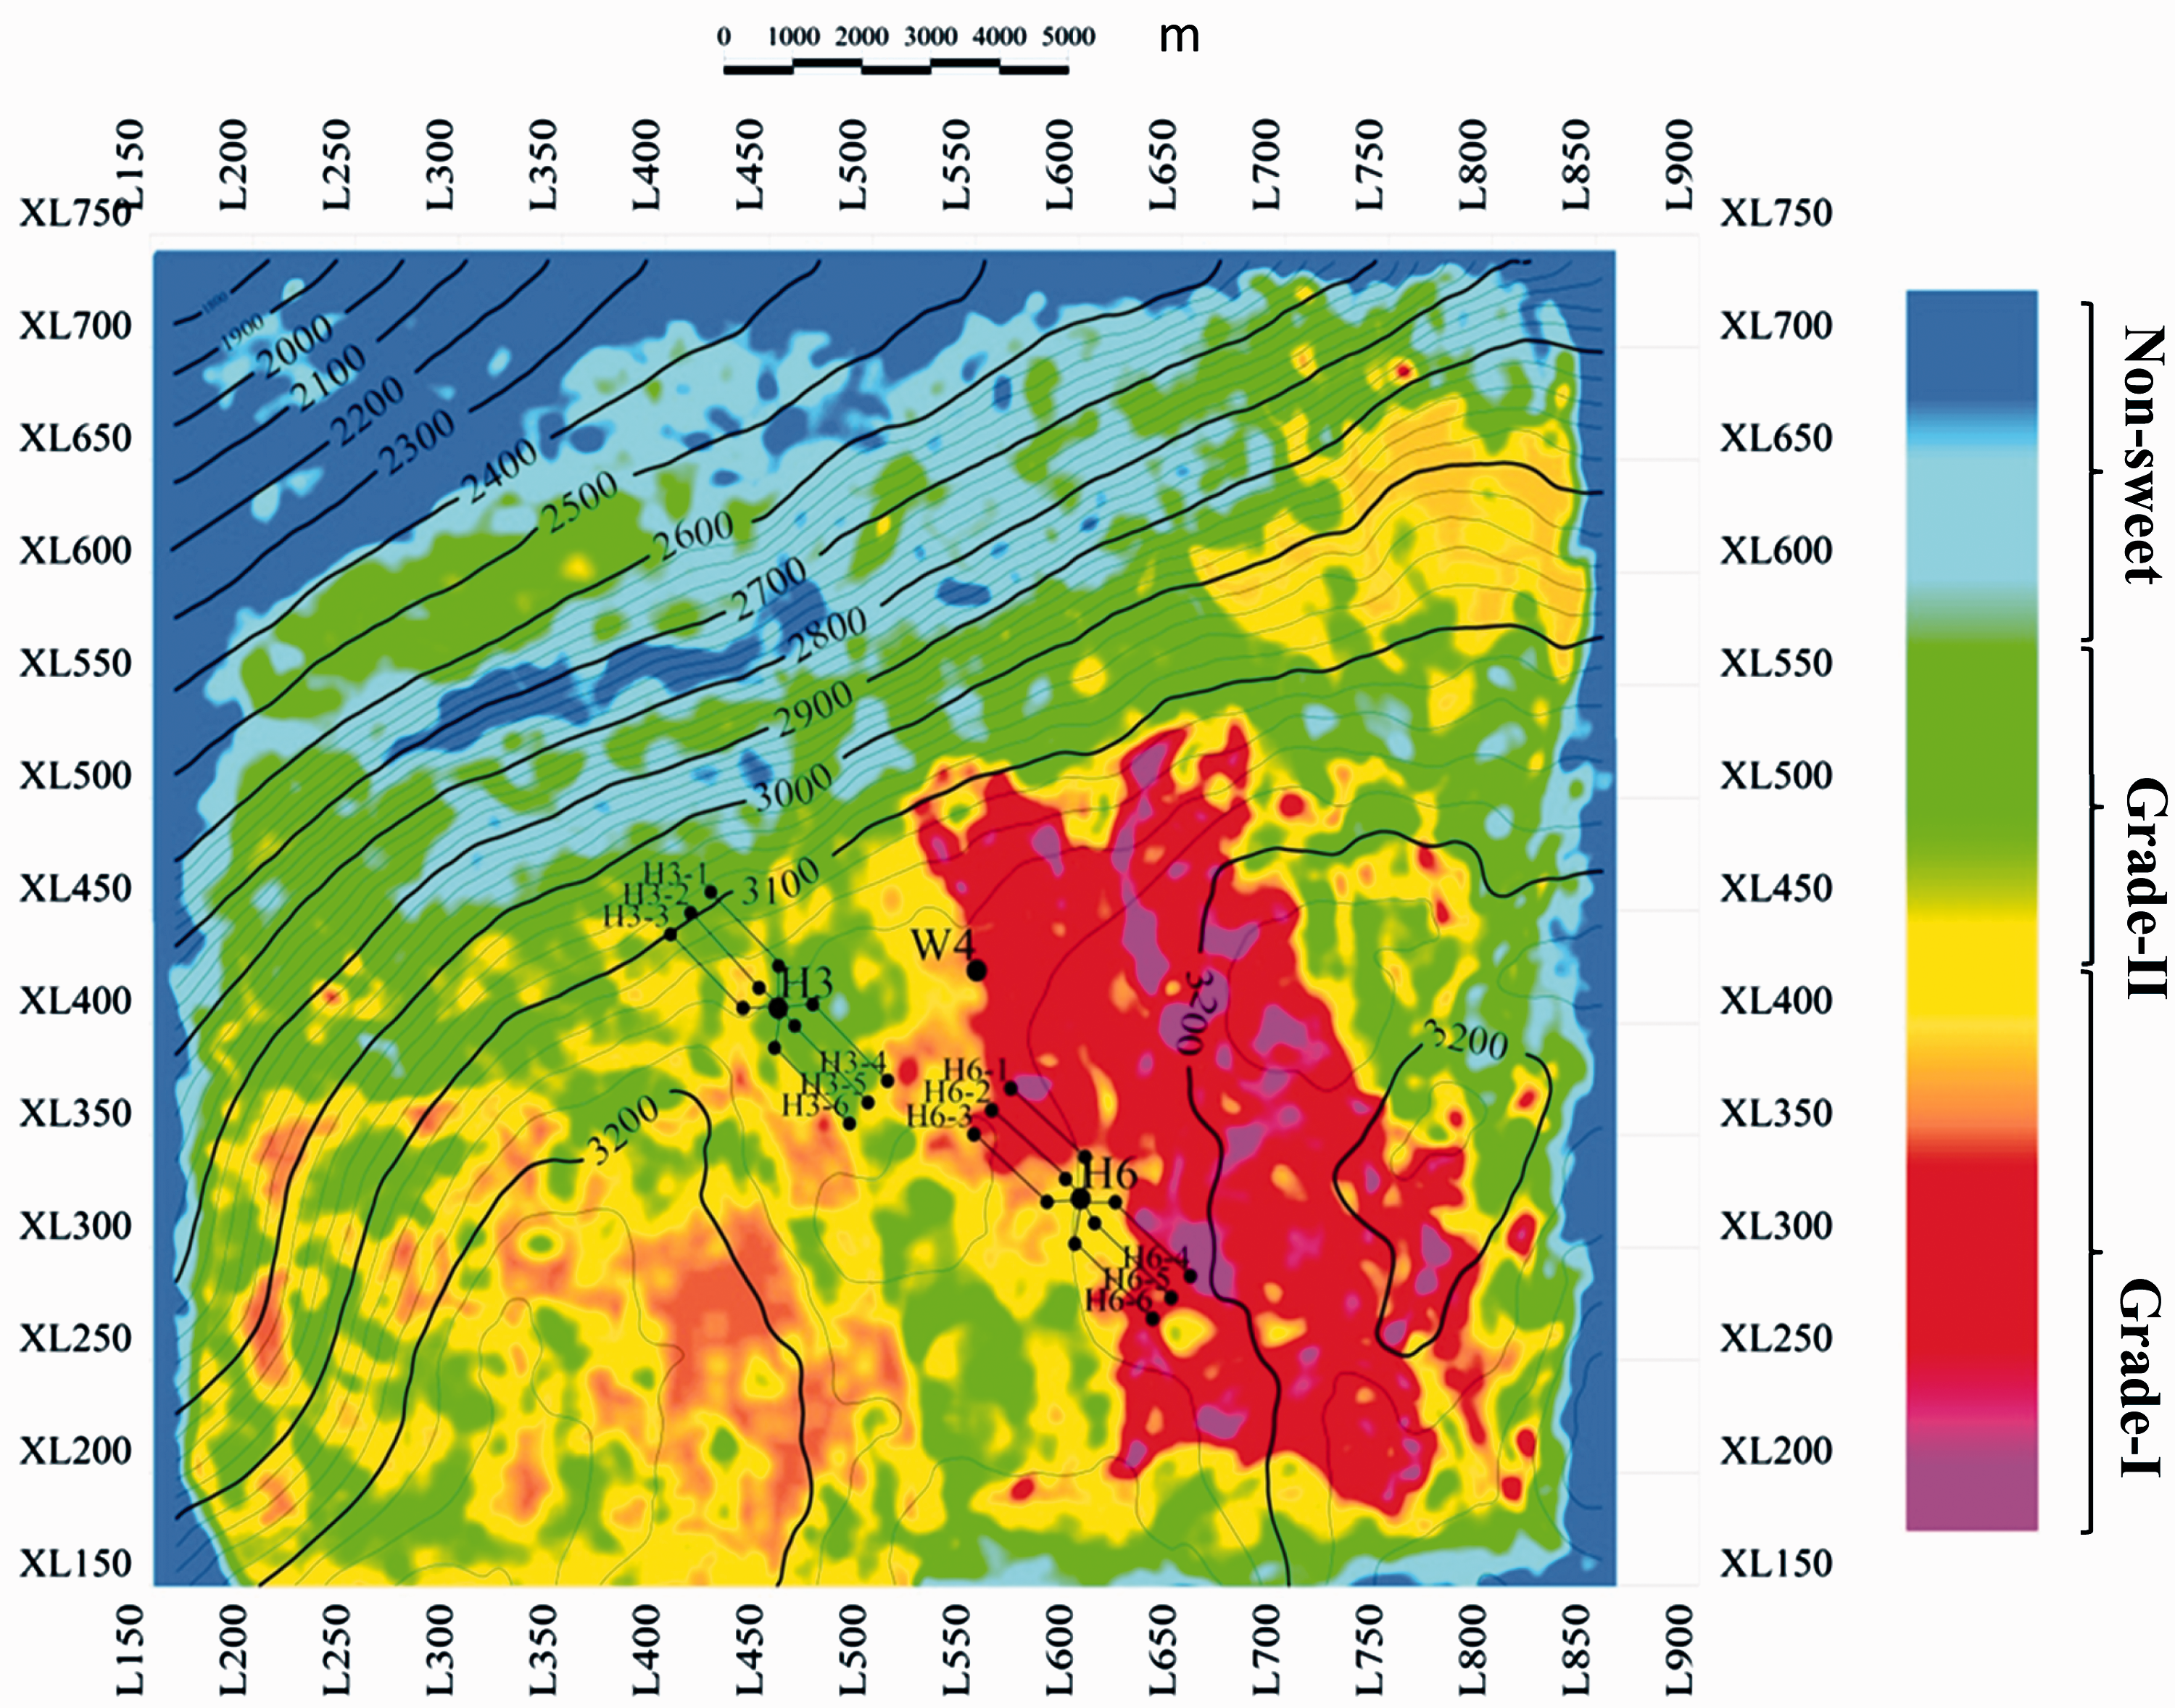
Compare the comprehensive evaluation result to the prediction results of the geologic sweet spots and engineering sweet spots. We find that Grade-I sweet spots are geologic sweet spots as well as engineering sweet spots. However, the Grade-II sweet spots are just geologic sweet spots or engineering sweet spots.
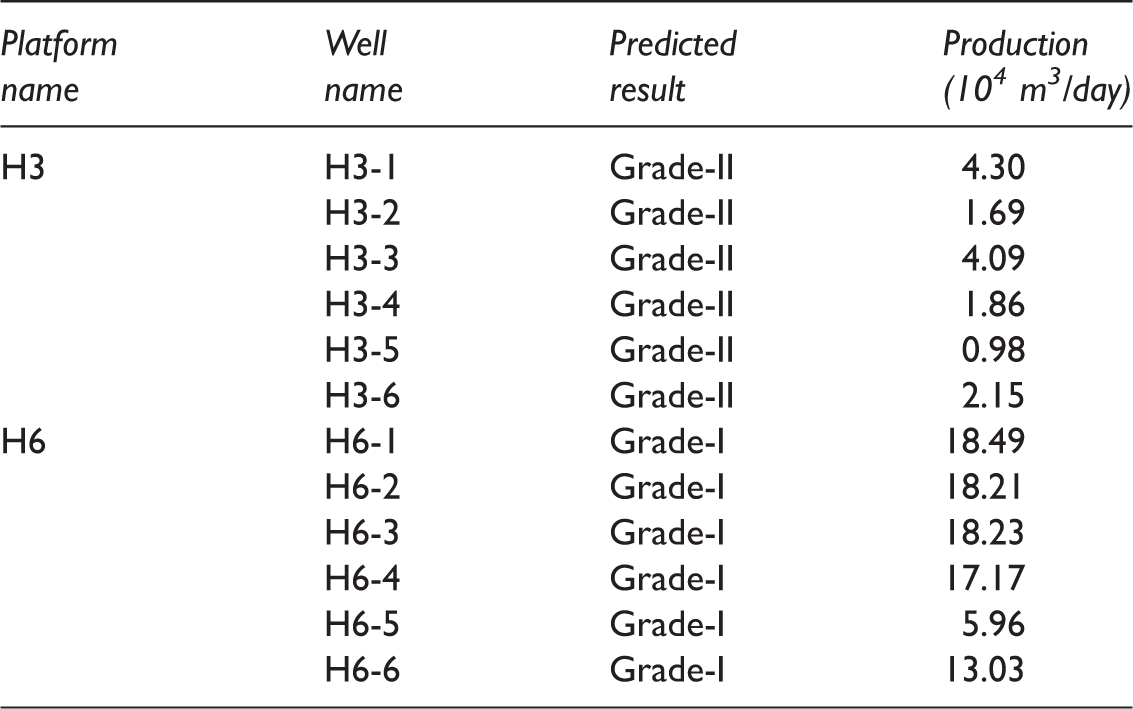
Production data of verify wells and predicted result.
Conclusions
In conclusion, prediction of sweet spots accurately using seismic and logging data is important for Shale gas exploration and development in China. Many jobs are at the beginning. In this article, we have shown that integrated logging interpretation and prestack inversion can be efficiently applied on the prediction of sweet spots distribution.
For W4 block, sweet spots in Longmaxi shale concentrate within 30 m above the bottom in accordance with logging interpretation. Two grades of sweet spots were evaluated. Grade-I sweet spots with good properties are the best candidates for production and Grade-II sweet spots with moderate properties are the successor for shale gas production in the future. It is suggested not to deploy well drilling in other regions. The results of this study provided important guidance for the factory production of this area. The method in this paper can be used to other area, which can provide reference for the development of shale gas in China.
Footnotes
Declaration of conflicting interests
The author(s) declared no potential conflicts of interest with respect to the research, authorship, and/or publication of this article.
Funding
The author(s) received no financial support for the research, authorship, and/or publication of this article.