
Abstract
Compared with shale gas in north American, it is older, more mature, and significantly difference in China. Taking the Longmaxi Formation of WY block in Sichuan Basin as an example, the quantitative prediction method of sweet spots for high mature shale gas is formed. Firstly, the geophysical response characteristics of shale gas reservoir is studied, and the physical characteristics of the sweet spots are determined. Then, the distributions of reservoir evaluation parameters, such as total organic carbon, brittleness, and others, are obtained by pre-stack simultaneous inversion. Finally, fuzzy neural network method is carried out to predict the distribution of sweet spots and to deploy wells. Shale gas sweet spots in this block vertically concentrate within 30 m above the bottom of the Longmaxi Formation. And two grades of sweet spots are evaluated. The quantitative relationship between the production results of horizontal wells and the evaluation is established with Fuzzy neural network method.
Introduction
Shale gas potential is similar in China and the US (Li et al., 2009), but shale gas production is more challenging in China. Shale gas exploration and development just began in recent years in China (Zhao et al., 2016), and seismic-based prediction of sweet spots is still in its infancy.
Prediction of “sweet spots” is one of the most important procedures of shale gas exploration and development (Chen et al., 2017a). A “sweet spot” of shale gas is defined as the area with moderate burial depth, high organic carbon content, high maturity, high gas content, high brittle mineral content, well-developed natural fractures and easy formation of complex fracture network by fracturing. It is the preferred target for acquiring and maintaining high productivity and realizing effective production of shale gas (Fan et al., 2011; Nei et al., 2011; Zhao et al., 2015). Gas content, which is one of the key elements of “sweet spots”, has great significance to commercial development of shale gas reservoir.
Dodds et al. (2007), based on core analysis results and well log data, applied the neural network method to establish a relationship between seismic attribute and gas saturation through the seismic attribute analysis, and obtained some positive effects in computing the gas saturation of shale reservoir with seismic attributes. Ross et al. (2009), based on a detailed analysis of pore structure, total organic carbon (TOC) and pore fluid composition in the shale reservoir, suggested that the gas content is closely related to porosity and TOC, and basically established the quantitative relationship between gas content and porosity or TOC based on well data. Amanda Bustin (2012) performed a systematic study of conditions and major controlling factors for high productivity of shale gas utilizing the numerical simulation method, and indirectly obtained the major controlling factors of the gas content in the shale reservoir. His study result suggests that, fracture pore, matrix pore, Young's modulus and Poisson's ratio are major geological factors that control the shale gas productivity, and the interval with high shale gas productivity exhibits evidently high Young's modulus and low Poisson's ratio. This study indirectly indicates that, gas content is closely related to two seismic petrophysical parameters, i.e., Young's modulus and Poisson's ratio. Altowairqi et al. (2015) carried out a systematic quantitative study of the influences of some parameters (e.g. TOC and gas content) on seismic elastic parameters under the formation pressure through a measurement with artificial rock samples. The study results suggest that, P-wave velocity, S-wave velocity and density decrease significantly as TOC and gas content increase. Therefore, a quantitative relationship of gas content and TOC with P-wave velocity, S-wave velocity and density is established.
In recent years, many Chinese scholars have conducted feasibility study and argumentation of gas potential prediction for shale gas reservoir using seismic data, and obtained some positive effects in tests with actual data volume. Li and Zhang (2011) discussed the occurrence state of shale gas in reservoir, and analyzed the major factors that influence the gas content; he preliminarily stated the role of gas content in the integrated evaluation of the shale gas reservoir, but did not study the prediction method of gas content. Sun (2013) applied the seismic attribute analysis method to conduct a correlation analysis of extracted seismic attribute and gas content, and determined three attributes that are most sensitive to gas potential, i.e., average instantaneous frequency, arc length and average energy. In addition, she established a prediction model for gas content in the shale reservoir in the study area using the multiple stepwise regression method, allowing for prediction of gas content in the Silurian high-quality shale for a designed well. Although this method is convenient and efficient, its physical significance remains unclear and may yield multiple solutions. Liu et al. (2014) determined the lithological combination of high-quality shale interval in the Jurassic shale gas reservoir, the Jiannan region, and its seismic responses through a combination of drilling data and well log data, used the waveform classification technique to predict the variations of lithology and lithofacies, applied the spectral attenuation technique to predict the gas potential of high-quality shale, and defined the gas prospects on the basis of classified waveform prediction result. Although this method is highly comprehensive, it provides a qualitative prediction of gas potential instead of attempting to specifically analyze the spectral responses of the shale gas reservoir. Guo et al. (2015) suggested the density as the most sensitive parameter to gas content through a cross-plot analysis of core tested gas content and geophysical elastic parameters, built a mathematical model between gas content and density, computed the gas content data volume from the density volume obtained from pre-stack inversion, and obtained some positive effects in quantitative prediction of gas content. This method, however, applies the density parameter only to predict the gas content and hence is highly risky. But geophysical prospecting of sweet spots is just at its beginning and thus has not provided enough information for the deployment of horizontal well drilling. In our study, firstly, using the method of well-logs interpretation to get key evaluation parameters of shale reservoir at the well point, and to study the distribution and variation of shale reservoir in vertical, in this way we can determine the distribution of sweet spots in longitudinal direction.
Tectonic and sedimentary background
Sichuan Basin covering an area of 1,180,000 km2 and it is the largest petroliferous basin in China (Zhu et al., 2006; Zhang et al., 2008b; Dai et al., 2015). It is surrounded by Daloushan, Dabashan, Micangshan and Longmenshan orogenic belts. It includes 6 tectonic units, i.e. Chuandong high-steep fold belt, Chuanbei low-flat fold belt, Chuanxi low-steep fold belt, Chuanzhong flat fold belt, Chuannan low-steep fold belt and Chuandong high-steep fold belt (Chen et al., 2017b). WY block lies in Chuannan low-steep fold belt, as shown in Figure 1.
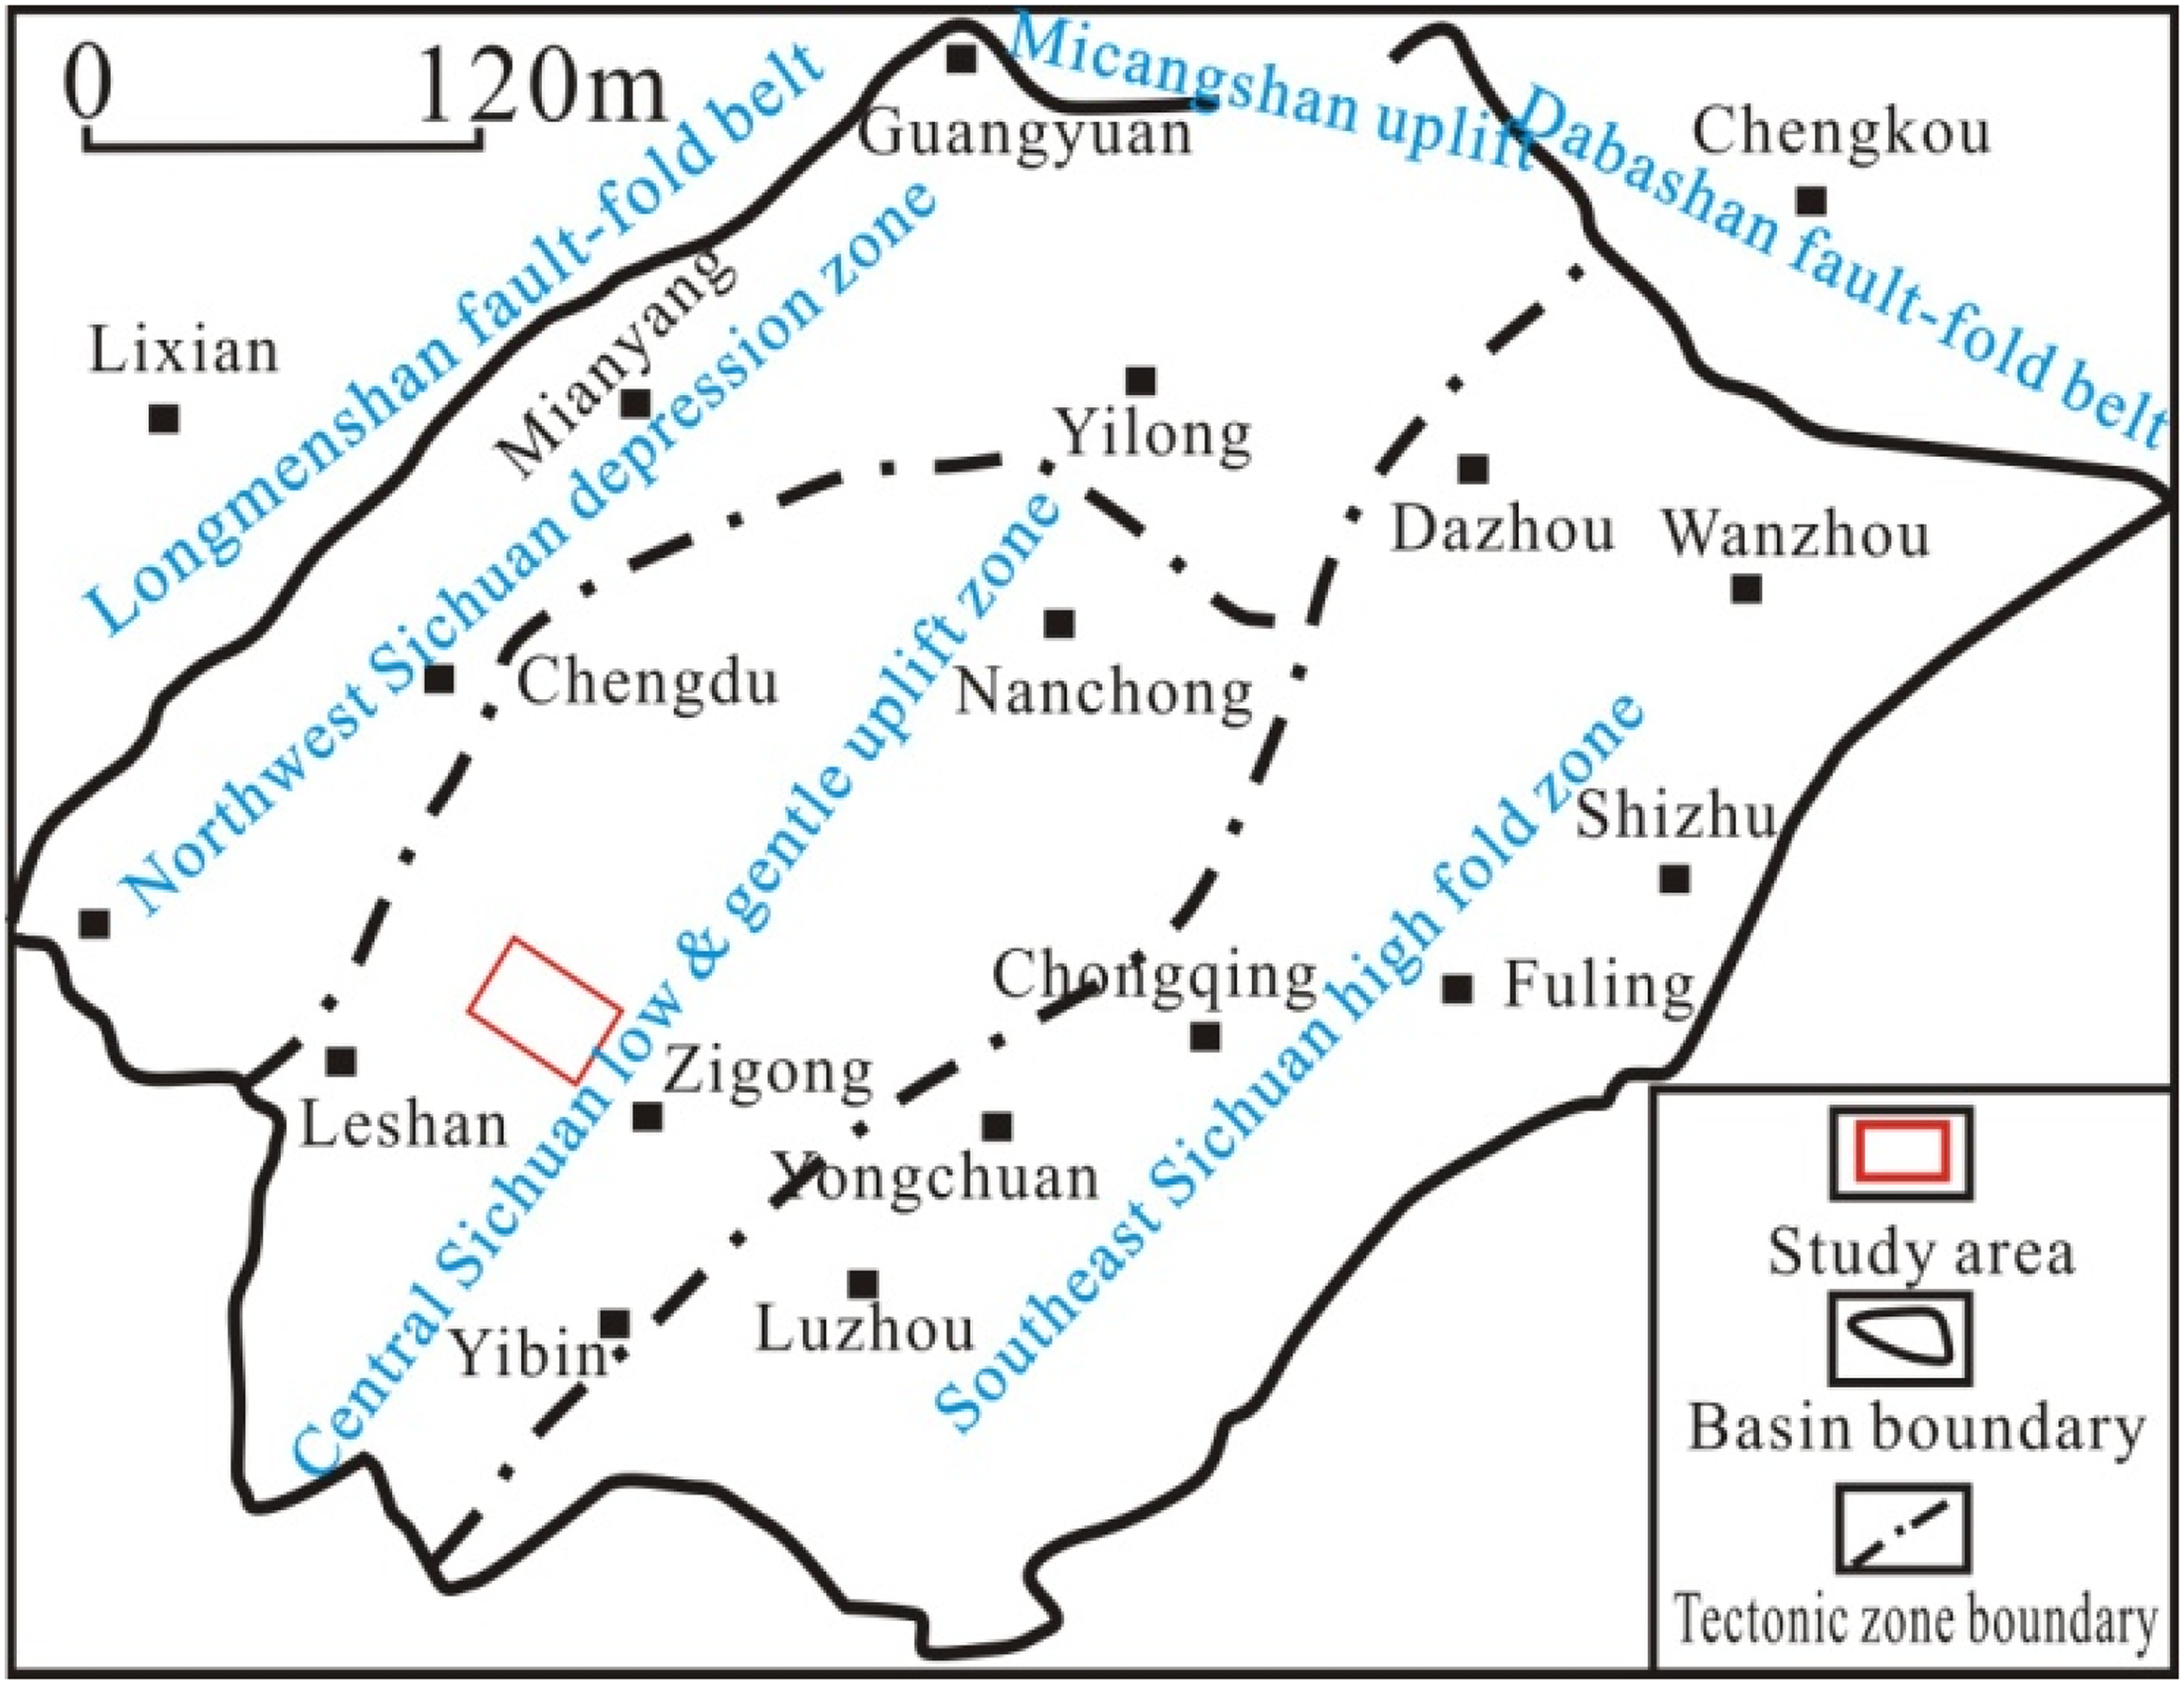
Location of the study area and WY block.
Two suites of high-quality shale exist in the Lower Cambrian Qiongzhusi Formation and the Lower Silurian Longmaxi Formation (Wang et al., 2016). The latter is studied in this paper. The Lower Silurian Longmaxi black shale and overlying Liangshan limestone constitute a good reservoir-seal assemblage (Zhang et al., 2008a; Liu and Wang, 2012). The entire Longmaxi Formation has abundant graptolite of about 500 m thick throughout the block, which is a product of deep-water shelf deposition indicating a strong reducing environment (Chen et al., 2016). The Longmaxi Formation comprises two distinctive sections as shown in Figure 2. The upper section, i.e. the Long-2 Member, is composed of some siliceous streaks and limestone with TOC content less than 2%. The lower section, i.e. the Long-1 Member, encompasses carbonaceous shale and black shale rich in lamellae, with TOC content higher than 2% (Xiong et al., 2015). The Long1 Member is subdivided into two sub-members as per TOC content, i.e. Long-11 and Long-12.
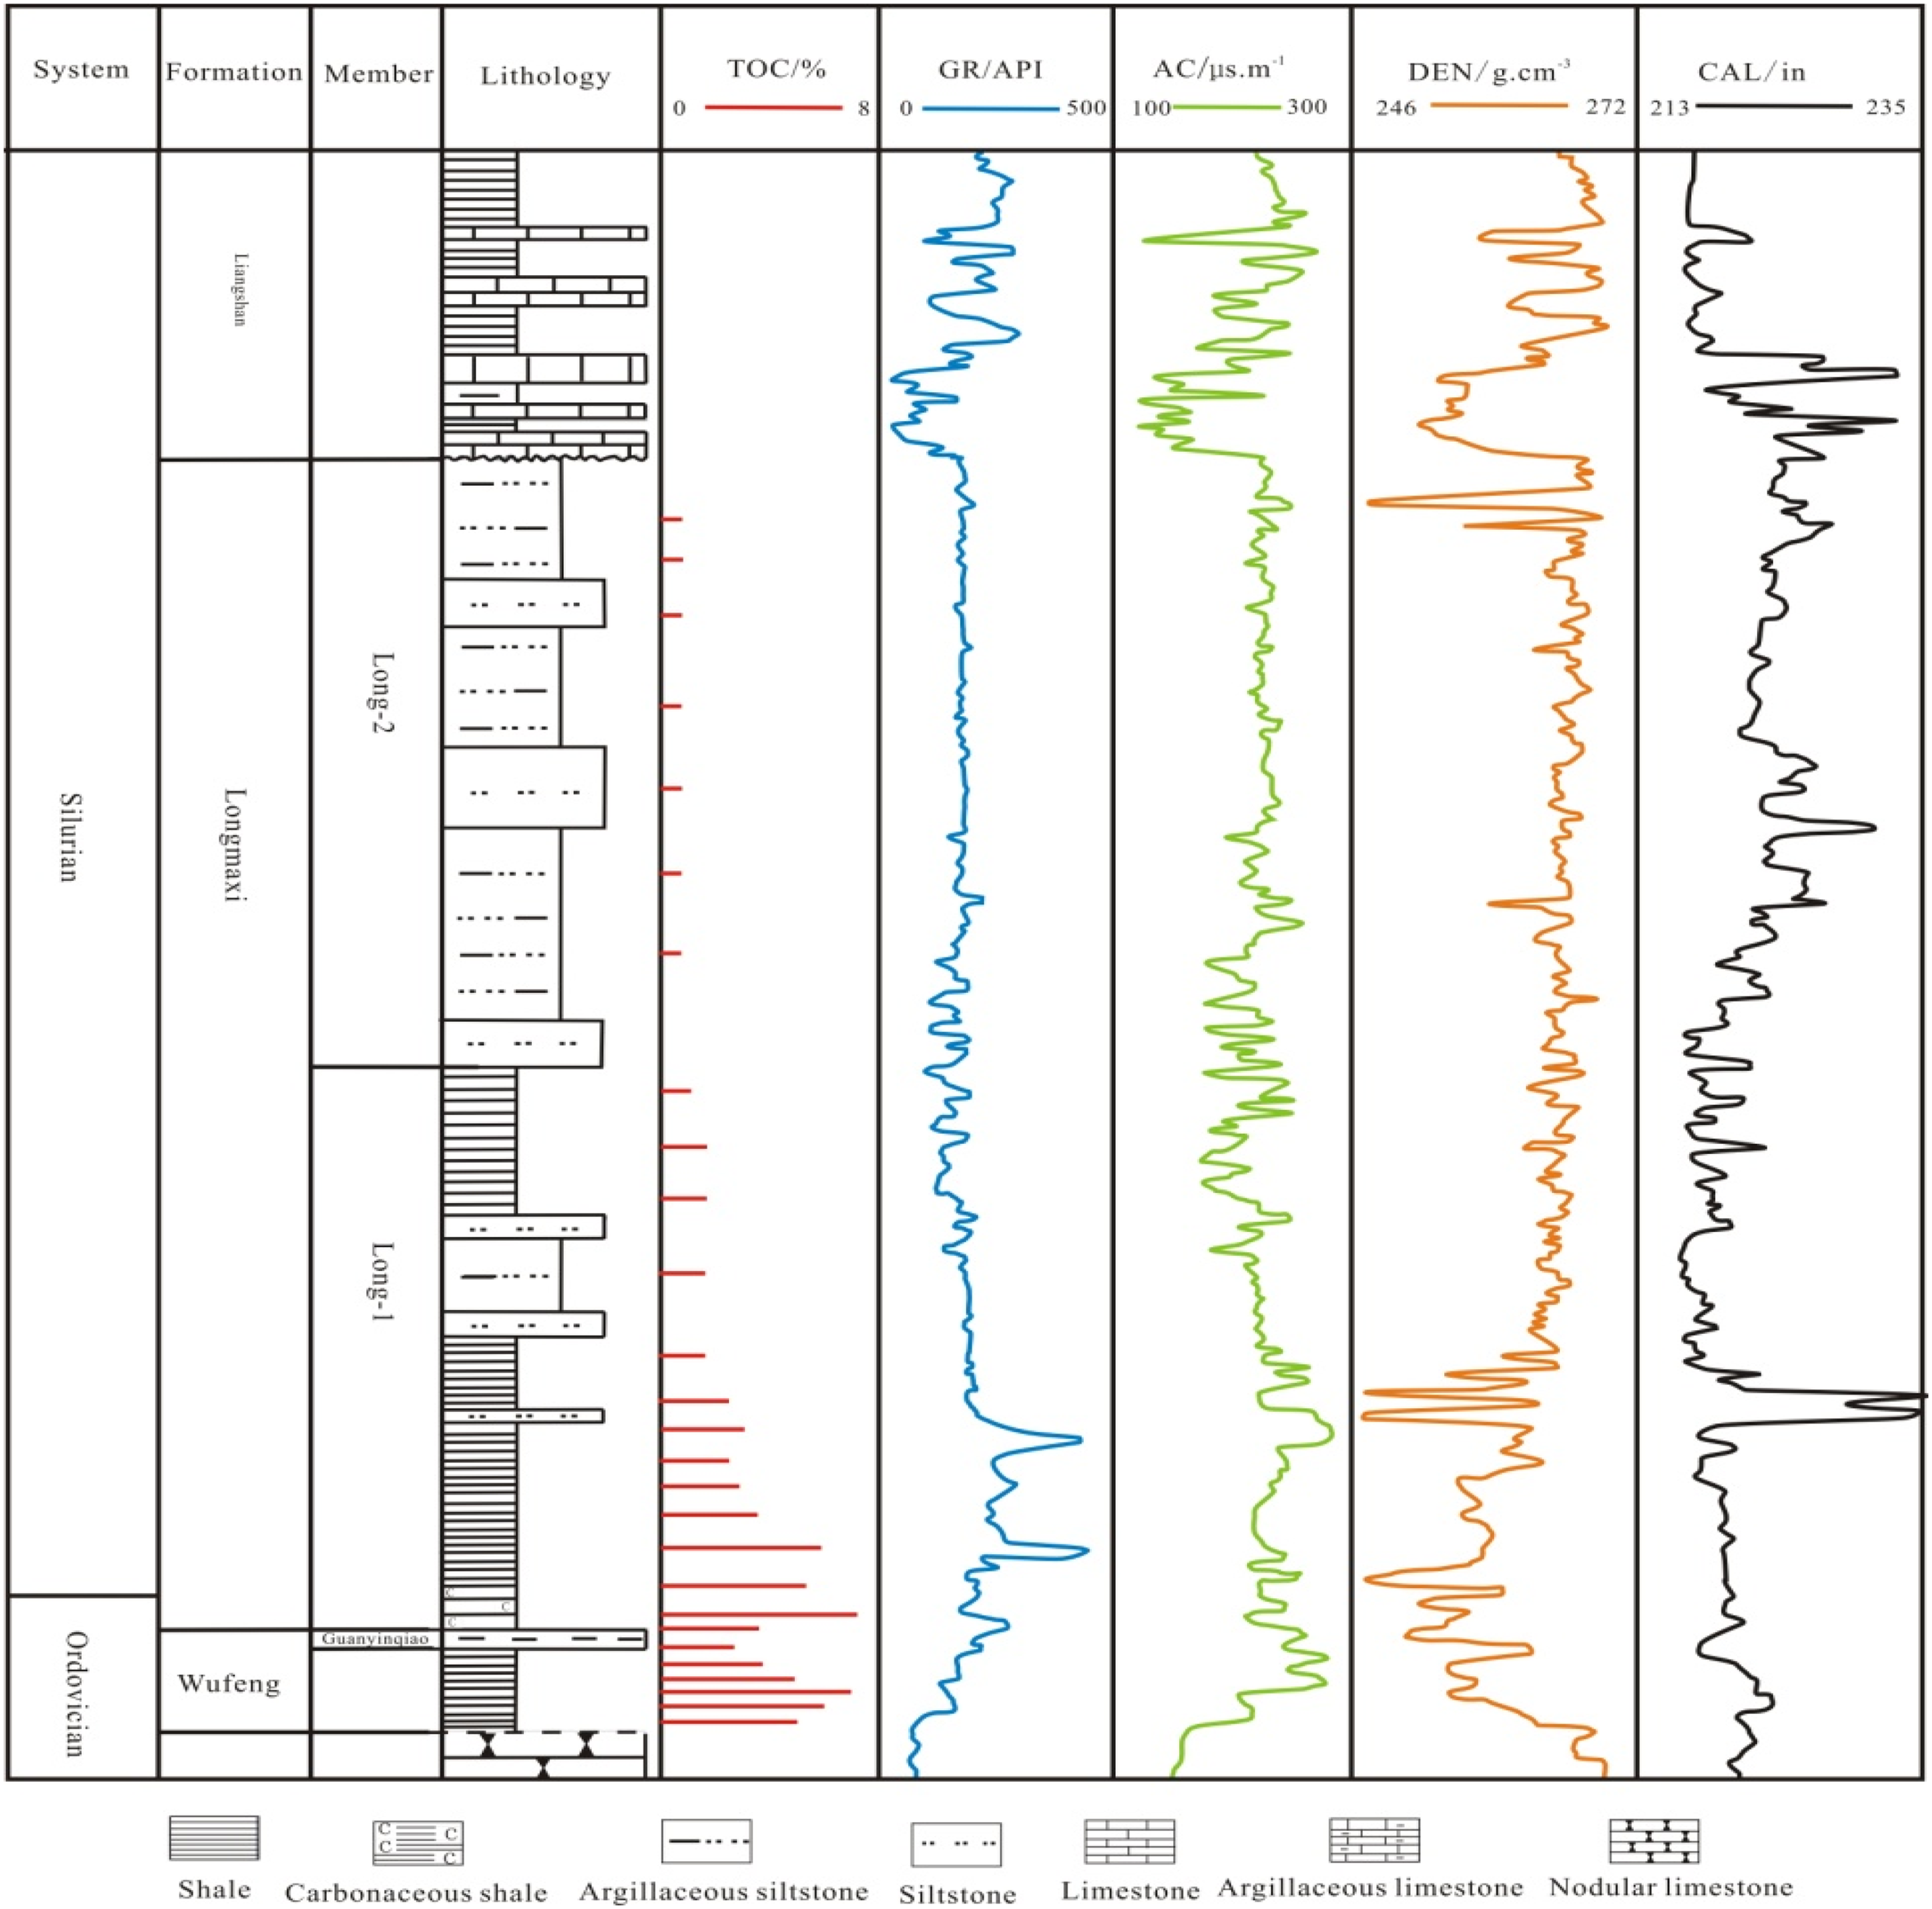
Lithologic profile and conventional well logs of longmaxi formation in WY block.
Characteristics of sweet spot
Features of the longmaxi formation shale gas reservoir
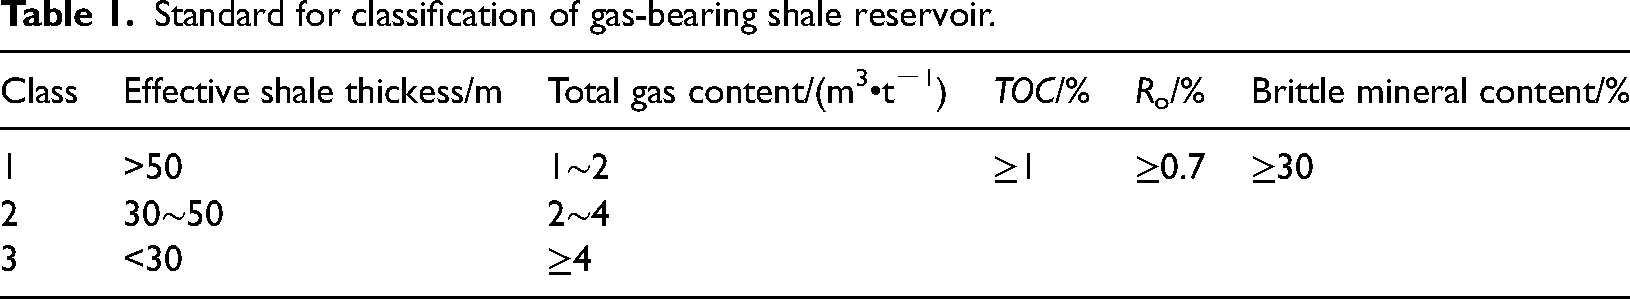
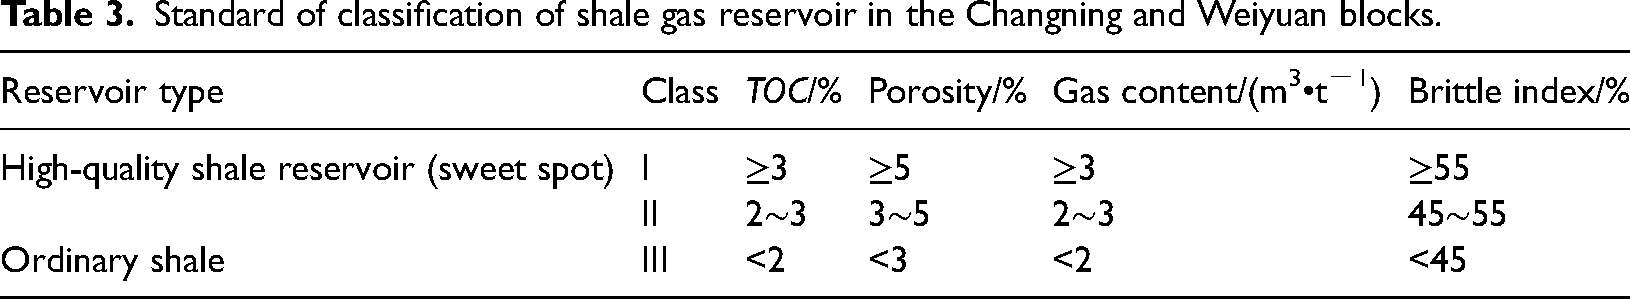
Shale gas sweet spots refer to reservoirs with moderate burial depth, high organic carbon content, high maturity, well-developed natural fractures, good preservation conditions, high gas content, and easy fracturing to form a complex fracture network. When the sweet spots are distributed in a wide area they are forming a sweet spot area. The “Technical Specification for Calculation and Evaluation of Shale Gas Resources Reserves issued by the Ministry of Land and Resources stipulates that the evaluation parameters of shale gas reserves include 5 indicators: effective shale thickness, total gas content, TOC, organic material maturity (Ro) and brittle mineral content (Yu, 2012) (Table 1). According to these indicators, gas shale reservoirs can be divided into three types. The seismic method can be used to predict the spatial and regional distribution of effective shale thickness, TOC and brittle mineral content. WY production practice shows that porosity and formation pressure have significant control over the sweet spot distribution and should be included in the evaluation index.
Standard for classification of gas-bearing shale reservoir.
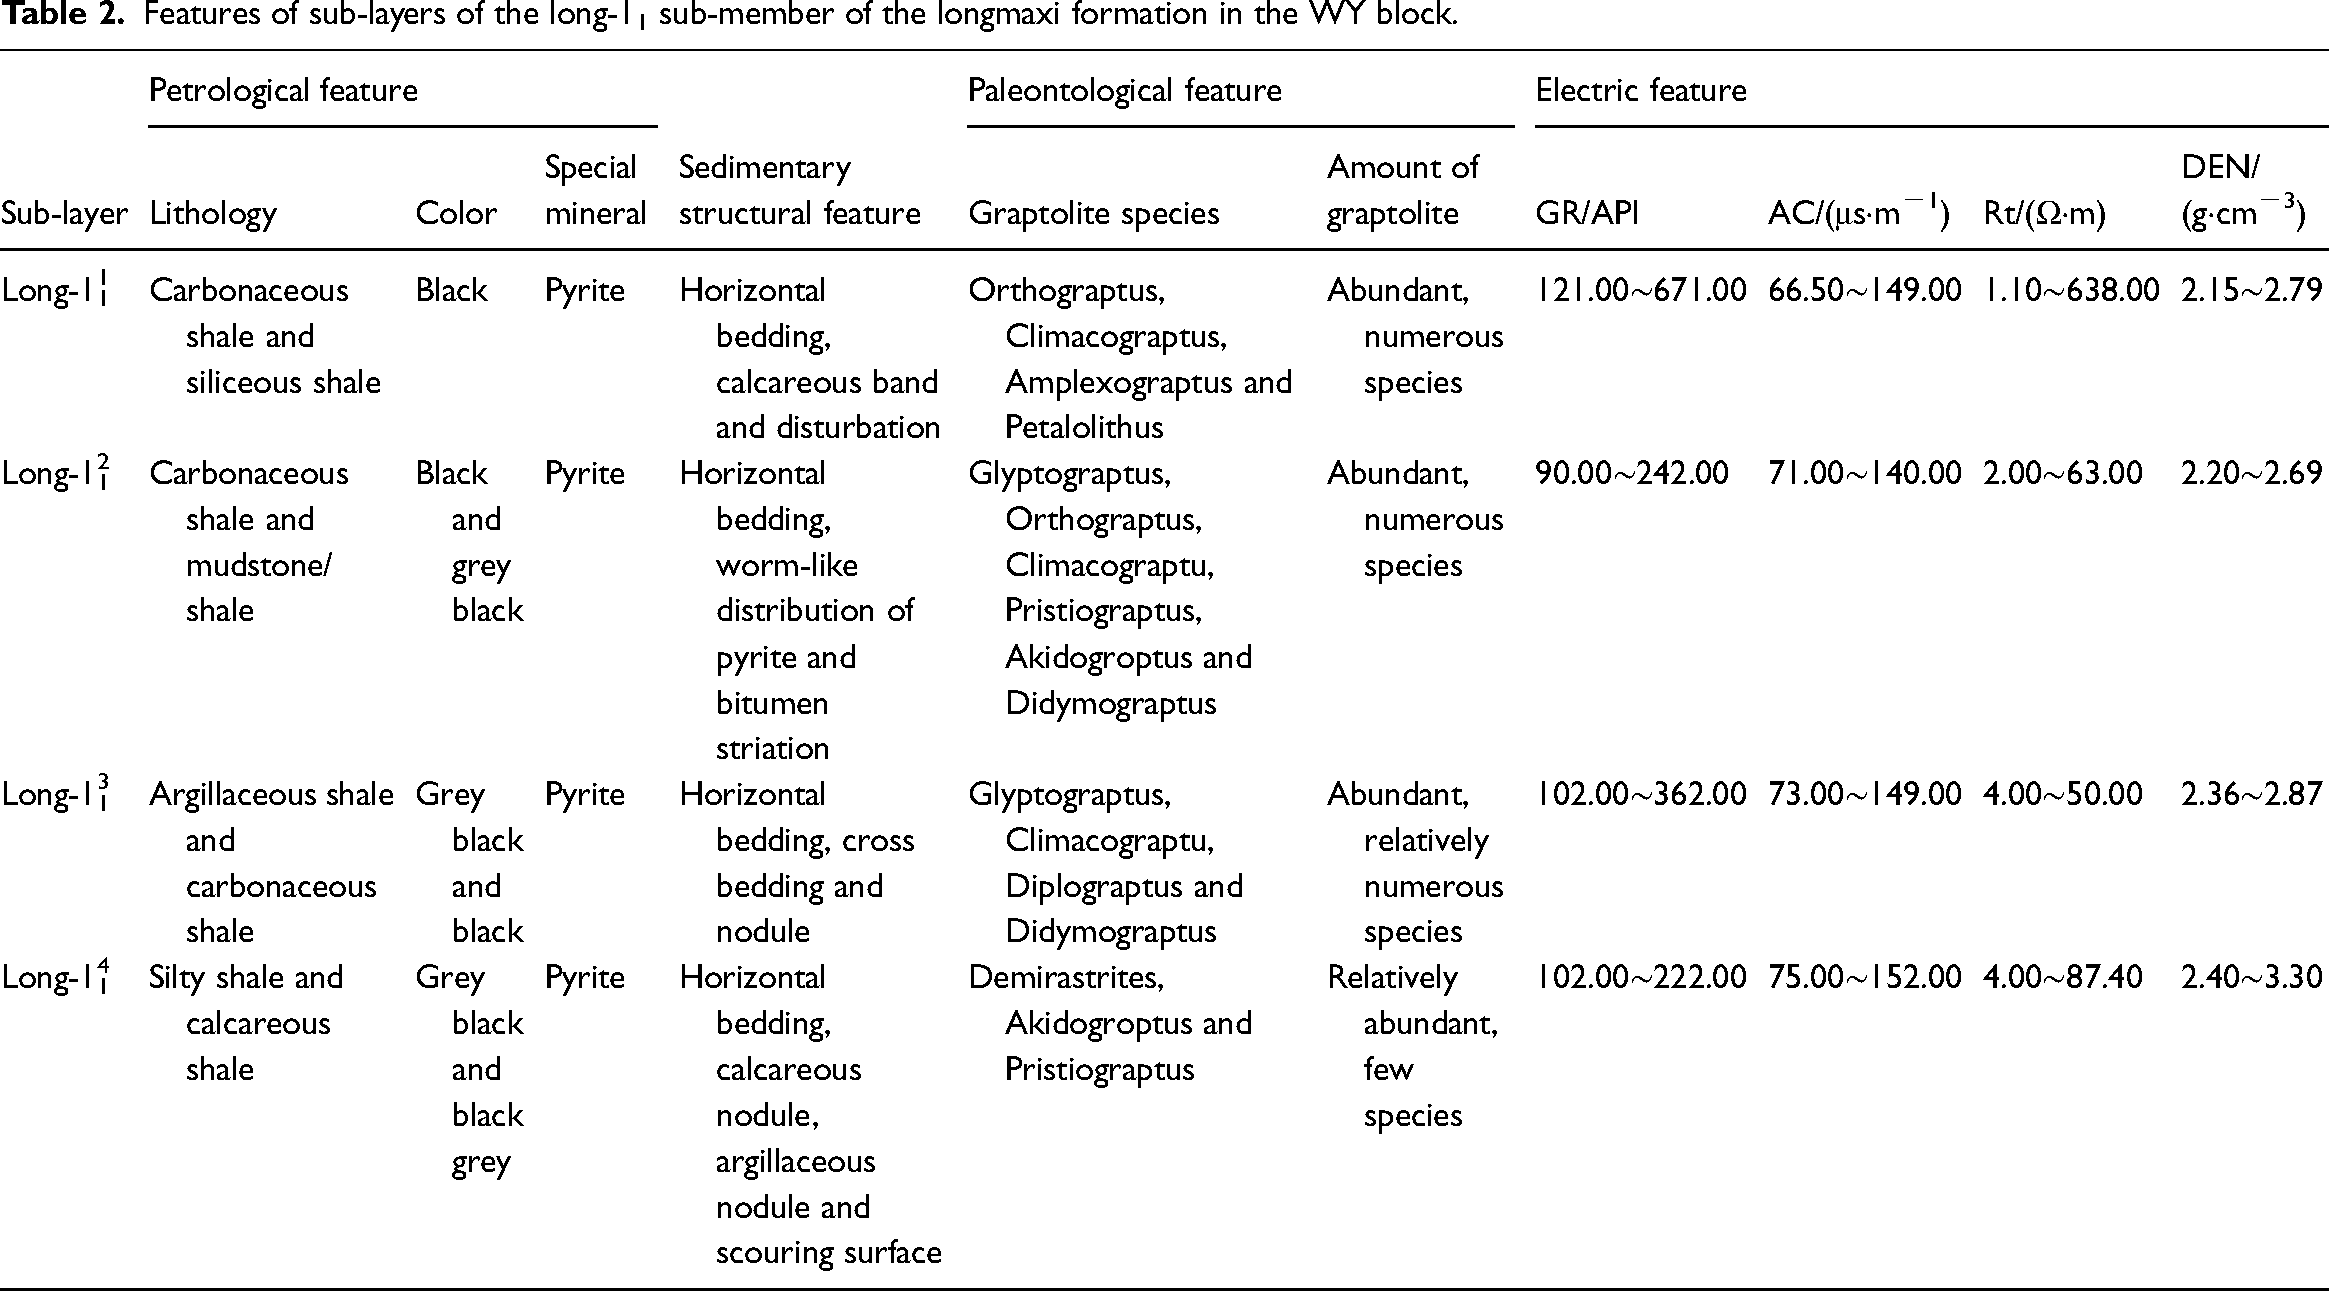
Under the above-mentioned standard framework, the reservoir in the study area can be divided into several sub-layers based on petrology, sedimentary structure, paleontology and electrical data. The Long-1 member is divided into the Long-11and Long-12 sub-members. The Long-11 sub-member is subdivided into the Long-111, Long-112, Long-113 and Long-114 sub-layers (Table 2).
Features of sub-layers of the long-11 sub-member of the longmaxi formation in the WY block.
Basis for quantitative seismic prediction of sweet spot
The practice of shale gas development in North America shows that the TOC of shale has a significant control effect on the total gas content of shale reservoirs. Therefore, TOC is considered to be one of the most important indicators for shale gas reservoir evaluation. According to the classification standards of shale gas reservoirs in various large shale gas fields and the characteristics of shale gas reservoirs in this area, the shale gas reservoirs in the study area are divided into 3 categories, mainly according to their storage TOC, followed by total gas content, effective pores and brittle mineral content. Type I reservoirs are gas-rich shale with TOC not less than 3%; Type II reservoirs have TOC of 2% to 3%; Type III reservoirs are ordinary shale with TOC less than 2%. For Type I and Type II shale gas reservoirs, TOC is higher than 2%, which are key development targets and high-quality shale gas reservoirs, it is the sweet spot (Ross and Bustin, 2008; Chen et al., 2012). The classification criteria are shown in Table 3.
Standard of classification of shale gas reservoir in the Changning and Weiyuan blocks.
The results of seismic rock physical analysis show that: (1) With the increase of TOC, the elastic parameters of shale gas reservoirs (such as Vp-Vs, density, impedance, Poisson's ratio and Vp/Vs) decrease significantly; (2) The elastic parameter values of shale gas reservoirs (including types I, II, and III) and surrounding rock (limestone) are quite different, but there is overlap between different types of shale gas reservoirs. Although seismic methods provide opportunities for qualitative prediction of reservoirs and non-reservoirs, there are large errors in the prediction of reservoir quality. Figure 3 shows the analysis of geophysical elastic parameters of the Longmaxi shale gas reservoir and the limestone at its base in WY block.
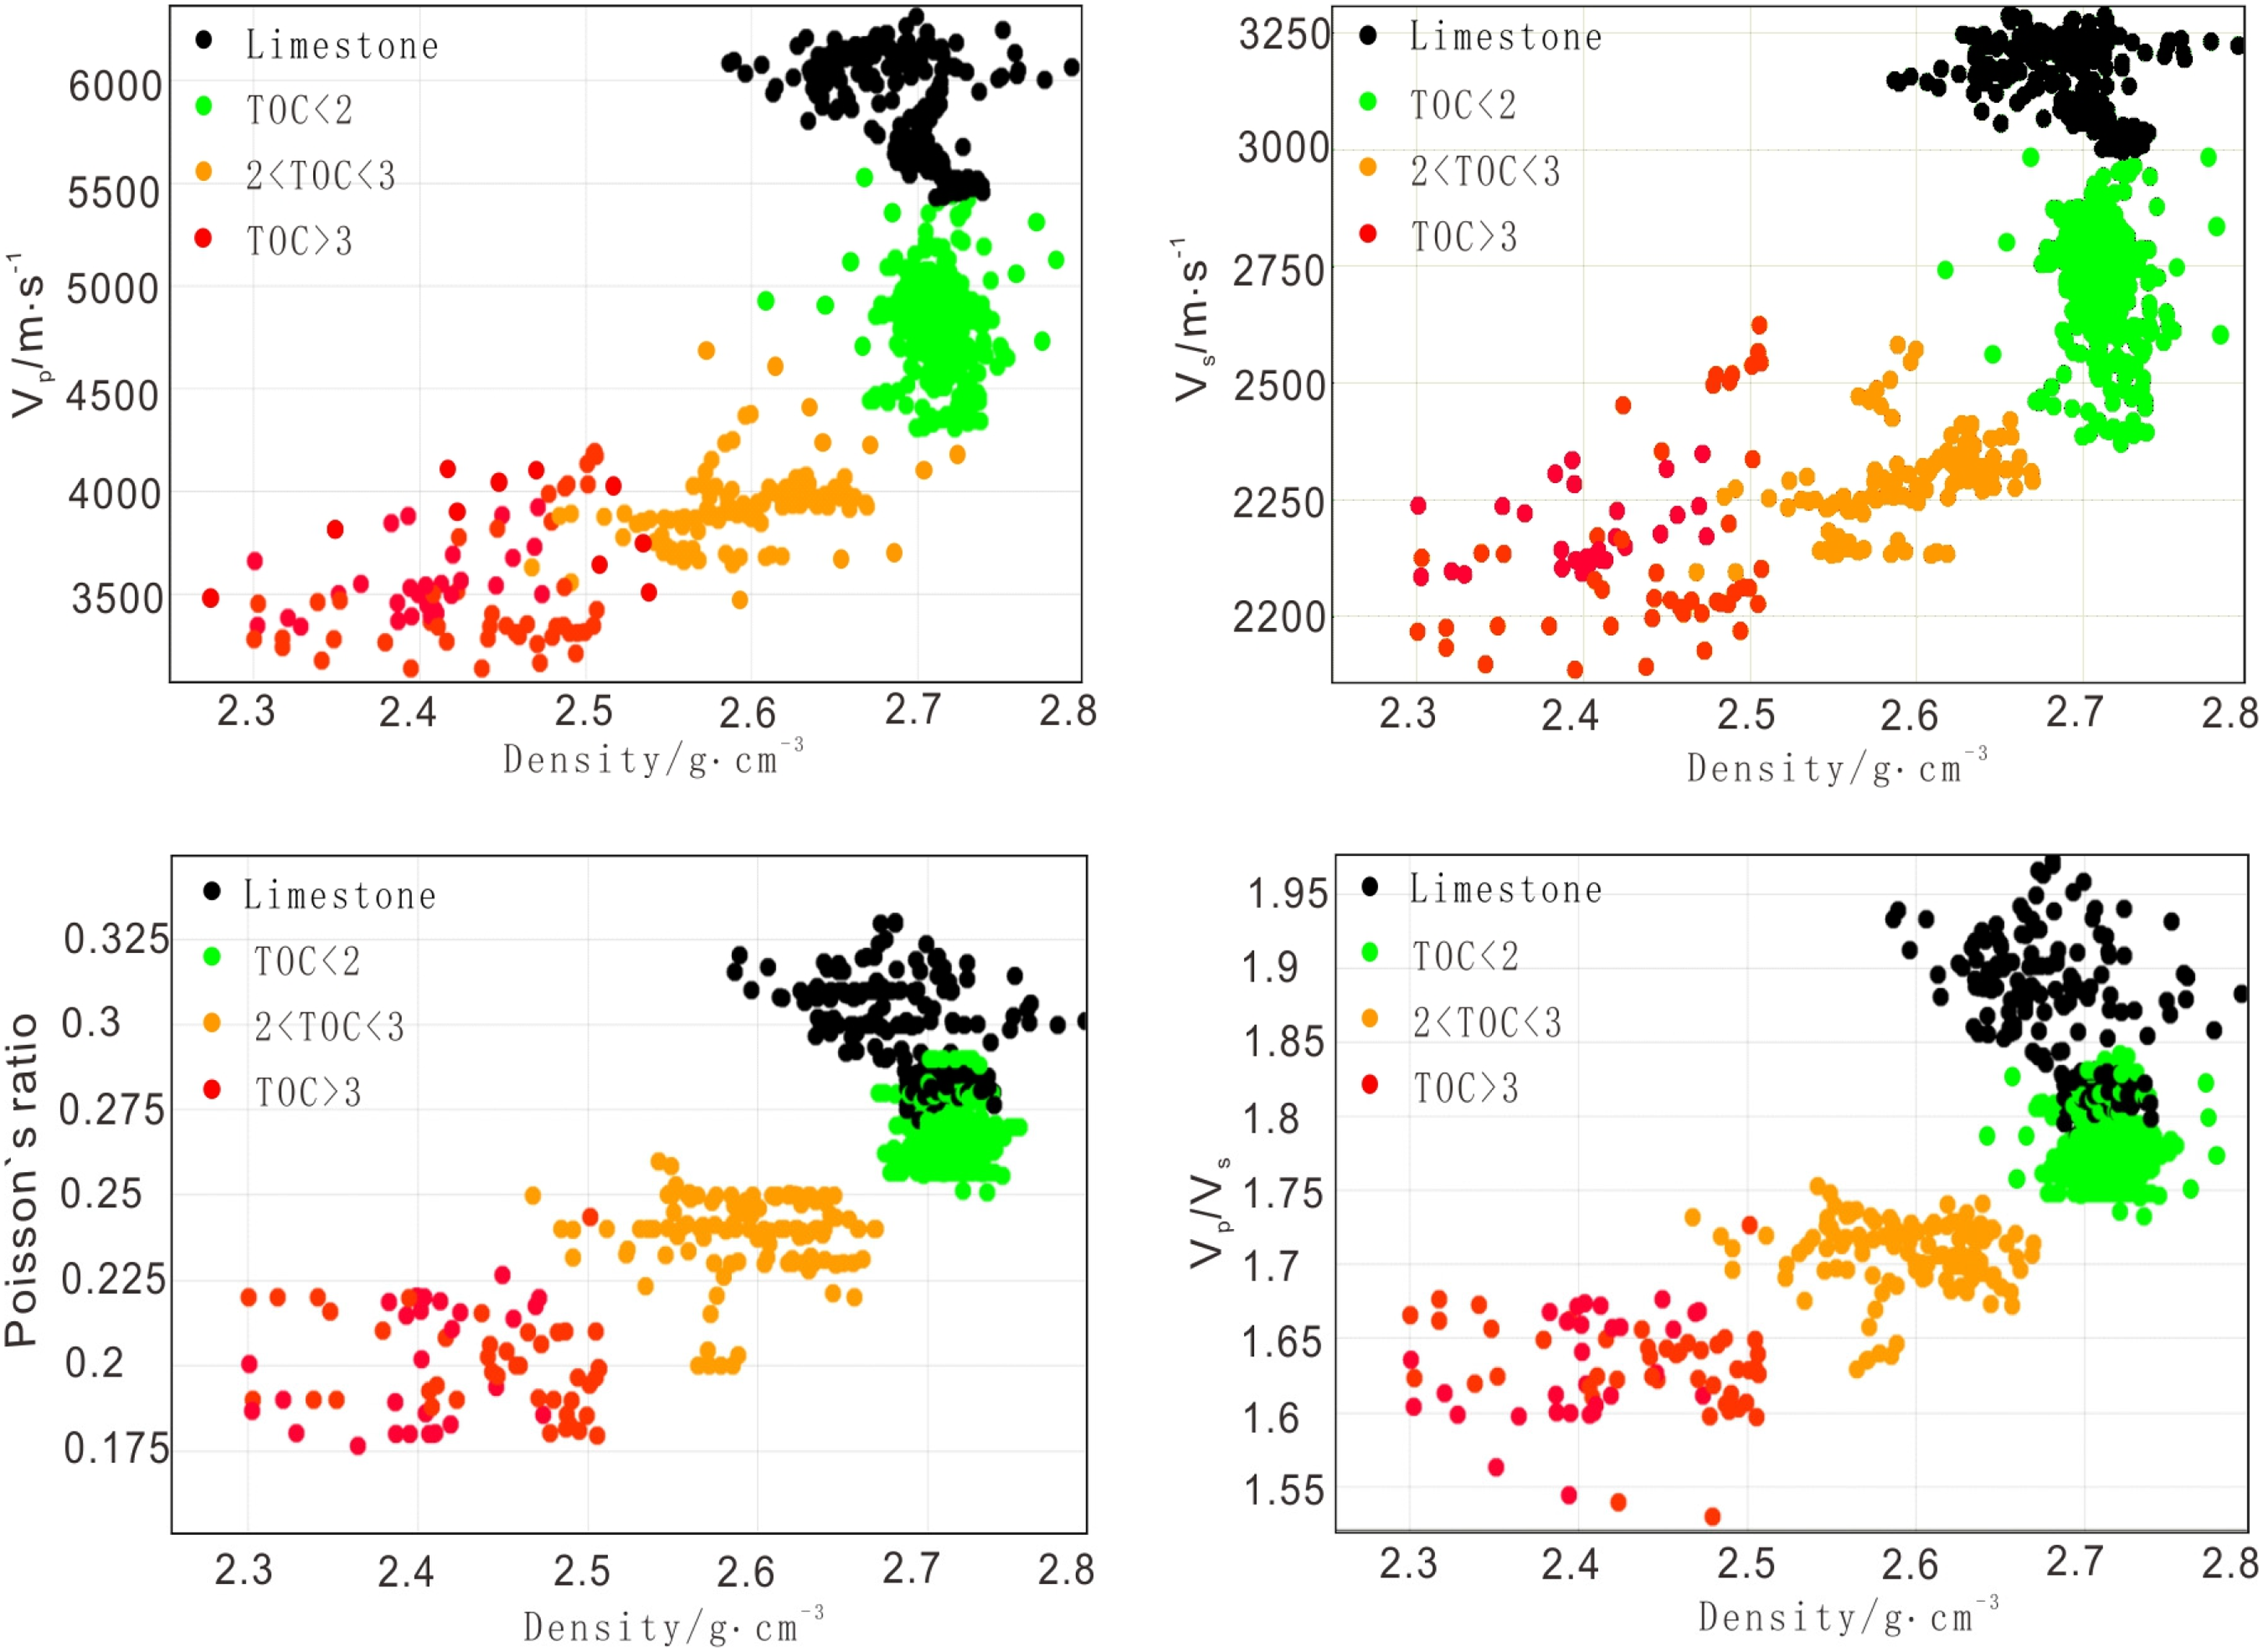
Seismic rock physical analysis of shale gas reservoirs.
The relationship between TOC and gas content is different under different maturity conditions. Figure 4(a) shows the relationship between TOC and gas content of Barnett shale in the United States. Barnett shale has a relatively low thermal maturity, the TOC has a good linear and positive relationship with gas content. Therefore, TOC can be used directly to calculate the gas content. Figure 4(b) shows the relationship between TOC and gas content in our research block. The correlation between TOC and gas content is poor, the TOC cannot be used to quantitatively predict high-quality gas-rich shale reservoirs. In the next section, the author will use Fuzzy neural network to predict the shale gas sweet spots comprehensively and quantitatively.
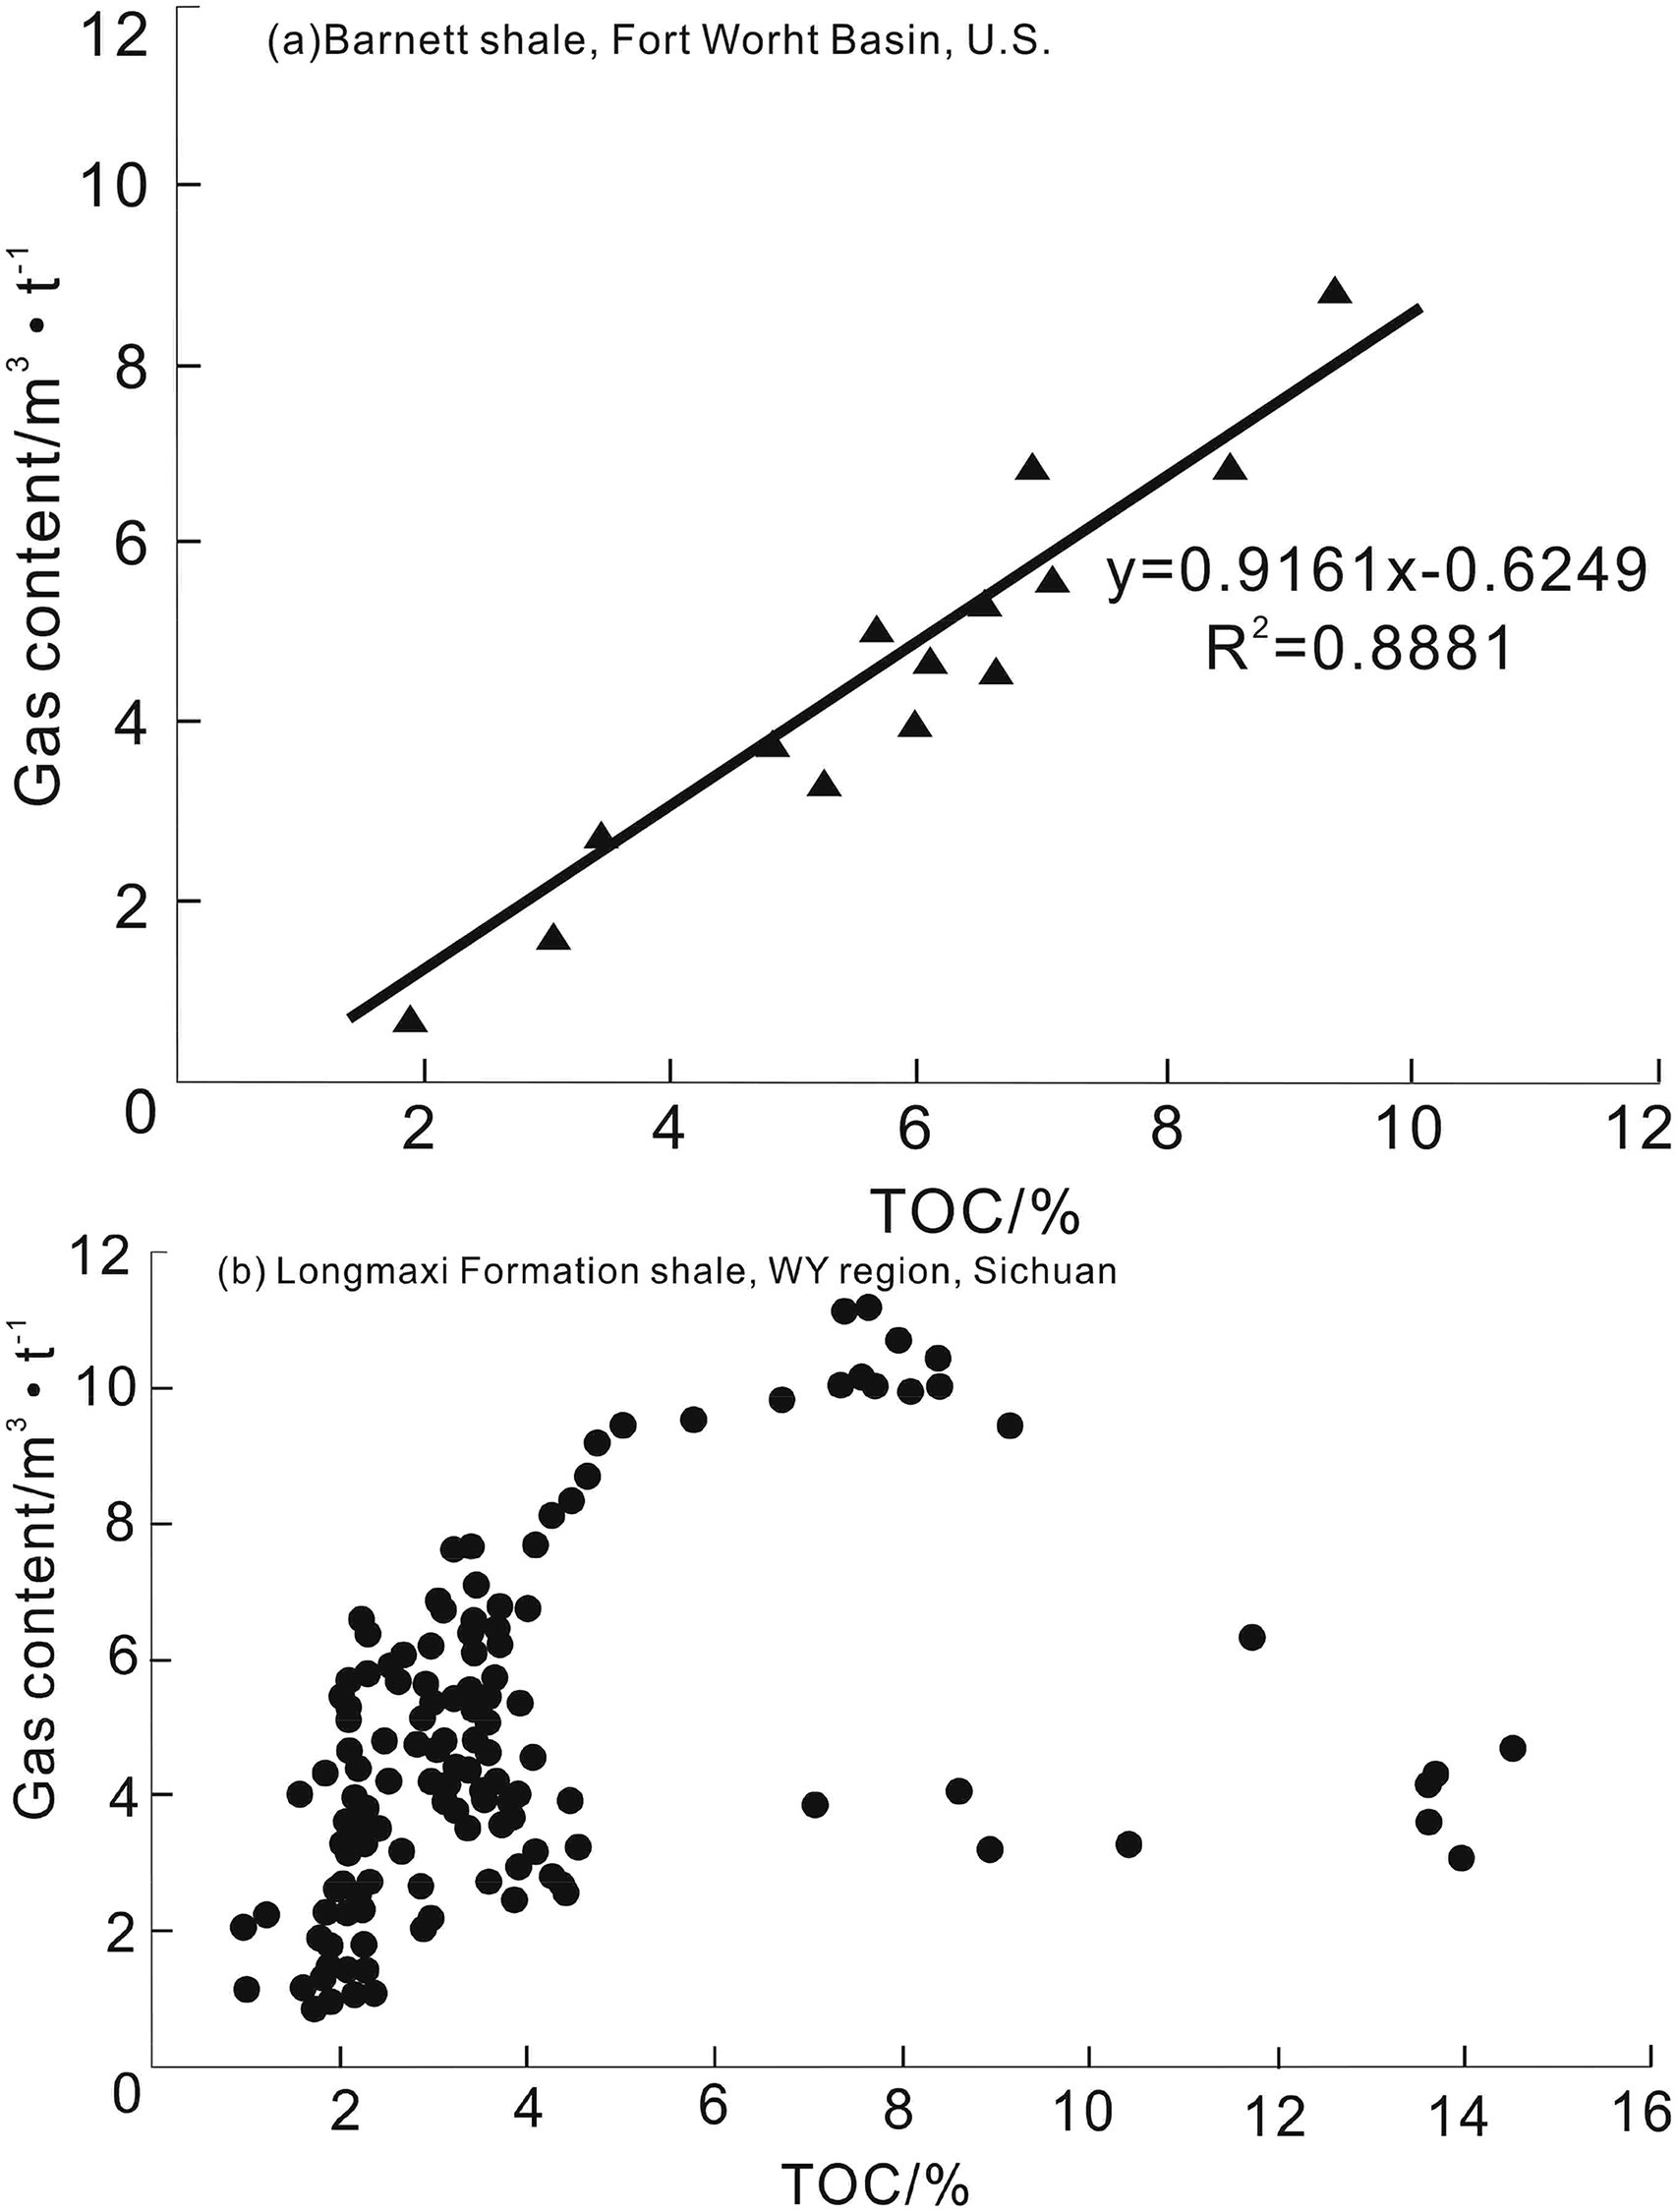
Relation of TOC and gas content of shale gas reservoirs of different maturations.
The prediction method of sweet spot
The workflow
First of all, we must determine the characteristics of sweet spot geophysical elastic parameters and the most sensitive elastic parameters to sweet spots based on the results of the aforementioned rock physics analysis. At the same time, it is necessary to establish the quantitative relationship between elastic parameters such as P-wave velocity and sweet spots key evaluation parameters such as TOC content to provide a basis for sweet spots prediction. Immediately afterwards, simultaneous pre-stack seismic inversion is carried out to acquire sensitive elastic parameters such as P-wave velocity, S-wave velocity, and density (Arcangelo et al., 2011). In this process, seismic data and logging data are fully integrated. These elastic parameters can be converted into sweet spots evaluation parameters such as TOC content through the quantitative relationship established by rock physical analysis. Finally, the fuzzy neural network is used for comprehensive evaluation of sweet spots. In this process, the key sweet spots evaluation parameters obtained in the previous step and the yield of the well are used as inputs. The dividing standard of the sweet spots in production process is used as a constraint for machine learning. Through the learning of the fuzzy neural network, the weight coefficient of each evaluation parameter can be finally obtained. Through multiple iterations, these weight coefficients can be optimized. In this way, the key evaluation parameters, constraints and the weight coefficients of the key evaluation parameters together form the comprehensive sweet spot evaluation model.
Pre-stack simultaneous inversion
Precise prediction of key parameters, such as reservoir thickness, TOC, porosity and brittle index, relies on pre-stack seismic inversion. Although pre-stack inversion technique has been applied broadly to reservoir prediction in recent years, traditional pre-stack inversion is based primarily on partially stacked data volume and has strong anti-noise ability and good stability. However, the AVO information in original seismic pre-stack gather would be lost during the stacking process, leading to the low precision of inversion of elastic parameters. The full gather-based pre-stack simultaneous inversion technique can maximally retain the AVO information in pre-stack gather, ensure the consistency of multiple kinds of elastic parameter inversion, enhance the reliability of inversion, and realize the optimum prediction of various evaluation parameters (Wang et al., 2013; Zhang et al., 2014; Su et al., 2016). This paper applies the full gather-based pre-stack simultaneous inversion technique to prediction of elastic parameters of shale gas reservoir in this region and acquires good results. The correlation result reveals that, the full gather-based pre-stack simultaneous inversion gives more detailed information, relies less on initial model and can better reflect the subsurface reservoir change than the traditional method.
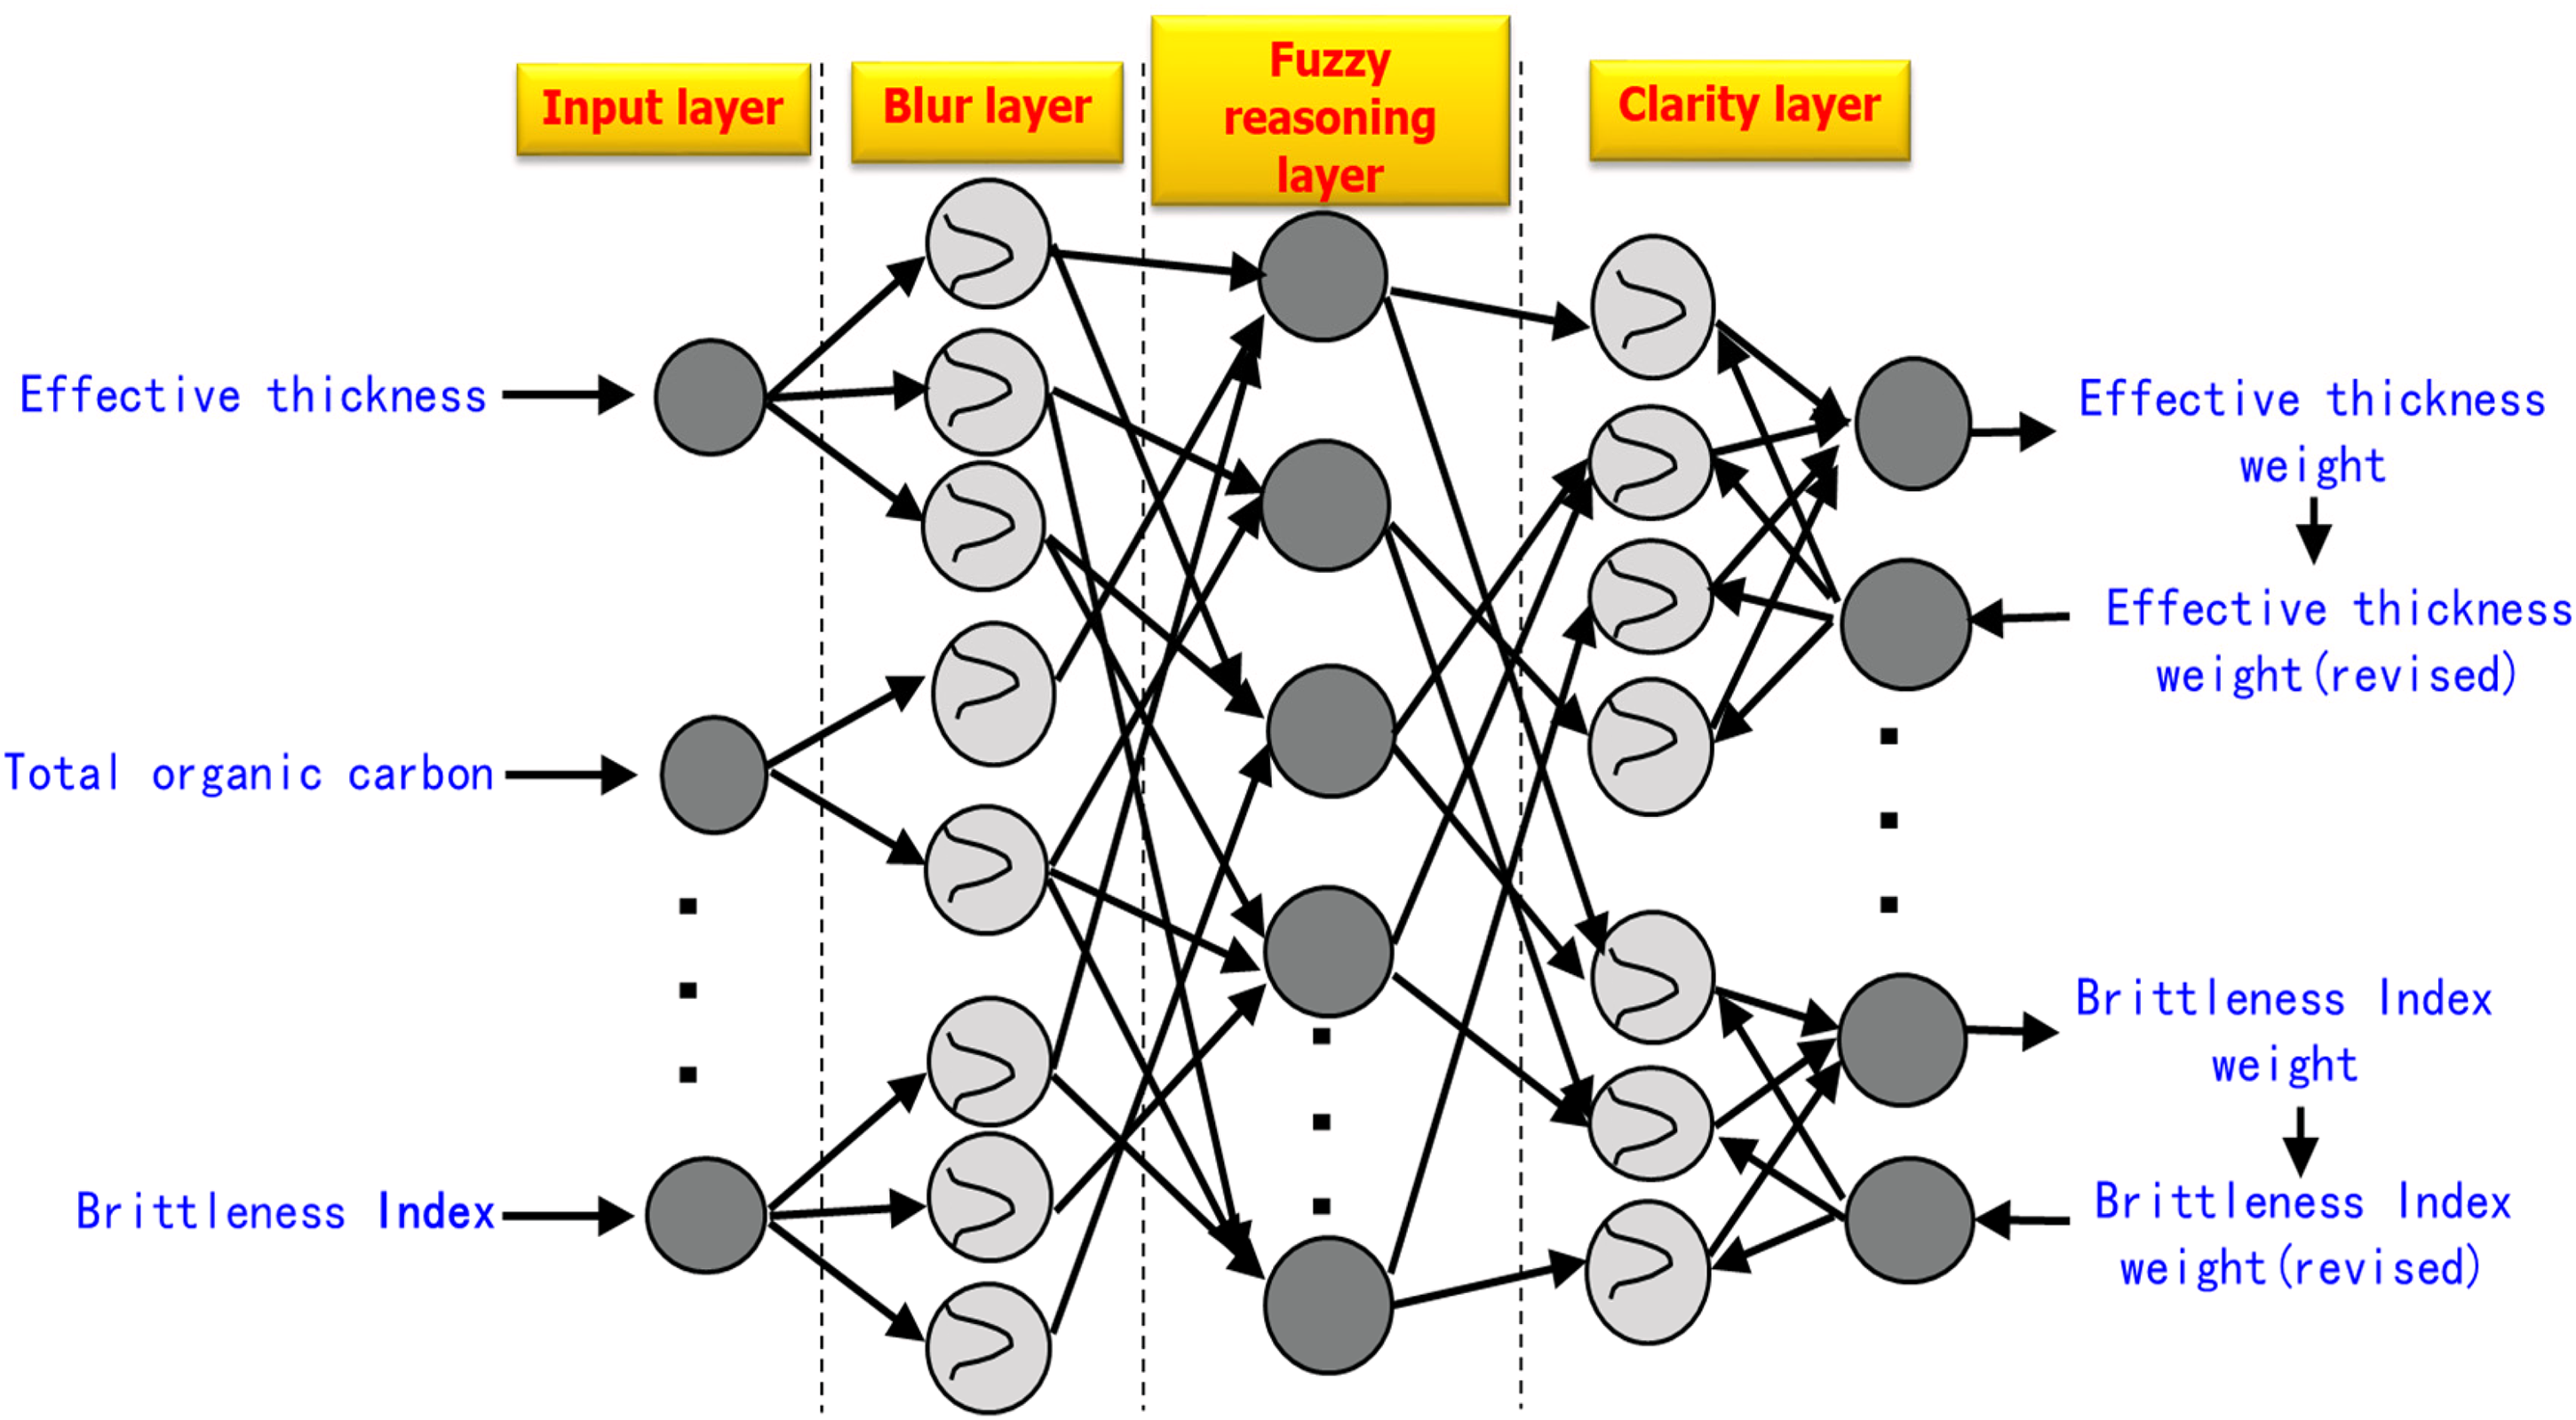
The structure of fuzzy neural network.
Fuzzy neural network
With the progress of mathematics and computing technology, many problems with clear definitions and structures have developed rapidly. However, too many data acquisition methods and sources lead to the unclear boundary between the data. And it is lack of sufficient theories and methods for quantitative description. The comprehensive prediction and evaluation of sweet spot in shale gas reservoir is a typical problem. It is mainly controlled by characteristics of sweet spot, single-index calculation methods, data sources, complex and coupled relationships among various factors, unquantifiable control degree of various factors on sweet spot, and ambiguous boundaries. Fuzzy neural network technology provides an effective method to solve this kind of problem. This method integrates the powerful structural knowledge expression ability of fuzzy logic reasoning and the powerful self-learning ability of neural network, effectively play an important role for solving the problems with their respective advantages and making up for their shortcomings (Ding et al., 2008; He 2011; Hu et al., 2015).
A fuzzy neural network is a learning machine that finds the parameters of a fuzzy system (i.e. fuzzy sets, fuzzy rules) by exploiting approximation techniques from neural networks. Fuzzy system and neural network are each a nonlinear input-output mapping. Therefore, fuzzy system can be represented by an equivalent neural network. According to the structure of the fuzzy system, the neural network with equivalent structure is determined. It means that each layer and node of the neural network corresponds to a part of the fuzzy system. Therefore, the neural network is different from the conventional black box type, and all its parameters have physical significance. The neural network obtained by equivalent transformation of fuzzy system is called fuzzy neural network (FNN). The fuzzy neural network is completely equivalent to the fuzzy system at the input and output ports, and its internal weights and node parameters can be modified by neural network learning.
Neural networks can only come into play if the problem is expressed by a sufficient amount of observed examples. These observations are used to train the black box. On the one hand no prior knowledge about the problem needs to be given. On the other hand, however, it is not straightforward to extract comprehensible rules from the neural network's structure. On the contrary, a fuzzy system demands linguistic rules instead of learning examples as prior knowledge. Furthermore the input and output variables have to be described linguistically. If the knowledge is incomplete, wrong or contradictory, then the fuzzy system must be tuned. Since there is not any formal approach for it, the tuning is performed in a heuristic way. This is usually very time consuming and error-prone. It is desirable for fuzzy systems to have an automatic adaption procedure which is comparable to neural networks.
Fuzzy neural network is to construct fuzzy system hierarchically according to the operation steps of fuzzy logic system, and then start to learn with neural network. However, it does not change the basic functions of fuzzy logic system, such as fuzzification, fuzzy reasoning and defuzzification. Fuzzy neural system is a fuzzy logic system trained by learning algorithm. The learning algorithm is derived from neural network, and the learning process can be based not only on data, but also on knowledge. Fuzzy neural system can be regarded as an unknown number determined by training data. Fuzzy rules represent fuzzy samples and can be regarded as a fuzzy model of training data. Because the design parameters of fuzzy system such as rule set and membership function can only be selected by design experience, it is difficult to design and adjust automatically. Therefore, using the learning method of neural network, the design parameters of fuzzy system are designed and adjusted automatically according to the input and output learning samples, so as to realize the self-learning and adaptive function of fuzzy system.
The network structure is shown in Figure 5. The fuzzy neural network is divided into five layers. It is designed according to the working process of fuzzy system. It is a fuzzy reasoning system realized by neural network. The first layer is the input layer, and the number of nodes is the number of input variables. And the second layer is the membership function layer of input variables, which realizes the fuzziness of input variables. The third layer is the “and” layer, and the number of nodes is the product of the number of fuzzy sets of each input variable (that is, the number of rules). The fourth layer is the “or” layer, and the number of nodes is the number of fuzzy division of output variables. Each node is a fuzzy partition (i.e. fuzzy set) of the output variable, and its output is the membership function value of each fuzzy degree of the output variable. The fifth layer is the anti-fuzzy layer, which is also called the clear layer. The number of nodes in this layer is the number of output variables. This layer realizes the clarity operation. The membership value of each fuzzy set of the output variable obtained by fuzzy rule reasoning (the output of each node in the fourth layer) is converted into the accurate value of the output variable. This is a typical FNN structure, which corresponds to each part of the fuzzy system in function, and it is the fusion of neural network to fuzzy system.
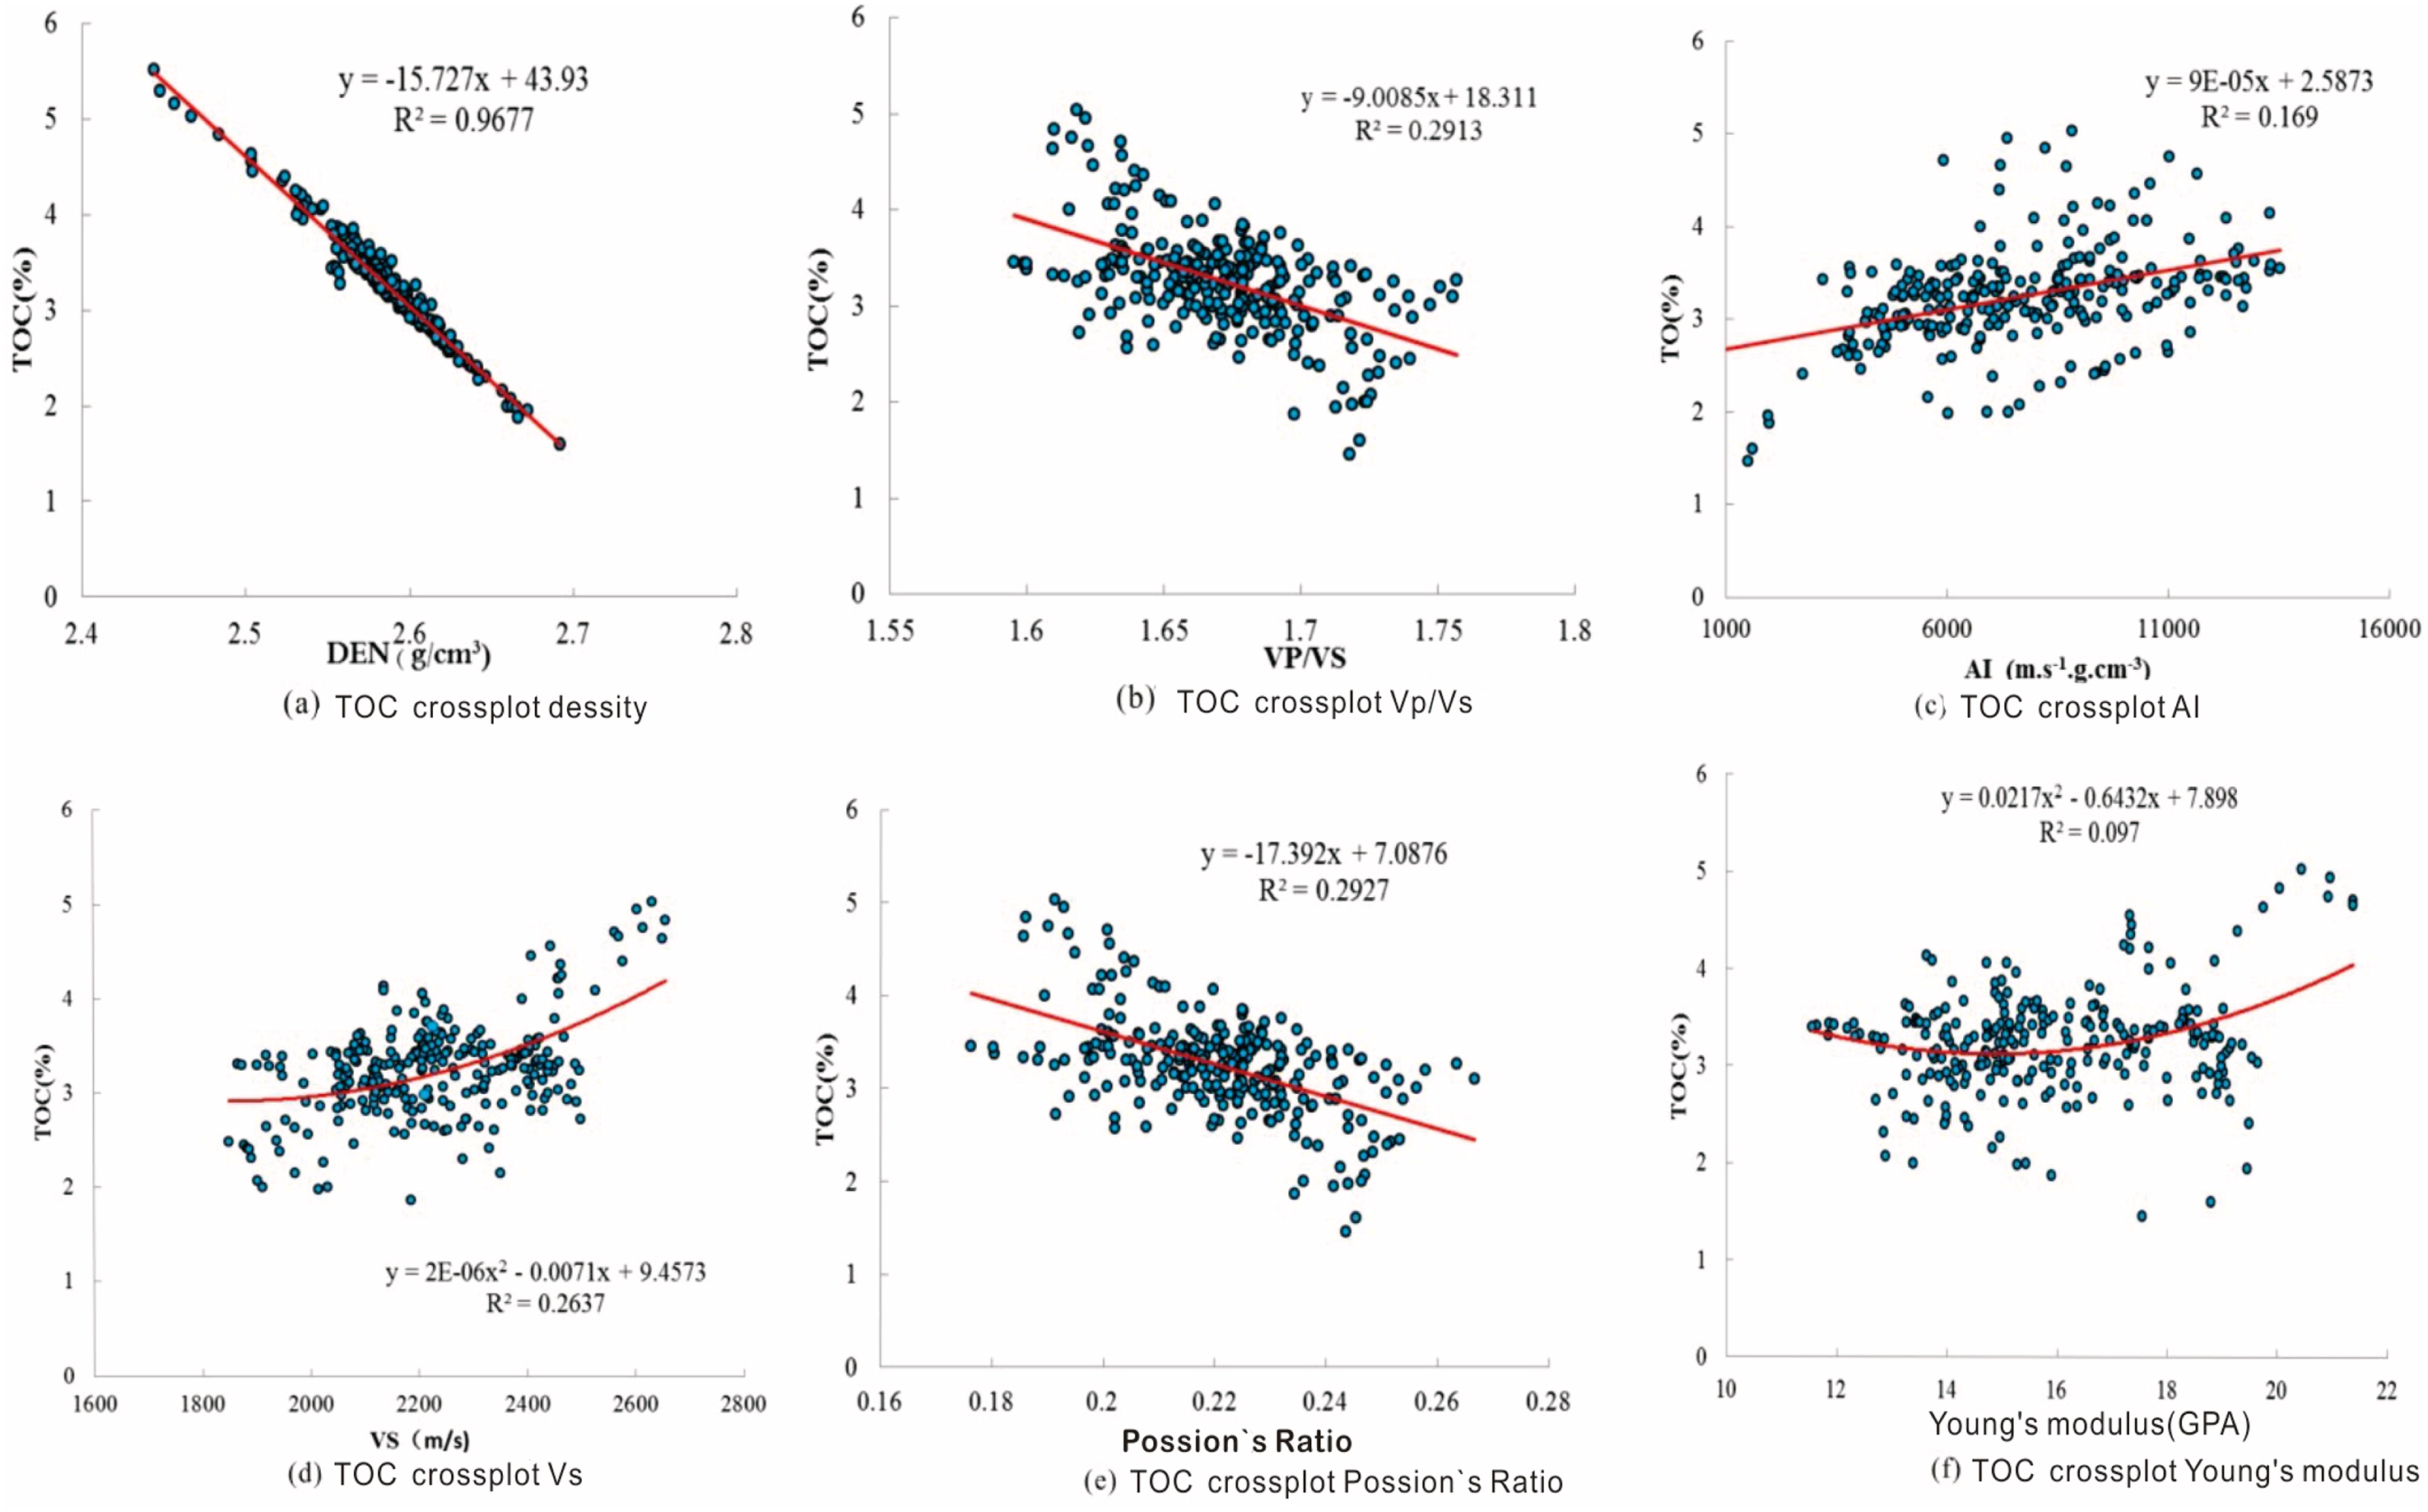
The relation between TOC and the elastic paramaters.
In this study, with the analysis of reservoir characteristics and production conditions, a fuzzy subset is constructed to quantify the factors or evaluation indicators that affect shale gas production and productivity. Then the fuzzy transformation principle is used to comprehensively evaluate and analyze each index. Moreover, in order to determine the influence weight and value range of each evaluation factor on the evaluation goal the evaluation and prediction system of the evaluation goal is established. At last, the method provides theoretical basis and guidance for the quantitative evaluation and prediction of the evaluation goal.
Results
The rock physical analysis can determine the elastic parameters that are most sensitive to sweet spot evaluation parameters such as TOC. Taking TOC as an example, as shown in Figure 6, through rock physical analysis, the result demonstrates that density is the most sensitive parameter of TOC content. By establishing a regression relationship between the two, it can provide a basis for subsequent TOC prediction.
Based on seismic rock physical analysis, pre-stack seismic simultaneous inversion technique is carried out to obtain the data volume of key evaluation parameters and then determine their areal distribution. TOC can be derived from the inversion density data volume through regressed relationships as shown in Figure 7, porosity from the conversion of the P-wave impedance data volume, thickness from the statistics of the TOC data volume as per the lower limit of the reservoir formed in this region, pressure coefficient from the inversion P-wave velocity data volume as per the Fillippone equation, and brittle index from the Young modulus and Poisson’s ratio data volumes as per the brittle index equation.
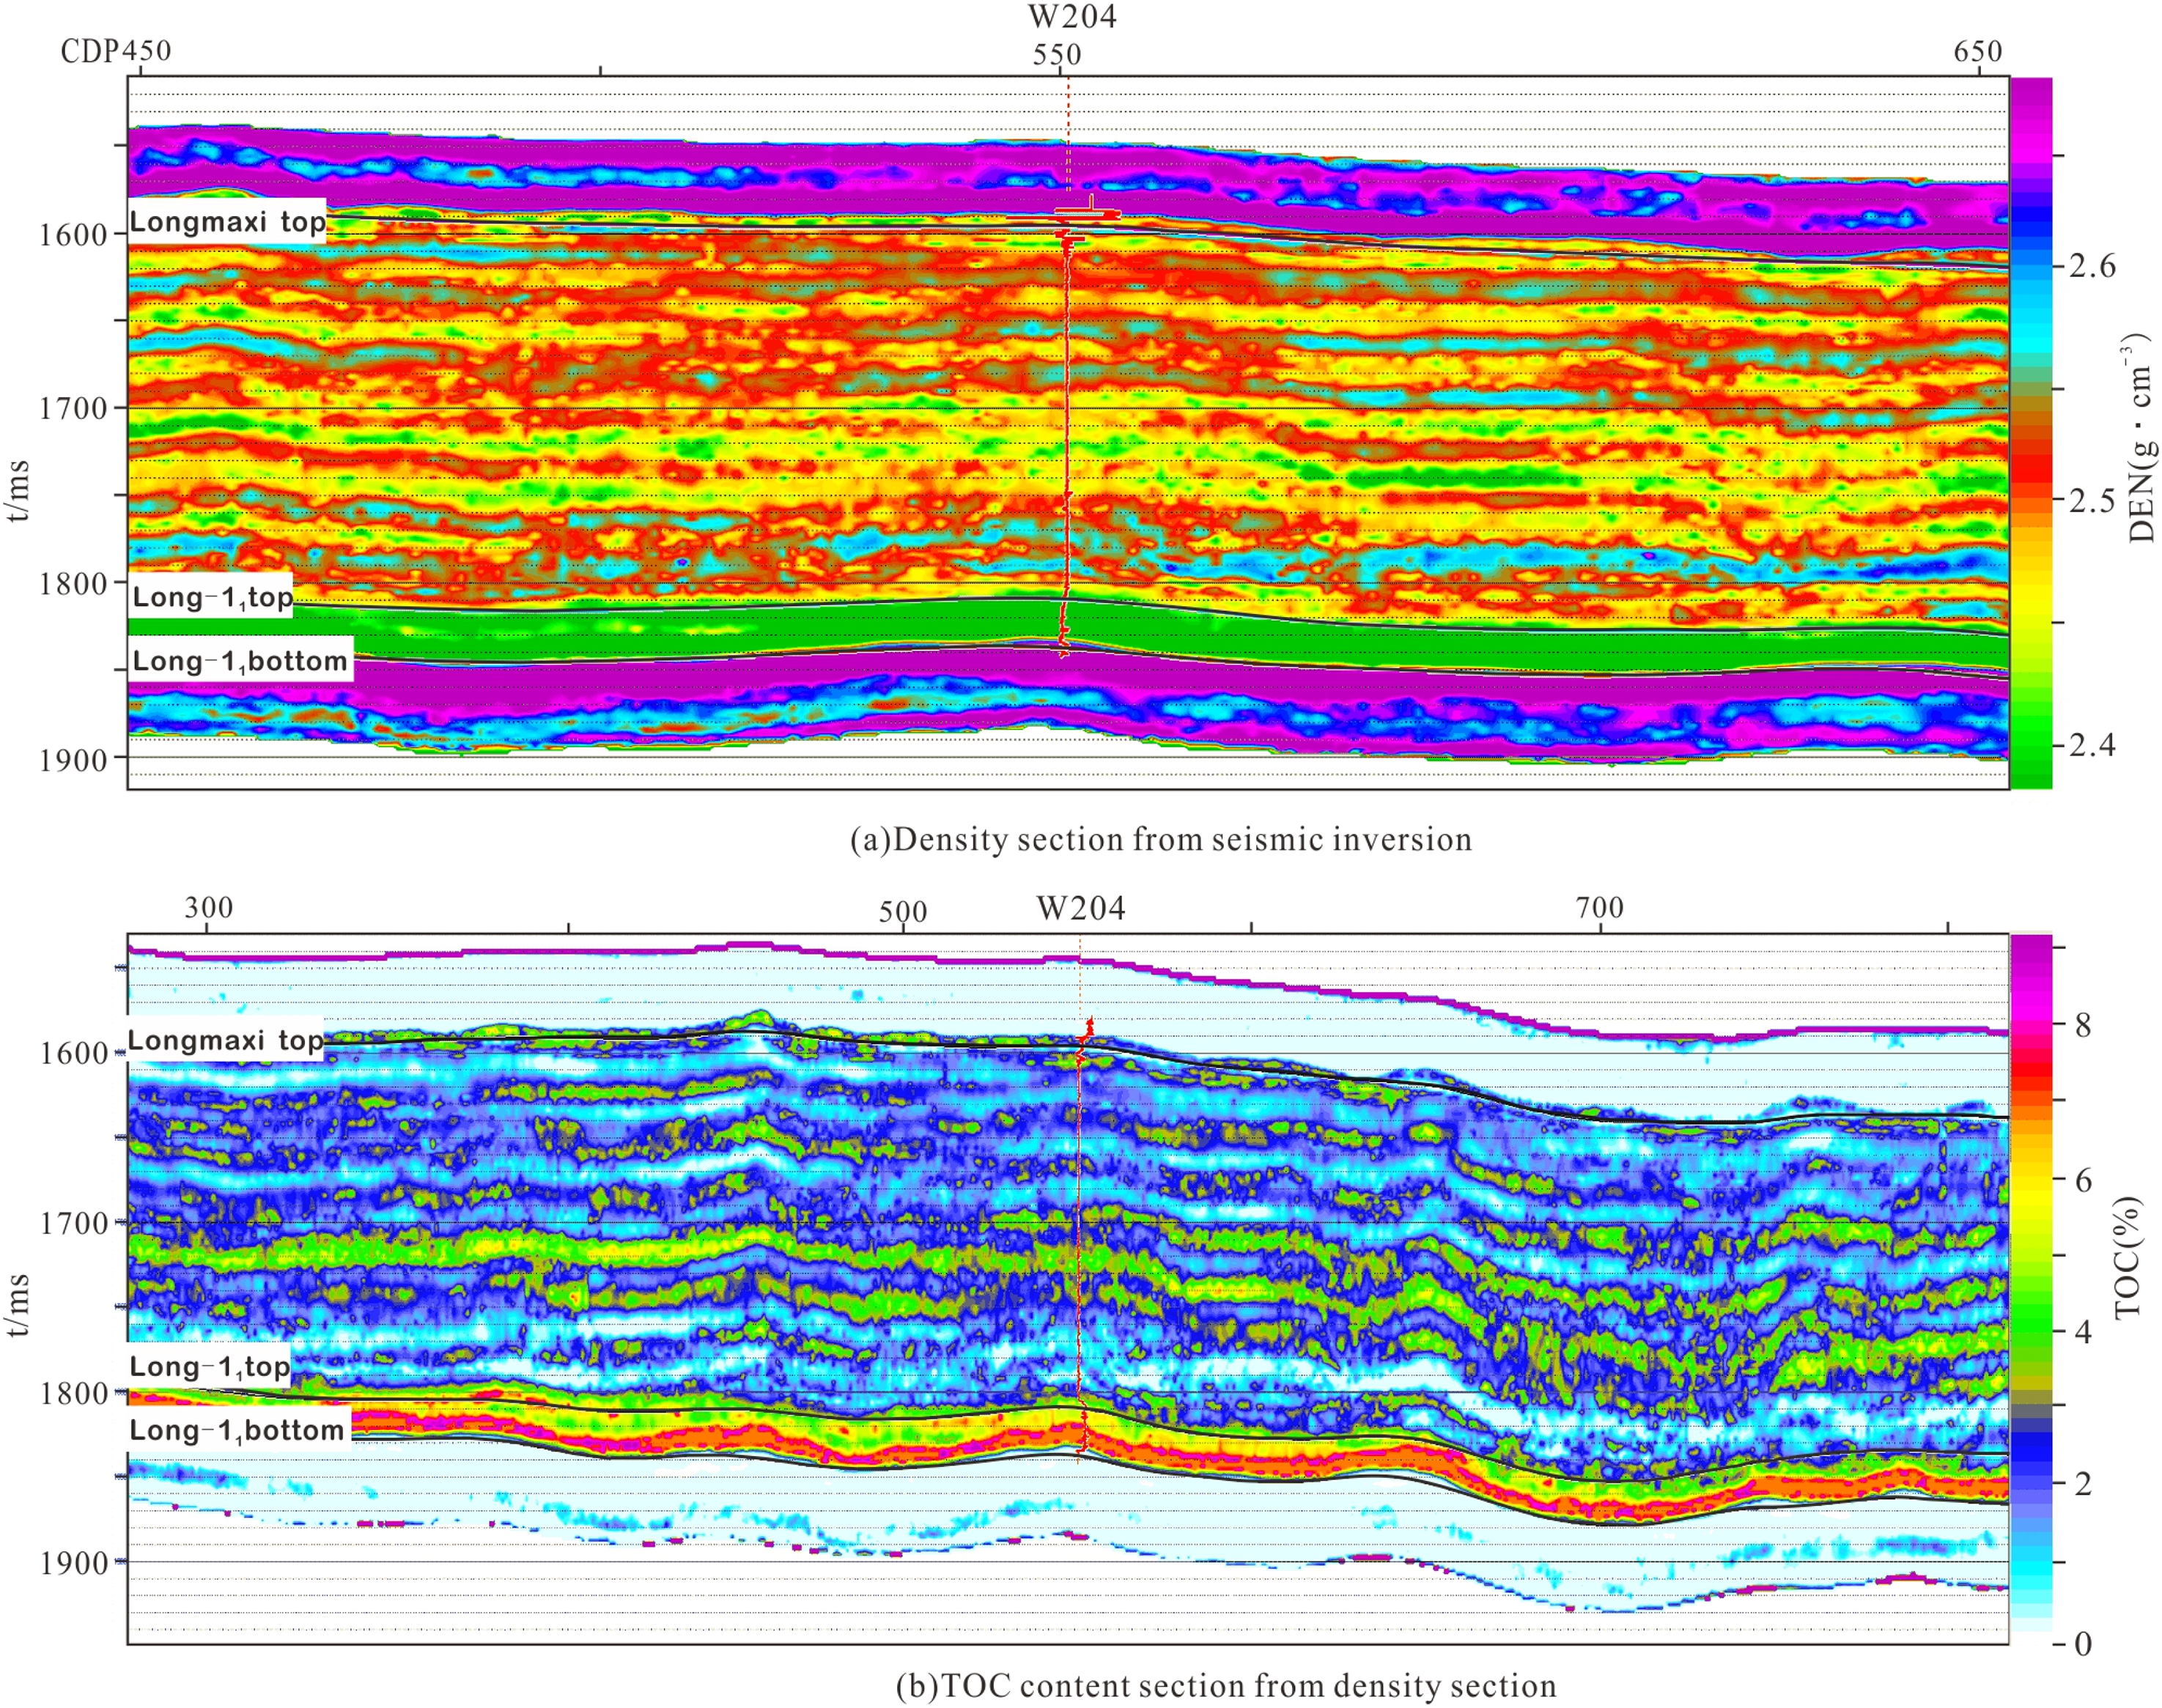
(a) density section and (b) TOC content section.
Figure 8(a) shows the distribution of the average TOC area in the Long-11 sub-segment. In most areas of this block, TOC ranges between 2% and 7%. Some areas with higher TOC include the middle and south. Figure 8(b) shows the areal distribution of the average porosity area of the Long −11 sub-member. In this block, the average porosity is between 5% and 10%, showing a relatively stable distribution. Some areas with higher porosity include the middle, the east and south of the study area. Figure 8(c) shows the distribution of high-quality reservoir thickness in the Long-11 sub-member. The thickness of the high-quality reservoirs in this block is 9–21m, mainly distribute in the east of the study area. Figure 8(d) shows the distribution of the average brittleness index of the Long-11 sub-segment. The brittleness index of the block is between 35% and 65%, and most areas exceed 45%, and the reform ability of the shale gas reservoirs is good. Figure 8(e) shows the areal distribution map of the average formation pressure coefficient of the Long-11 sub-member. The average formation pressure coefficient is between 1.25 and 2.5, more than 1.75 in most areas. The abnormal high-pressure is widely distributed. Over pressured formations (pressure coefficient exceeding 2.0) mainly appear in the middle, the south and the east part of the work area.
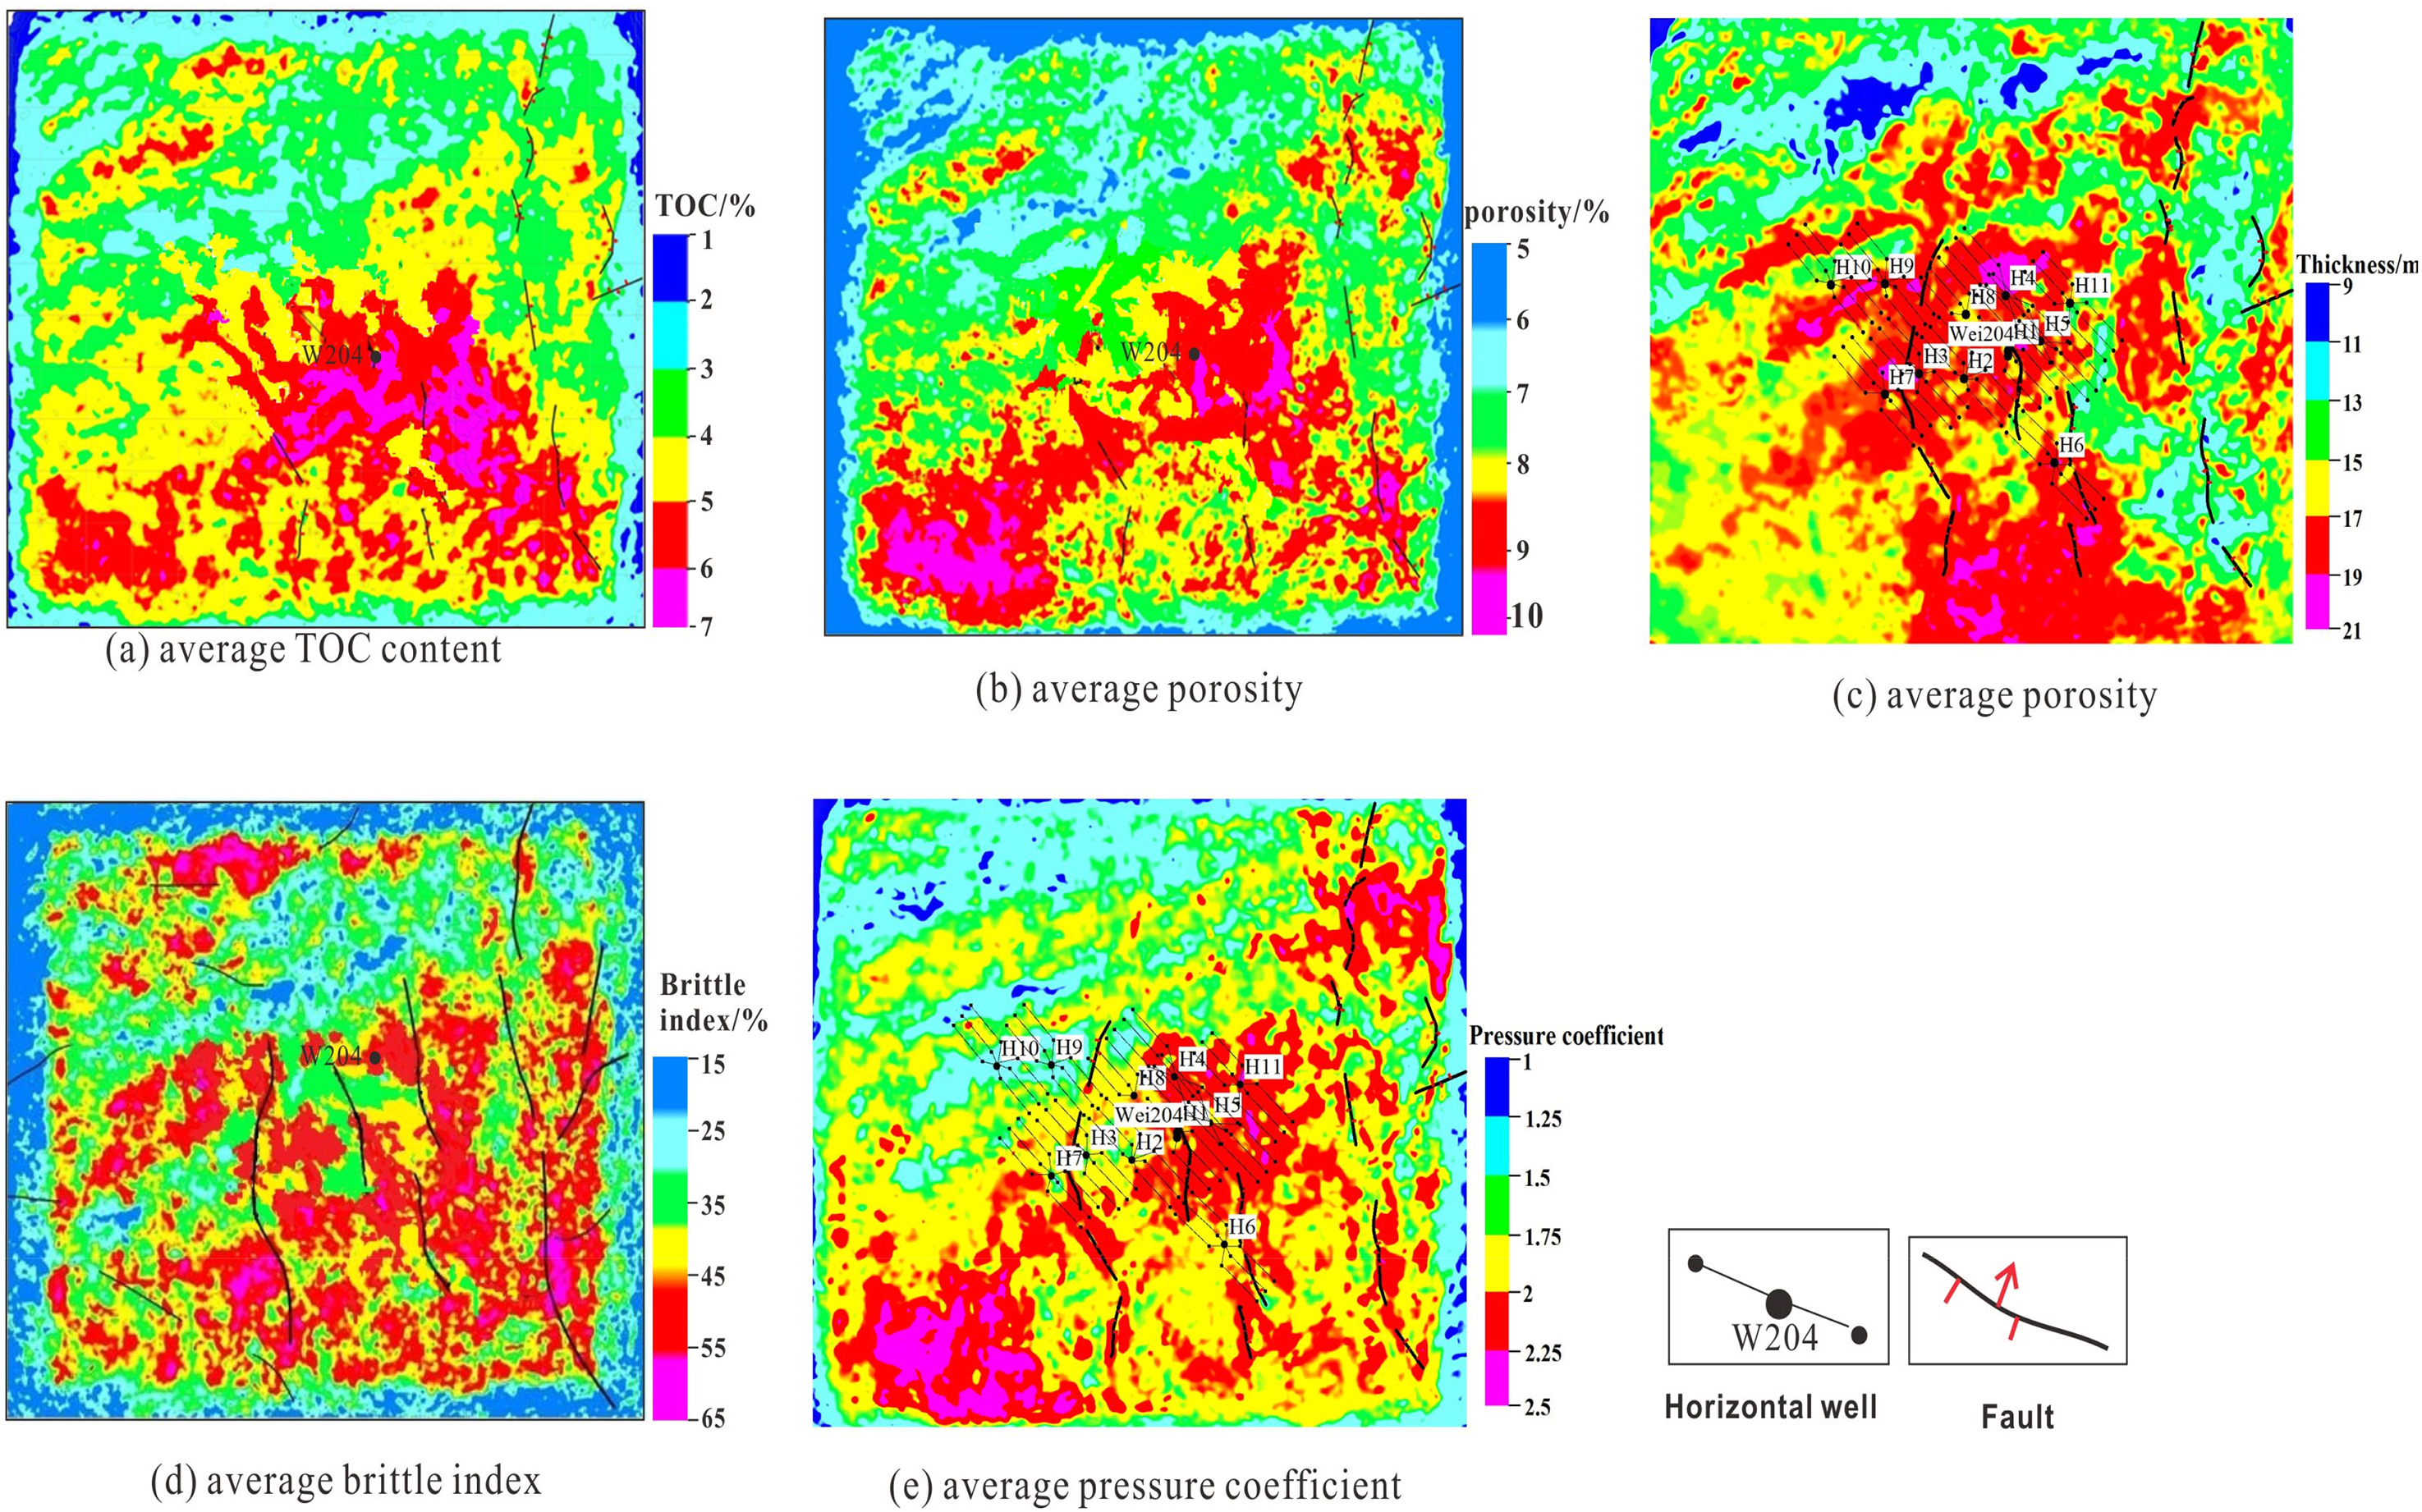
Areal distribution map of evaluation parameters of the WY block.
After obtaining the data volume and areal distribution of TOC, porosity, thickness, formation pressure coefficient and brittleness index of shale gas reservoirs in the study area. Test production data of two wells with the same or similar operating parameters and technologies are used as the output logarithm of the fuzzy neural network. The key evaluation parameters such as TOC are used as the input of the fuzzy neural network. According to the field production practice, the fuzzy neural network is applied to the automatic learning and training. Finally, the value range and weight coefficient of each evaluation parameter are determined and automatically modified, so a quantitative evaluation and prediction model for the sweet spot in the region is established (Table 4).
Parameters for quantitative prediction model of shale gas sweet spot zone and classification criterion for sweet spot zone in the WY Block.
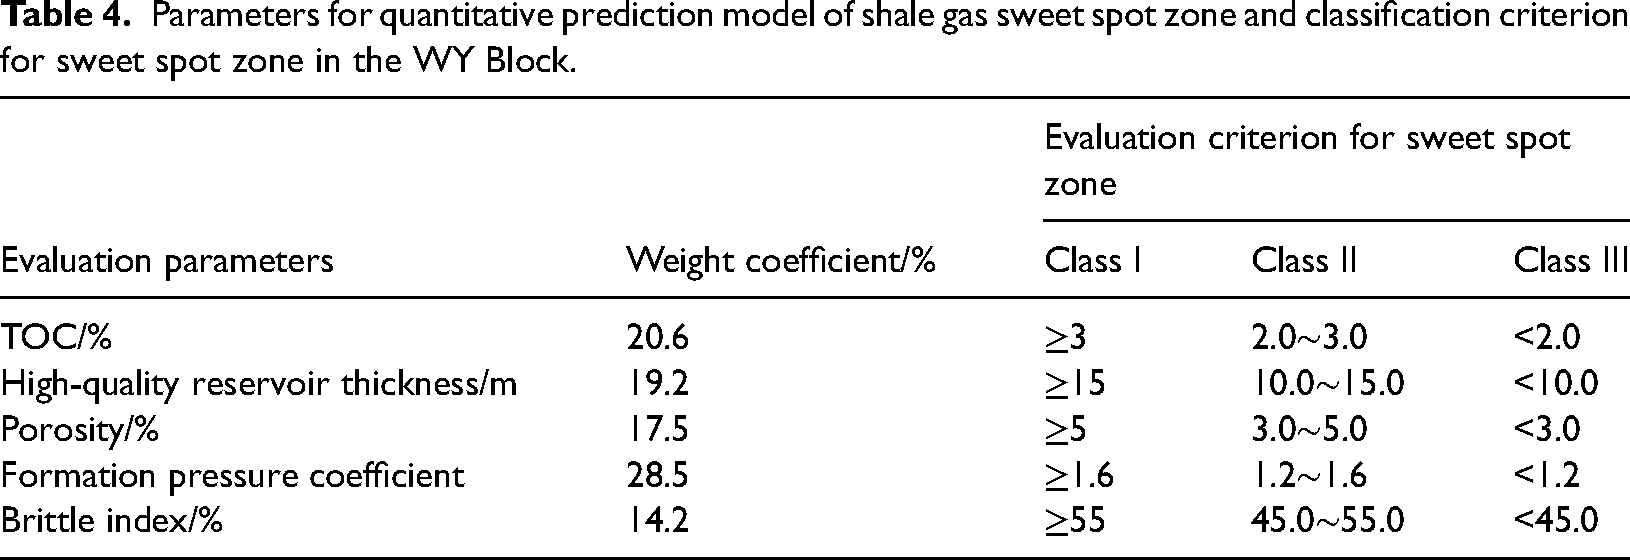
Based on this model, the weights of evaluation parameters from high to low are: formation pressure coefficient, high-quality reservoir thickness, TOC, porosity and brittleness index. Formation pressure coefficient, high-quality reservoir thickness and TOC have significant control over the distribution of shale gas sweet spots. Since the porosity and brittleness index in the block are usually high and exhibit a stable distribution, they are given a relatively low weight.
Based on the seismic quantitative prediction model of shale gas sweet spot zone in the WY block listed in Table 4, key evaluation parameters are normalized and then weighted and added to realize the quantitative prediction of the study area. The last step is to calibrate the evaluation result with the tested production to acquire the final prediction result as show in Figure 9.
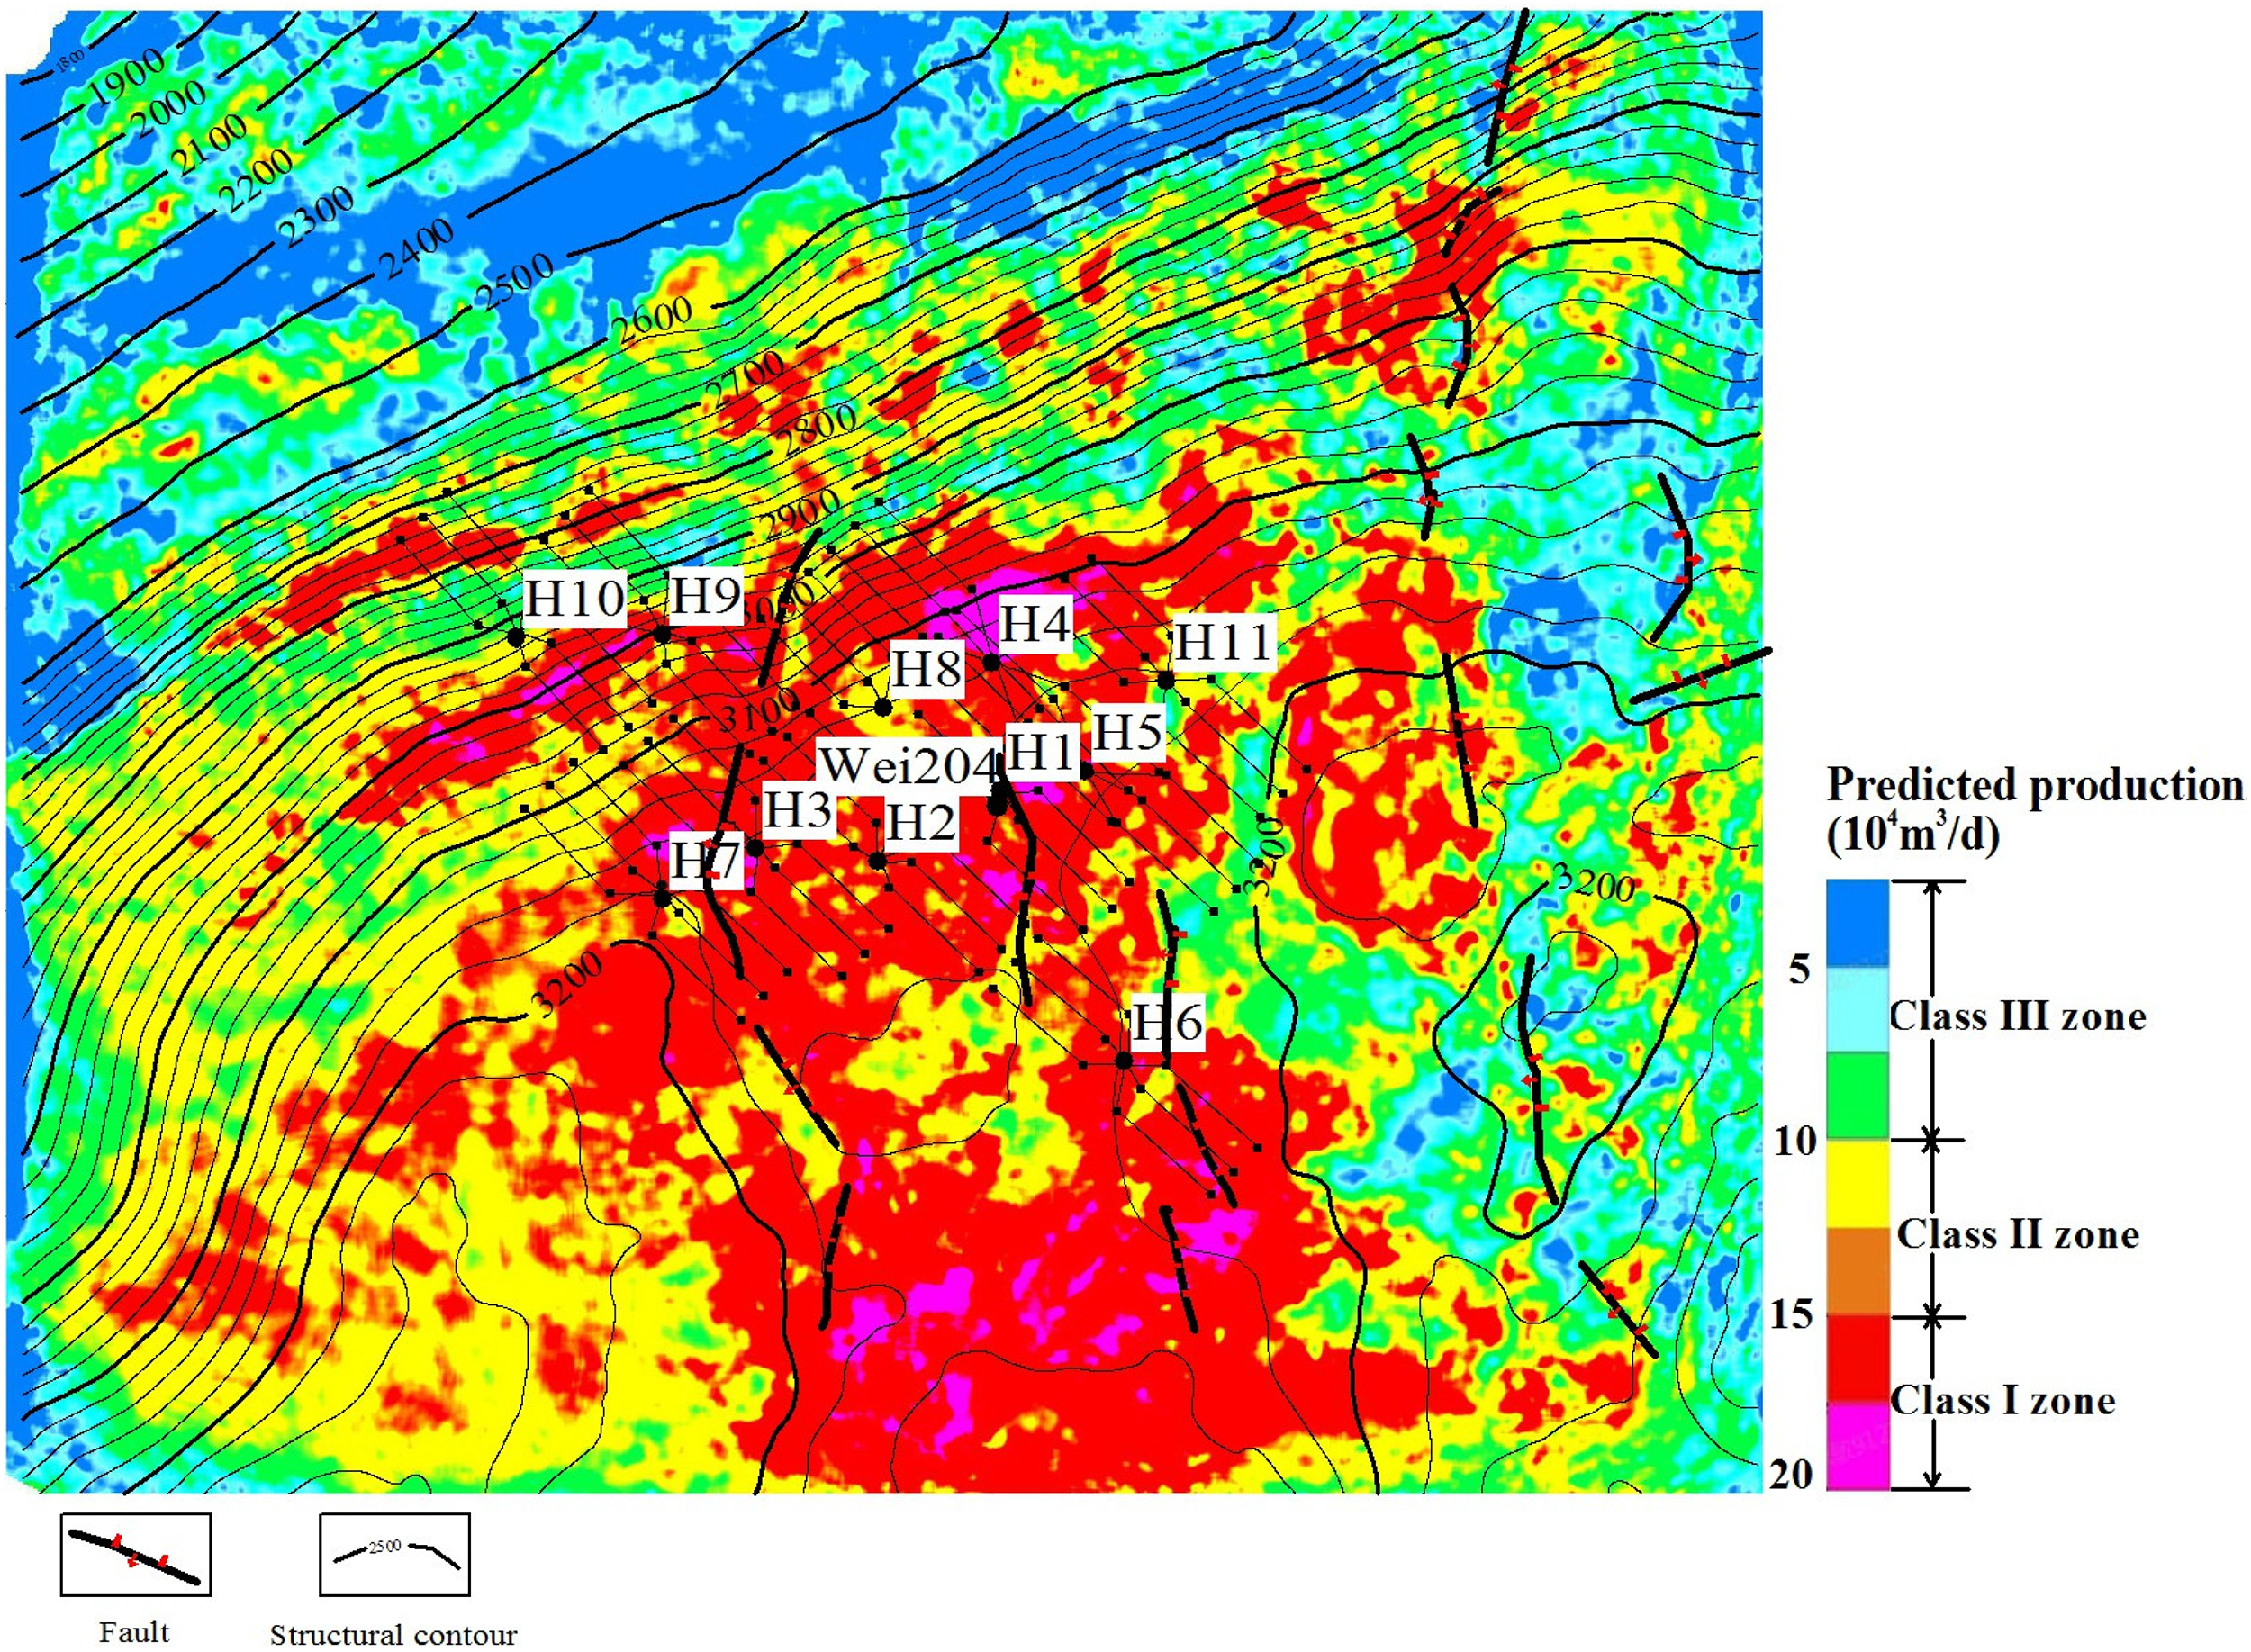
Quantitative prediction map of sweet spot zone of the Weiyuan 201 block.
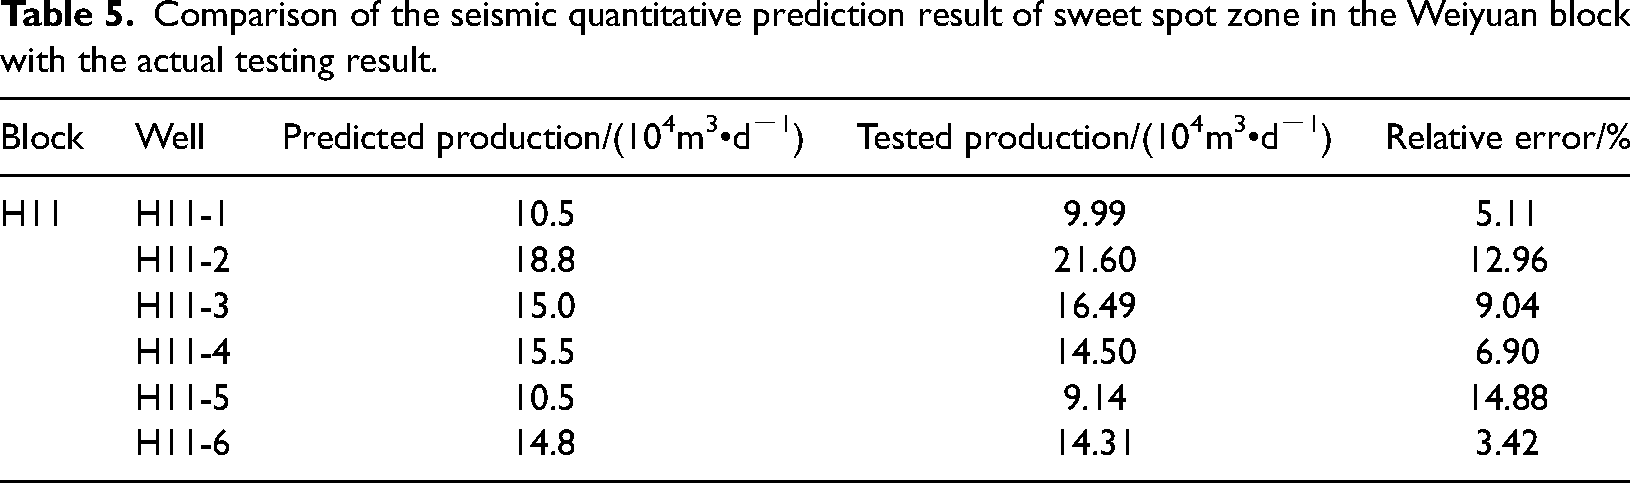
The test results of 6 newly drilled wells using the same operating technology and the same or similar operating parameters verify the reliability of the prediction results. As shown in Table 5, the sweet spots distribution matches well with the production test results.
Comparison of the seismic quantitative prediction result of sweet spot zone in the Weiyuan block with the actual testing result.
Conclusions
Fuzzy neural network is an effective method to predict sweet spots of quantitatively. Simultaneously, the pre-stack simultaneous inversion technology makes full use of the AVO information in the pre-stack gathers, and is also important for the prediction of key evaluation parameters of shale gas sweet spots.
Effective reservoir thickness and formation pressure coefficient have higher weights in the final evaluation results, which are the main controlling factors for the high-yield and enrichment of shale gas in the WY block; due to the overall high TOC and brittleness index of the Long-11 sub-member and relatively distributed distribution stability, resulting in relatively low weights for TOC and brittleness index.
The high-quality shale reservoirs of the Longmaxi Formation are mainly distributed in the Long-11 sub-member in the vertical direction. This sub-section has high overall TOC, abnormal formation overpressure, and high brittleness index, making it a favorable interval for shale gas development. At the same time, the closer to the bottom of the Longmaxi formation, the key evaluation indicators such as TOC, formation pressure coefficient, and brittleness index tend to increase.
A comprehensive evaluation and division of the plane distribution of shale reservoirs has been carried out. The Type I and Type II areas as sweet spots are mainly distributed in the middle of the study area, and it is recommended to give priority to development. All the key evaluation indicators for Category III areas are relatively low, and selective development is recommended.
Footnotes
Declaration of conflicting interests
The author(s) declared no potential conflicts of interest with respect to the research, authorship, and/or publication of this article.
Funding
The author(s) disclosed receipt of the following financial support for the research, authorship, and/or publication of this article: This work was supported by the CNPC Key Technology Research Project (grant number: 2021ZG1301).