
Abstract
Marine shale gas exploration targets are reaching into shallow to deep or ultradeep burial depths. Rock microstructure and reservoir quality emerge as the main risk considerations for a profitable reservoir at these large depths. Shallow to deep marine shales occur in the Silurian Longmaxi Formation of the Weiyuan Block, which is located on the southwestern margin of the Sichuan Basin. However, few details of the characteristics of the Longmaxi shales in this Block have been reported. In this study, five wells approximately 3500 m deep were drilled. Field emission scanning electron microscopy, low-pressure gas adsorption and core plug porosity-permeability measurements are conducted on 6 shallow (2651–2940 m) and 11 deep (3539–3575 m) Longmaxi samples to obtain the organic geochemical characteristics, mineral constitutions, pore structures and petrophysical properties, and they are the major controls on reservoir quality. The results show similar mineralogical and organic geochemical characteristics in all samples from the various depths. Both shallow and deep shales are mainly composed of quartz, carbonate and clays and have a total organic carbon (TOC) content more than 2 wt.% and a mean S1 + S2 value more than 52 mg/g. Source rock quality criteria using the TOC and S1 + S2 suggest most shale samples fall excellent source rocks. The samples are mostly siliceous rocks that contain organic pores, intraparticle dissolution pores, interparticle quartz pores and interparticle clay pores and they play a positive role in improving reservoir quality. Pore surface area and pore volume increase with increasing TOC, indicating that the porous organic fraction is a major control on pore structure and porosity. We suggested that siliceous deep Longmaxi formation in Weiyuan Block belongs to a high-quality shale with an average TOC value of 3.9 wt.% and well-developed pore networks, which should be the important target for deep shale gas exploration.
Introduction
Hydrocarbons production from organic-rich shale reservoirs has been proven to be feasible from the numerous operations in various shale formations in China and North America (Chalmers and Bustin, 2015; Guo et al., 2020; Loucks and Dutton, 2019; Ma et al., 2021; Mastalerz et al., 2013), but many challenges still remain for the reservoir and shale oil/gas potential evaluation of these organic-rich rocks. Organic-rich shale generally contains three major types according to the sedimentary environment: (1) continental shale, (2) marine-continental transitional shale and (3) marine shale (Chalmers and Bustin, 2015). Among them, marine shale is the dominant target for unconventional oil/gas production. Typical formations of the Niutitang Shale and Wufeng-Longmaxi, where marine shale gas is the focus of investigation, are among the Paleozoic shales that were significantly deposited in the marine sedimentary environment in the Sichuan Basin, South China. (Zhu et al., 2021; 2022). Shale gas, which has a CH4 content of more than 90%, remains in place as free gas in interparticle pores and microfractures as well as adsorbed gas attached to organic pores and clay nanopores (Cai et al., 2023; Chalmers and Bustin, 2015; Loucks and Dutton, 2019; Mastalerz et al., 2013). As such, gas-bearing shales belong to both self-sourced and self-stored reservoirs (Loucks and Dutton, 2019).
Vast new unconventional oil/gas resources are being discovered every year across the whole world (Guo et al., 2020; Ma et al., 2021), such as Gulong shale oil newly discovered in Songliao Basin (Liu et al., 2019), ultra-shallow shale gas (depths bellowing 2000 m) exploited in Southern Sichuan Basin and the deep to ultradeep tight gas exploited in the northern Gulf of Mexico (Loucks and Dutton, 2019). Another significant source of these unconventional oil/gas is from the production of deeply-buried fine-grained rocks (Chalmers and Bustin, 2015; Guo et al., 2020; Loucks and Dutton, 2019; Ma et al., 2021), typically located 3500 m below the surface of the Earth in deep organic-rich shales. Shale is typically split into two primary zones according to the depth at which it was buried: shallow shale (depths under 3500 m) and deep shale (depths beyond 3500 m) (Ma et al., 2021). Recent years shale gas exploration from deep shale becomes the most quickly expanding trends in onshore unconventional oil/gas exploration in South China (Cai et al., 2021; Jiao et al., 2018; Li et al., 2022; Sun et al., 2021; Wang et al., 2022a; Wang et al., 2022b). Previous workers have focused on reservoir characterization, reservoir property, pore-fracture structure, gas content and development potential of deep shale gas and achieved remarkable success in this field. Wang et al. (2022b) proposed a method of estimating the supercritical methane adsorption in deep shale from the Dongxi Area, Southeastern Sichuan Basin. They carried out methane isothermal adsorption experiments at different temperatures (30–90 °C) and pressures (up to 32 MPa), and suggested that the methane adsorption capacity increases with pressure and decreases with temperature. Cai et al. (2021) established an evaluation model of reservoir microstructure of the deep Longmaxi Formation collected from the L208 well area, Luzhou Block and quantitatively characterized the fluid storage capacity and microstructures. Qualitative and quantitative assessments of the geological characteristics, lithofacies, microstructure and nanopores of deep shales have also been carried out by a number of scholars (Jiao et al., 2018; Ma et al., 2021; Shan et al., 2022; Wang et al., 2022). Deep unconventional resources production is unlocking a confusion of energy shortage, energy security and environmental pressure (Feng et al., 2020; Yang et al., 2022a; Yang et al., 2022b; Zhao et al., 2022). Therefore, the reservoir and shale gas potential evaluation of these deep formations has now become the important research hotspot.
The Silurian Longmaxi Formation is an active shallow shale gas exploration target in the Sichuan Basin (Cai et al., 2022; Zhu et al., 2019). As shale gas production matures, the focus of new target has gradually increased in depth. At present the deep Longmaxi shales are being explored. In the area of the southwestern Sichuan Basin, shale gas wells with objectives as deep as 3500 m subsurface are being targeted. At these great depths, reservoir quality is one of the primary risk factors, and organic pores and mineral-hosted pores are commonly compacted and partially or completely filled with cements, causing the smaller pore sizes (Chalmers and Bustin, 2015; Loucks and Dutton, 2019). A suite of Longmaxi samples from the Weiyuan area, southwestern Sichuan Basin covering a depth range from 2651 to 3574 m were selected for detailed mineralogy, organic geochemistry, microfabrics, petrophysical properties and pore structure analyses, which could provide significant insights into the microstructural features and associated reservoir quality of deep shale. Specific objectives include (1) study Longmaxi shale mineralogy and hydrocarbon generation potential, (2) investigate microstructural analyses and relate to pore type and morphology, (3) integrate low-pressure gas adsorption data with field emission scanning electron microscopy (FESEM) to explain relations of pore types, pore size and pore structures and (4) discuss the key factors of microstructural development and reservoir quality.
Data and methods
The Longmaxi shale is an organic-rich marine deposit of Silurian age (Huang et al., 2020). A database of 17 shale samples composed of mineralogical and organic geochemical analysis, FESEM, gas adsorption and porosity-permeability measurements was constructed for the Longmaxi formation from the Weiyuan area, southwestern Sichuan Basin. The Weiyuan Block is the slightly deformed area and belongs to the low-flat structural belt (Figure 1(A)). The Longmaxi stratigraphy in this area is shown in Figure 1(B), the thickness of the Longmaxi Formation ranges from 0 to 140 m (Huang et al., 2020; Zhou et al., 2014). Of the 17 samples from 5 wells, all are from the Silurian marine shales. Depths range from 2651 to 3574 m. Eleven core samples were selected at greater than 3500 m of burial depth, and shale samples were selected at depths below 3000 m.
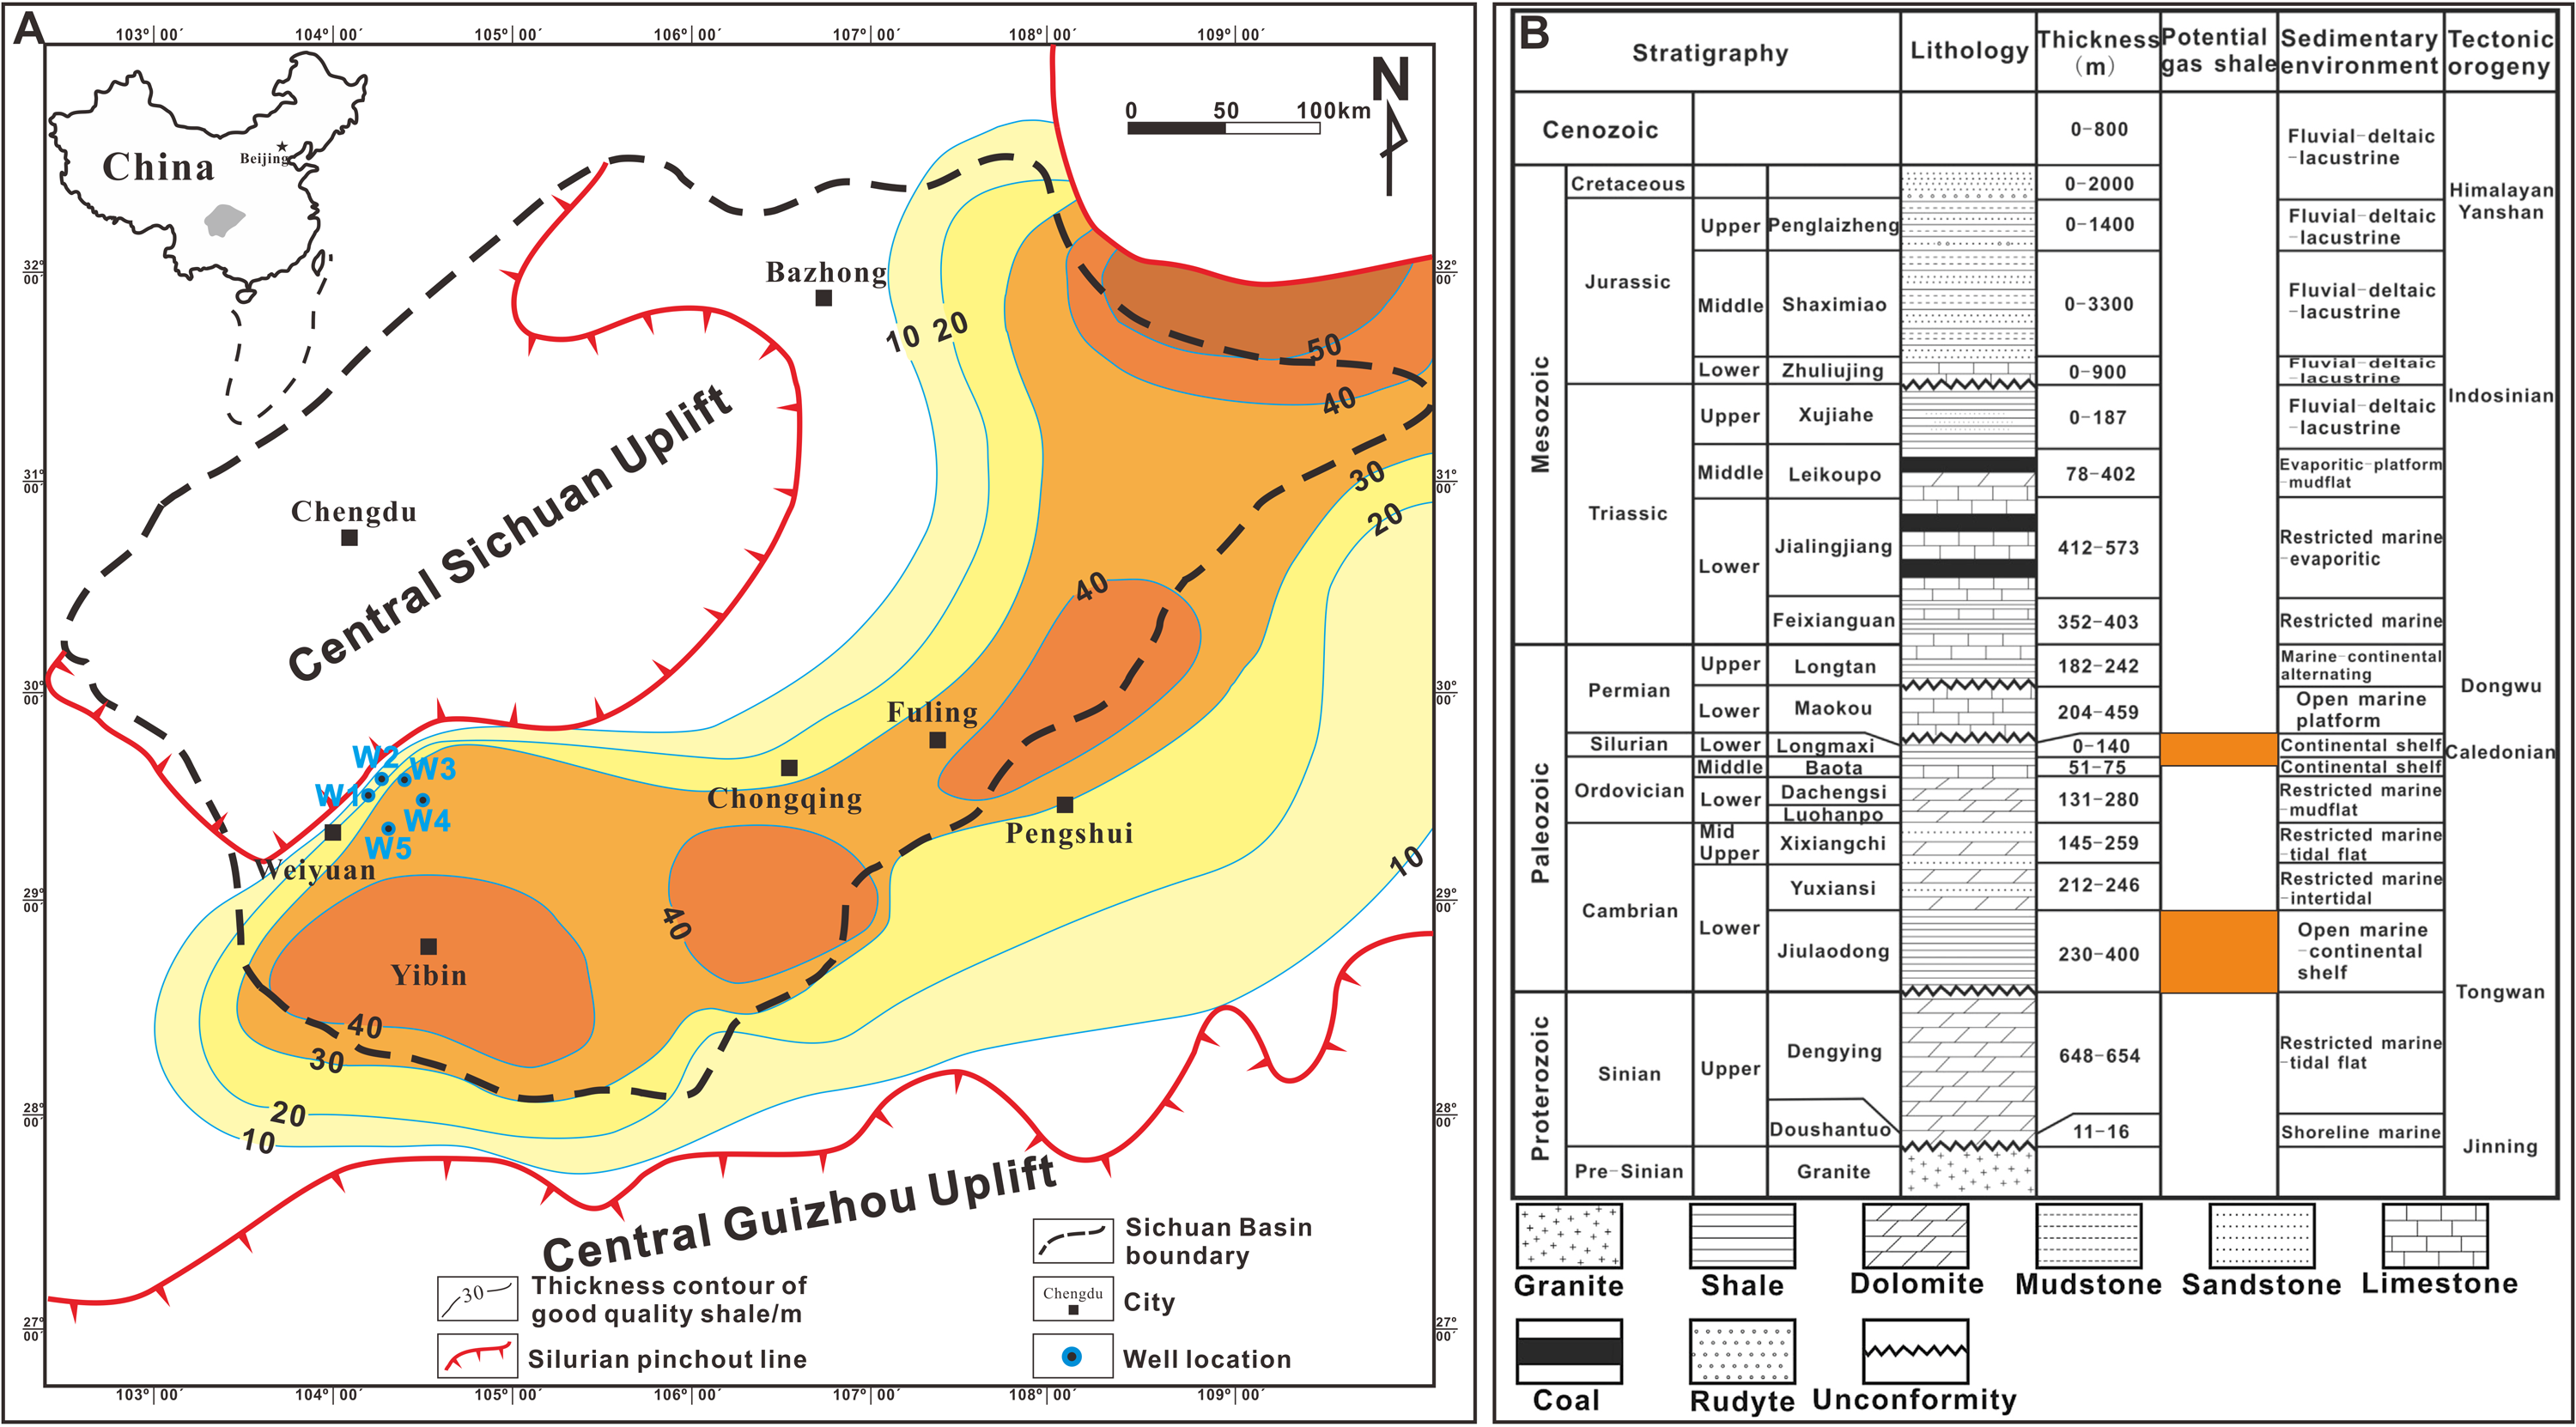
(A) Isopach of the Silurian Longmaxi formation, Sichuan Basin. Modified after Huang et al. (2020). The locations of the five wells are marked. (B) Stratigraphy system, sedimentary environments and tectonic events of the Weiyuan Block, southwestern Sichuan Basin. Modified after Zhou et al. (2014).
The mineralogical compositions of samples were quantified by X-ray diffraction analysis using a D/Max-TTR III analyzer. Total organic carbon (TOC) content was quantified using the LECO CS-230 carbon and sulphur analyzer. Pyrolysis was performed using a Rock-Eval 6 analyzer following the China National Standard GB/T18602-2001 to obtain the value of free hydrocarbons (S1), the amount of thermogenic hydrocarbon (S2), and the temperature of maximum yield of pyrolysate (Tmax). FESEM were employed to directly observe the pore types and morphology. We examined the broken shale sample chips (5 mm × 5 mm × 5 mm) using the 2D FESEM. Gas adsorption analyses are used to quantify the nature of pores (pore size below 100 nm) using both N2 at −196 °C (77.35 K) and CO2 at 0 °C (273.1 K) by the Micromeritics ASAP-2460 apparatus. The pore size distribution (PSD) analysis was calculated by the calculation model of the density functional theory (DFT). The porosity and permeability were tested with a PHI220 helium porosity analyser and a CAT112 gas permeability analyser. Porosity was determined by calculating the difference between bulk and grain volume. To determine the permeability of the samples, a high and low permeability meter CAT 112 was used based on Darcy's Law technique. Basic procedure is as follows: (1) sealing the sample in Hasler gripper with 200 psi annular pressure, (2) letting dry air skip through the sample stably and (3) measuring its inlet and outlet pressure and air float rate.
Results
Shale compositions
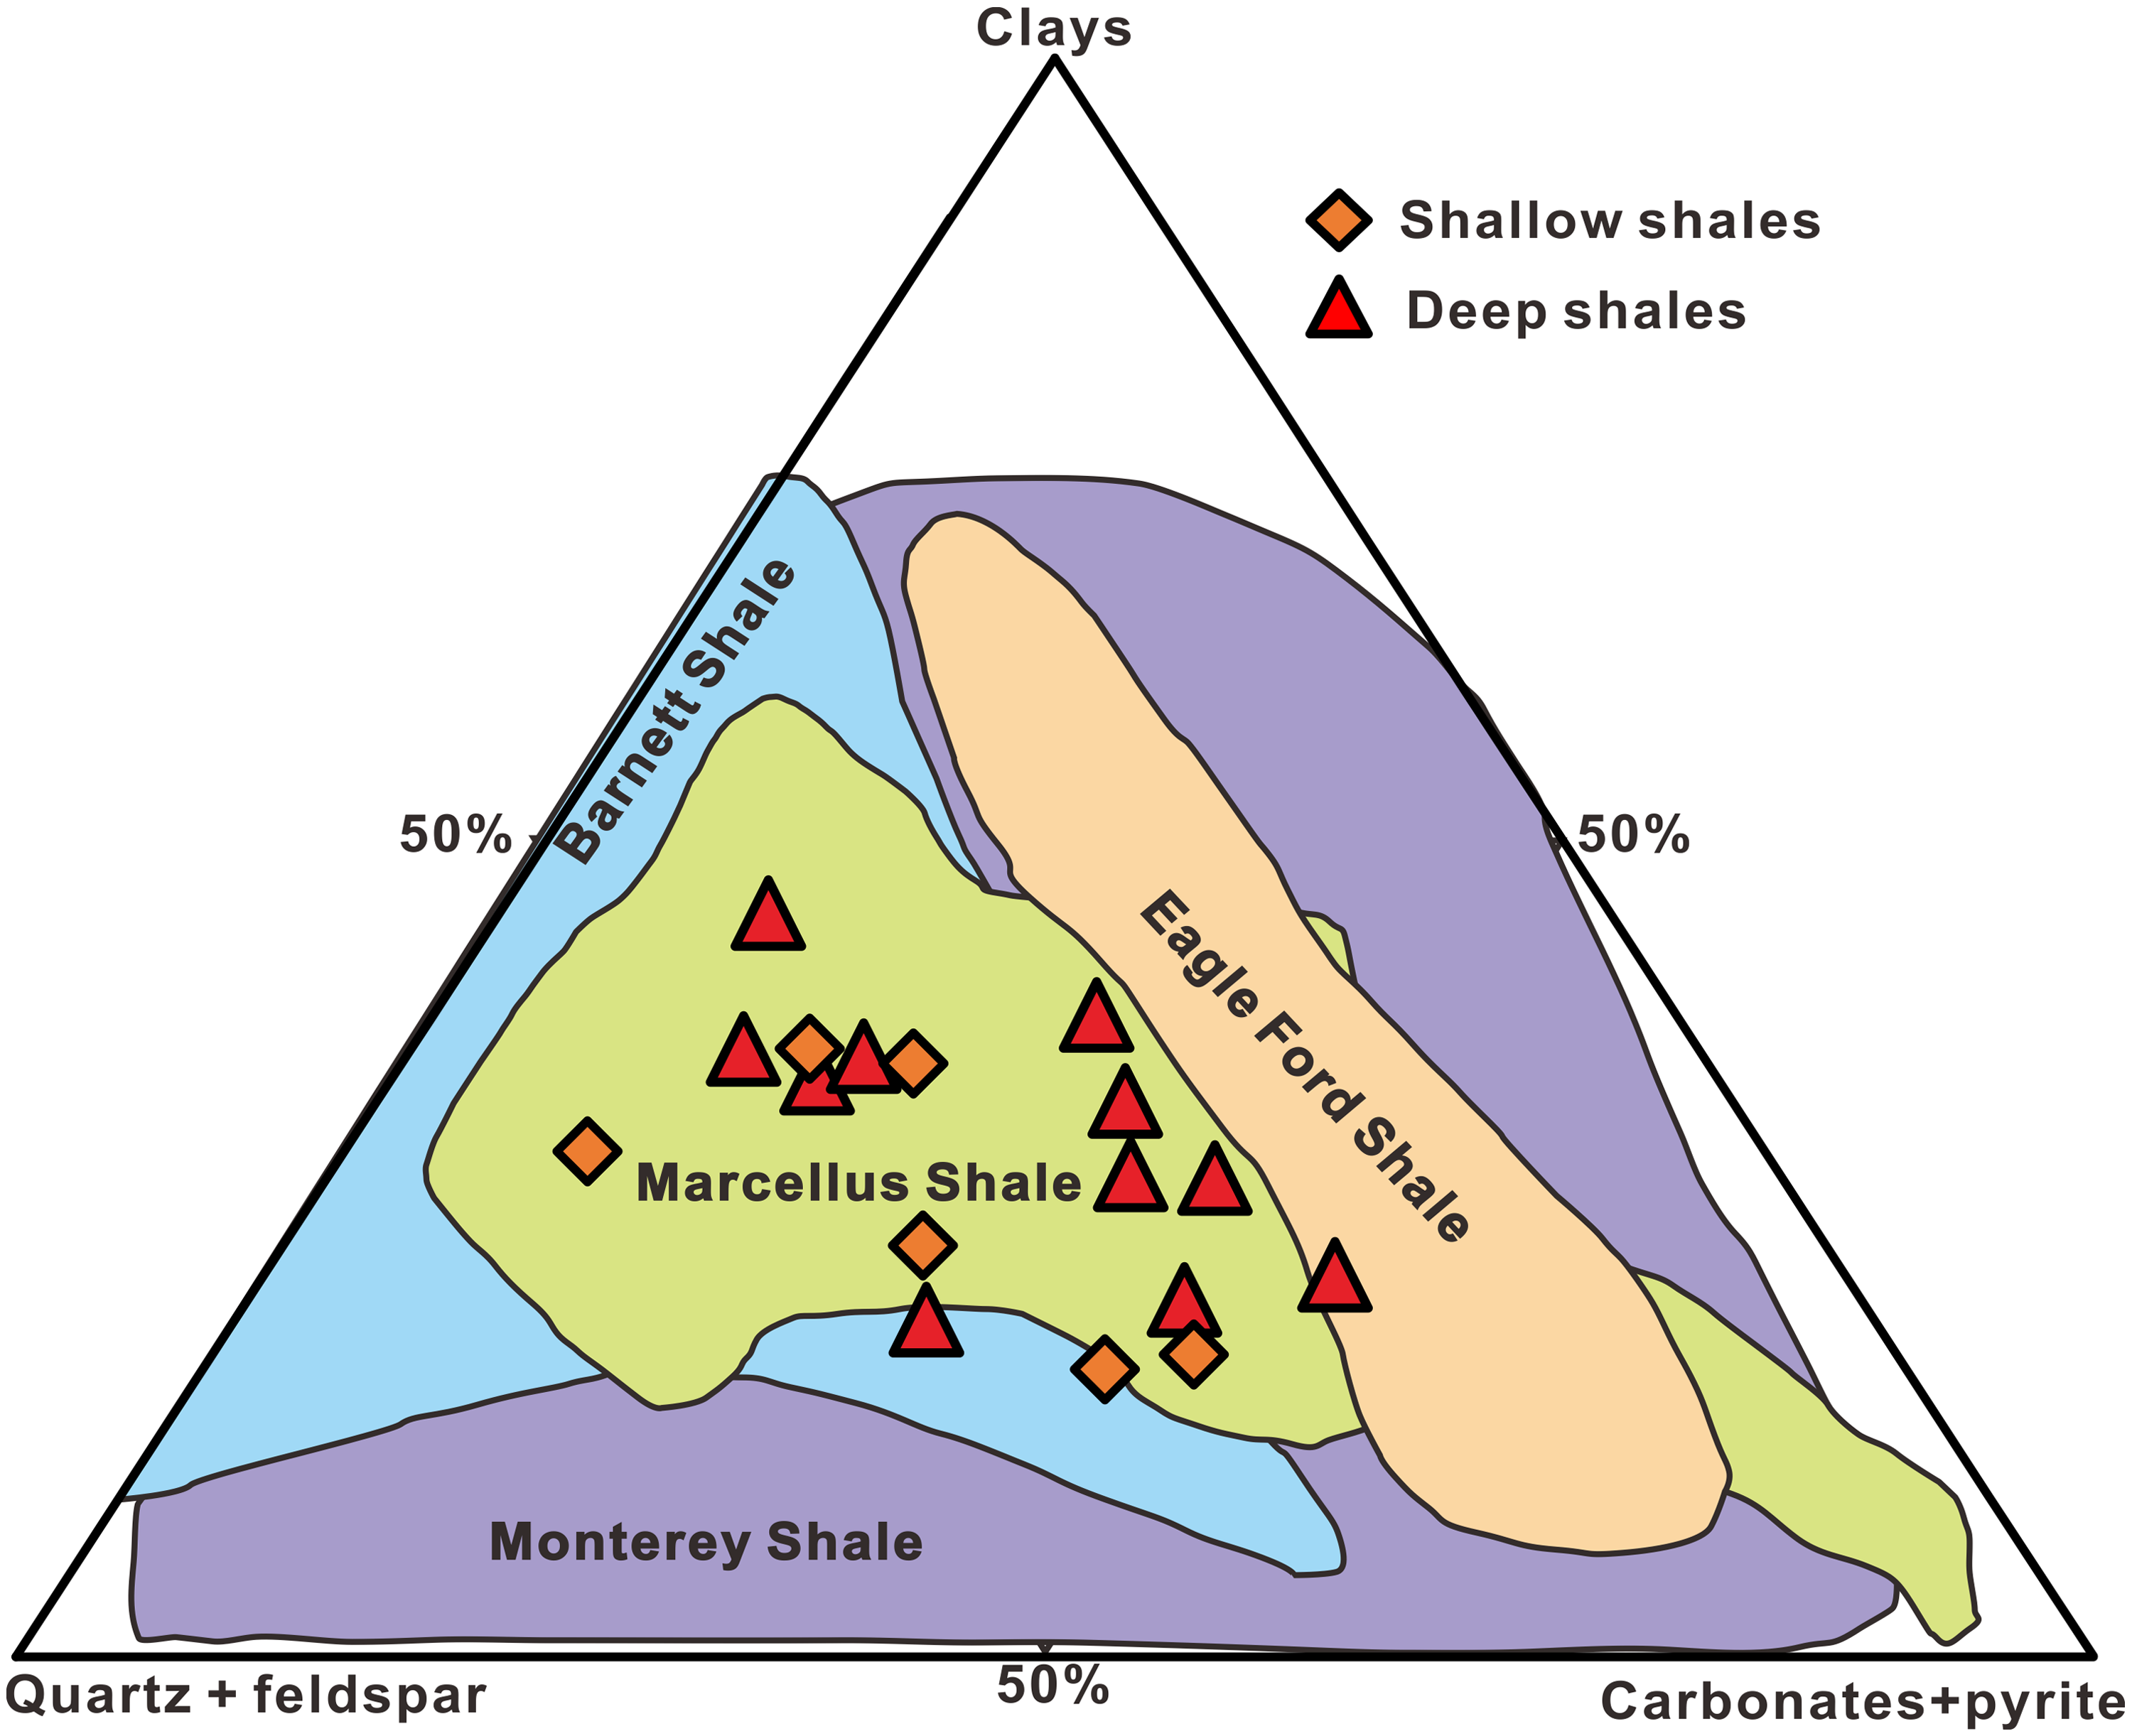
The samples are mainly composed of quartz, carbonates and clays, and contain a small amount of feldspar and pyrite minerals. The carbonates include 2.1–32.2% calcite and 7.4–25.2% dolomite. The clay minerals contain a prominent illite (49–83%), illite/smectite (I/S) (4–37%) and chlorite (5–22%). Quartz minerals range from 23.5% to 49.6% (Table 1). In the shallow shales, mean quartz content is 38.6% with a range of 30.5–49.6%. In the deep shales, mean quartz content is 31.9% with a range of 23.5–43.5%. Clay minerals data of samples range between 15.6% and 40.3% (Table 1). The shallow shales have clay contents approximately 15.6–33%, with the mean clay content is 24.4%. The deep shales have clay contents approximately 18.1–40.3%, with the mean clay content is 28.6%. Carbonates range from 10.9% to 52.1% (Table 1). In the shallow shales, mean carbonate content is 28.2% with a range of 10.9–43.6%. In the deep shales, mean carbonate content is 32.3% with a range of 13.4–52.1%. The mean feldspar content of shallow and deep shales is 6% and 5%, respectively. The mean pyrite content of shallow and deep shales is 2.9% and 2.8%, respectively.
Longmaxi shale mineralogy and petrophysical property.
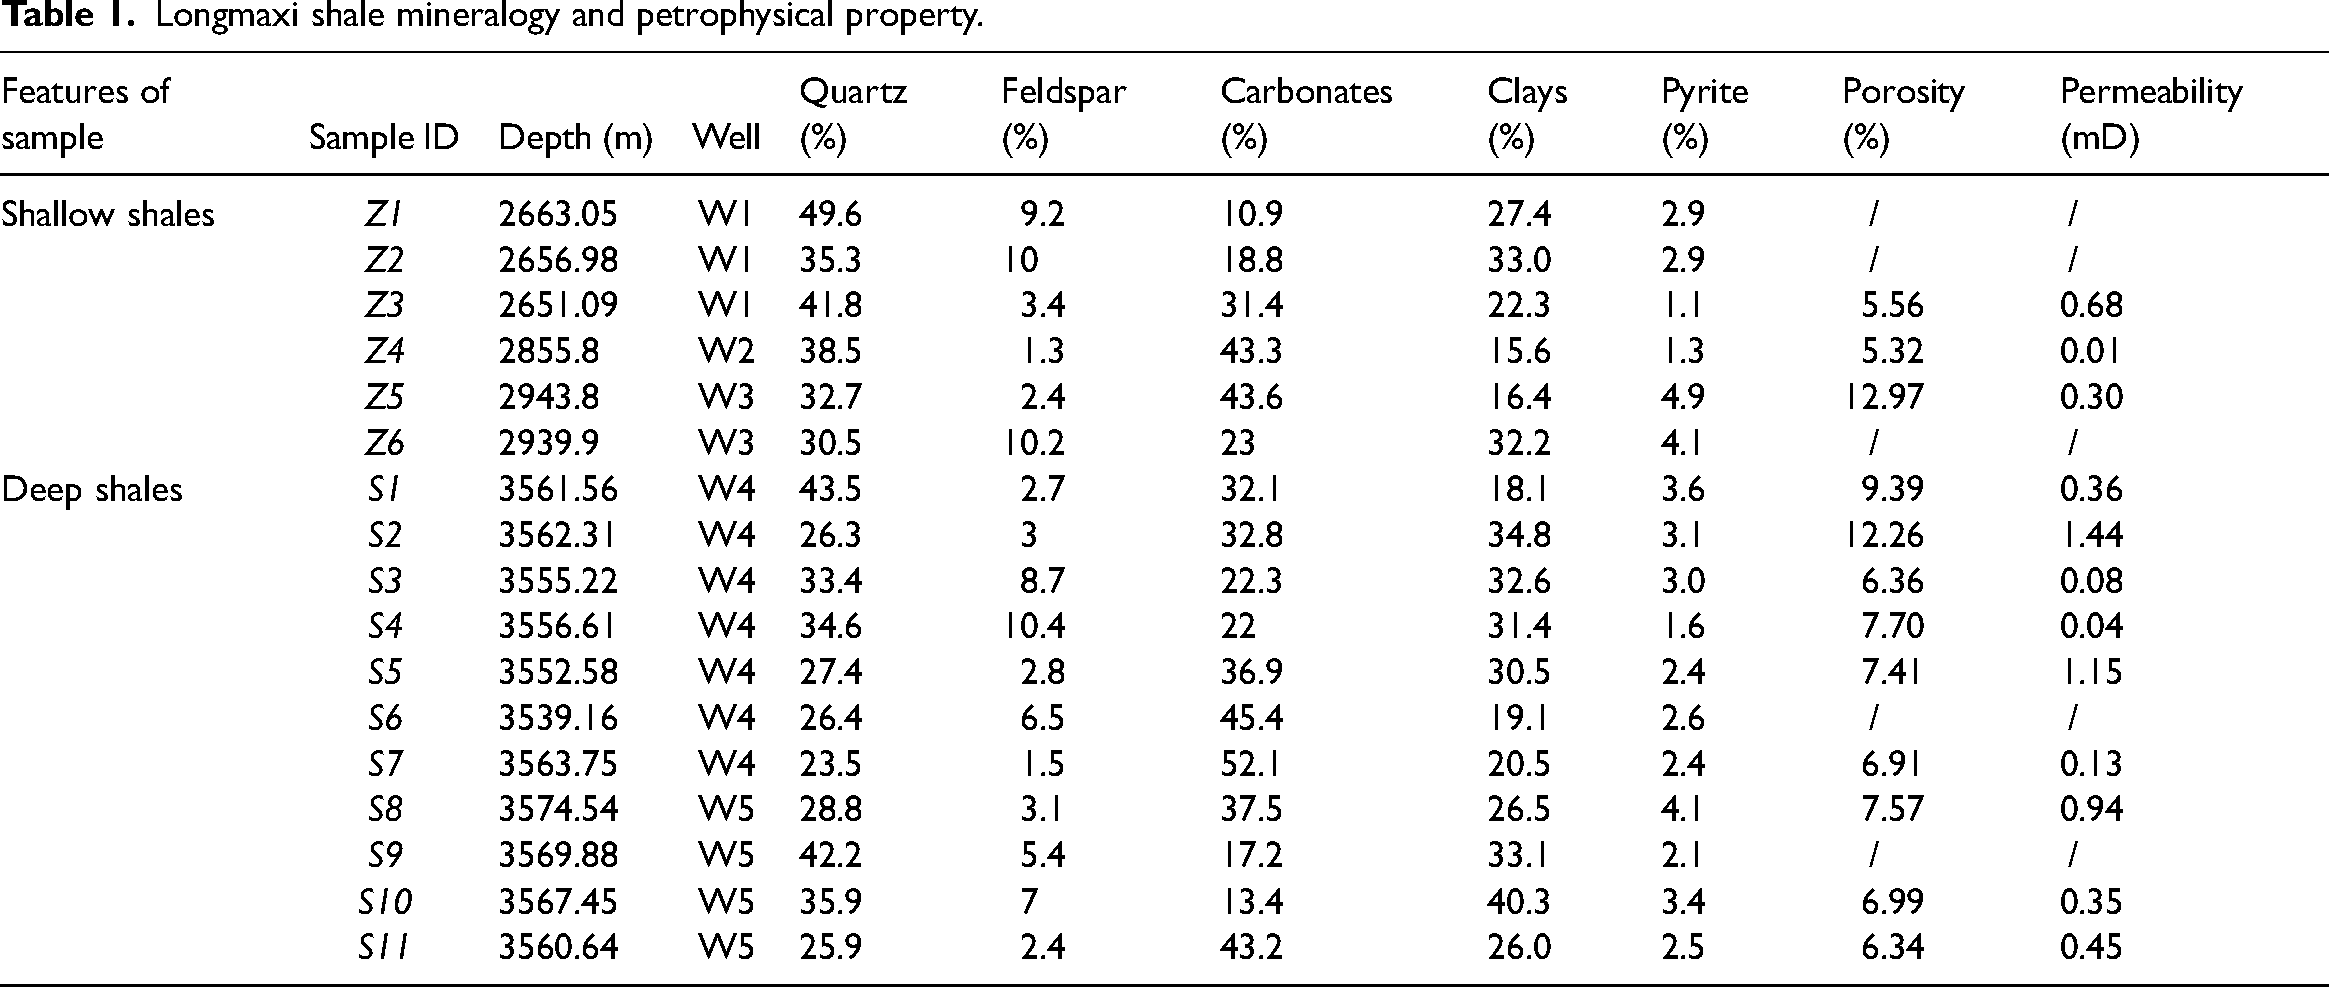
Both shallow and deep samples are relatively similar in mineralogy. The deep shale could contain a slightly higher amounts of clays and carbonates and a slightly smaller amount of quartz minerals than the shallow samples. But these changes are very weak and not regular and representative. These data do not show that the burial depth has significant constraints on shale mineralogy. This weak correlation between mineralogical content and burial depth suggests that these samples underwent similar diagenesis and thermal evolution under the condition of little difference in burial depth. Some researchers divide shale gas reservoirs into siliceous, calcareous and argillaceous (Loucks and Ruppel, 2007). Ternary diagrams using the mineralogical data of shale indicate if the rock has the high reservoir brittleness or not (Zhu et al., 2019). Figure 2 of a ternary diagram displays the mineralogical and brittle diversity analyzed in all samples, contrasted with the mineralogical composition of the several named shale gas reservoirs in North America. The mineralogical composition of shallow sample is similar to that of the Barnett Shale and Marcellus Shale, and the mineralogy of deep shale is mainly close to that of the Marcellus Shale. Loucks et al. (2009) shows that the Barnett and Marcellus Shales contain abundant silica minerals (e.g. biosiliceous quartz) and are the typical siliceous rocks. From Figure 2, the brittle mineral (i.e. quartz and feldspar) composition and content are highly variable in both shallow and deep samples, resulting in a variable fracture gradient. Thus, it could be expected that the deep zones are less formed artificial cracks and less fractured during stimulation than shallow zones.
Ternary plot displaying the range of mineralogical composition and content in our samples and several typical shale formations. Modified after Zhu et al. (2019).
Organic geochemistry
Generating hydrocarbons of organic-rich shales depends on the amount of organic carbon stored within the rock, which is measured as percentage of TOC. Jarvie et al. (2007) suggested that the higher the TOC content, the better the potential for shale gas generation and the higher the shale gas content. Less than 1 wt.% TOC suggests poor source rock and poor gas generation potential, TOC of 1–2 wt.% suggests fair source rock and fair gas generation potential, while TOC more than 2 wt.% indicates good source rock and good gas generation potential. Results show the TOC content of the shallow and deep samples ranges from 2.63 to 6.36 wt.% (average = 4.1 wt.%) and 2.24 to 6.30 wt.% (average = 3.74 wt.%), respectively. All samples have a TOC content more than 2%. Three values are greater than 6 wt.%, which are distributed in the depth of 2943.8, 3561.56, and 3562.31 m. In addition to TOC, rock pyrolysis parameters, such as S1 + S2 and hydrogen index (HI), can be used to predict the characteristics of source rock and gas generation potential. The S1 + S2 values range between 38.3 and 72.6 mg/g (Table 2). In the shallow shales, the mean S1 + S2 value is 52 mg/g with a range of 38.3–60.0%. In the deep shales, the mean S1 + S2 value is 60.8 mg/g with a range of 50.2–72.6 mg/g.
Organic geochemistry of shale samples.
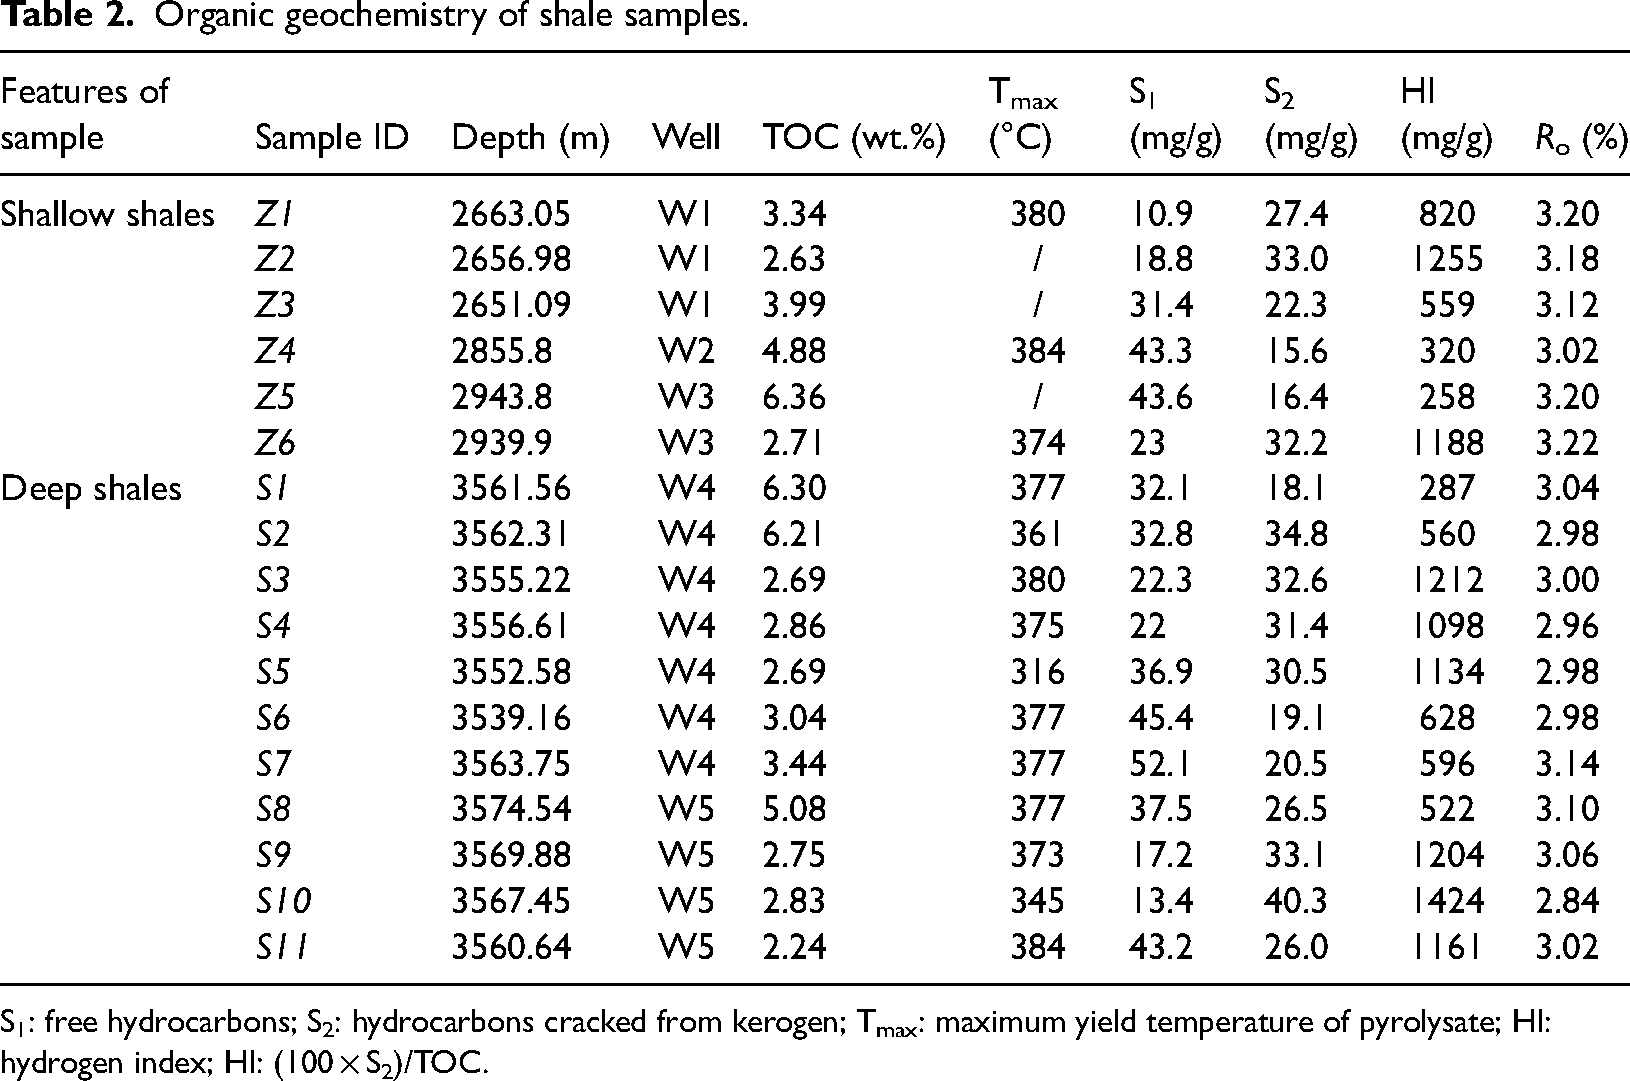
S1: free hydrocarbons; S2: hydrocarbons cracked from kerogen; Tmax: maximum yield temperature of pyrolysate; HI: hydrogen index; HI: (100 × S2)/TOC.
Source rock quality criteria using the TOC content and S1 + S2 values suggest most samples are good to excellent source rocks (Figure 3(A)). Specifically, the deep samples have the higher quantity than shallow shales. Slatt (2011) suggested that prolific gas-bearing shale systems are usually characterized by high HI values > 350 mg/g of rock. The Rock-Eval HI is primarily between 258 and 1424 mg/g (average = 837 mg/g). The average HI value of shallow and deep shales is 733 and 893 mg/g, respectively. Both S1 + S2 and HI are greater in deep samples compared with the shallow shales. HI and Tmax were used to determine the type II kerogen of organic matter of the shale samples (Figure 3(B)). The type II kerogen is marine origin and has moderate hydrogen content in oil–gas-prone source rock. The measured natural bitumen reflectance (Ro) averages approximately 3.06% (Table 2), with a range of 3.02–3.22% of shallow shales and 2.84–3.14% of deep shales, respectively. Figure 4 suggests these samples are within the thermogenic gas window (dry gas).
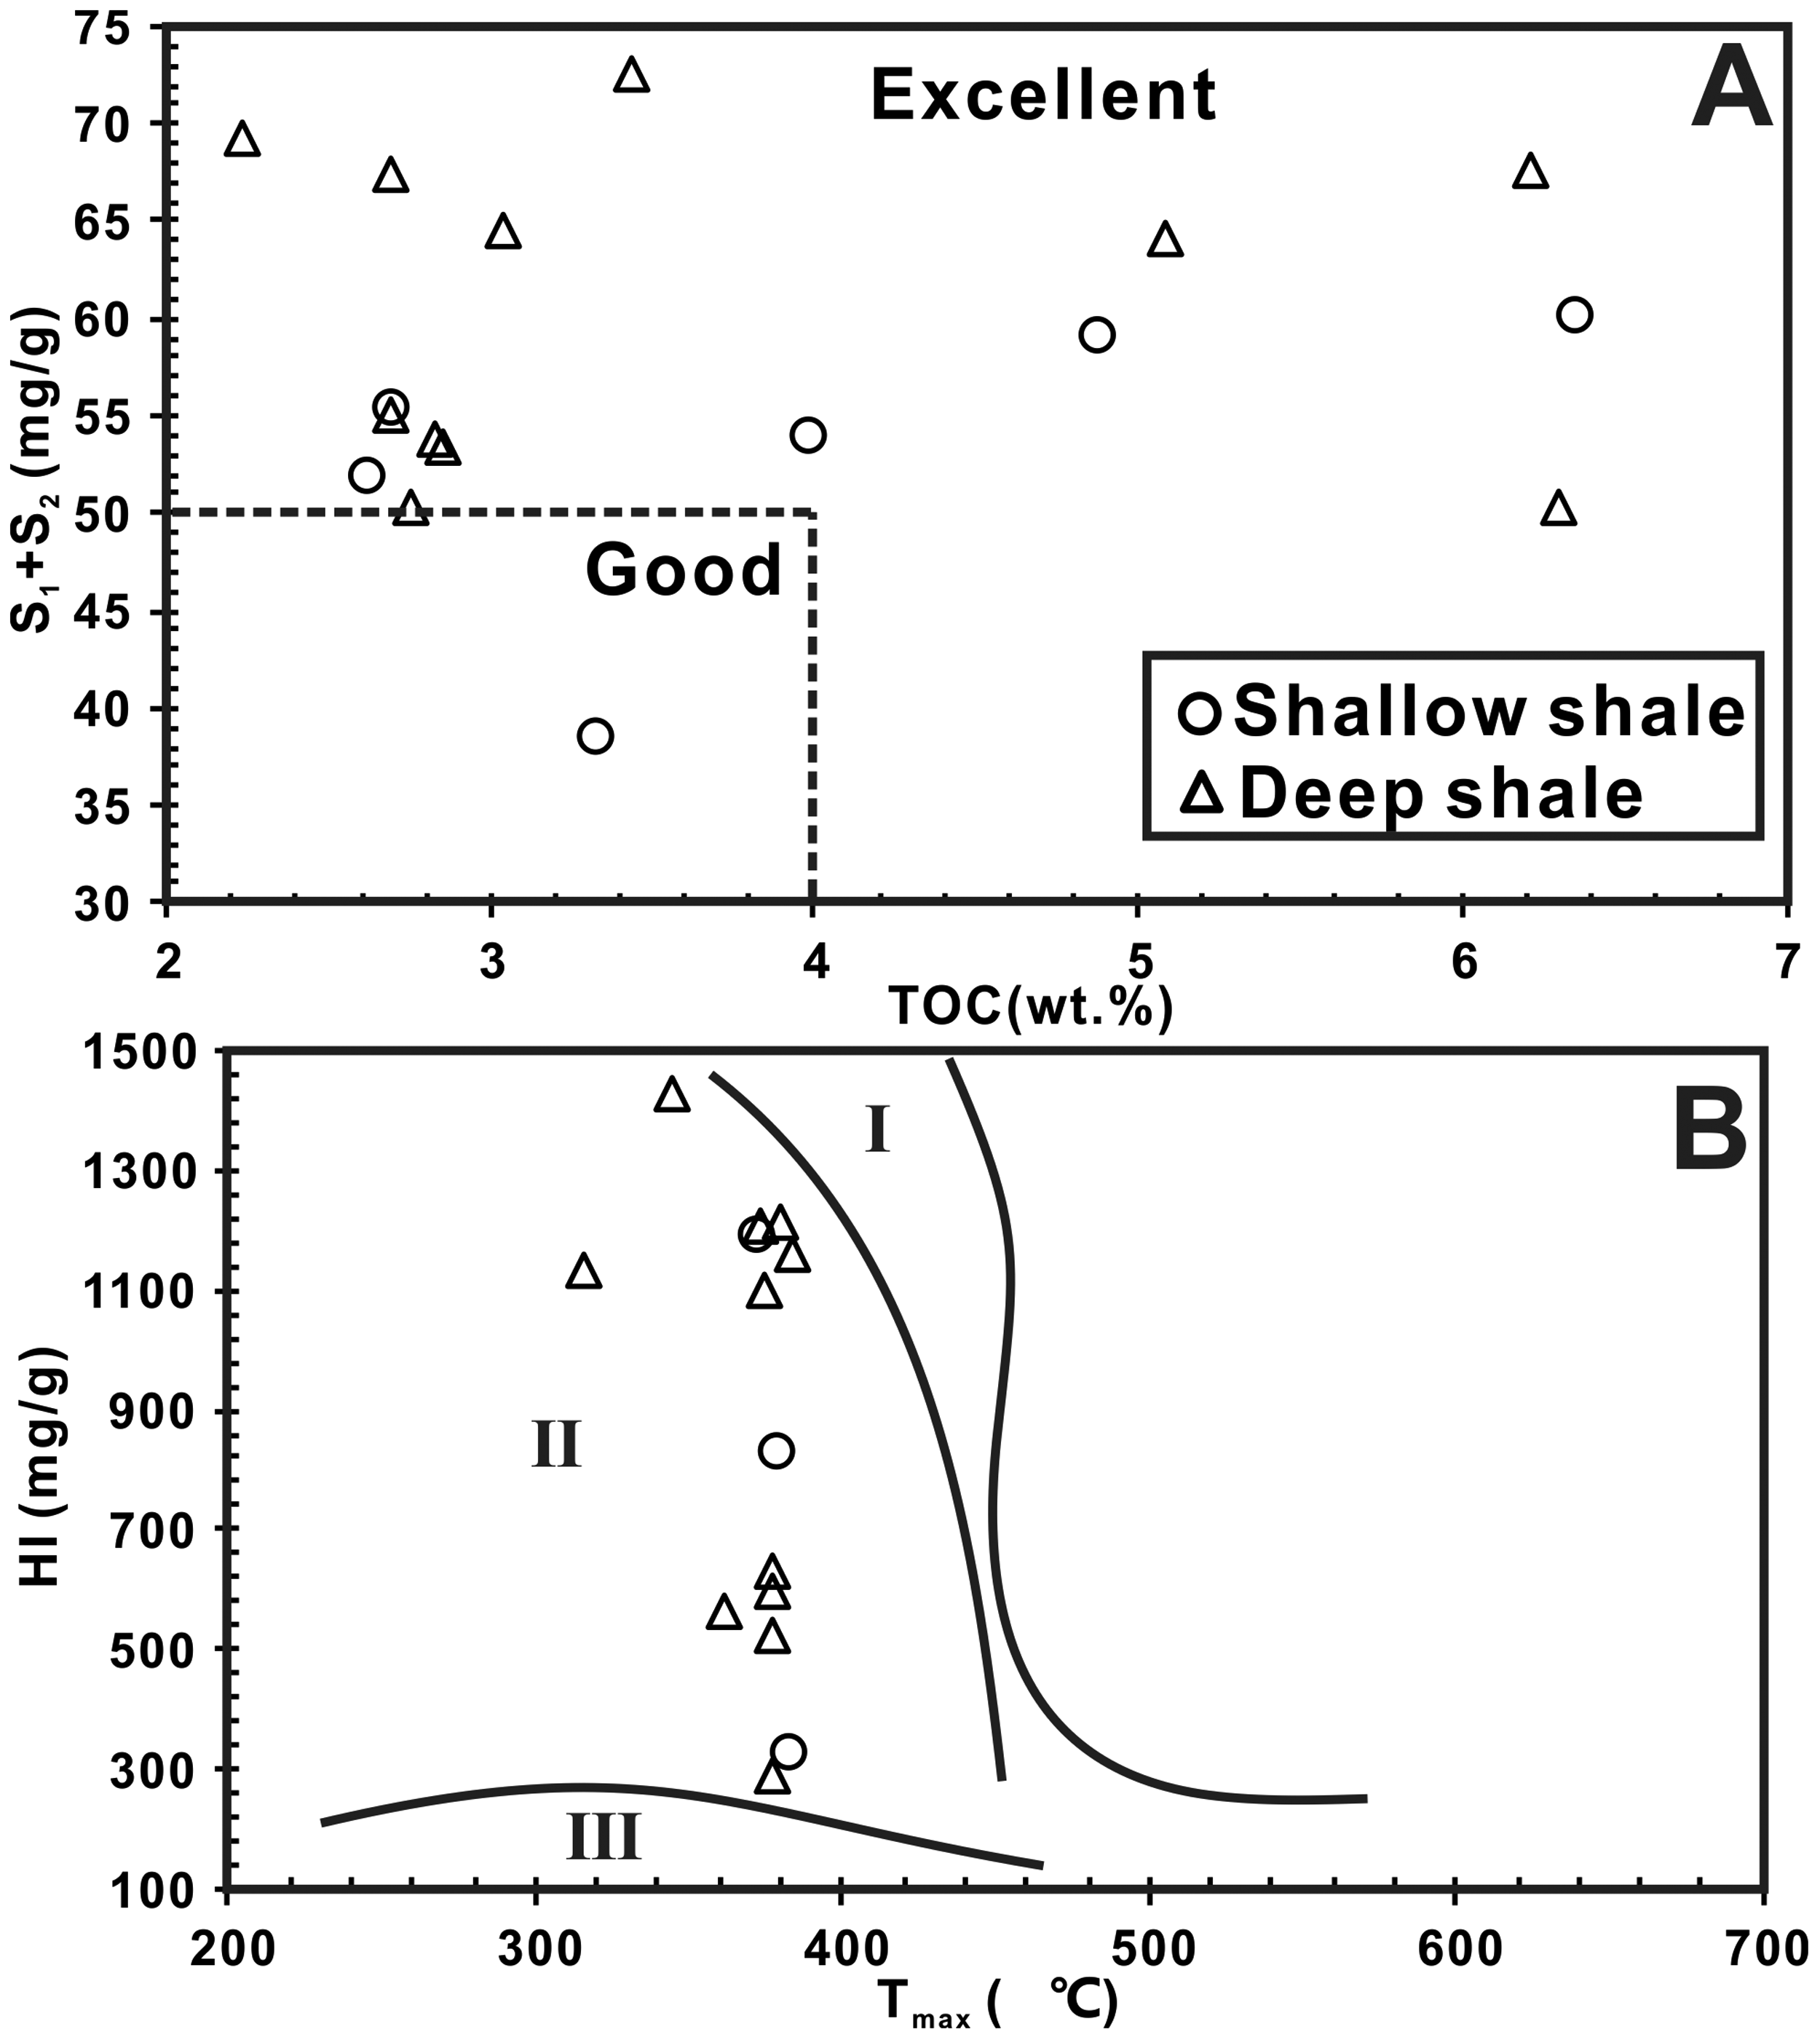
(A) Source rock quality by TOC content and S1 + S2 data. (B) Plot of HI versus Tmax showing the thermal maturation and kerogen type.
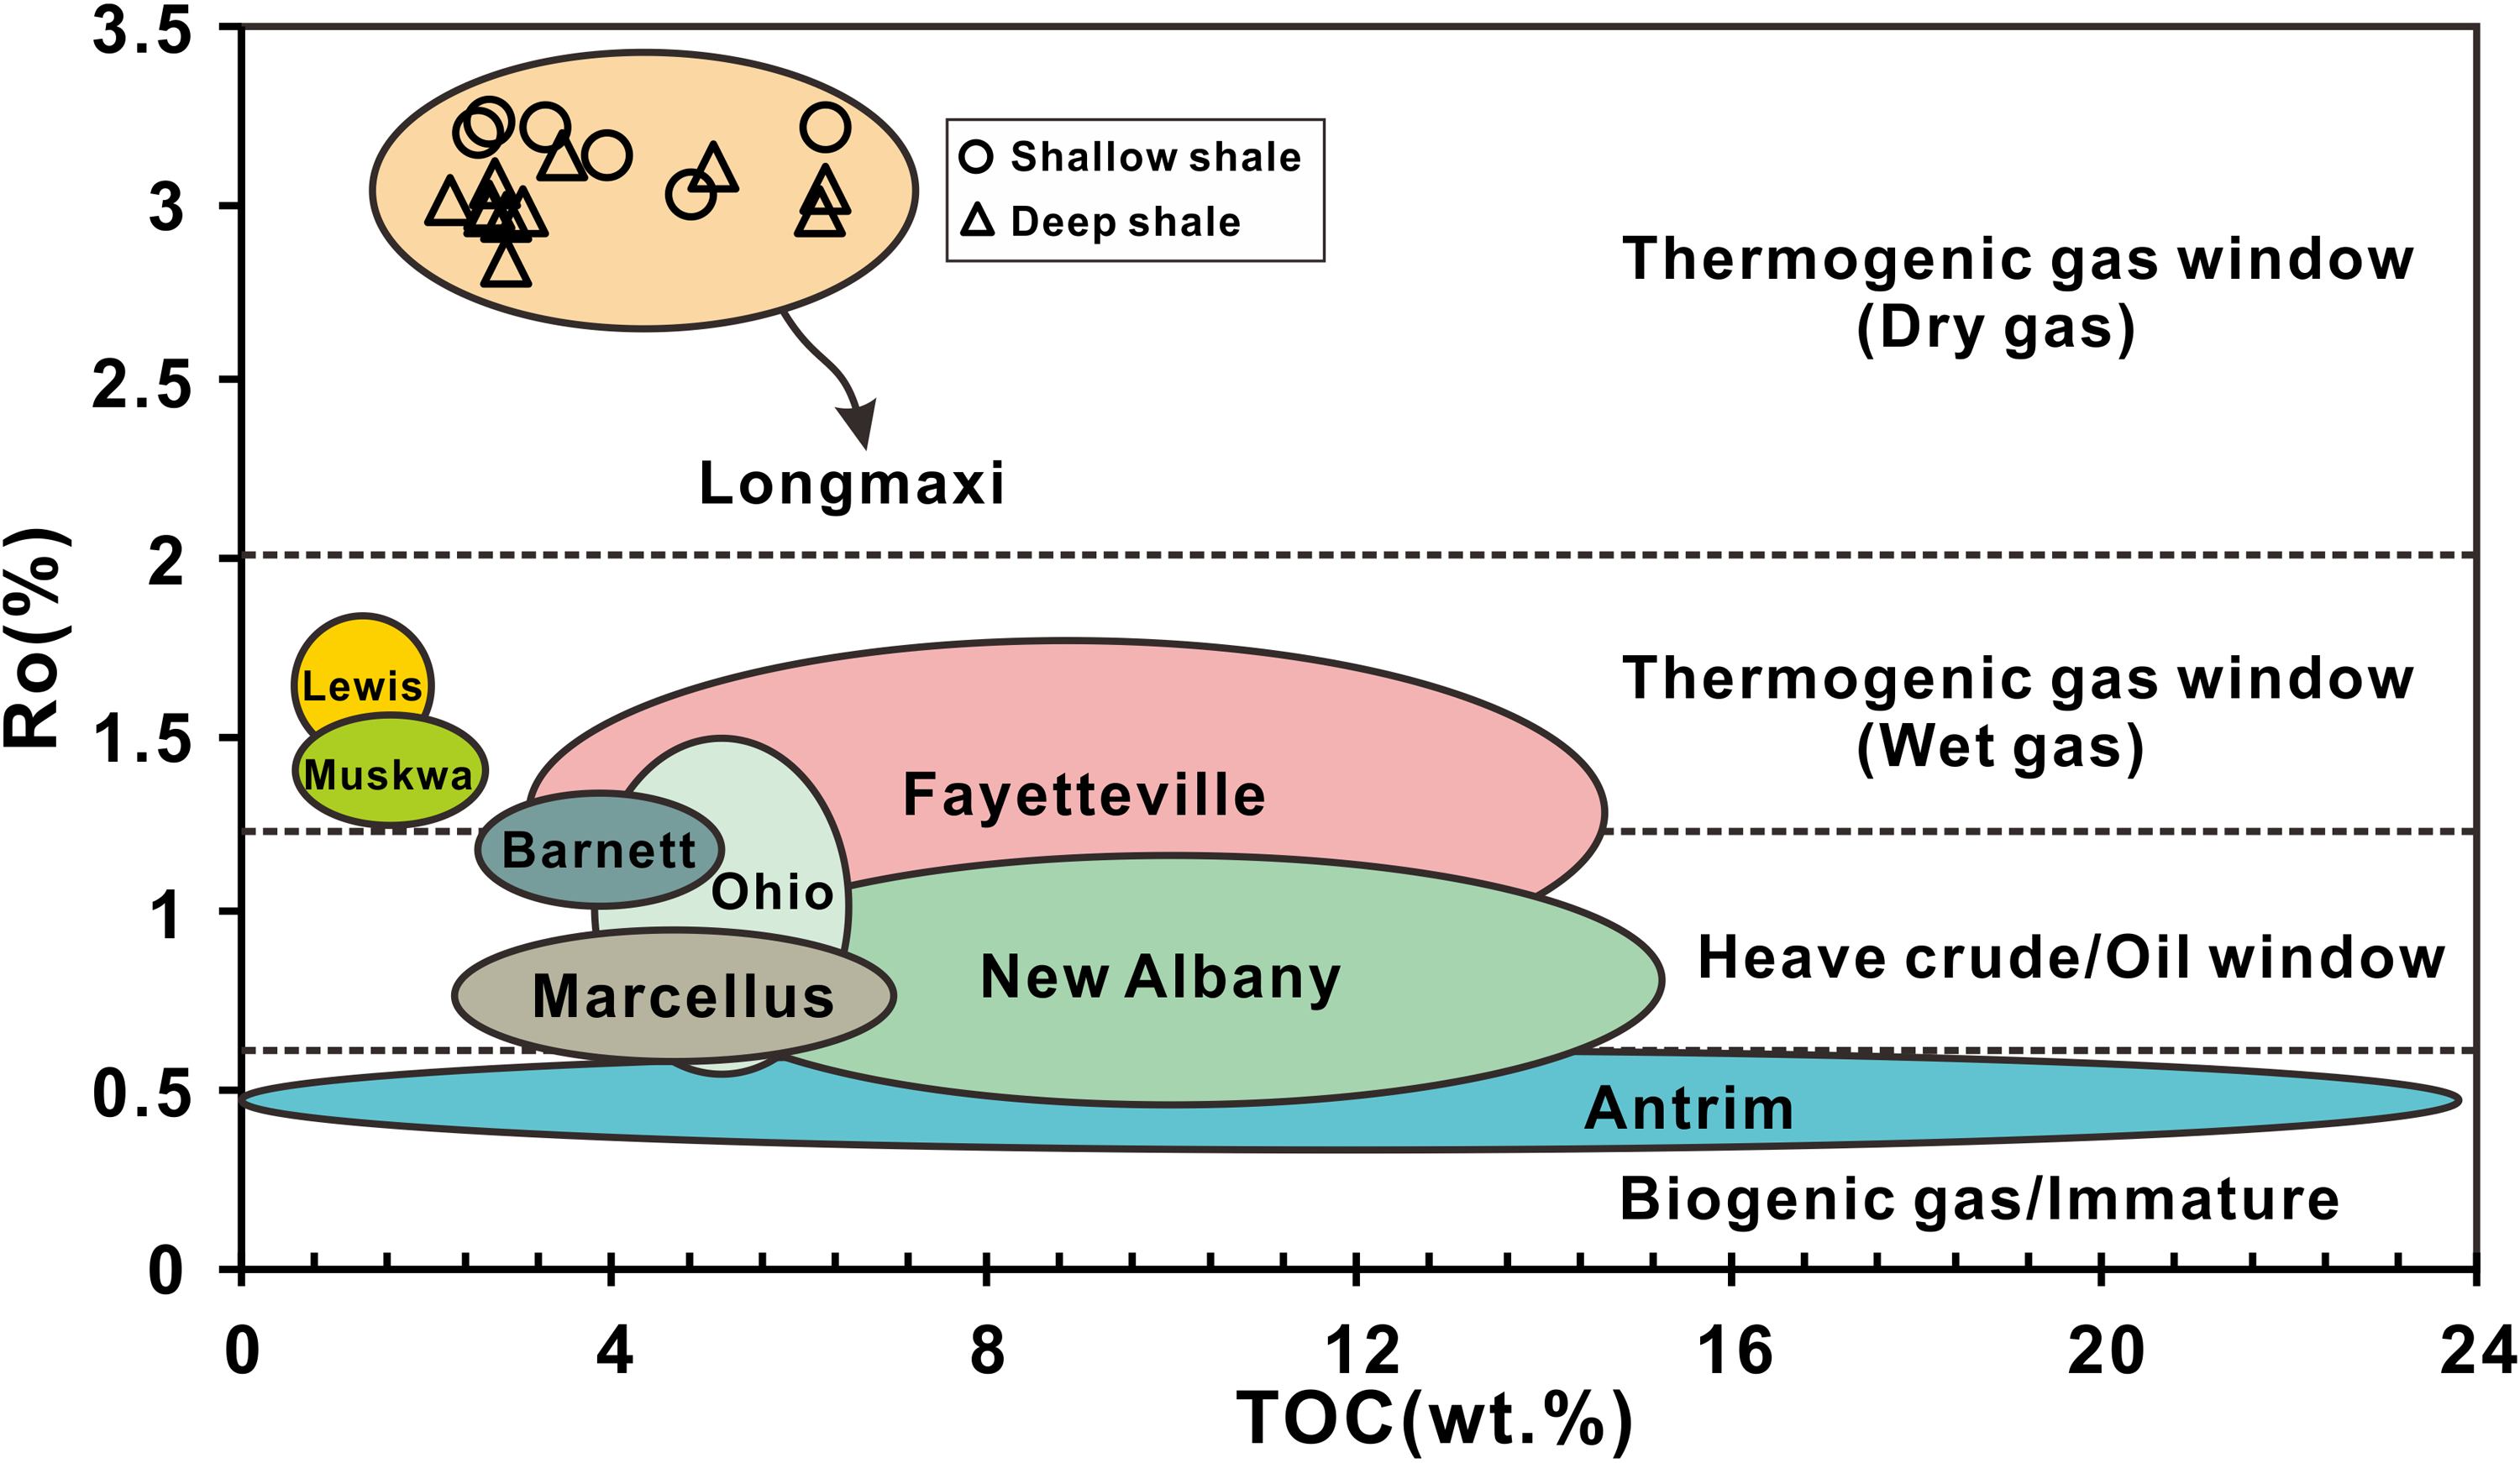
Plot of Ro versus TOC for typical shale formations. Modified after Slatt (2011).
Characteristics of pore structures
SEM analyses of pore types and morphology
Pore types and their related microstructural characteristics in organic-rich mudrocks (i.e. mudstone and shale) using high-resolution electron microscopies (e.g. FESEM, FIBSEM, TEM, HIM, and AFM) have been studied over the last several years (Loucks et al., 2009; Wei et al., 2019; Yu et al., 2019; Zhu et al., 2021). By the usage of FESEM to visually investigate the pore types, the pore system contains two dominated pore types, such as organic pores and mineral pores. Organic particles observed by FESEM present two common but highly irregular forms: banded organic residue and dispersed organic residue. Figure 5(A) presents an elongated organic layer that is interspersed with clay layers with three large opening pores in the centre. These pore sizes exceed 5 μm. Dispersed porous organic particles are commonly found between some interparticle pore spaces (Figure 5(B)). These organic pores have spongy and bubble-like cross-sections and range between 176 nm and 1.5 μm (average = 541 nm) in pore size showing good connectivity in 3D. Based on the analysis of Figure 5(C) using the Nano Measurer software, it was observed that the organic pore sizes exhibited a peak value in the range of 300–400 nm. Additionally, the pores with radii ranging from 300 to 600 nm contributed the most to the overall volume. The pores with pore size of 300 to 600 nm account for nearly 50% of the total organic pore volume.
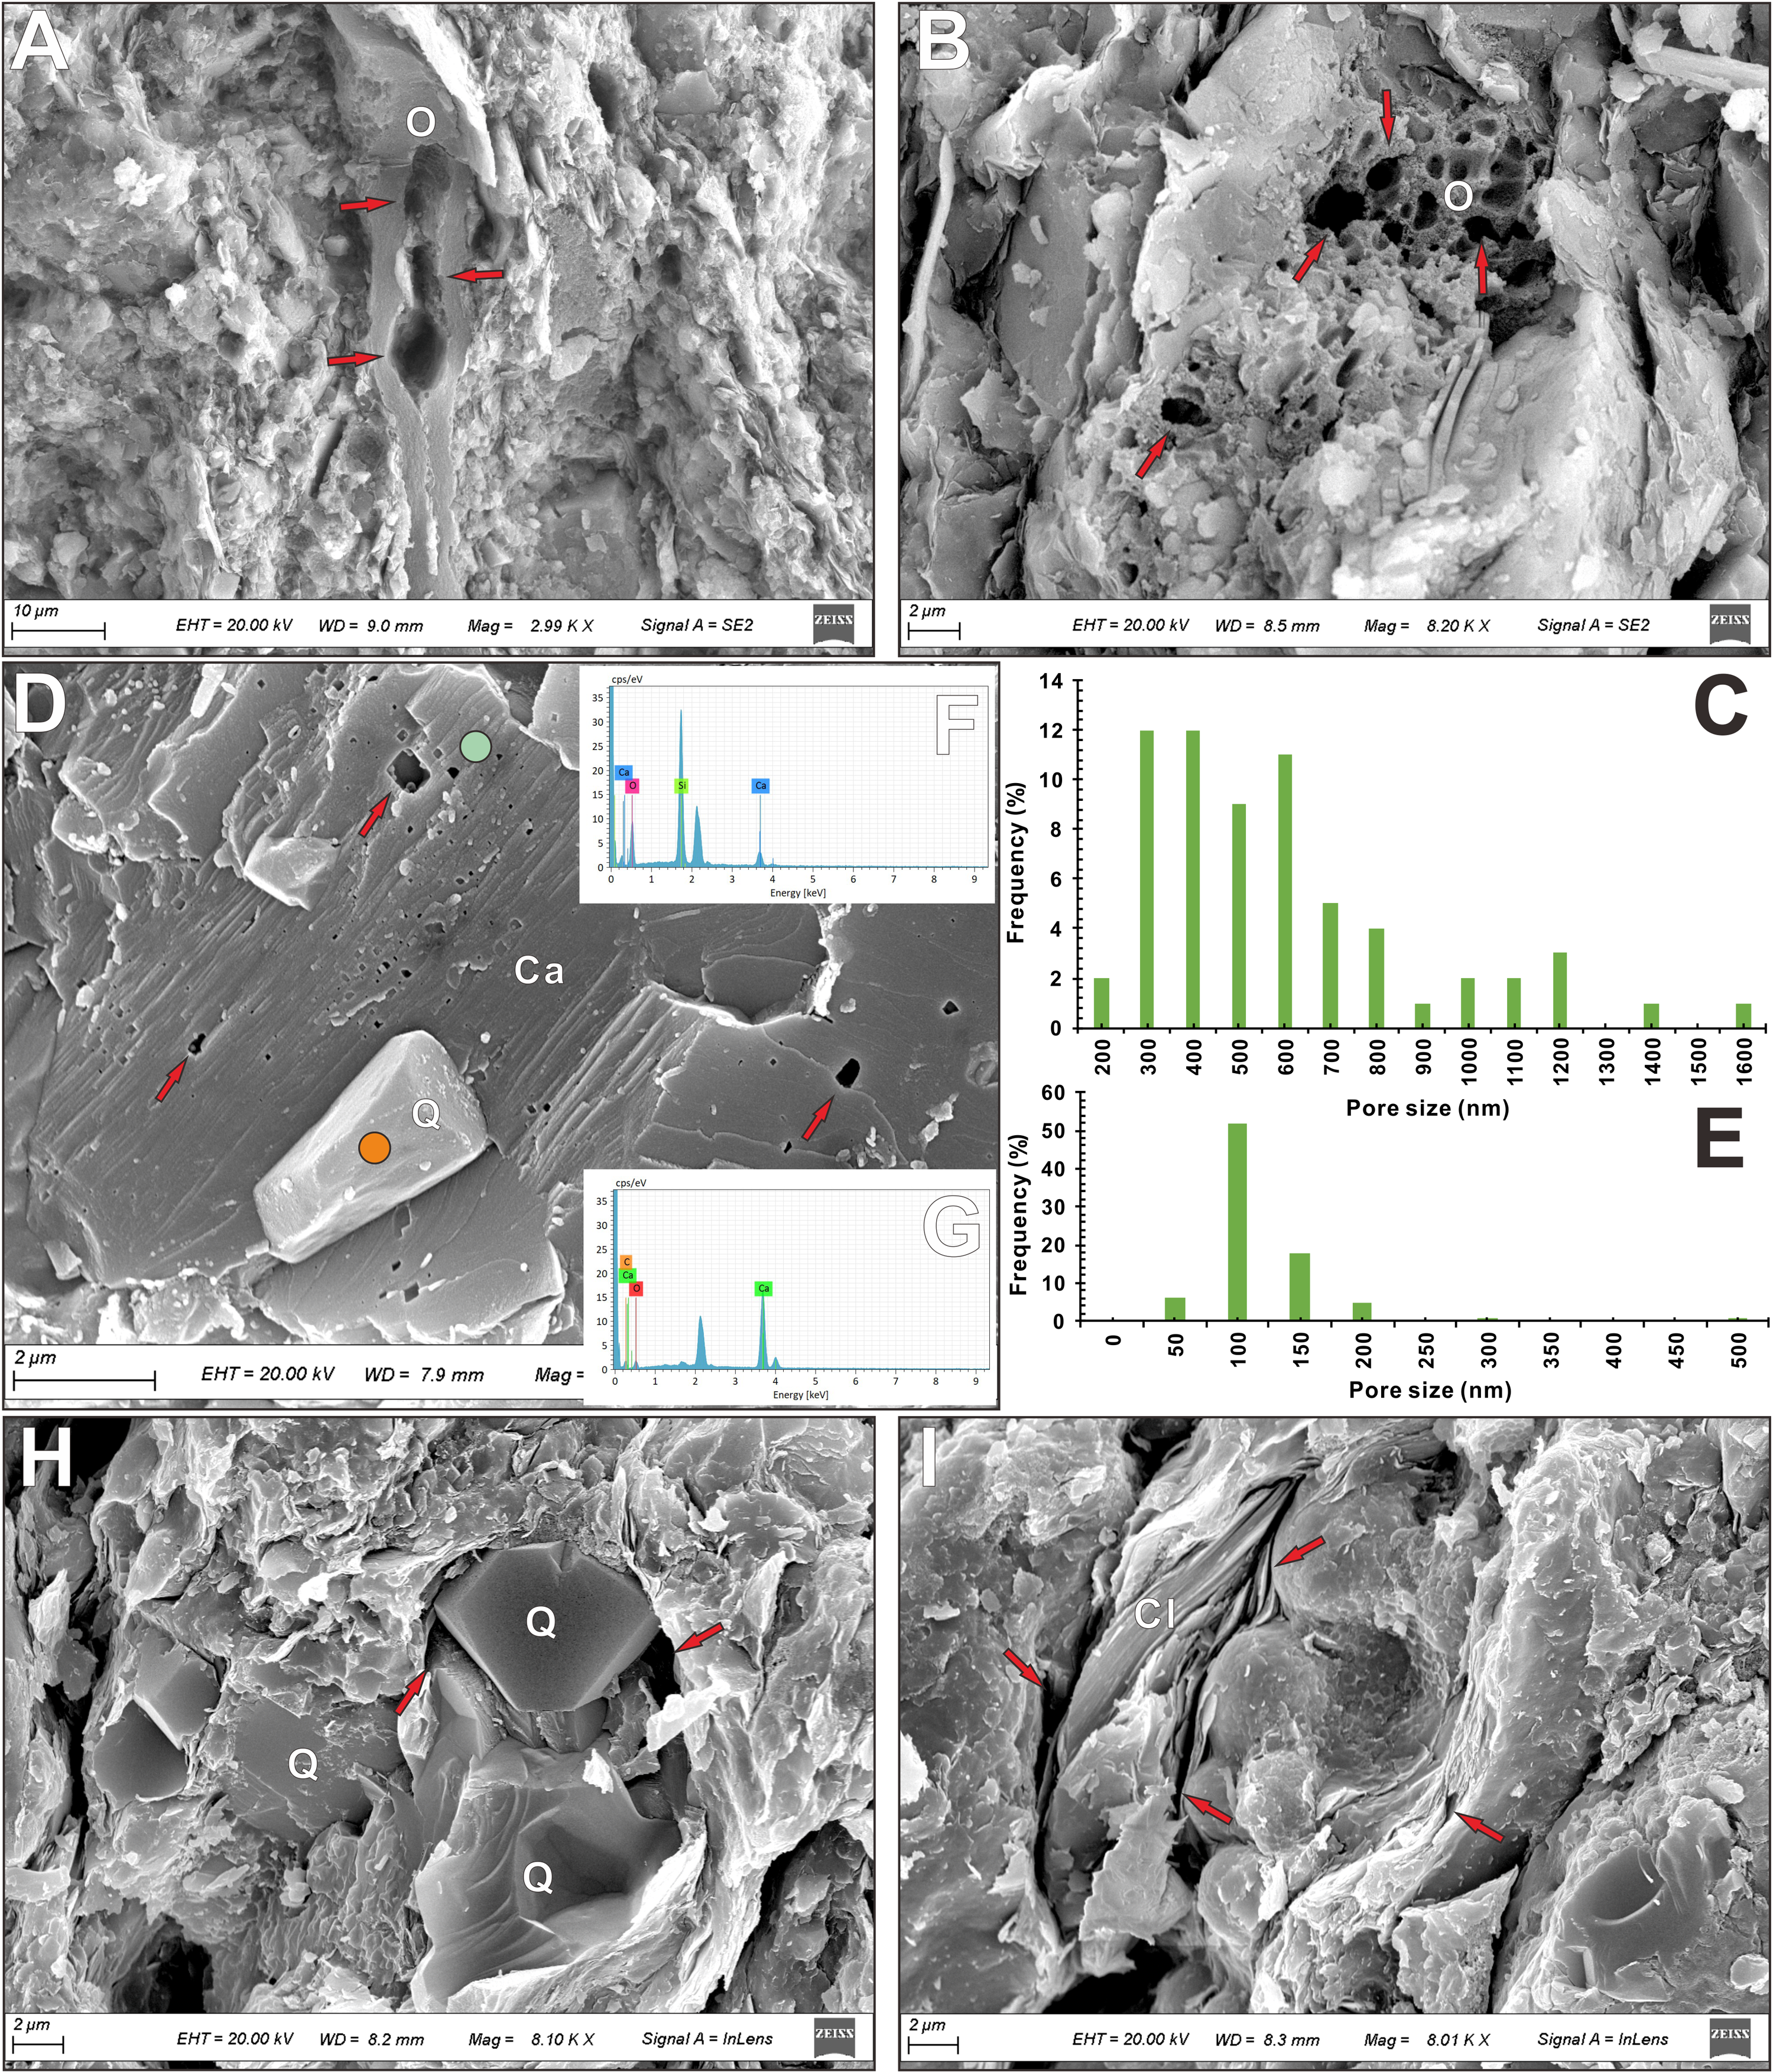
FESEM images presenting the pore type and pore morphology. (A) Images showing an elongate organic layer that is interspersed with clay layers with three large opening pores in the centre; W3 well, sample Z5, 2943.8 m. (B) Image showing spongy and bubble-like organic pores; W4 well, sample S3, 3555.22 m. (C) Pore size distribution of organic pores in B. (D) Image showing the intraparticle dissolution pores that are produced by partial dissolution of carbonate particles and concentrated in the centre with isolated porosity and bad connectivity; W2 well, sample Z4, 2855.8 m. (E) Pore size distribution of intraparticle dissolution pores in D. (F) The EDX analysis indicating the presence of O and Si at a representative orange point in D. (G) The EDX analysis indicating the presence of O and Ca at a representative green point in D. (H) Image showing interparticle quartz pores with angular cross-sections; W1 well, sample Z2, 2656.98 m. (I) Image showing interparticle clay pores with strong preferential orientation and high pore ratio; W1 well, sample Z2, 2656.98 m. Pores are indicated with red arrows.
Mineral pores are mostly associated with inorganic particles especially carbonates, quartz and clay. Mineral pores are formed within or between mineral grains. The three very common pores are intraparticle dissolution pores, interparticle quartz pores and interparticle clay pores. Abundant intraparticle dissolution pores are produced by partial dissolution of carbonate particles and concentrated in the centre with isolated porosity and bad connectivity (Figure 5(D)). The size of these pores appears to vary with the internal structure and location of carbonate particles. These dissolution pores have rectangular cross-sections and commonly range between 40 and 470 nm in pore size (average = 94 nm). From Figure 5(E) of PSD manually calculated using the Nano Measurer software, we can see that the peak value of these dissolution pore sizes ranges from 50 to 200 nm, and the greatest volumetric contribution is from pores that are approximately 100 nm in radius. The pores with pore size of 50–150 nm account for about 70% of the total dissolution pore volume. Note that a large euhedral calcite grain replaced by an authigenic quartz is indicated by EDX analysis (Figure 5(F) and (G)). Silicon composes 40.53% on the quartz grain at point of orange circle (Figure 5(F)), whereas it is totally absent at point of light green circle (Figure 5(G)) located on the surface of the calcite grain. The EDX analysis indicates the presence of Ca at both points, which are typical calcite mineral components. These microstructural characteristics are consistent with investigations observed by Zhu et al. (2022), on siliceous shales from the Longmaxi Shale using similar method. Interparticle pores are produced between rigid or ductile particles, such as quartz and clays. Based on our observation from Figure 5(H), it was noted that there were distinct interparticle quartz pores with angular cross-sections. These pores were typically found to be on the micron scale and could connect adjacent pores, forming a connected pore network. These microstructural features suggest that the origin of these pores is primary. Clay minerals occupy 26.5% of shale samples, and their hosted interparticle pores can be seen within or between them with elongated shape and range between 500 and 1000 nm in pore size. These pores generally present well preferential orientation and high pore ratio (Figure 5(I)).
Gas adsorption analyses of pore structures
One disadvantage of conducting low-pressure gas adsorption experiments is that they are limited in their ability to provide pore structure information for only small openings (Cockreham et al., 2020; Fu et al., 2022; Wei et al., 2019; Yu et al., 2019; 2022). Although the pore structures can be quantified, they cannot match such microstructural information with organic matter or inorganic mineral carriers. In this study, shale samples were analyzed with CO2 to obtain relatively accurate information about micropores (<2 nm in pore size) and N2 to obtain mesopores (2–50 nm) and a small portion of macropores (50–100 nm).
Micropore structural characteristics document the strongest adsorption capacity in deep shale sample S1 (Figure 6(A) and (B)). The deep shale sample S11 and shallow shale sample Z1 adsorb the least amount of CO2, whereas shallow sample Z5 adsorbs intermediate volumes. An obvious change rule cannot be found between the CO2 adsorption capacity and burial depth within our samples. Note that volumes of adsorbed CO2 significantly increase with increasing TOC content to reach a maximum in the samples of S1 and Z5. The TOC value of these two samples is more than twice that of the other two samples (S11 and Z1). The PSD corroborated by the DFT incremental micropore size distributions is illustrated from the CO2 adsorption analyses using pore volume (Figure 6(C)) and pore surface area (Figure 6(D)), respectively. All samples present a decline in pore volume and pore surface area with increasing micropore size, particularly within the micropore range (<1 nm). The deep sample S1 contains the largest micropore volumes (Figure 6(C)) and surface areas (Figure 6(D)) between the pore diameters of 0.4 and 0.9 nm compared with the other samples. The most important contribution to surface area is from the pore diameters between 0.4 and 0.7 nm (Figure 6(D)). The shallow sample Z5 contains the second largest micropore volumes and surface area, the shallow sample Z1 showing moderate pore volumes and surface area, and the deep sample S11 contains the least. The CO2 adsorption analysis illustrates the importance of some micropores (<1 nm in diameter) with respect to containing the greatest amount of pore surface area. This bimodal distribution of PSD of micropores over shale organic matter abundance indicates that the shales with high TOC can greatly generate abundant micropores with large micropore volumes and pore surface area. The DFT incremental micropore PSD demonstrates significant changes throughout organic matter abundance (Figure 6(C) and (D)). Four shale samples express similar two volumetric and pore-width maxima at pore widths of 0.5 and 0.8 nm (Figure 6(C) and (D)) and these micropore volumes and surface area are recorded for all samples.
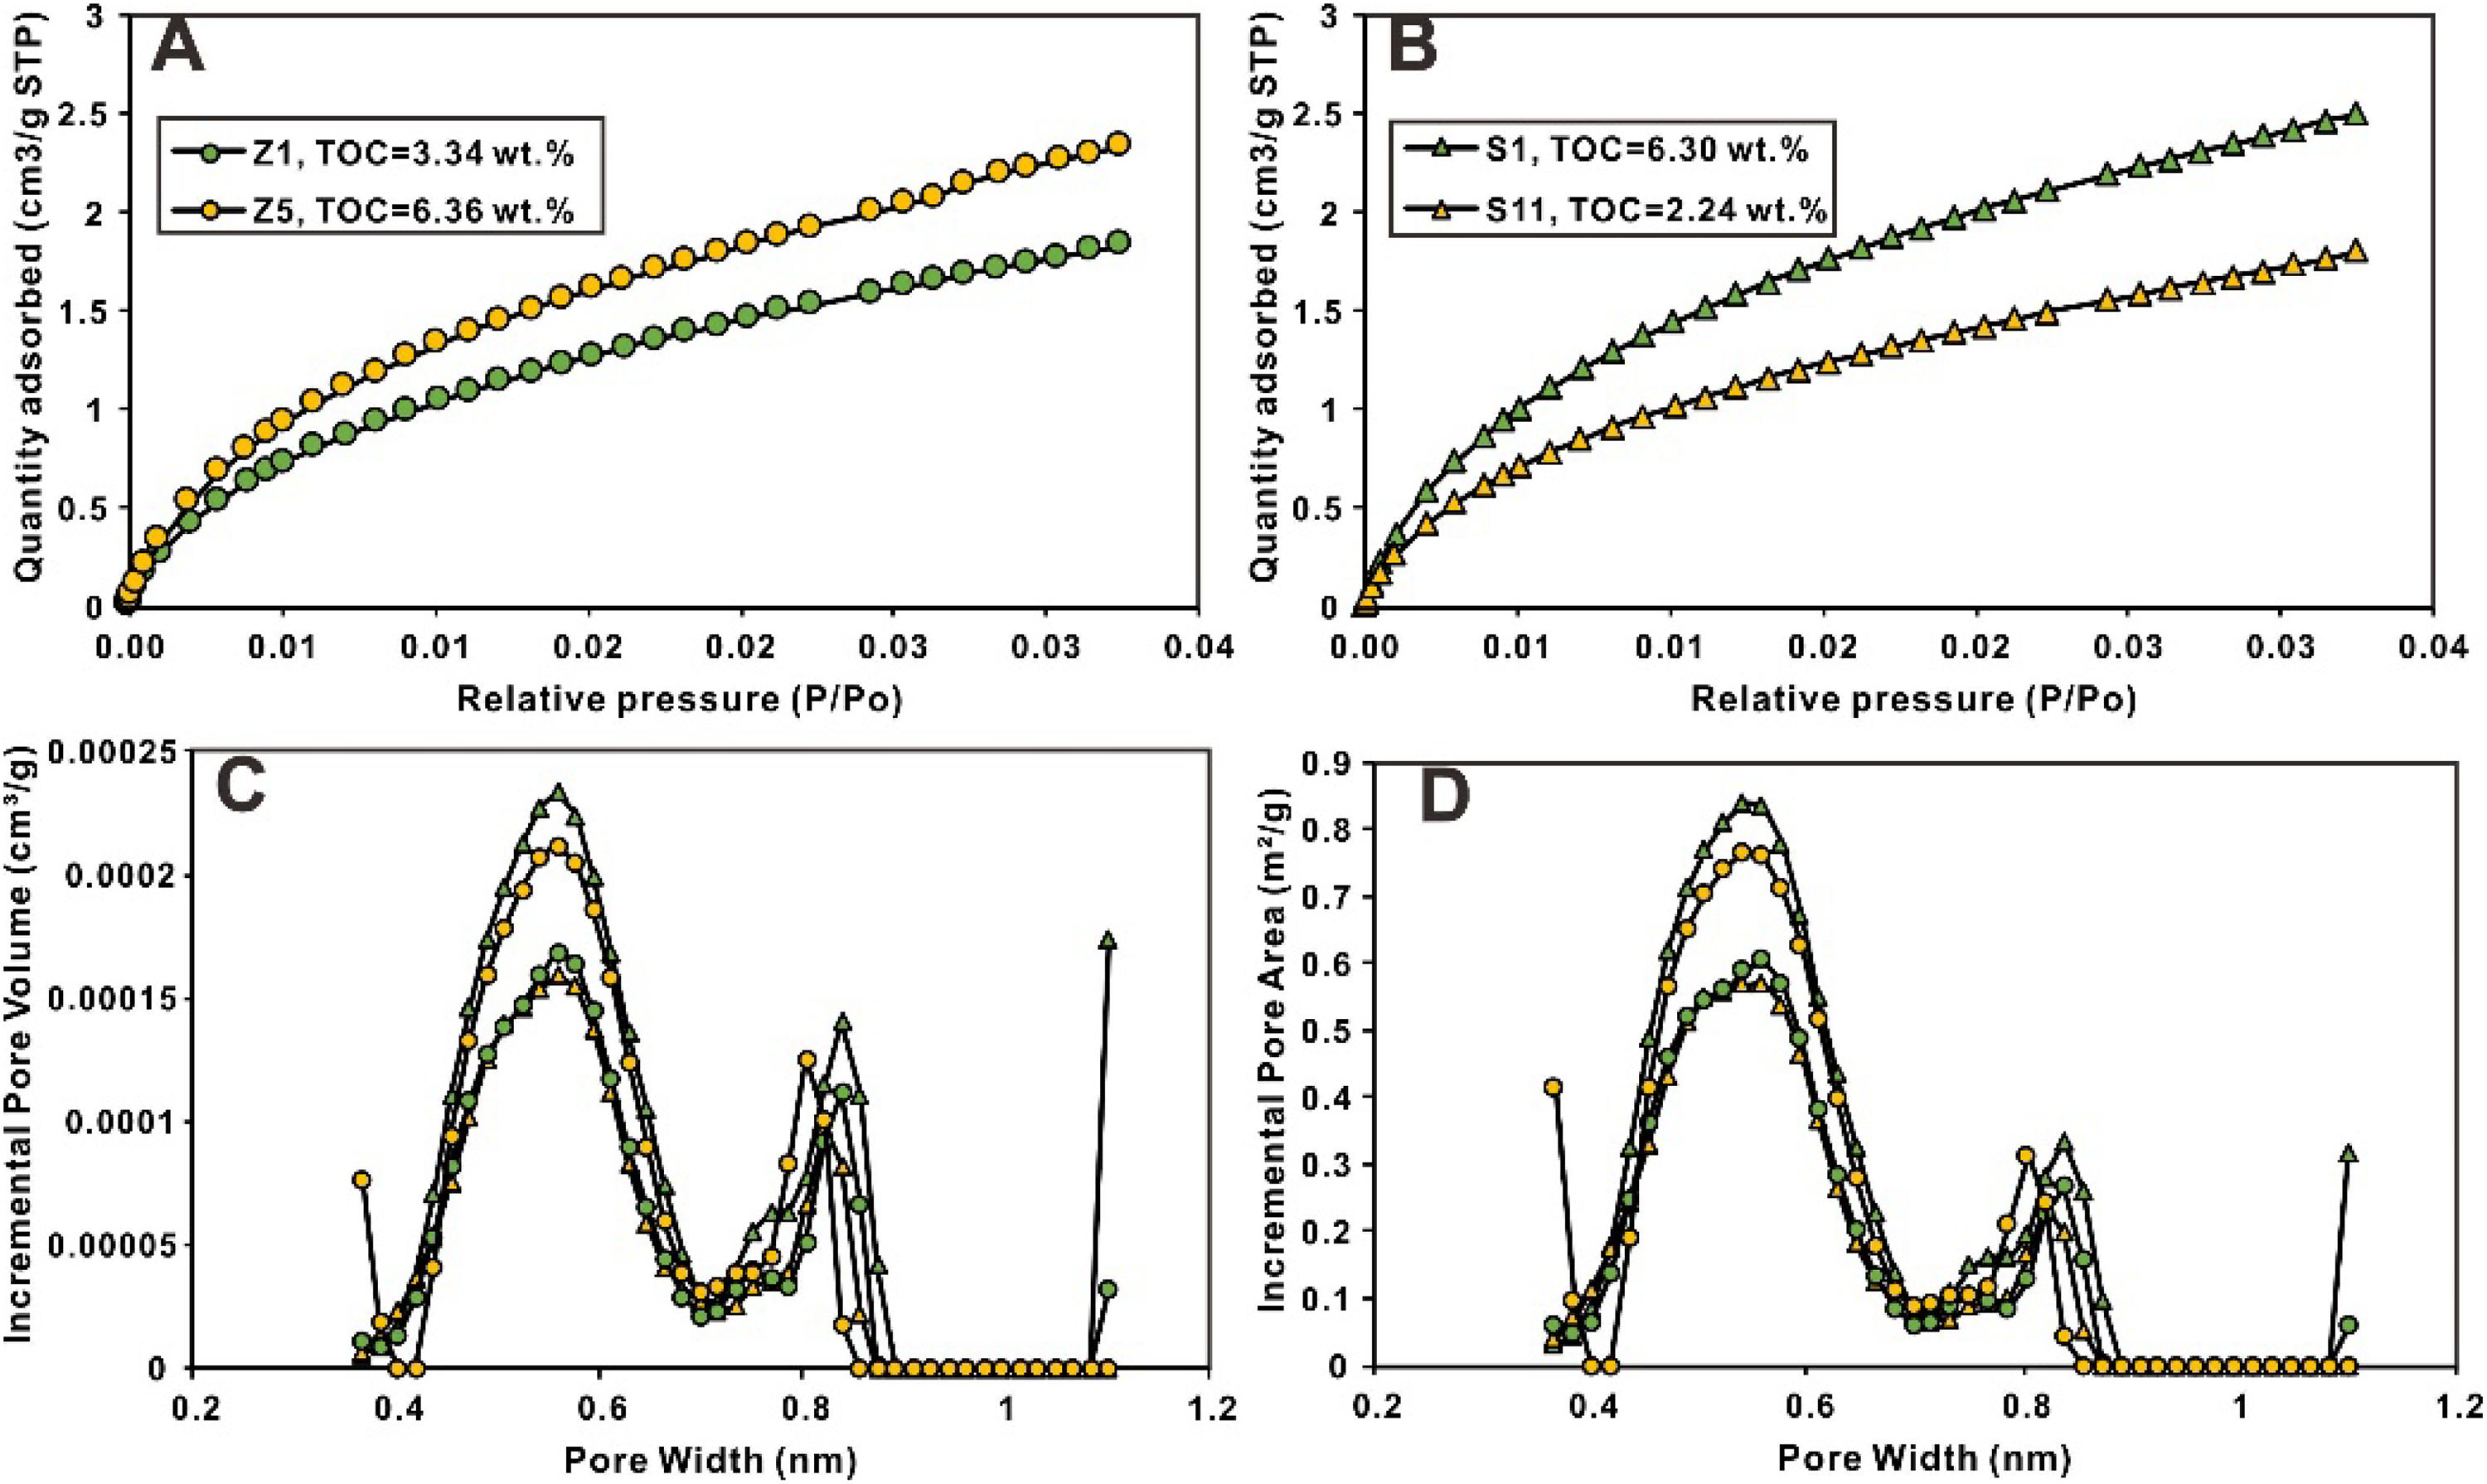
Micropore characteristics obtained using CO2 adsorption. (A) Low-pressure CO2 adsorption isotherms of shallow samples. (B) Low-pressure CO2 adsorption isotherms of deep samples. The DFT incremental micropore size distributions obtained using pore volume (C) and pore area (D).
Low-pressure N2 adsorption isotherms (type IV with hysteresis) were used to quantify mesopore and a small portion of macropores characteristics (Figure 7(A) and (B)). The pattern of N2 adsorption volumes with increasing TOC content of samples follows that of CO2 adsorption (Figure 6(A) and (B)). The strongest N2 adsorption is observed in deep sample S1 (Figure 7(B)), followed by declining values with decreasing TOC to a minimum value in the samples of S11 and Z5 (Figure 7(A) and (B)). The PSD corroborated by DFT using low-pressure N2 adsorption is plotted as incremental pore volume (cm3/g; Figure 7(C)) and incremental pore surface area (m2/g; Figure 7(D)). All samples present a significant volume of pores with a pore size from 2 nm to 100 nm (Figure 7(C) and (D)). All samples have three volumetric pore-size maxima at 3, 9 and 40 nm (Figure 7(C)). The pore-size classes of about 4–20 and 30–50 nm account for most of the pore volumes (Figure 7(C)). However, these pores do not contribute to the total pore surface area. The most significant contribution to pore surface area is from the pore sizes between 2 and 4 nm (Figure 7(D)). Incremental N2 adsorption data indicate PSDs over increasing TOC. The largest mesopore and macropore volume and surface area occur in the deep shale sample S1 (Figure 7(C)). The samples of S11, Z1 and Z5 have the smallest mesopore and macropore volumes and surface areas. For example, the deep sample S1 presents a significant part of the pore volume between the diameters of 2 and 20 nm (mesopore size fraction) that contributes to most of the pore volume and pore surface area (Figure 7(C) and (D)). Within this study, S1 exhibits a high TOC content. The presence of organic matter has been found to increase the pore volume and surface area within the 2–20 nm range.
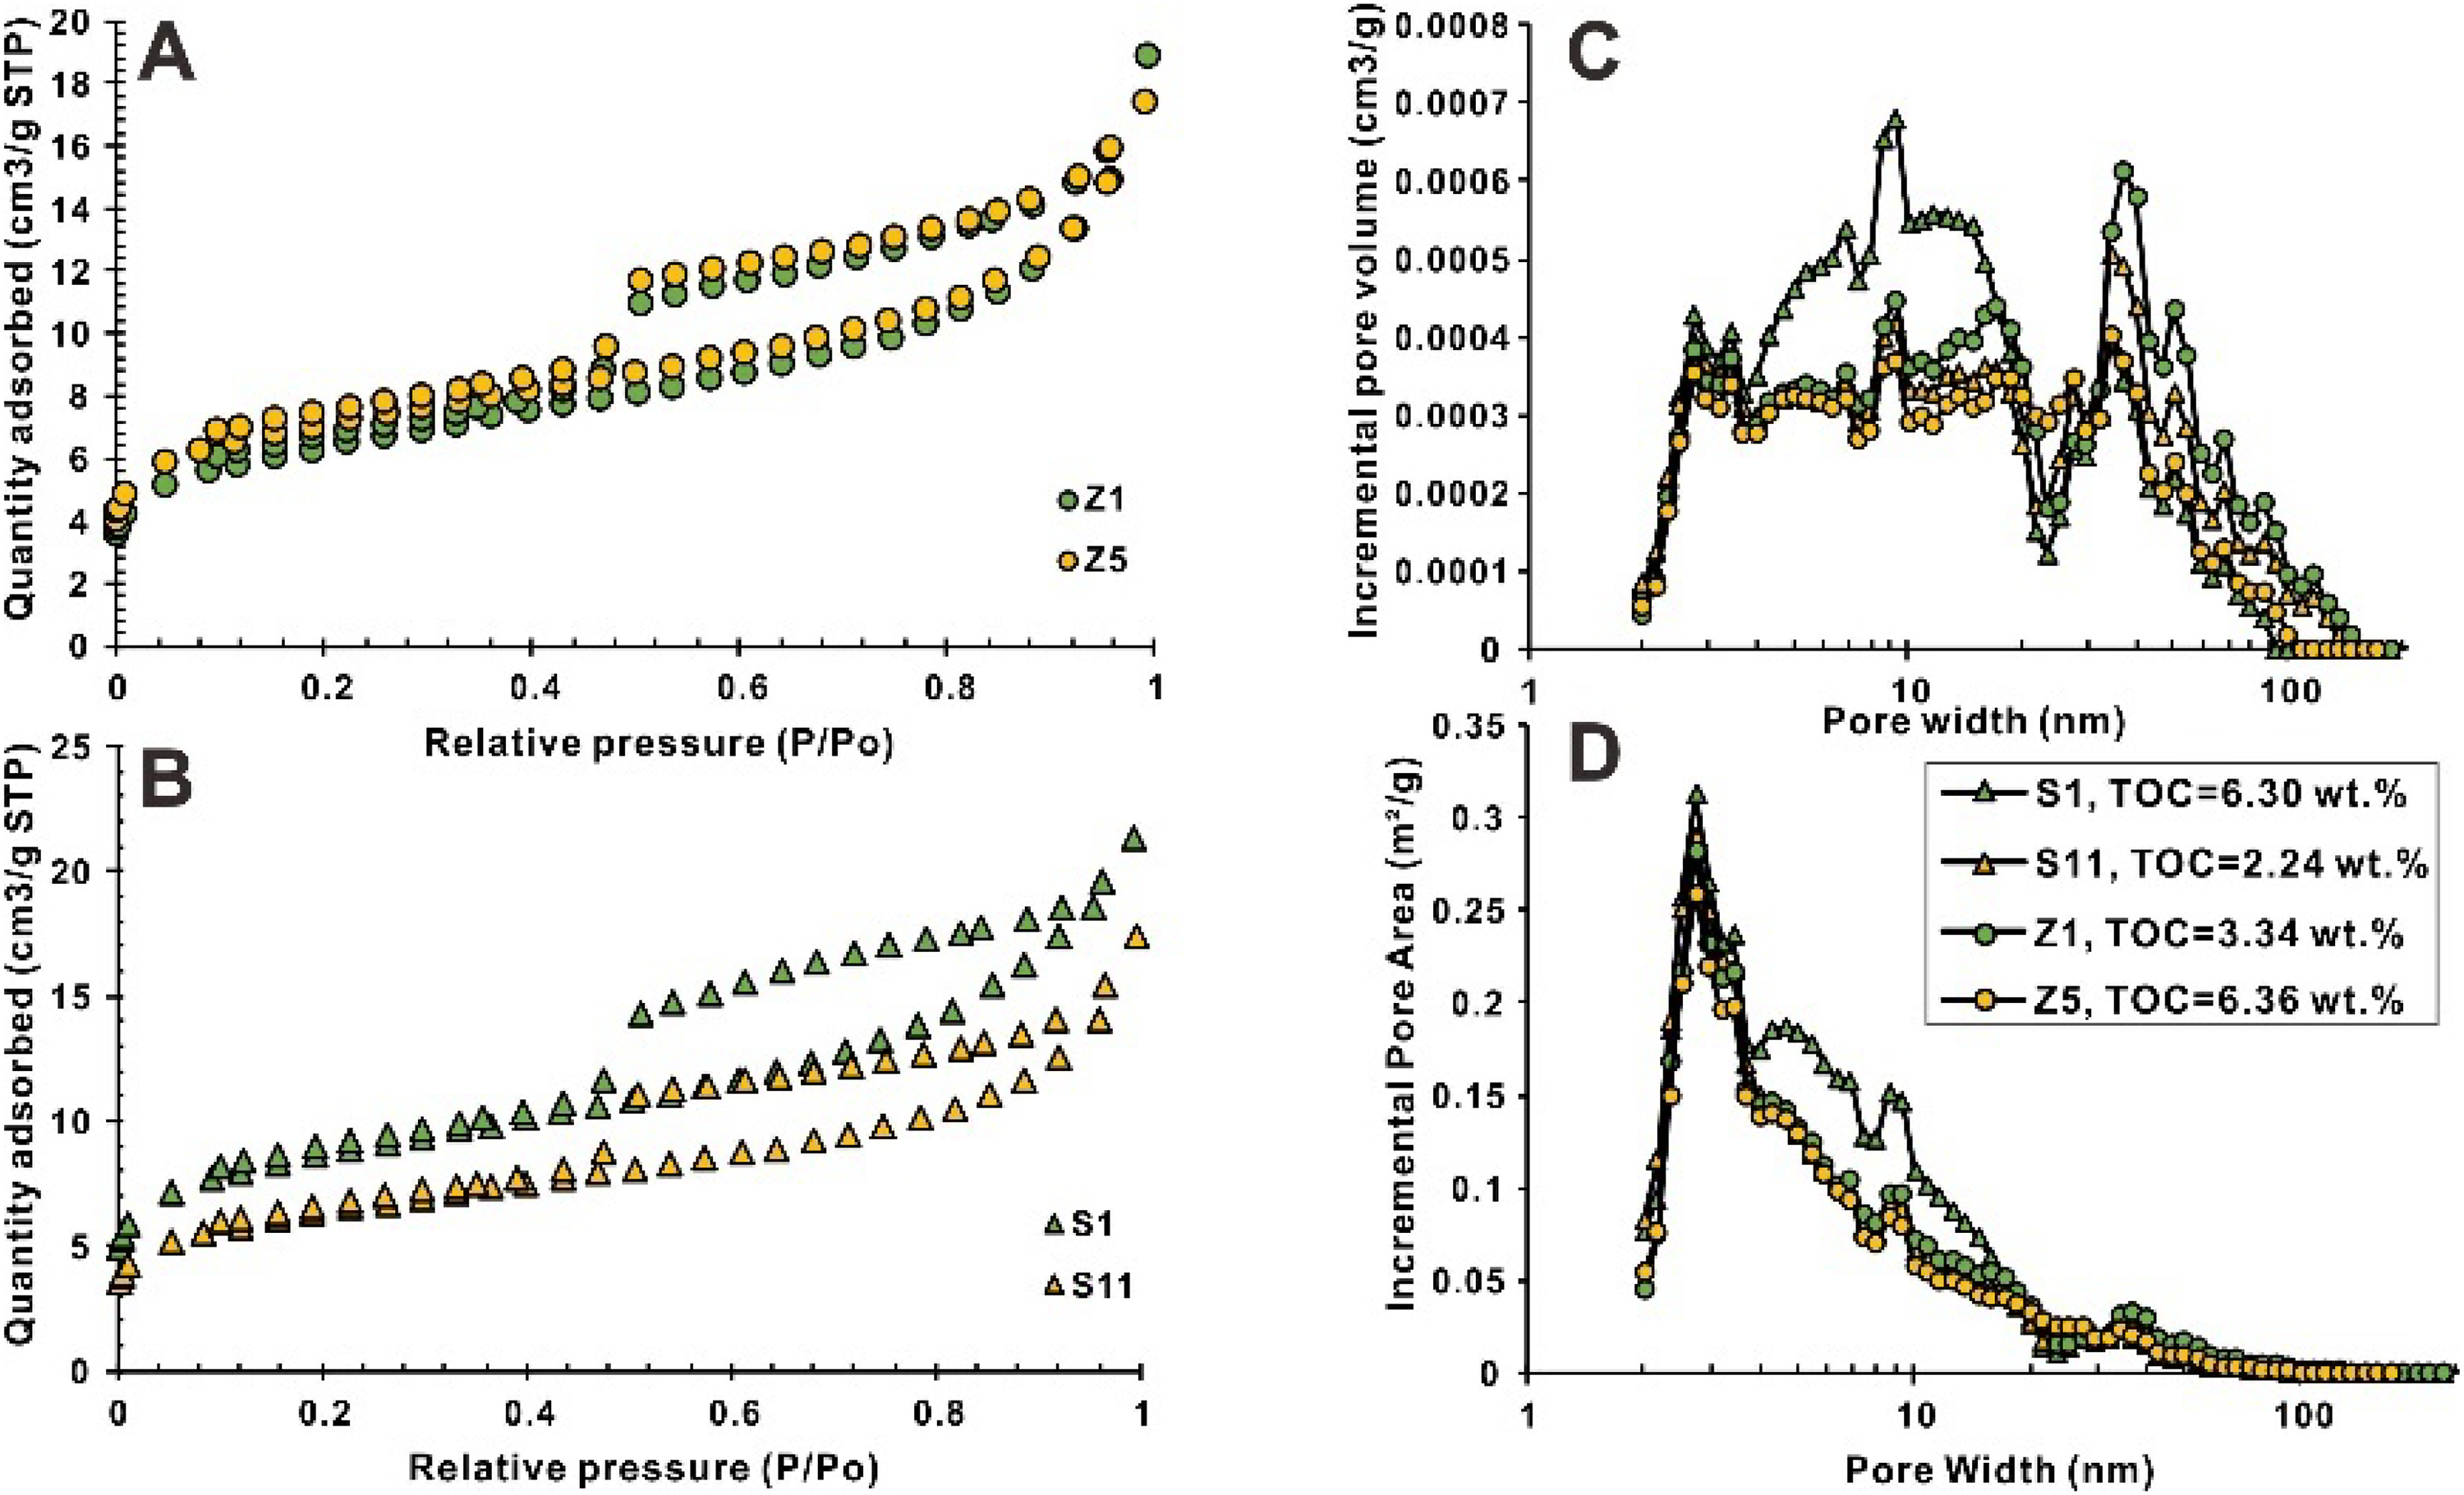
Mesopore and macropore characteristics obtained using N2 adsorption. (A) Low-pressure N2 adsorption isotherms of shallow samples. (B) Low-pressure N2 adsorption isotherms of deep samples. The DFT incremental mesopore and macropore size distributions using pore volume (C) and pore area (D).
Petrophysical property
A shale gas reservoir has two major functions: (1) storage capacity by storing shale gas, and (2) seepage capacity by transporting or sealing shale gas. The first is measured by porosity, and the second is measured by permeability (milli to nanoDarcies). Porosity and permeability values are given in Table 1. Most of the total porosity and permeability values range between 5% and 9% and 0.1 and 1 mD for all samples, respectively. Porosity varies from 5.32 to 12.97% with an average of 8.43% in shallow shale and 6.34 to 12.26% with an average of 8.14% in deep shale. Permeability values range between 0.01 and 0.68 mD with an average of 0.34 mD in shallow shale and 0.04 and 1.44 mD with an average of 0.58 mD in shallow shale. Deep samples are characterized by slightly lower porosity and by higher permeability than shallow samples (Table 1). For example, Z5 of shallow shale has the highest porosity (12.97%), Z4 has the lowest porosity with 5.32% (Table 1). S2 of deep shale has the highest permeability (1.44 mD), Z4 has the lowest permeability with 0.01 mD (Table 1). The relation between porosity and permeability has been studied (Figure 8(A)). The shallow shales presented a wider range of porosity and permeability values than deep samples. The results depicted in Figure 8(A) indicate that there is a weak positive correlation for both the shallow and deep shale samples. We can see that a large majority of deep and shallow samples are in the IV region (porosity > 2%, permeability > 0.1 mD), whereas three samples are in the Ⅲ region (porosity > 2%, permeability < 0.1 mD), within these two regions the shales have the best reservoir quality. Based on FESEM images (Figures 5, 8(B) and (C)), pore networks of these samples include organic pore, intraparticle dissolution pores, interparticle quartz pores, interparticle clay pores, as well as the microfracture porosity.
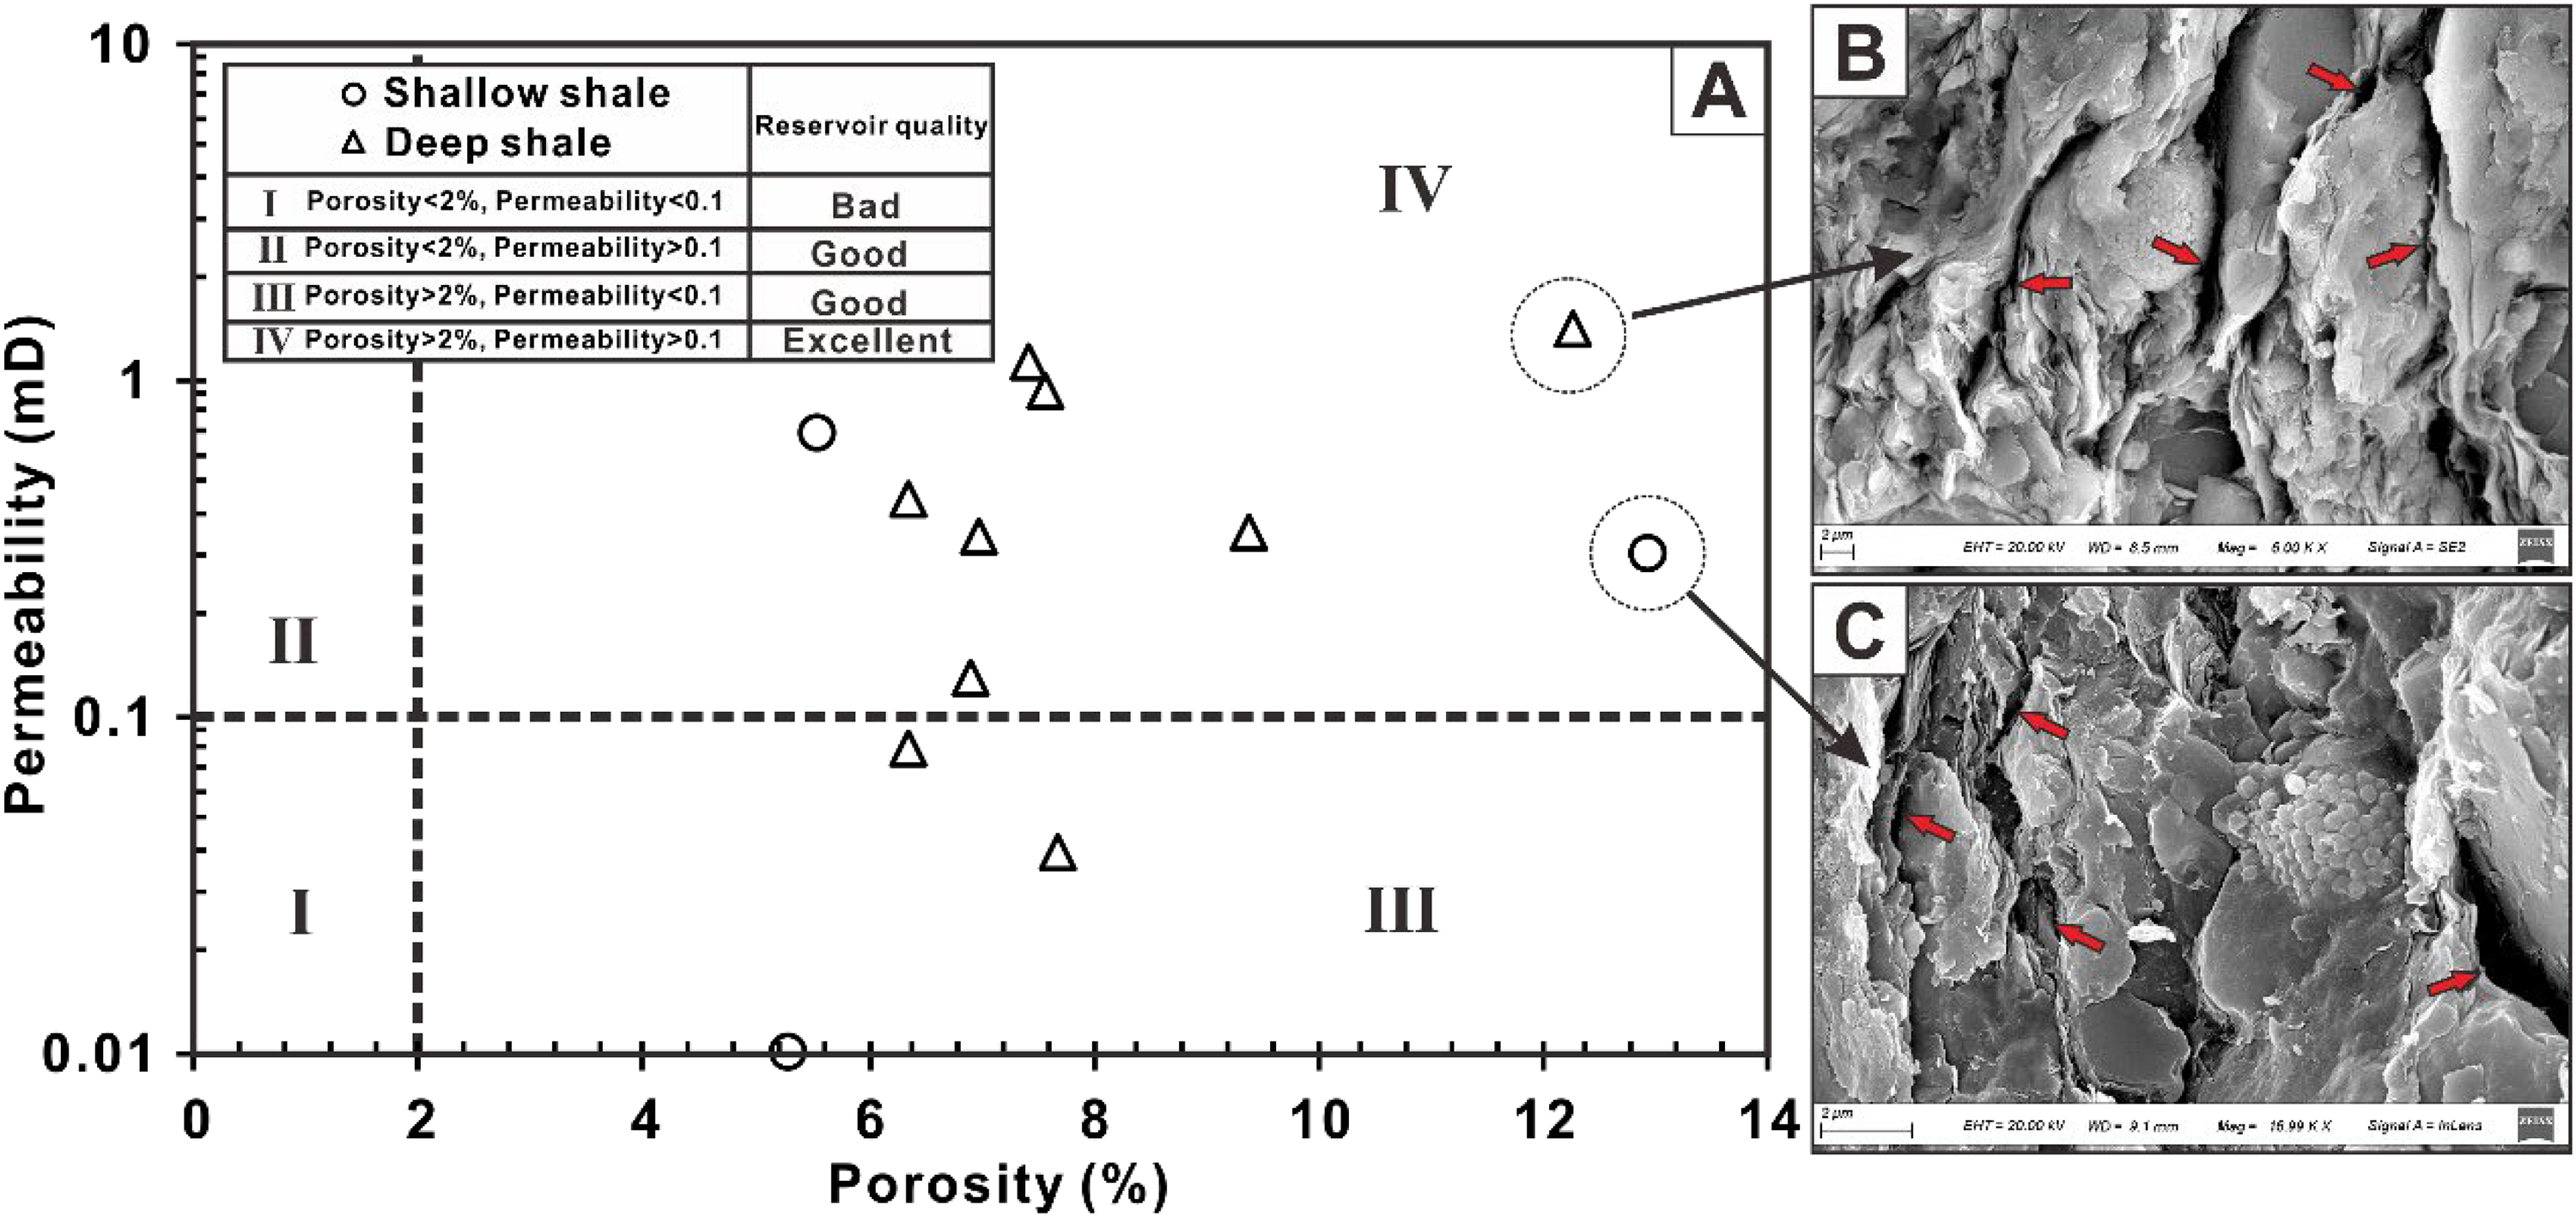
(A) Relation between porosity and permeability. Region I has the bad reservoir quality, regions II and III have the good reservoir quality, and region IV has the best reservoir quality. Most of samples are in the region IV (porosity > 2%, permeability
Previous studies have revealed that organic pores and mineral-hosted intraparticle pores are the dominant pore types in organic-rich shales (Huang et al., 2020; Loucks et al., 2009), but most of them are isolated and has poor connectivity. They may play a positive role in improving porosity, but their role in reservoir permeability is weak. By contract, mineral-hosted interparticle pores and microfractures could provide the main porosity and permeability in shale formations, and they are significantly produced and clearly observed in shale matrix (Figure 8(B) and (C), indicated by red arrows). Note that the natural microfractures may be open or closed (partly or completely healed by quartz/calcite veins or compressional stress) but only open microfractures are conductive. This is especially true for the samples S2 and Z5, which had an abundance of well-preserved interparticle pores and open microfractures. In potential shale gas reservoirs, the dominant pore-fracture network under FESEM consists of interparticle pores and microfractures with high porosity and connectivity (Figure 8(B) and (C)).
Discussion
Contributors to pore structure
Jiao et al. (2018), Cai et al. (2021), Ma et al. (2021) and Wang et al. (2022) concluded in their studies of the deeply-buried fine-grained Longmaxi shales in South China that the pore structures evolved with shale composition. Similar evolution of pore structures was seen elsewhere in the Cretaceous Garbutt, Cretaceous Moosebar, Devonian Besa River, Cambrian Lake Louise and Silurian Rochester in North America (Chalmers and Bustin, 2015) and in the Permian Shanxi Formation of the Ordos Basin, China (Yang et al., 2022a). The shale samples analyzed in this study also show an evolution of pore structures with organic matter and clays (Figure 9 and Table 3). The quantitative pore characteristics of shale samples from low-pressure CO2 and N2 adsorption analyses are reported in Table 3. Figure 9(A) and (B) clearly presents the pore microstructure parameters (i.e. pore surface area and pore volume) evolving with increasing TOC, indicating the relative amount of porous organic matters dominate the total pore network (micropore, mesopore and macropore). The strong correlation between pore surface area, pore volume and TOC suggests the importance of organic pores in deep shale gas reservoir. This conclusion is supported by the development of organic pores from our deep samples directly observed by FESEM (Figure 5(B)). This relation is consistent with observations made by Mastalerz et al. (2013) and Loucks et al. (2009), on the shallow shales covering a depth range from 57.9 to 2604.5 m using the gas adsorption, mercury intrusion and SEM, such as the Devonian and Mississippian New Albany Shales and the Mississippian Barnett Shales. They found abundant visible spongy and bubble-like organic pores in these shallow shales. Our conclusions are also supported by the work of Chalmers and Bustin (2015). In a study of deeply-buried fine-grained organic-rich rocks, they showed a strong relation between porosity, pore size and TOC. These organic-rich samples have experienced complex metamorphic processes had the lowest inorganic porosity and the highest organic porosity. Organic pores are widely recognized as the most significant component of pore network in organic-rich shales (Loucks et al., 2009). The data in Figure 9(A) demonstrate that the contribution of mesopores and macropores to the overall surface areas were up to 59%, implying that an important portion of the total pore surface area was provided by mesopores and macropores. However, in a pore study by Wei et al. (2019) in the Lower Silurian Longmaxi Formation, they believed that the pore surface area in organic rich shale is almost all provided by total micropores and some fine mesopores (2–10 nm), and this proportion reaches an astonishing 99%. We think this conclusion is debatable. Previous studies using high-resolution SEM to study shale pore structure have shown that some large pores associated with organic matter, clay minerals and pyrite may still provide greater pore area (Chalmers et al., 2012; Guo et al., 2022; Ross and Bustin, 2009; Zhu et al., 2018, 2019).
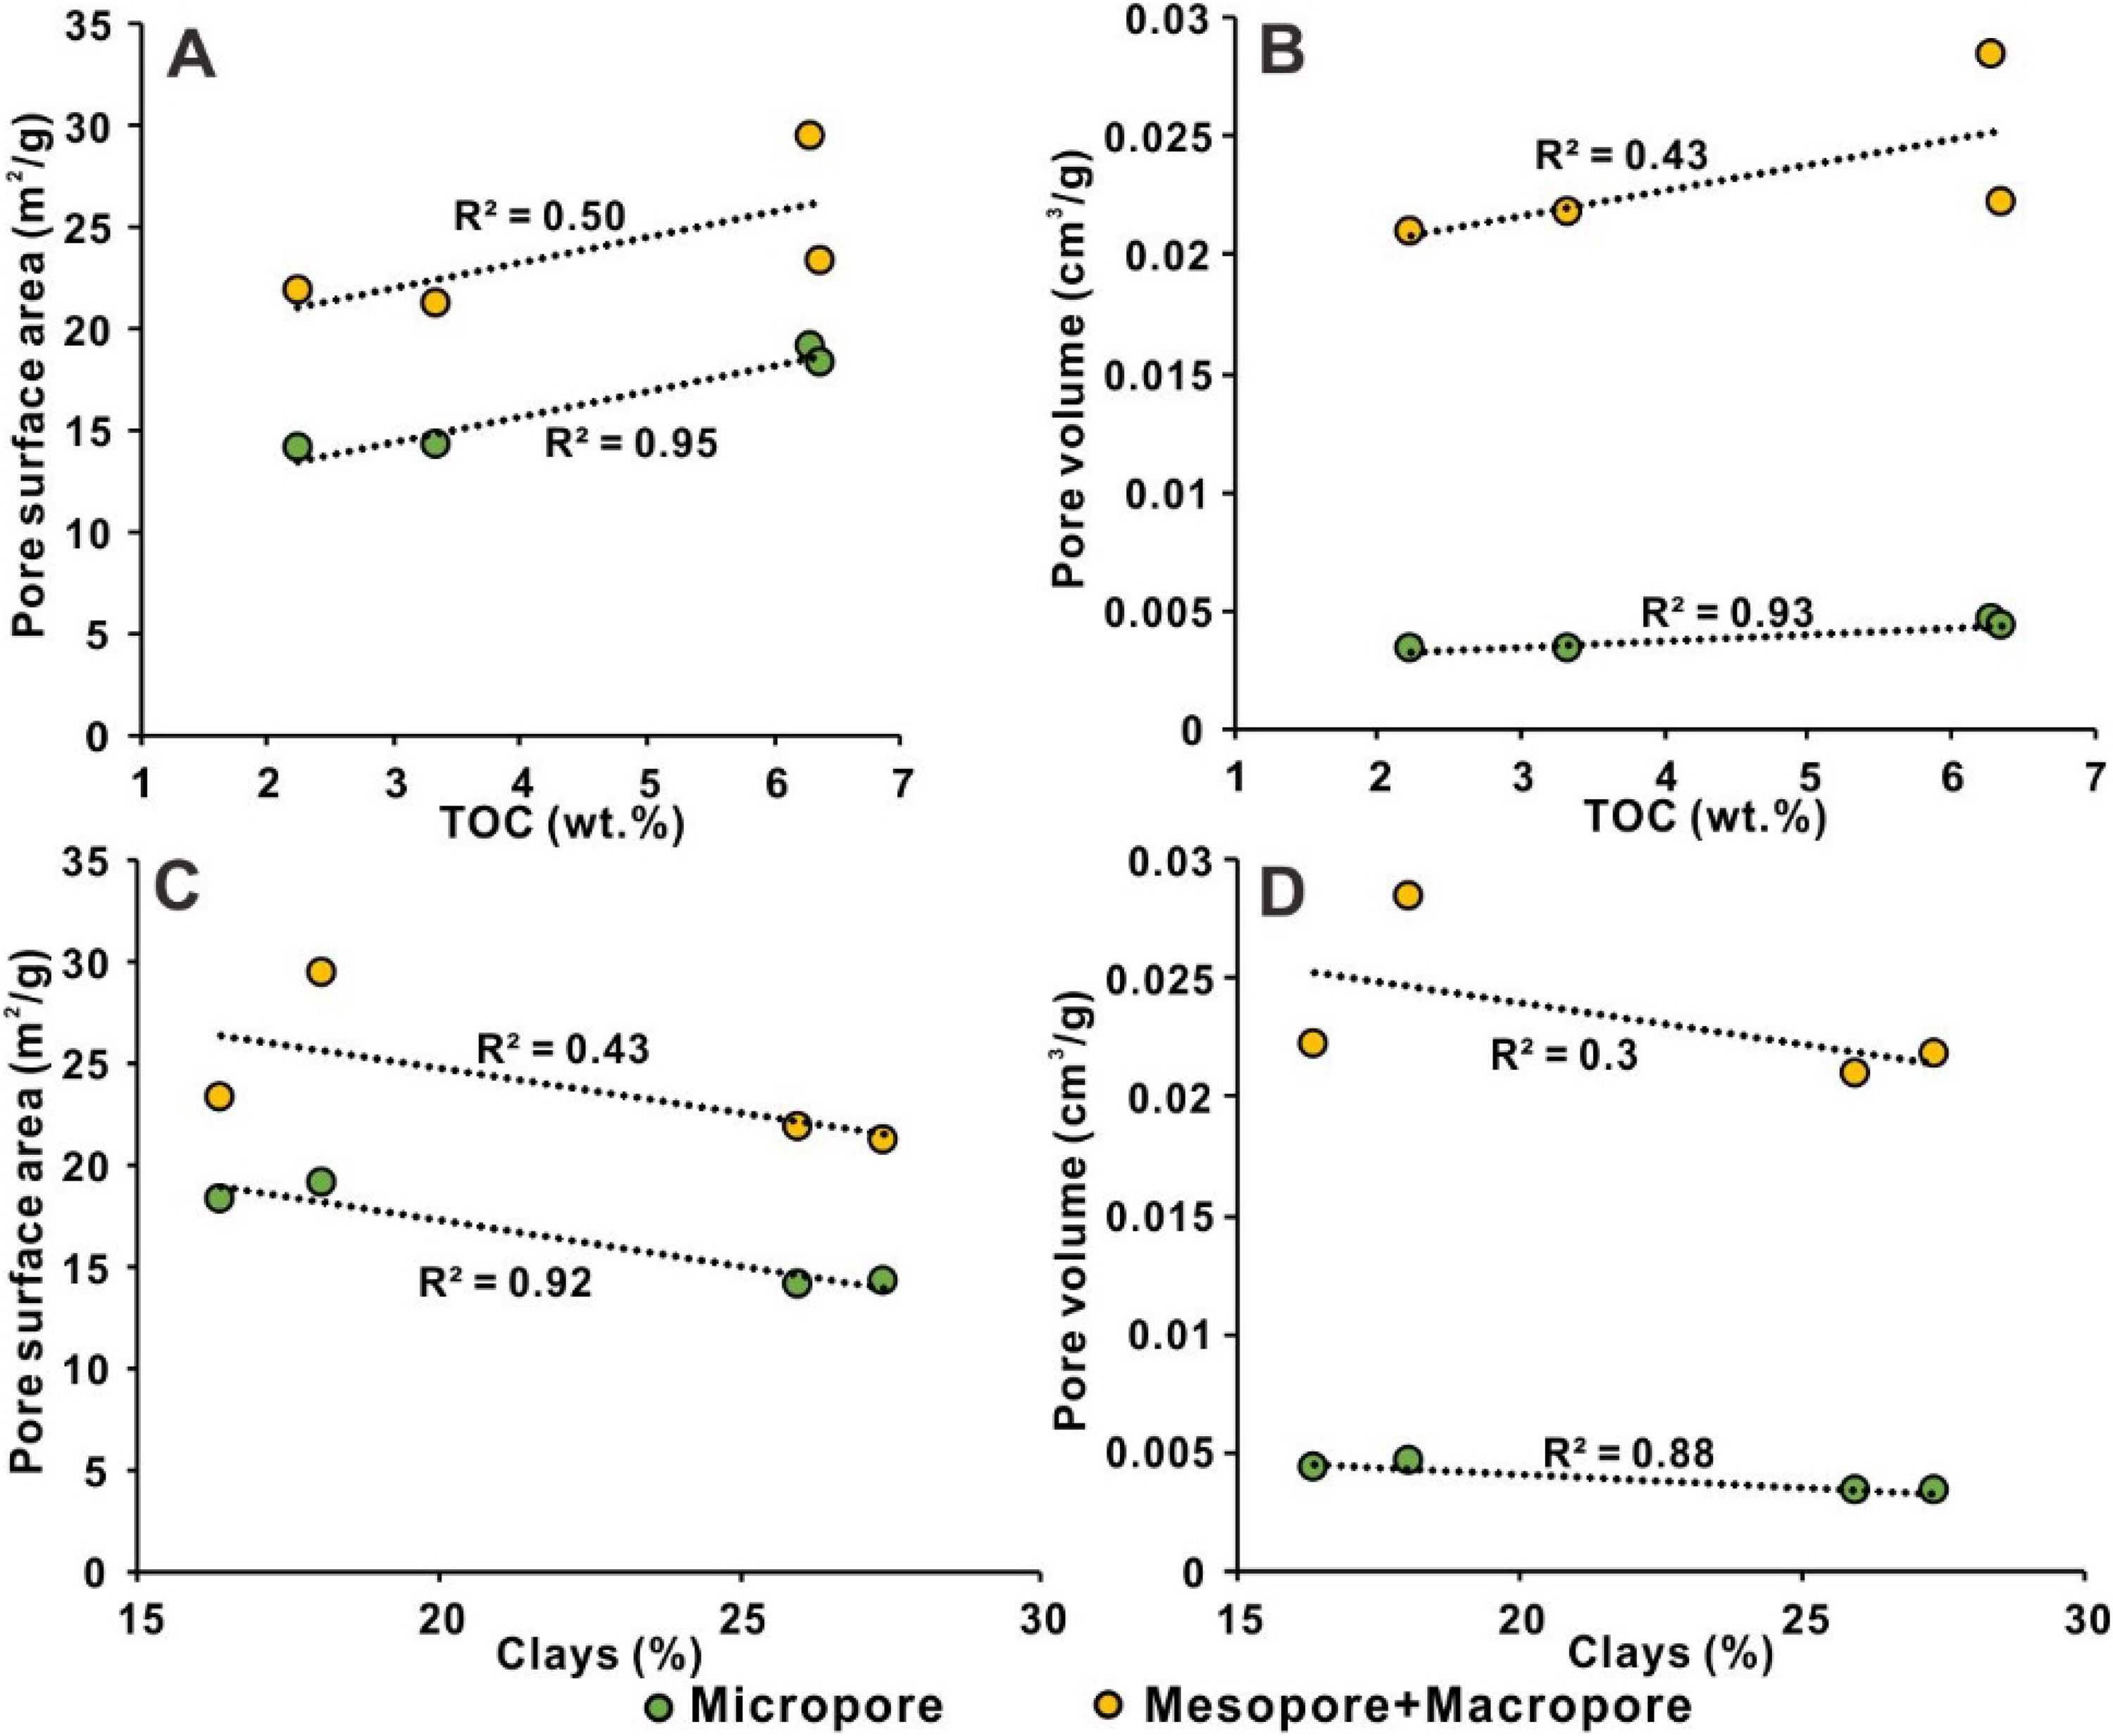
(A) Relation between pore surface area and TOC. (B) Relation between pore volume and TOC. (C) Relation between pore surface area and clays. (D) Relation between pore volume and clays.
Quantitative pore parameters of shale samples.
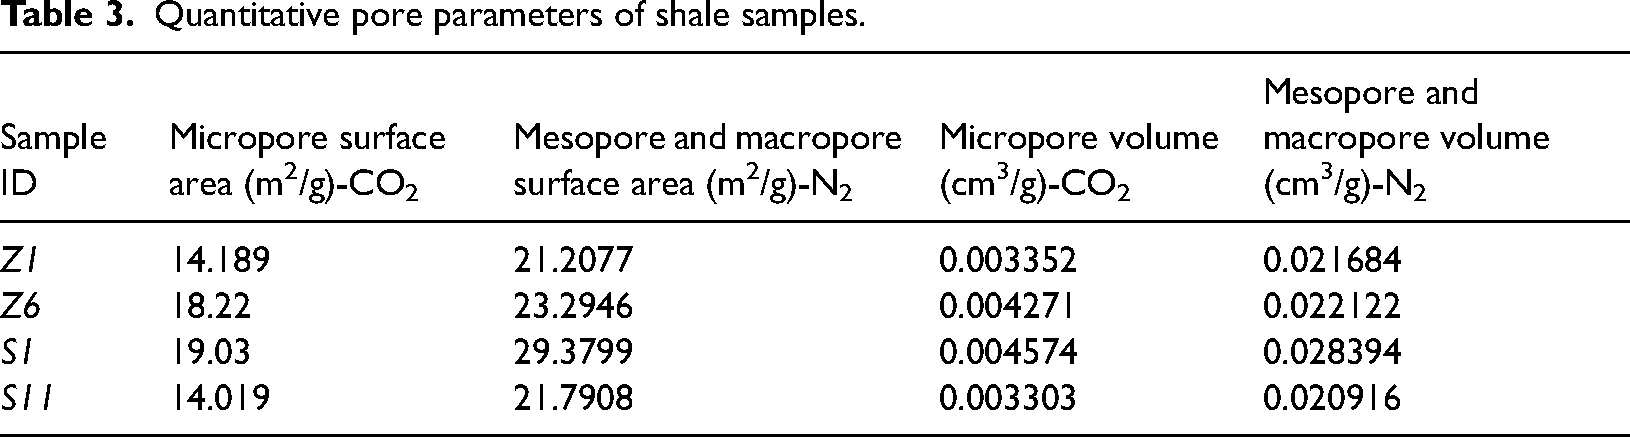
The data in Figure 9(B) suggest that the contribution of mesopores and macropores to the total pore volume were up to 86%, indicating that a significant portion of the total pore volume was also provided by mesopores and macropores. Mesopores and macropores provide the major pore surface area and pore volume. Significant positive correlations were found between the TOC and the surface area of micropores, mesopores + macropores, with the correlation coefficients of up to R2 = 0.95 and R2 = 0.5, respectively (Figure 9(A)). Moreover, significant positive correlations were also established between the TOC and the pore volume of micropores, mesopores + macropores, with the correlation coefficients of up to R2 = 0.93 and R2 = 0.43, respectively (Figure 9(A)). In addition, there was direct evidence that most nanopores primarily produced related to organic matter, as observed in FESEM images (Figure 5(A) and (B)). Therefore, both the significant positive relations between TOC and pore surface area and between TOC and pore volume, and organic pores observed in FESEM images, suggest that organic composition is one of the major controls on pore microstructural evolution.
Figure 9(C) and (D) shows the relationship between pore microstructure parameters and clays. The values of pore surface area and pore volume have greatly decreased with increasing clay minerals content (Figure 9(C) and (D)). Among pore types of different sizes, both micropores and mesopores + macropores showed negative relations with the pore surface area, with R2 = 0.92 and R2 = 0.43, respectively (Figure 9(C)). Also, both micropores and mesopores + macropores showed negative relations with the pore volume, with R2 = 0.88 and R2 = 0.30, respectively (Figure 9(D)). This means that the influence of clay minerals on the formation of pore structures may be weak, which is mainly due to the microstructural properties of clay minerals, such as instability and destruction. It can also be seen from Figure 5(I) that clays are ductile particles, and their microstructures are easily affected by external factors. Only when they are developed in the void space composed of rigid mineral particles such as quartz and calcite, their structures can be preserved during the compaction or tectonic action. Therefore, both the negative relations between clay minerals content and pore surface area and between clays and pore volume, and clay-hosted pores observed in FESEM images, indicate that clay composition may not be the dominated control on pore microstructural evolution. Zhu et al. (2021) stated that in shale-gas systems, clay particle has well-developed porous microstructures. However, the connectivity of these pores is weak, and gas adsorption experiments may not be able to accurately characterize such pores. Prior to our documentation of clay-hosted pores within our samples, microstructural characteristics and distribution of these pores at the nanometre scale were not known. Note that there were no clear relations between the pore surface area/volume and other mineral compositions (i.e. feldspar, carbonates or pyrite), suggesting that their hosted pore systems are not the dominated pore types and could not provide the enough pore surface area and pore volume. Although some of these pore types can be observed in FESEM images (Figure 5), the proportion of these mineral components is relatively small, which is not enough to provide more pore structure information.
Contributors to reservoir quality
Preliminary analyses indicated that the organic and mineralogical compositions and their hosted pore structures are the very significant factors determining reservoir quality (i.e. petrophysical property) in shales (Bao et al., 2020; Chen et al., 2019; Gou et al., 2021; Jia et al., 2023; Wang et al., 2016; Xu et al., 2020). TOC within our samples display significant variation with porosity (Figure 10(A)) and weak relation with permeability (Figure 10(B)). However, there was no clear relation between porosity/permeability and any one single factor of mineral composition (i.e. clays, quartz, calcite, pyrite, etc.), indicating that the reservoir quality was likely influenced by multiple factors. This lack of correlation between single mineral composition and porosity/permeability suggests that the connected microstructure/network is the result of multicomponent. This conclusion is supported by the development of large interparticle pores and open microfractures from our samples. These pore-fracture networks observed by FESEM in Figure 8(B) and (C) show that porosity and permeability are not related to single inorganic grain. This relation is also consistent with observations and suggestions made by Zhu et al. (2019), on marine shales from the Longmaxi and Qiongzhusi Formation using the SEM. They found six major fracture types and suggested these microfractures developed on a larger scale are mostly related to multiple types and quantities of particles.
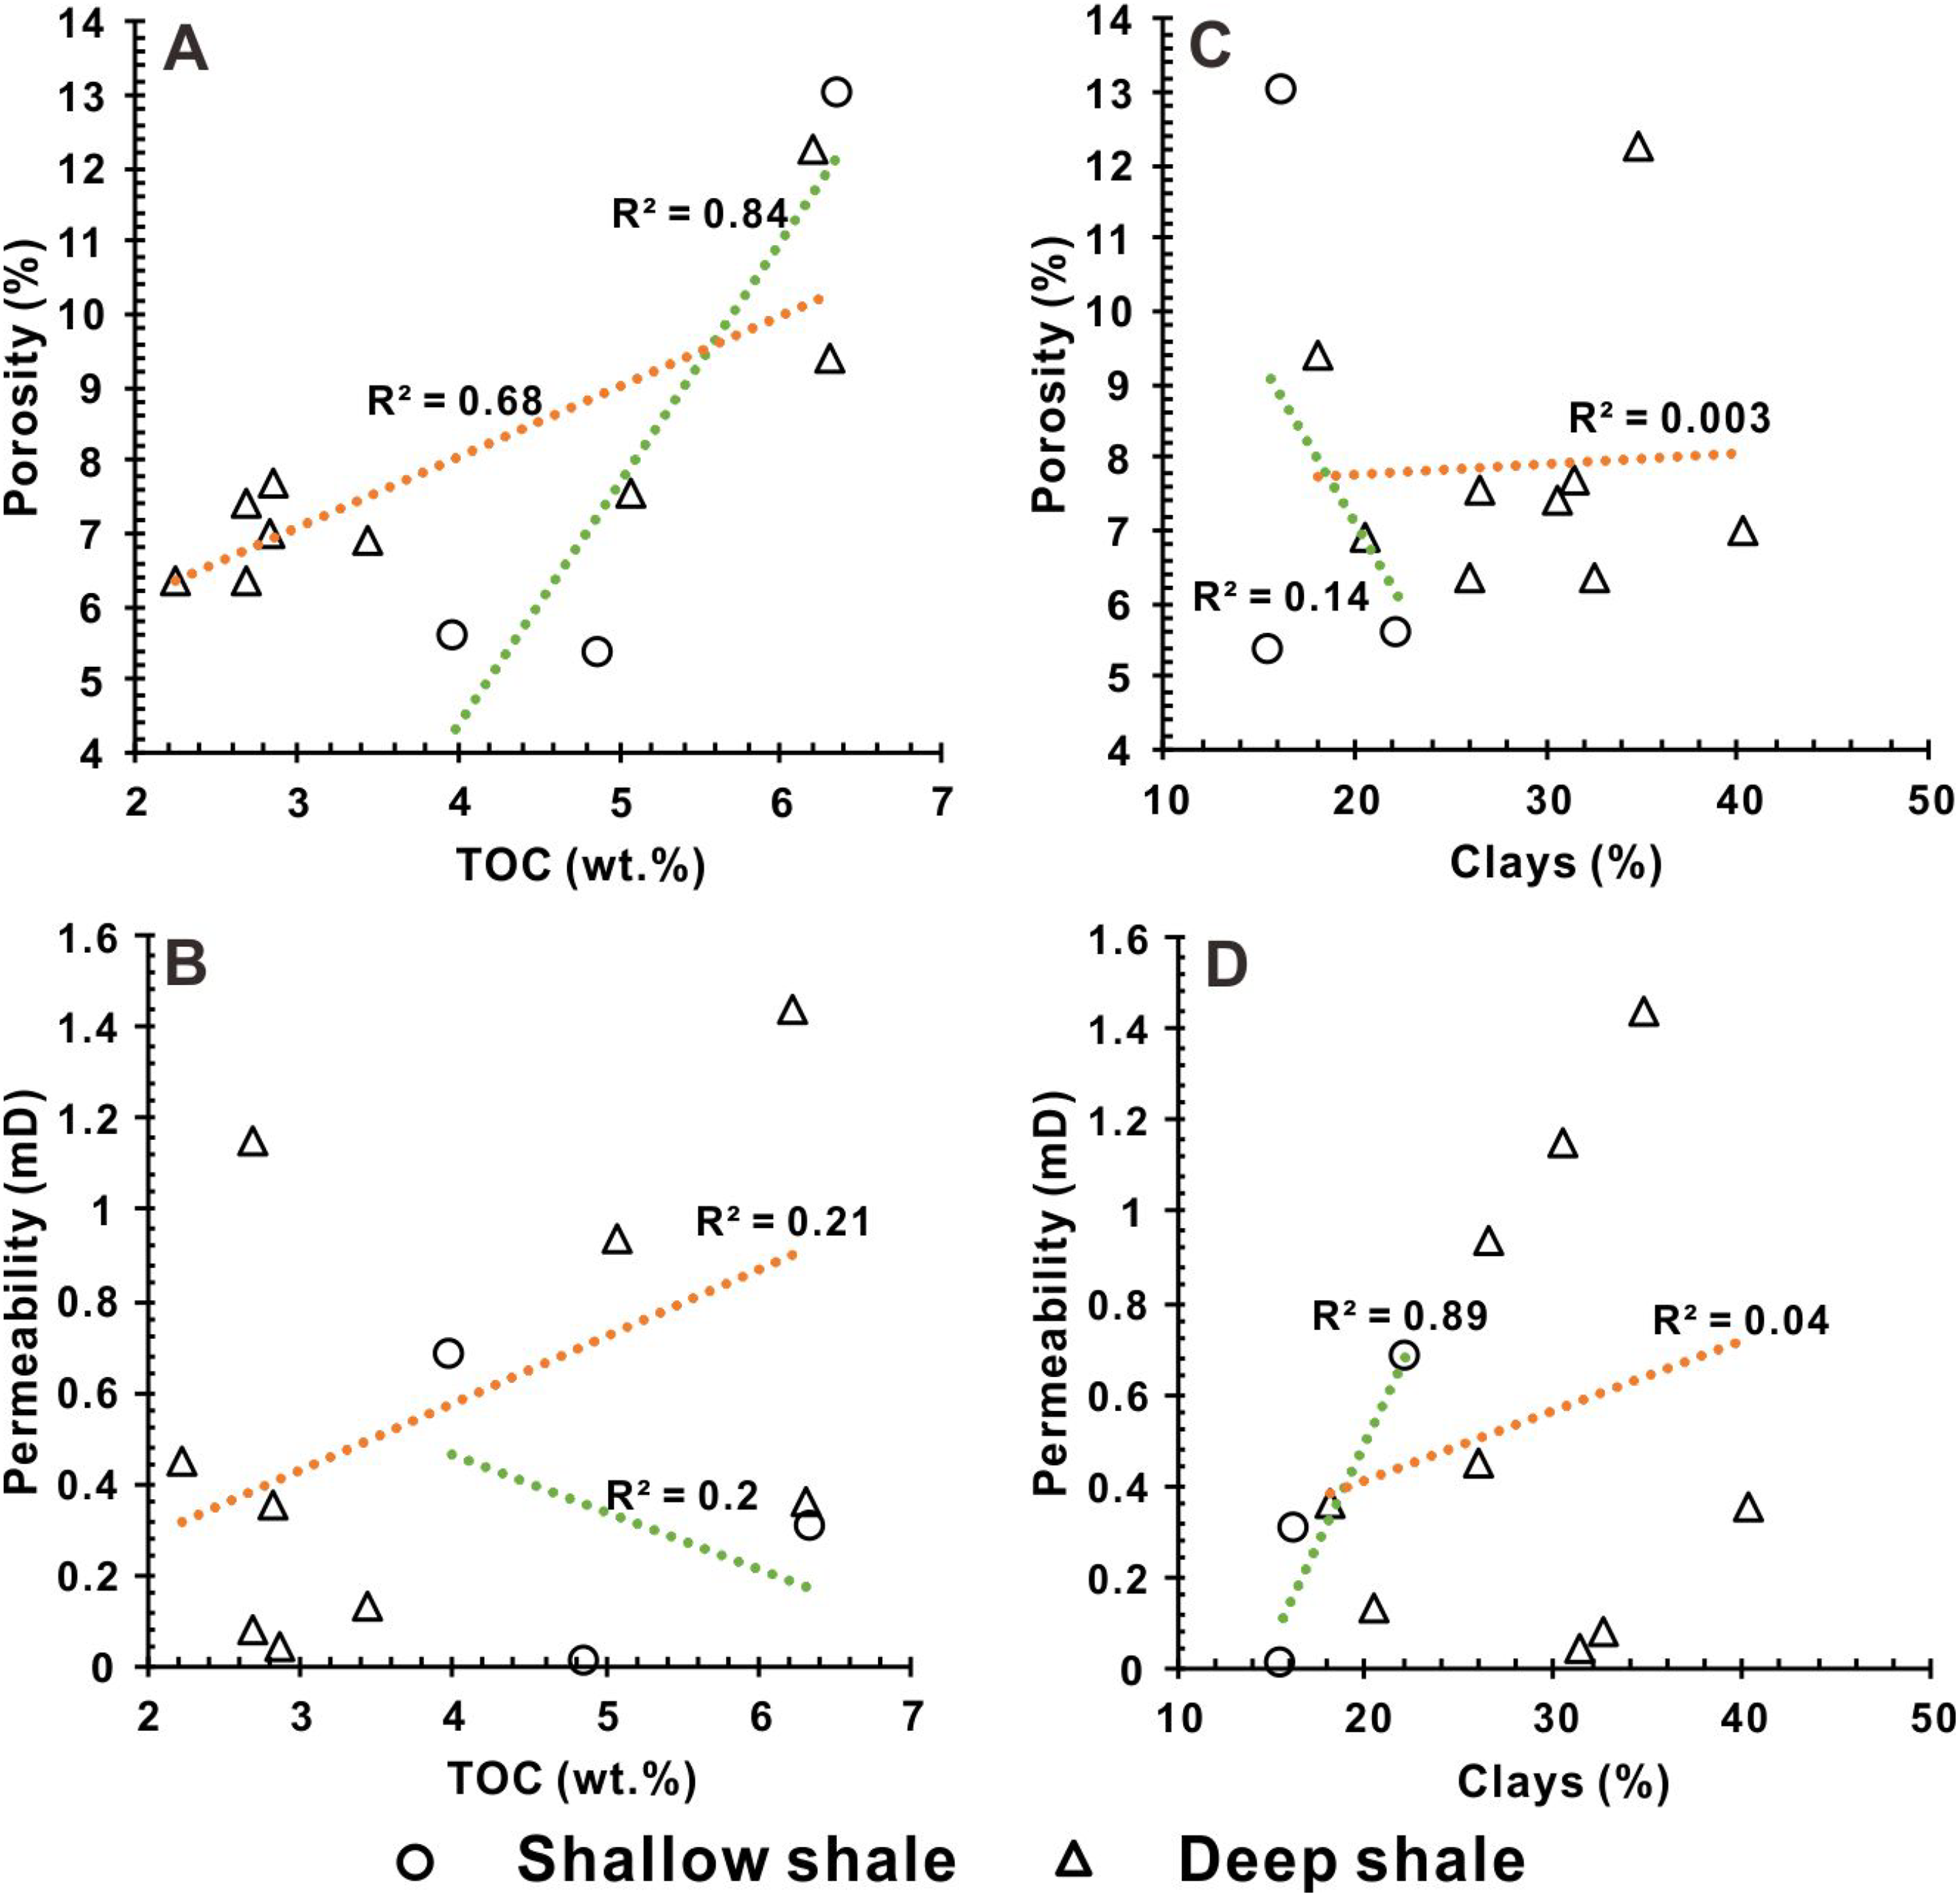
(A) Relation between porosity and TOC. (B) Relation between permeability and TOC. (C) Relation between porosity and clays. (D) Relation between permeability and clays.
Conclusions
This study has investigated the organic geochemical characteristics, mineralogy, pore structure and petrophysical properties of a series of Longmaxi shales samples covering a depth range from 2651 to 3574 m from the Weiyuan Block, southwestern Sichuan Basin. The following conclusions have been reached:
The results show similar mineralogical and organic geochemical characteristics in all samples from the various depths. Our data do not show that the burial depth has significant constraints on shale mineralogy. TOC content of the shallow and deep shales ranges from 2.63 to 6.36 wt.% and 2.24 to 6.30%, respectively. All samples have a TOC content more than 2 wt.% and a mean S1 + S2 value more than 52 mg/g, suggesting that most samples are excellent source rocks. Organic pores, intraparticle dissolution pores, interparticle quartz pores and interparticle clay pores are the dominant pore types of all samples and they play a positive role in improving reservoir quality. The pore surface area and pore volume evolve with increasing TOC, indicating the relative amount of porous organic matters dominate the total pore network. The siliceous deep Longmaxi formation in Weiyuan Block belongs to a high-quality shale with an average TOC value of 3.9 wt.% and well-developed pore networks, which should be the important target for deep shale gas exploration.
Footnotes
Declaration of conflicting interests
The author(s) declared no potential conflicts of interest with respect to the research, authorship, and/or publication of this article.
Funding
The author(s) disclosed receipt of the following financial support for the research, authorship, and/or publication of this article: This work was supported by the the CNPC Chuanqing Drilling Engineering Company Limited (grant number CQ2021B-39-Z1-4).