
Abstract
As of December 1, 2013, a total of 429 nuclear reactors were considered operational in 31 countries. The nuclear industry is in decline, however, with global electricity generation from nuclear power plants down by a record 7 percent in 2012. This decline is largely due to the effects of the triple disaster that struck Japan’s Fukushima Daiichi Nuclear Power Station in March 2011. All of Japan’s nuclear reactors are shut down, and the struggle to manage radioactive water and a radiation-exposed workforce continues at Fukushima. Currently there are 69 reactors under construction worldwide, 29 of which are in China, but the average age of existing reactors has been increasing steadily. The industry continues to face economic challenges including lengthy construction times, uncertainty about new reactor designs, and difficulty financing projects. Although global investment in renewable energy capacity declined in 2013, the costs of equipment also declined, making it possible to significantly increase renewable capacity. Three of the world’s four largest economies now run on a higher share of renewables than nuclear power.
Keywords
“Nuclear power will make a significant and growing contribution to sustainable development in the coming decades,” declared the director general of the International Atomic Energy Agency (IAEA) at an international conference in St. Petersburg, Russia, on June 27, 2013 (Amano, 2013). The future will show whether or not nuclear power will play an increasing role. In the meantime, however, a reality check of the current situation shows that the IAEA has consistently overestimated the development of nuclear power in the world (Schneider et al., 2012).
Contrary to the IAEA’s hopes for the future, global electricity generation from nuclear power plants dropped by a historic 7 percent in 2012, larger than the previous year’s record 4 percent decline. The nuclear industry’s accelerating decline is, in large part, due to the triple disaster that struck Japan’s Fukushima Daiichi Nuclear Power Station in March 2011. All of Japan’s nuclear reactors remain shut down in the wake of Fukushima, and the meltdowns there led some countries to reconsider their nuclear power policy.
Post-Fukushima developments should not, however, obscure an important fact: the world nuclear industry already faced daunting challenges long before Fukushima, just as the US nuclear power industry had largely collapsed before the 1979 Three Mile Island accident (Hultman and Koomey, 2013). The notion that a global nuclear renaissance was flourishing until 3/11 1 is false: Fukushima only added to already grave problems, the root cause of which is poor economics.
Global overview
The nuclear industry is in decline: Nuclear power plants generated 2,346 terawatt-hours (or billion kilowatt-hours) of electricity in 2012, 2 11.8 percent below the historic maximum reached in 2006. Nuclear power’s contribution to commercial electricity generation worldwide dropped to 10.4 percent in 2012, a level last seen in the 1980s. According to BP (2013), the nuclear share of commercial primary energy consumption 3 dropped to 4.5 percent, “the lowest since 1984.”
About three-quarters of the decrease can be attributed to the continuing and substantial decrease in nuclear power production in Japan. In the years since the Fukushima disaster began unfolding on March 11, 2011, its impact on the global nuclear industry has become increasingly visible. Between 2010 and 2012, Japan fell from the world’s third-largest nuclear power generator to the 18th position. Production also decreased in 2012, for differing reasons, in all of the “big five” nuclear generating countries: the United States, France, Germany, South Korea, and Russia. Together these countries generate two-thirds of all nuclear electricity in the world. Figure 1 shows worldwide nuclear electricity production from 1990 through 2012, in total terawatt-hours as well as the share of electricity production.
Nuclear electricity generation in the world 1990–2012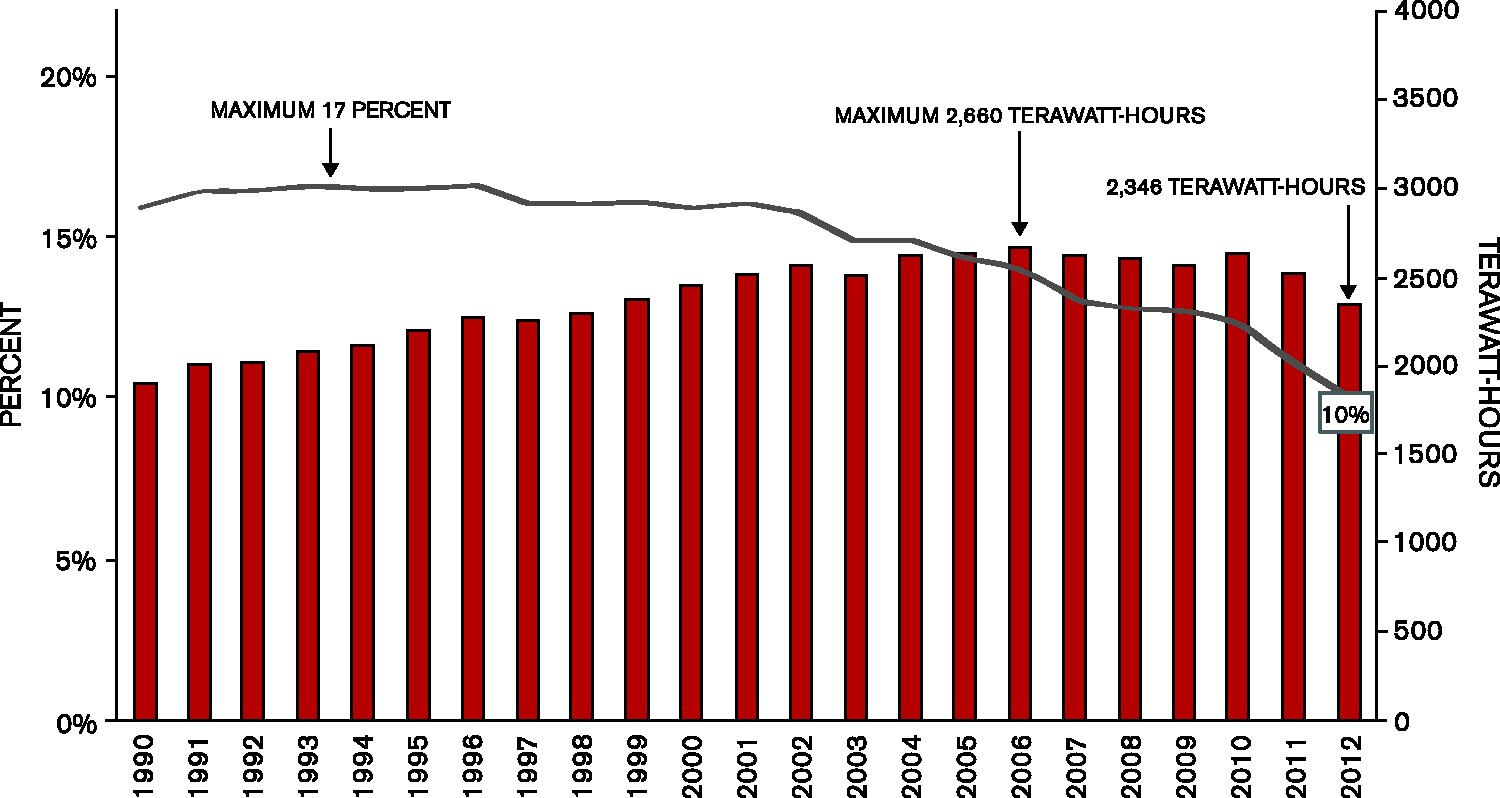
As of December 1, 2013, a total of 429 nuclear reactors—one fewer than at the beginning of the year—were considered operational in 31 countries. Many of these countries generated their historic maximum of nuclear electricity years ago. Among the countries with a steady increase in nuclear generation over the long term are China, the Czech Republic, and Russia. However, even in countries where nuclear electricity production is increasing, it is not keeping pace with overall increases in electricity demand in most cases. What this means is a reduced and declining role for nuclear power.
Only one country in the world, the Czech Republic, had a new record for nuclear power’s share of overall electricity production in 2012, with a 35 percent share. In all other countries—except Iran, which started up its first nuclear plant in 2011—nuclear power reached its maximum share prior to 2010. While three countries peaked in 2008 (China) or 2009 (Romania and Russia), the other 26 countries had seen their largest nuclear share by 2005.
Increases in nuclear generation are mostly a result of higher productivity and uprating 4 at existing plants, rather than the addition of new reactors. Despite rises in productivity at some plants, the latest assessment by Nuclear Engineering International (Peachey, 2013) shows that the global annual load factor 5 of nuclear power plants decreased from 77 percent in 2011 6 to 70 percent in 2012. Not surprisingly, the biggest change was in Japan, where the load factor plunged from 69.5 percent in 2010 to 39.5 percent in 2011, and, in the absence of restart authorizations, further to 3.7 percent in 2012. This is, in part, because 50 Japanese nuclear reactors—of the 54 operating before the devastating tsunami of March 2011—are still counted as operational, even though most of them have not generated electricity for years. Only the four most severely damaged reactors at the Fukushima Daiichi nuclear power plant have been officially declared non-operational.
Romania and Taiwan had the highest load factors in 2012, with 92.8 percent and 90.8 percent respectively, although neither country performed as well as in 2011. The most dramatic reductions in load factor outside Japan were in Belgium (down by 11.8 percent), Mexico (20 percent), and South Korea (9.5 percent). Belgium had two of its seven reactors offline for much of the year because thousands of cracks were discovered in their pressure vessels. Mexico is carrying out major uprating work on both of its units. South Korea had a series of scandals involving quality control issues that kept a number of units offline. Other major nuclear countries saw their load factors deteriorate to some degree: The United States dropped by 3.1 percent, to 83.2 percent; France fell by 2.3 percent, to 73.6 percent and remains at the lower end of global performance.
The current world fleet of reactors has a combined installed capacity of about 365 gigawatts. 7 This figure assumes that the 10 reactors at the Fukushima Daiichi and Fukushima Daini plants will never be restarted. However, there are large uncertainties about the future of the 50 Japanese nuclear reactors that are officially still operating but were all shut down as of December 1, 2013. Under our “East-Coast scenario,” the seven reactors directly or indirectly affected by the March 2011 events will remain closed along with the Fukushima units. Under the “German scenario,” 13 additional Japanese reactors with an operational age in excess of 30 years would also remain shut down. That would leave Japan with 24 operating reactors, and the worldwide figure would drop to 409, last seen in 1987. The installed global capacity would drop to 350 gigawatts, a level not experienced since the mid-1990s.
Considering the public opposition to nuclear power in Japan, it is possible—even under a strongly pro-nuclear central government—that it will be announced that the majority of the nuclear reactors in the country will be permanently shut down. This would not be a “phase-out” scenario but rather the simple abandoning of nuclear power. Furthermore, every authorization of restart will be subject to intense battles between promoters and opponents of the nuclear option. The continuous instability of the Fukushima site could also lead to further incidents and additional releases of large amounts of radioactivity. Under these circumstances, the scenarios above are likely to prove conservative.
Despite 15 fewer units operating as of December 2013 than in 2002, the world’s total generating capacity is still about the same. This is a result of larger units replacing smaller ones, and also of technical alterations at existing plants—a process known as uprating. In the United States, the Nuclear Regulatory Commission has approved 148 uprates since 1977 (Nuclear Regulatory Commission, 2013a). Most of these have already been implemented. A similar trend of uprates and lifetime extensions of existing reactors can be seen in Europe. The main incentive for lifetime extensions is their considerable economic advantage over building new reactors, but upgrading older reactors leads to lower safety margins than replacement with more modern designs.
However, it appears that the incentives for uprates are waning. The number of units in the United States with pending applications dropped from 20 in 2011, to 14 in 2012, and the total capacity increase that would occur dropped from 1.5 gigawatts to 1 gigawatt (Nuclear Regulatory Commission, 2013b). The increasing challenge for existing US reactors is to compete with wholesale market prices set by the operating costs of gas-fired and wind generators, which led nuclear giant Exelon to abandon planned uprates for four older units (Dolley, 2013).
Adding together uprates and new-build capacity, and subtracting closures, the capacity of the global nuclear fleet increased by about 30 gigawatts between 1992 and 2002 to reach 362 gigawatts; it peaked in 2010 at 375 gigawatts before falling back to the level achieved a decade ago.
New construction
Currently, 15 countries are building nuclear power plants (see Figure 2). With the United Arab Emirates (UAE) working on the Barakah plant and Belarus just starting building at Ostrovets, that is two countries more than in 2011. As of December 1, 2013, 69 reactors were under construction, 10 more than a year earlier. However, 29 of these are in China, leaving the rest of the world with only 40. After a freeze on nuclear plant construction following the events of March 2011, China resumed construction in November 2012.
8
Nuclear reactors under construction, July 1954–December 2013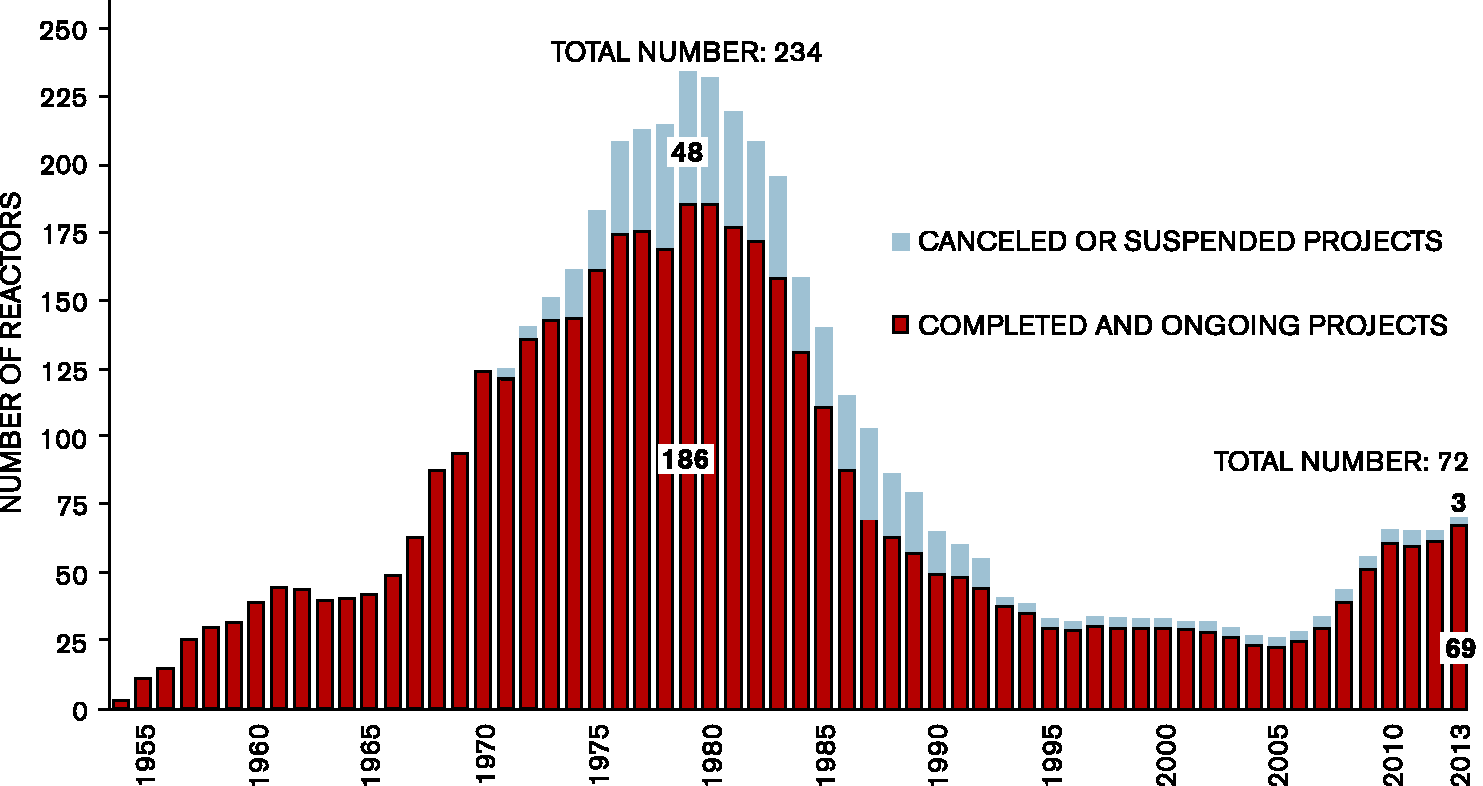
As of December 2013, the total capacity of units under construction around the world was about 67 gigawatts, with an average unit size of 970 megawatts. A closer look at the listed projects, however, illustrates the level of uncertainty associated with reactor building. Nine reactors have been listed as “under construction” for more than 20 years, and another three have been listed for at least 10 years, while 49 projects do not have an IAEA planned startup date.
Two-thirds of the units under construction are located in just three countries: China, India, and Russia. Historically, none of these countries has been very transparent or reliable about information on the status of construction. Also, past experience shows that simply having an order for a reactor, or even having a nuclear plant at an advanced stage of construction, is no guarantee of grid connection and power production.
Operating age
The average age of operating nuclear power plants has been increasing steadily and now stands at about 28 years. 9 Some nuclear utilities envision average reactor lifetimes of beyond 40 years and even up to 60 years. In the United States, reactors are initially licensed to operate for 40 years, and nuclear operators can request a license renewal for an additional 20 years. Even license renewal does not guarantee longer life, however. None of the 32 units that have been shut down in the United States had operated for 40 years.
Many other countries have no time limitations on operating licenses. In France, reactors must undergo in-depth inspection and testing every decade. The French Nuclear Safety Authority (ASN) evaluates on a reactor-by-reactor basis whether a unit can operate for more than 30 years. A few plants have so far received a permit to extend their operational life from 30 to 40 years, but only under the condition of significant upgrading.
In assessing the likelihood of reactors being able to operate for up to 60 years, it is useful to compare the age distribution of reactors that are currently operating with those that have already shut down. As of mid-2013, 31 of the world’s operating reactors have exceeded the 40-year mark. 10 That number will rapidly increase over the next few years, as a total of 190 units have already reached age 30 or more.
As a result of the Fukushima nuclear disaster, questions have been raised about the wisdom of operating older reactors. Four days after the accidents in Japan, the German government ordered the shutdown of the seven reactors that had started up before 1981. The sole selection criterion was operational age. Other countries did not adopt the same approach, but it is clear that the 3/11 events had an impact on previously assumed extended lifetimes in other countries, including Belgium, Switzerland, and Taiwan.
For the purposes of reactor fleet projections, we have assumed a general lifetime of 40 years. Even with 69 units under construction as of December 2013, 52 additional reactors would have to be started up before 2020 in order to maintain the status quo, and an additional 205 reactors would have to start up during the following 10-year period—one every 18 days. Compare that with the 33 grid connections that have happened during the past 10 years.
Maintaining the current number of operating reactors in 2020 appears increasingly unlikely, given the existing difficult financial situation of the world’s main reactor builders and utilities, the general economic crisis, stagnating electricity consumption, and generally hostile public opinion—aside from any other specific post-Fukushima effects. As a result, the number of reactors in operation will decline over the coming years unless lifetime extensions beyond 40 years become widespread.
Developments in Asia, and particularly in China, do not fundamentally change the global picture. Reported figures for China’s 2020 target for installed nuclear capacity have fluctuated between 40 gigawatts and 120 gigawatts in the past. The post-Fukushima construction freeze reduced Chinese ambitions. In addition, the average construction time for the 19 operating units in China was 5.8 years. At present, 29 units are under construction—two units started construction in September 2013—and scheduled to be connected by 2018, which will bring the total to 44 gigawatts. The prospects for significantly exceeding that capacity by 2020 are limited. There are also indications that new reactors will be allowed only in coastal areas, restricting the number of sites available.
Potential newcomer countries
In its “International Status and Prospects for Nuclear Power 2012,” the IAEA estimates that 29 “newcomer” countries are developing nuclear power programs. This includes three countries that have ordered nuclear power plants, 14 countries that are considering starting a nuclear power program and in which there is a “strong indication of intentions to proceed,” six countries showing “active preparation for a possible nuclear power program,” and a further six that are actively preparing for a possible nuclear power program with no final decision. The total number of countries listed as developing nuclear power programs has fallen since the IAEA published its last assessment in 2010, when there were 33.
According to the IAEA, the three countries that have ordered nuclear power plants are the UAE, Turkey, and Belarus. The IAEA also states that there are nine countries that have suggested a startup date for first power before 2030. The IAEA does not list those countries, but it is likely they include the three in which orders have been placed, plus Bangladesh, Jordan, Lithuania, Poland, Saudi Arabia, and Vietnam. The IAEA has retreated from its early 2012 analysis, which projected that Vietnam, Bangladesh, the UAE, Turkey, and Belarus would begin building their first nuclear power plants in 2012 and that Jordan and Saudi Arabia could follow in 2013 (Hixson, 2012). Only the UAE and, most recently, Belarus actually began construction. The other countries appear to be further from launch than the IAEA frequently suggests.
Construction times
There has been a clear global trend of increasing construction times since the beginning of the nuclear age (see Figure 3). The most recent reactor completed in India was Kudankulam, which was connected to the grid in October 2013; construction started in March 2002. The only other startups in 2013, two Chinese reactors at Hongyanhe, took 5.5 and 5.8 years to build. The two South Korean units and a Chinese reactor that were connected to the grid in 2012 averaged a 4.5-year construction time. Worldwide, however, it took an average of 13.8 years to build the seven units started up in 2011 and 9.5 years for the five reactors that began operating in 2010.
Average annual construction times around the world, 1954–2013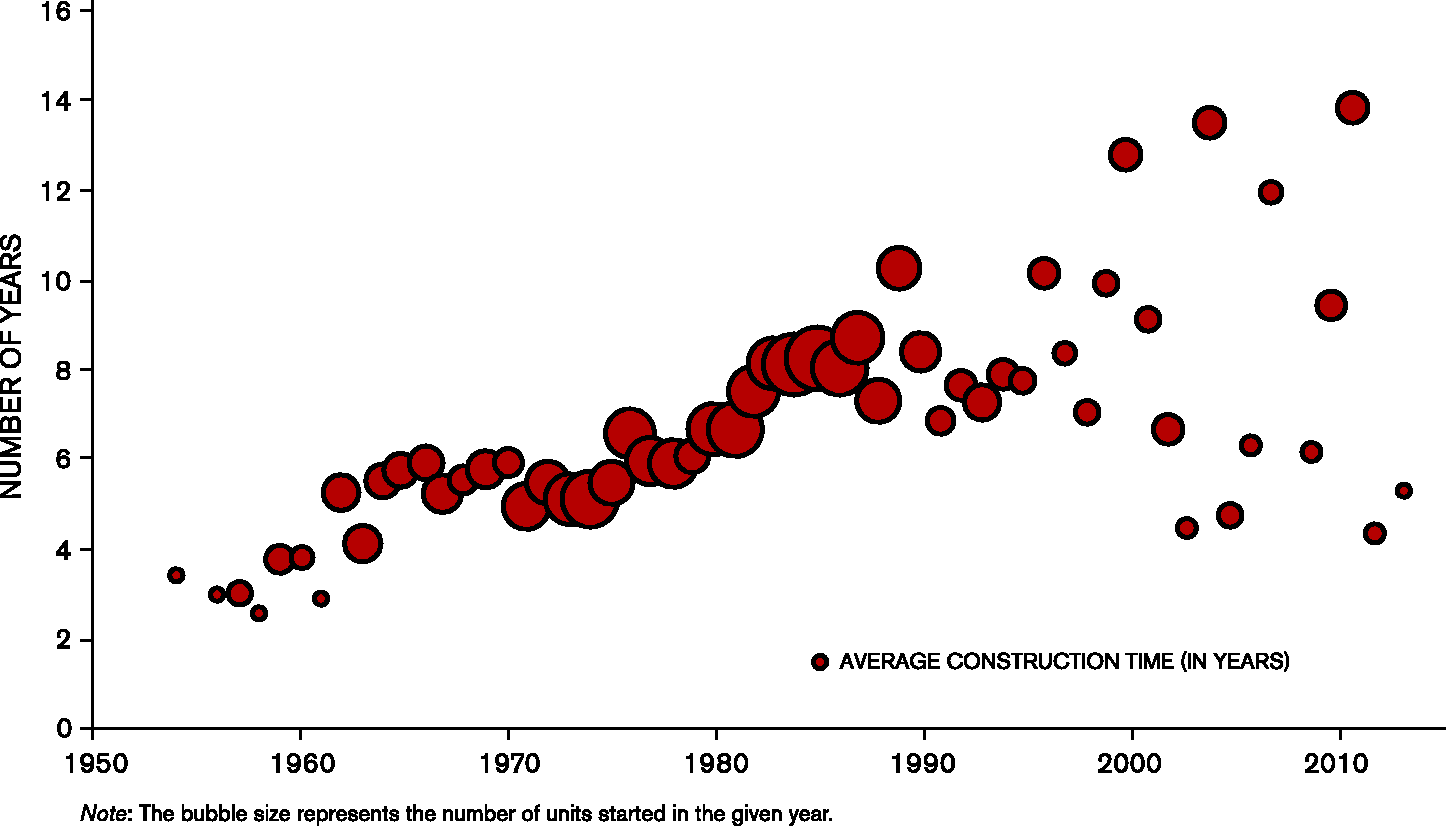
The reasons for gradually increasing construction times are not well understood. It is clear that continuously increasing safety requirements and, in some countries, lengthy legal cases due to public opposition have played a role. Growing system complexity, as a consequence of the previous conditions, is also likely to have affected construction times and costs. The increase in construction times is considered the primary driver of rising costs.
Most, but not all, of the nuclear countries have experienced longer construction times. Over a 10-year period between 2003 and July 2013, a total of 34 reactors started up—all located in Asia, Eastern Europe, or the Middle East. Average construction time was 9.4 years, with a large range from 3.8 to 26.8 years.
At least 23 of the units listed by the IAEA as “under construction” have encountered costly multi-year construction delays. All of the remaining units were started within the last five years or have yet to reach their projected startup date, making it difficult to assess whether they are on schedule. Average construction time of the 60 listed projects that poured first concrete prior to 2013 currently stands at 7.8 years.
The economics of nuclear power
Making significant improvements to the economics of nuclear power plants was central to the promises of a “nuclear renaissance.” Simplification of reactor designs was meant to reduce both the cost and the risk of problems in the construction phase. Making construction more predictable was expected to make nuclear projects less economically risky and therefore easier and cheaper to finance. These promises are in tatters, with cost estimates now roughly seven times the level predicted a decade ago and the two projects under way in Western Europe—using Franco-German EPR technology—massively over budget and time. Early experience with two projects recently started in the United States, using AP1000 technology, gives little confidence that these problems are restricted to the EPR.
What were probably the three key markets to crack—the United States, the United Kingdom, and China—now look restricted, while other major and previously influential potential markets like Germany and Italy are closed to nuclear or, like India, constitute a highly uncertain market for tomorrow. Both the United States and the United Kingdom now appear likely to build fewer than a handful of new reactors, while China has slowed down the pace of construction and appears likely to opt for its own—rather than Western—designs.
With the credibility of Gen III+ designs in serious doubt and little significant progress made on their expected successor designs, so-called Generation IV, the nuclear industry is seeking funding for new design concepts, such as Small Modular Reactors (SMRs). Experience suggests that after significant amounts of public money have been spent on these, they will probably turn out to have no significant advantages over existing designs. US energy analyst Amory B. Lovins, having long asked in vain for SMR advocates to provide a production-cost and economic analysis demonstrating their claimed advantages, summarizes their key issue thus: “As a matter of physics, reactors don’t scale down well; that’s why they’re big.” 11
The UK government is considering guaranteeing a profit range for nuclear investors in the form of a “Contract for Difference.” However, making up for the difference between the current baseload power on the market and an agreed price of £92.5 per megawatt-hour, plus annual inflation over a 35-year period, will be difficult for the government to gain approval from the European Union for, because it essentially transfers construction risk from developers to taxpayers and consumers, and distorts the electricity market.
In most regions of the world, the financial situation of utilities is precarious due to changing supply technologies, increasing policy interventions, and new consumption patterns. This is reflected in the generally lower ratings of major utilities, the rising debt levels, falling incomes, and in most regions—although currently not North America—falling stock prices. In this uncertain environment, significant new investment in the power sector is needed, $16.8 trillion according to the International Energy Agency (2012), in order to replace retiring capacity or meet future predicted increases in demand.
At one time, nuclear would have been seen as an important part of this mix, but increasingly the financial community is rejecting nuclear as an expensive and uncertain investment, due to high construction costs and long lead times. Its history of cost overruns and delays has also given it a reputation as a highly risky investment. As a result, in the majority of countries, nuclear power can proceed only if many of these risks are taken away from the utilities and its financial backers and put onto customers or taxpayers.
Fukushima: A status report
The 2011 earthquake and tsunami that devastated the east coast of Tohoku, the northeastern region of Japan’s main island, hit 14 reactors in four nuclear power stations. Units 1 to 4 of the six Fukushima Daiichi units were devastated. The other 10 reactors escaped meltdown and radioactive release by a series of lucky circumstances, but they were nevertheless damaged considerably. It was also only by luck that the Rokkasho reprocessing plant escaped major damage.
After six different professional investigations, the real story of why and how the destruction of each reactor unit came about is still unclear. The reports differ not only in their perspectives but also in many of the details in their analysis of the accident sequences. This may not be surprising given the difficulty of inspecting or even accessing the reactors in the lethal radioactive environment after the various accident events.
Only the Nuclear Accident Independent Investigation Commission (NAIIC) report, commissioned by the Japanese parliament, claims that earthquake-induced ruptures in piping or destruction of generator(s) could have caused decisive failures. The NAIIC investigation presents a strong argument that the loss-of-coolant accident at Unit 1, which melted down more quickly than other reactor units, was caused by the earthquake before the tsunami crippled the emergency generators. The quake vs. tsunami issue is important because it bears directly on the matter of the country’s safety regulations of nuclear facilities in general, and the controversy in particular of whether to restart other power reactors.
The earthquake oscillation experienced by the Daiichi station continued for 180 seconds, twice as long as the basic design earthquake ground motion for the reactor building. It is highly likely that this repeated motion caused fatigue fractures in all corners of the buildings and installations of the power stations—not only at Fukushima Daiichi, but also in other reactors that escaped meltdown. Therefore full investigation of the degrees and extensions of the ruptures, fractures, and other modes of destructions at those other plants seems imperative, although the government and the power companies are not open to this suggestion, perhaps because it could bear on both their suitability for potential restart and on the adequacy of national nuclear seismic standards.
Radioactive water management
Cooling of the melted reactor cores continues at Units 1, 2, and 3. Operators know where and how the water is injected, but they do not know exactly where it then goes and how leakage occurs. Operators collect the drained radioactive water from the basements and send it through filter systems to decrease radioactivity and recirculate it back into the reactors.
The extreme radioactivity of the outflow is a serious problem by itself, as is the volume of the contaminated water, which is continuously increasing. This is due to the influx of groundwater from the hillside into the reactor buildings through broken walls. The excess of entering over exiting results in increasing water storage, after minimal decontamination, in the storage tanks that are now covering the Fukushima Daiichi station site. At current rates, the Tokyo Electric Power Company (Tepco) estimates that the amount will be more than 600,000 tons in mid-2015.
Tepco has tested new multi-nuclide removal equipment, which is intended to filter out 62 radionuclides other than tritium. If this works, then the question is what to do with the processed water. Apparently Tepco is considering a controlled release into the sea, which will be fiercely opposed by fishermen, the general public, and overseas neighbors. Apart from the overflow from the cooling circulation, and from the initial large-scale discharge of radioactive water into the sea in March and April 2011, the release of contaminated water to the sea at the power plant port is continuing, although at a decreased rate, and Tepco has no effective way to restrain it.
The government has recently come up with a radical new engineering plan to create an underground ice wall around the reactors. It is an existing technology used in small-scale, short-term applications such as subway construction and mining to block the influx of groundwater. In the case of Fukushima, however, such a system would be very large (more than one kilometer long), would consume huge amounts of electricity, and would have to run for more than 10 years.
Workers’ exposure to radiation
Through July 2013, officially a total of 28,970 workers have worked at the Fukushima Daiichi site since the accident started. Among those, at least 173 people received radiation doses over 100 millisieverts (internal and external) from March 2011 to July 2013. The maximum personal dose identified was 678.8 millisieverts. The average was 12.44 millisieverts per person (Ministry of Health, Labour, and Welfare, 2013). These figures exclude the contingent troops (firemen, policemen, and Japan Self-Defense Forces) that entered or flew over the site in March 2011.
Radiation-exposed workers’ legal dose limit is 100 millisieverts over five years, but 50 millisieverts in any one year. 12 A number of workers who continuously work at Fukushima Daiichi easily receive their 5-year limit in less than a year, or the annual limit in only a few months. Currently a daily average of 3,000 workers are engaged in radiation-exposed operations at the site. Tepco employees are less than 7 percent of them; the rest are employed by contractors, subcontractors, and sub-subcontractors. Recruitment of new workers is becoming more and more difficult, while experienced workers, such as tower crane operators, must leave the site once they have reached the dose limits.
Government and the utility say it will take 40 years (or probably more) to retrieve the molten fuel from the three reactors. The question is whether the precarious conditions on site can be sustained for that length of time. The serious challenges the Fukushima Daiichi site is facing include: cooling the molten fuel and keeping it from re-criticality during aftershocks; circulating the coolant in makeshift vinyl pipes with non-“rat-safe” power boards 13 for years to come; managing large quantities of radioactive wastewater; ensuring that the wrecked reactor buildings with their elevated spent fuel pools can withstand aftershocks; conducting surveys to pinpoint where and how the reactor containments are cracked and/or ruptured so that they can be mended and filled with water in order to start retrieving, if ever possible, the fuel debris; reducing continued leakage of radioactivity into the sea and the atmosphere to an absolute minimum, before any physical containment is re-established, hopefully in some five years; and carrying out all these operations with a workforce in which most of the skilled operators are rapidly reaching their lifetime dose limit.
Nuclear power vs. renewable energy
In June 2013, the chief economist for BP observed that three of the world’s four largest economies (China, Germany, and Japan), together representing a quarter of global GDP, are now running their economies with a higher share of renewables than of nuclear (Rühl, 2013). According to an assessment by Bloomberg New Energy Finance, global investment in clean energy—largely renewable energy, excluding large hydro, but also including a small volume of investment in carbon capture and storage—was $268 billion in 2012, the second-highest level ever, down from $300 billion in 2011, but still five times the 2004 total of $52 billion. The largest percentage of the funding was for asset finance of utility-scale renewable energy projects, such as wind farms, solar parks, and biofuel plants. The next-largest investment segment was for small-scale project investment, primarily rooftop solar photovoltaic (PV) systems (Isola and Zindler, 2013).
China was by far the largest investor in renewable energies in 2012 with over $65 billion. Some big players reduced expenditures significantly over the previous year, including the United States, Germany, Italy, and India. On the other hand, countries such as South Africa and Japan had very large growth rates.
The decline in global investment in renewable energy capacity continued in 2013 (McCrone et al., 2013). But this does not mean less renewable capacity is being installed, because the costs of equipment are generally declining. Since 2008, the world market cost of PV modules has fallen by 80 percent, while prices for wind turbines, a more mature technology, have fallen 29 percent (Liebreich, 2013). This is in contrast with nuclear power, where the costs have risen considerably. The 2011–2012 drop in global renewable investment actually supported a substantial increase in the amount of renewable capacity added, continuing years of consistently strong growth, whereas nuclear net additions have fluctuated in recent years between negative and mildly positive.
There are significant differences in construction of a wind farm, and many other renewable energy schemes, compared with large fossil-fueled or nuclear power stations. The construction time for onshore wind turbines is relatively short, with smaller farms being completed in a few months and larger projects generally within a year. The contrast with nuclear power, and even with conventional fossil fuel power plants, is significant.
In China, electricity demand has grown remarkably over the last decade. While China is renowned for its use of coal, half the world’s total, it has also become the world’s leading producer and deployer of renewable energy. China’s installed capacity of wind power grew from less than 6 gigawatts in 2007 to more than 75 gigawatts in 2012. In 2012, wind overtook nuclear power for the total amount of electricity produced in China (China Electricity Council, 2013; REN 21, 2013). What was also remarkable in 2012 was the extent to which the expansion of wind power was even larger than that of coal. In 2012, China increased electricity production more than twice as much (in absolute terms) from wind alone as from coal or nuclear power (Shuo, 2013). In the European Union, it is estimated that in 2012 renewables contributed around 22 percent of electricity production (European Wind Energy Association, 2013).
In the United States, much has been said about the importance of shale gas and how it has fundamentally changed the energy sector. The increase in gas is largely at the expense of coal. However, it is interesting to note that the combined increase in output from hydropower and wind is 60 percent of that of natural gas. Furthermore, renewables are closing the gap on gas: in 2012, more wind capacity was added than any other generating source, rising by 13 gigawatts to a total of more than 60 gigawatts. The dominance of renewables continued in the first quarter of 2013 with renewable energy sources (biomass, geothermal, solar, water, wind) accounting for 84 percent of all new domestic electrical generating capacity (Federal Energy Regulatory Commission, 2013).
A study by Bloomberg New Energy Finance projects that by 2030, renewable energy investments will increase by 2.5 to 4.5 times, with the “most likely” scenario an annual expenditure of about $630 billion (in nominal terms). The study results suggest “we are beyond the tipping point toward a cleaner energy future” (HydroWorld.com, 2013).
Footnotes
Editor’s note
This article is based on the World Nuclear Industry Status Report 2013, a 140-page report published by Mycle Schneider Consulting in July 2013 (see ![]() ). The article includes some updated statistics that were current as of December 1, 2013.
). The article includes some updated statistics that were current as of December 1, 2013.
Funding
Support for this research has been granted by various funders over the years. The most recent edition of the report received funding from Fred and Alice Stanback, the Heinrich Böll Foundation North America, the Swiss Energy Foundation, and the Greens/EFA Group in the European Parliament.