
Abstract
The market niche that nuclear power once held is disappearing. The key nuclear indicators—including the number of operating reactors, installed capacity, power generation, and share of total electricity generation—all show that the global nuclear industry is in decline. In 2012, nuclear power’s competitors—most notably, wind and solar generation—are rapidly gaining market share as long lead times, construction delays, cost overruns, and safety concerns have combined to make nuclear power a risky investment that the markets are increasingly unwilling to make. To renew the aging world nuclear fleet, nuclear utilities would need to surmount a number of major problems, including a short-term manufacturing bottleneck, a shortage of skilled workers, regulatory uncertainty, a skeptical financial sector, and negative public opinion. The aftermath of the Fukushima disaster and the world economic crisis have only exacerbated these problems. The authors write that a realistic scenario that leads to an increase in nuclear’s share of the world’s electricity is hard to imagine.
The triple disaster that hit the Fukushima Daiichi Nuclear Power Station on March 11, 2011 has had a profound impact on public opinion and nuclear policy far beyond Japan. In China, the government froze all new nuclear projects. In South Korea, public support for nuclear power plummeted. Belgium and Germany confirmed nuclear phase-out legislation by 2025 and 2022, respectively. The Netherlands and Switzerland have abandoned new reactor construction projects. And governments in many other countries are reviewing their nuclear plans.
In Japan, meanwhile opposition to nuclear power is changing format. In April, 64 mayors and six former mayors from 35 prefectures started a network aimed at creating communities that do not rely on nuclear energy. Members include the heads of the cities of Sapporo, Nagoya, the 3/11-stricken town of Minamisoma, and Tokyo’s Setagaya ward. Also included is the mayor of Tokai-mura, which hosts the nuclear power plant closest to Tokyo. Furthermore, local officials have played key roles in preventing the restart of Japanese nuclear plants, taking advantage of an unwritten law that requires their approval for important nuclear activities in their jurisdictions. Much of the source of the new nuclear controversy is clearly Fukushima-related.
To assess the impact of the Chernobyl disaster on the global nuclear industry, Greenpeace International, WISE-Paris, and the Washington-based Worldwatch Institute jointly published the first World Nuclear Industry Status Report in 1992 (WNISR, 1992). “Many of the remaining plants under construction are nearing completion so that in the next few years worldwide nuclear expansion will slow to a trickle,” the report asserted. “It now appears that in the year 2000, the world will have at most 360,000 megawatts of nuclear capacity—only 10 percent above the current figure. The market niche that nuclear power once held has in effect gone.” In 2012, reality has confirmed that assessment. Nuclear power’s competitors—most notably, wind and solar generation—are rapidly gaining market share as long lead times, construction delays, cost overruns, and safety concerns have combined to make nuclear power a risky investment that the markets are increasingly unwilling to make.
Global overview
As of summer 2012, a total of 31 countries were operating nuclear fission reactors for energy purposes—one more than in 2010—with Iran starting up its Bushehr reactor in 2011. Nuclear power plants generated 2,518 terawatt-hours (or billion kilowatt-hours) of electricity in 2011,
1
the same amount as in 2001 and 5.3 percent less than the historic maximum in 2006. The maximum share of nuclear power in commercial electricity generation worldwide was reached in 1993 with 17 percent (see Figure 1); it had dropped to 11 percent by 2011, a level last seen in the early 1980s.
Nuclear electricity generation in the world (total and share of electricity generation)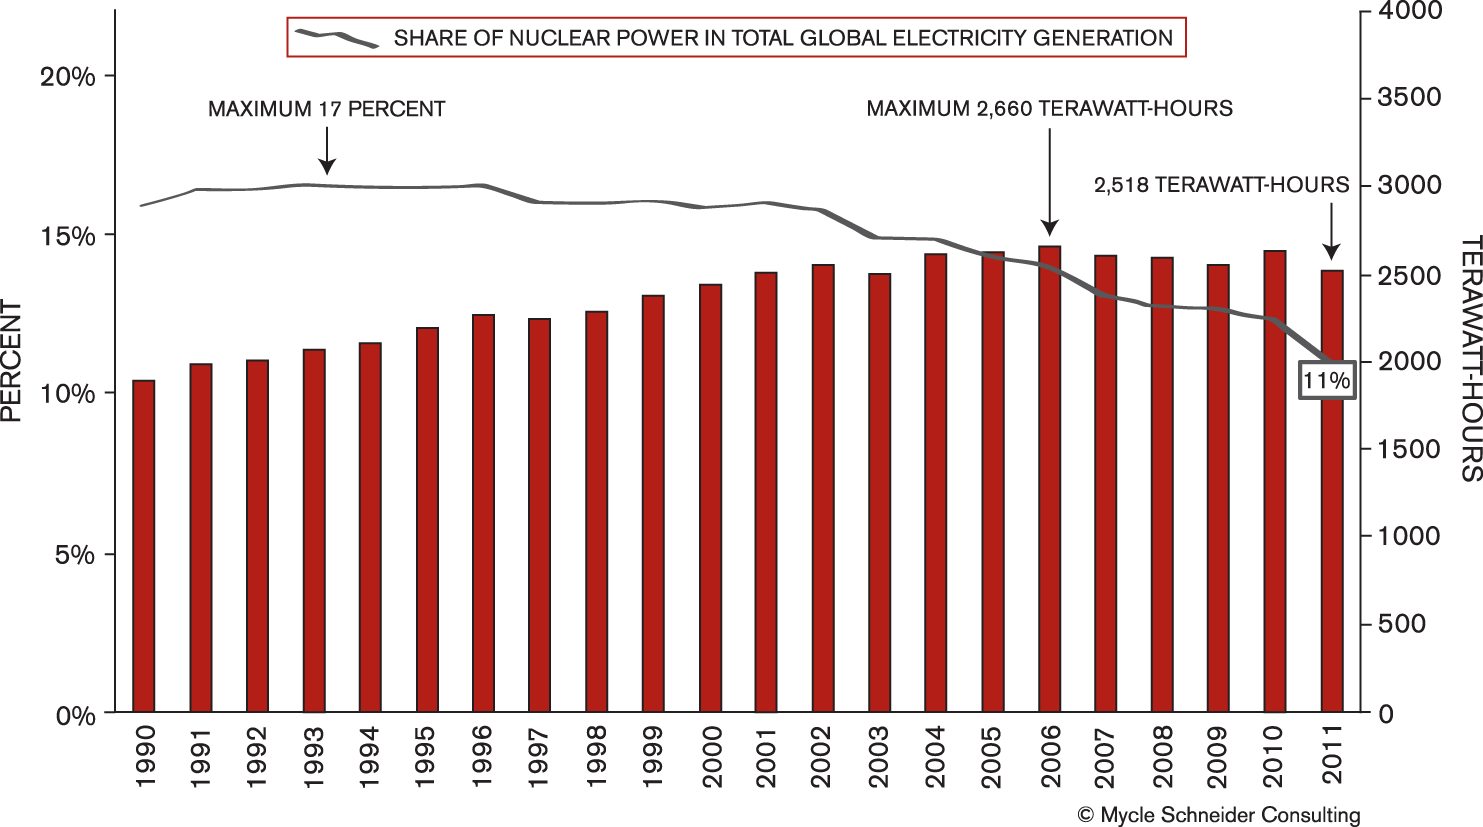
Two-thirds of the 31 countries operating reactors are past their nuclear-generation peak. Three phase-out countries—Italy, Kazakhstan, and Lithuania—and Armenia generated their historical maximum of nuclear electricity in the 1980s. Several other countries—among them Belgium, Canada, Japan, and the United Kingdom—had their nuclear power generation peak in the 1990s. And six additional countries peaked generation between 2001 and 2005: Bulgaria, France, Germany, South Africa, Spain, and Sweden. Even when countries increase the absolute amount of nuclear electricity production the increase generally has not kept pace with overall increases in electricity demand. In fact, all nuclear countries—with the exception of Iran—reached the maximum share of nuclear power before 2010.
As of July 1, 2012, a total of 429 nuclear reactors were operating in 31 countries, down 15 from the maximum of 444 in 2002. The current world reactor fleet has a total nominal capacity of about 364 gigawatts (or thousand megawatts). There are large uncertainties to these figures, mainly stemming from the undefined future of the 50 Japanese nuclear reactors that are officially still operating but were all, save two shut down as of September 1, 2012.
Currently, 13 countries are building nuclear power plants, which is two less than a year ago. As of July 2012, 59 reactors are under construction. 2 For perspective, the peak of units in progress was 234 in 1979.
Over the past year, the most spectacular construction freeze took place in China. No new concrete base was poured in the country after 3/11. The World Nuclear Association counts at least five authorized construction starts that did not happen (WNA, 2012).
The total capacity of units now under construction in the world is about 56 gigawatts, down by about 6 gigawatts compared with a year ago. A closer look at currently listed projects illustrates the level of uncertainty associated with reactor building:
Nine reactors have been listed as under construction for more than 20 years. The US Watts Bar-2 project in Tennessee holds the record; construction started in December 1972, was subsequently frozen, and is now scheduled to be finished in 2015. The Argentinian Atucha-2 reactor comes in second place; it was started 31 years ago. Four other reactors—two Taiwanese units at Lungmen and two Indian units at Kudankulam—have been listed as under construction for 10 years or more. At least 18 of the units listed by the International Atomic Energy Agency (IAEA, 2012) as under construction have encountered construction delays. Nearly three-quarters of the units under construction are located in just three countries: China, India, and Russia. None of these countries has historically been very transparent or reliable about information on the status of their construction sites. It is nevertheless known that half of the Russian units listed are experiencing multiyear delays.
Lead times for nuclear plants include not only construction times but also long-term planning, lengthy licensing procedures in most countries, complex financing negotiations, and site preparation.
Past experience shows that simply having an order for a reactor, or even having a nuclear plant at an advanced stage of construction, is no guarantee of grid connection. French Atomic Energy Commission statistics through 2002 indicate 253 canceled orders in 31 countries, many of them at an advanced construction stage. The United States alone accounts for 138 of these cancelations (CEA, 2002).
In the absence of any significant new construction and grid connections over many years, the average age of operating nuclear power plants has been increasing steadily and now stands at about 27 years. 3 To counter this, some nuclear utilities envisage average reactor lifetimes of beyond 40 years and even up to 60 years.
In the United States, reactors are initially licensed to operate for a period of 40 years. Nuclear operators can request a license renewal for an additional 20 years from the Nuclear Regulatory Commission (NRC). As of March 2012, 72 of the 104 operating US units have received an extension and another 15 applications are under review.
Many other countries, however, have no time limitations to operating licenses. In France, where the country’s first operating pressurized water reactor started up in 1977, reactors must undergo in-depth inspection and testing every decade. Only two plants—Fessenheim and Tricastin—have so far received a permit to extend operational life from 30 to 40 years. Incoming president François Hollande, however, has vowed to close down the two Fessenheim reactors, which will reach their 40-year lifetime marks in 2017 and 2018. But the safety authorities have made it clear that the units will close by July 2013, if the concrete slab under the reactor is not reinforced by then. Even if all of the oldest units were approved to operate for 40 years, 22 of the 58 French operating reactors will reach that age by 2020.
After the Fukushima disaster, it is obvious that the operating age requires a second look. The troubled Fukushima Daiichi units were initially connected to the grid between 1971 and 1974. Four days after the accidents in Japan, the German government ordered the shutdown of seven reactors that had started up before 1981. The exclusive selection criterion was operational age. Other countries did not follow, but it is clear that the 3/11 events had an impact on previously assumed extended lifetimes in other countries, including Belgium, Switzerland, and Taiwan.
Assuming a general lifetime of 40 years for worldwide operating reactors, one scenario for capacity projection indicates that, beyond the 59 units now under construction, 67 additional reactors would have to be finished and started up before 2020 to maintain the status quo. 4 Such an achievement appears unrealistic given existing constraints on the fabrication of key reactor components, the difficult financial situation of the world’s main reactor builders and utilities, the international economic crisis, and generally hostile public opinion. As a result, the number of reactors in operation will decline over the coming years unless lifetime extensions beyond 40 years become a widespread standard. The scenario of generalized lifetime extensions appears less likely after Fukushima.
Another scenario considers that all currently licensed lifetime extensions and license renewals—mainly in the United States—are maintained and all construction sites are completed. 6 The overall pattern of the decline would hardly be altered in such a scenario; it would merely be delayed by some years.
To renew the aging world nuclear fleet, nuclear utilities would need to surmount a number of major problems, including a short-term manufacturing bottleneck, a shortage of skilled workers, regulatory uncertainty, a skeptical financial sector, and negative public opinion. The aftermath of the Fukushima disaster, the threat of nuclear terrorism, and the world economic crisis have only exacerbated these problems. A realistic scenario that leads to an increase in nuclear’s share of the world’s electricity is hard to imagine.
Unfulfilled promises
The nuclear industry and its promoters have a long history of promising the impossible. Fantasy projections of installed nuclear capacity, on-time and on-budget construction, and unlimited cheap, clean, and safe electricity have been almost omnipresent throughout nuclear history. That trend continues, even as underlying facts strongly suggest an industry in decline.
Unrealistic projections
In 1973 and 1974, the International Atomic Energy Agency gave a forecast of installed nuclear capacity of 3,600 to 5,000 gigawatts worldwide by 2000 (Laue, 1982). Two years later, the French Atomic Energy Commission estimated the share of nuclear power in the world’s primary energy balance at 22 to 35 percent by the turn of the century (Finon, 1988). These optimistic projections soon confronted reality. The IAEA’s 1980 projections—740 to 1,075 gigawatts of installed nuclear power capacity by the year 2000—were a factor of two to three above the actual figure of 356 gigawatts. After Chernobyl, the Organisation for Economic Co-operation and Development’s Nuclear Energy Agency forecasted an installed nuclear capacity of 497 to 646 gigawatts for the year 2000, still between 40 percent and 80 percent above reality (NEA, 1987). One might wonder about the present relevance of projections from the 1970s and 1980s, but, to this day, these same organizations continue to produce analyses that are, to be kind, overly optimistic.
Number of nuclear reactors under construction, 1954–2012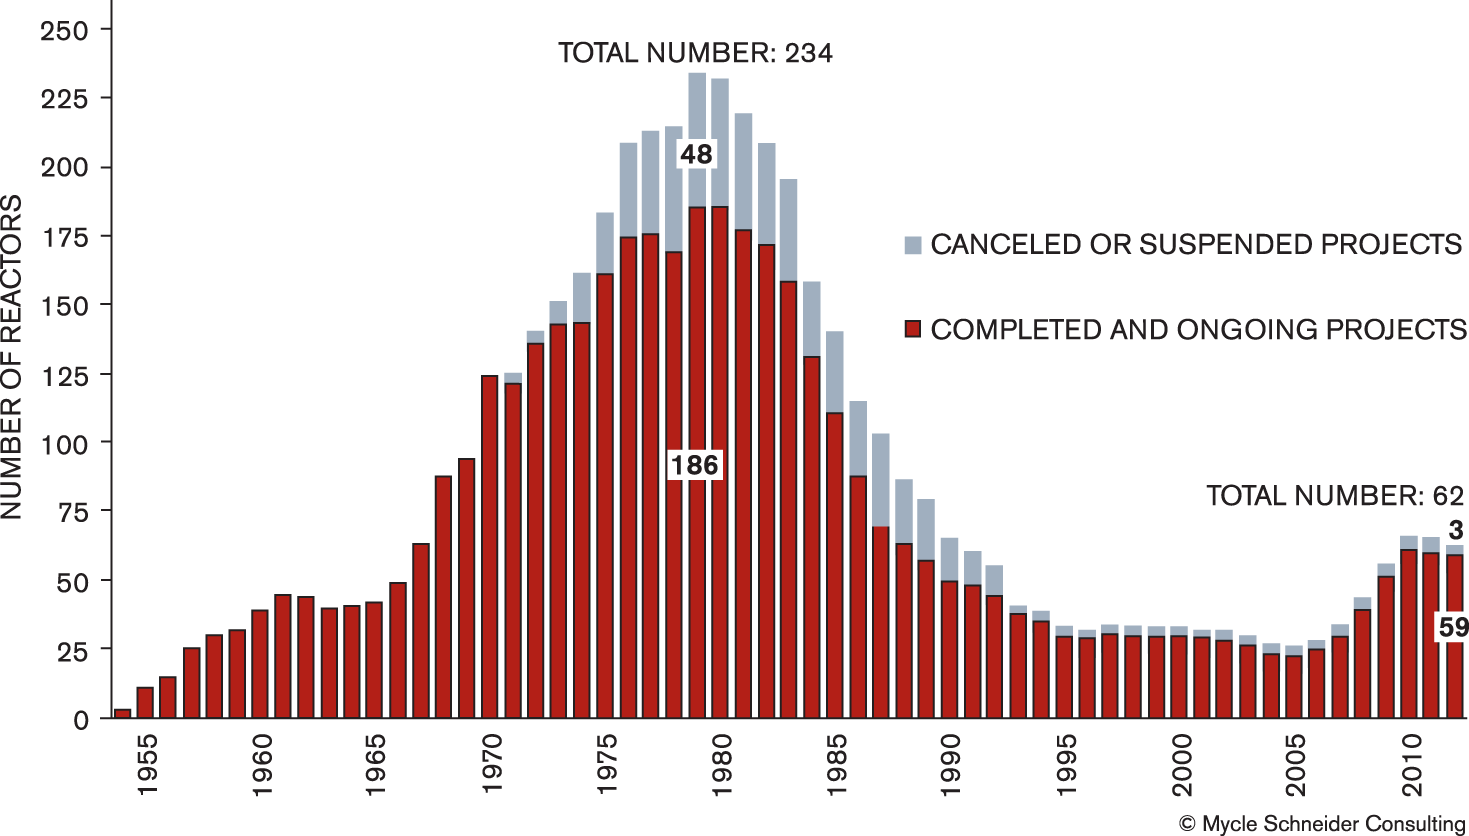
In May 2011, for example, just two months after the start of the Fukushima nuclear accident, Hans Blix, former director general of the IAEA declared: “Fukushima is a bump in the road and will also lead to a further strengthening of the safety of nuclear power” (AFP, 2011).
In 2011, however, at least 19 reactors were shut down definitively, of which 18 are a direct consequence of Fukushima, and only seven reactors were started up. After Chernobyl, Germany was the first country to start up a new reactor; after Fukushima, that same country shut down eight reactors. Only 17 months after its nuclear disaster, Japan has only two reactors operating with no additional one authorized to start up, at least for now. Times have indeed changed.
Increased construction times
Since the beginning of the nuclear age, there has been a clear global trend: Construction times for nuclear power plants have increased. The reasons for gradually lengthening construction periods are not fully understood. It is clear that continuously increasing safety requirements and lengthy legal cases have played a role. Growing system complexity is also likely to have had an impact on costs.
International Institute for Applied Systems Analysis analyst Arnulf Grübler called the phenomenon of increasing construction times and costs “forgetting by doing.” 7 Most of the nuclear countries have been struck by such forgetfulness. Over a 20-year period between 1992 and July 2012, a total of 89 reactors started up. Average construction time was almost nine years, with a large range: 3.2 years to 36.3 years.
After the Three Mile Island accident in 1979, construction times in the United States escalated from an average of six years to almost 12 years. In France, construction times were five to six years between 1970 and 1985. In the second half of the 1980s, they doubled. The eternal Tennessee Valley Authority (TVA) project Watts Bar-2 in Tennessee is an interesting illustration of runaway construction times and costs.
TVA ordered the Watts Bar-2 reactor in 1970. It was expected to enter commercial operation in 1976. By 1976, the project was 43 percent complete and four years behind schedule (Montgomery, 1978). Despite waning enthusiasm for atomic energy elsewhere in the country and the cancelation of many other nuclear plant orders, it took until 1985, 12 years after construction started, for work on Watts Bar-2 to be officially suspended.
In 2000, the NRC granted an extension of the 1973 construction permit for Watts Bar-2 to the end of 2010. In 2007, the TVA board approved a plan to complete Watts Bar 2 at a cost of about $2.5 billion. At this point, commercial operation was planned for 2012.
As of April 2012, almost 40 years after the original construction start in December 1972, four years after reactivation work started, Watts Bar-2 was about 70 percent complete. The total reactivation cost had mounted to $4.5 billion. TVA’s new “estimated time to complete is between September and December of 2015” (TVA, 2012). One month after that estimate was made, the NRC stated that “TVA plans to complete construction in late 2015 or 2016” (NRC, 2012).
The Watts Bar-2 project might be extreme, but it is not an isolated case. In 1989, the German reactor builder Siemens and its French counterpart Framatome (now integrated into Areva) formed a consortium for the development and marketing of the European Pressurized Water Reactor, or EPR. The concrete for the first EPR was not poured until August 2005—and that project was not in Germany or France, but in Finland. The Olkiluoto-3 unit was planned to start up in 2009. By early 2012, following a long series of management problems, quality-control issues, component failures, and design difficulties, Olkiluoto-3 was about five years behind schedule and cost estimates had risen to between $7.27 billion and $8 billion (6 and 6.6 billion euros)—or 100 to 120 percent over budget.
The markets and nuclear power
Nuclear power has been perceived by many financial institutions as a higher-risk investment than conventional or new renewable electricity-generating sources. In the weeks and months following the nuclear meltdowns at Fukushima, many in the financial community made clear their views on the expected impact on global nuclear-sector development. In its April 2011 analysis of the accident, the Swiss banking group UBS noted: Before the Fukushima accident, [the Tokyo Electric Power Company] was viewed as a low-risk regulated utility, mainly bought for its stable earnings and dividends. However, the events at Fukushima have led to an 80 percent decline in its share price and discussions about the future viability of the company. Such a quick change in prospects would have been unlikely if Fukushima had been a traditional thermal generation plant. This additional risk linked to nuclear exposure has not, it seems to us, been properly priced in by the market. (UBS, 2011)
Predictions on the possible importance and impact of Fukushima have been borne out over the past 15 months, with little global appetite for construction of new nuclear reactors. There is no single reason for the lack of new orders, but it is clear that in those parts of the world that have more liberalized electricity markets, an important factor is the rising financial costs of nuclear projects. Linked to those costs is increased scrutiny from the financial sector. As the chief executive of E.ON, one of the largest nuclear operators in Europe, put it: “Ultimately the driver for investment [in new reactors] will be the cost of capital, not politics. Definitely, the cost of capital will be higher after Fukushima” (Nucleonics Week, 2011).
The role of credit rating agencies
Three major rating agencies—Moody’s, Standard and Poor’s, and Fitch—assess the financial strength of companies and governmental entities and their ability to make payments on their debt. The impact of Fukushima on the nuclear companies is obvious. The Tokyo Electric Power Company, or Tepco, has moved from an AA rating prior to the event to a B+ rating today. The world’s largest reactor builder, Areva, started declining long before 3/11 and plunged from an A rating in 2009 to BBB–, only one notch above “junk” status.
The decision by the German engineering company Siemens to exit its nuclear business in September 2011 was actually seen by Moody’s to be credit positive. And in March 2012, a Moody’s analyst was quoted as saying, “If [a utility] is already on the edge of a ratings band, a nuclear project could be the thing that pushes them over the edge—it’s just another negative factor” (ICIS Heren, 2012).
Market and ledger value
Many major electrical utilities are now fully or partially owned by the private sector. Their stock valuations performed poorly before Fukushima but have plunged after the disaster. The share price of the owner and operator of Fukushima Daiichi, Tepco, has, not surprisingly, lost 96 percent of its share value since 2007. The shares of the world’s largest nuclear operator, EDF, have lost 82 percent of their value over the same period, while the largest nuclear builder, Areva, has lost 88 percent of its stock value.
Average annual construction times around the world, 1954–2012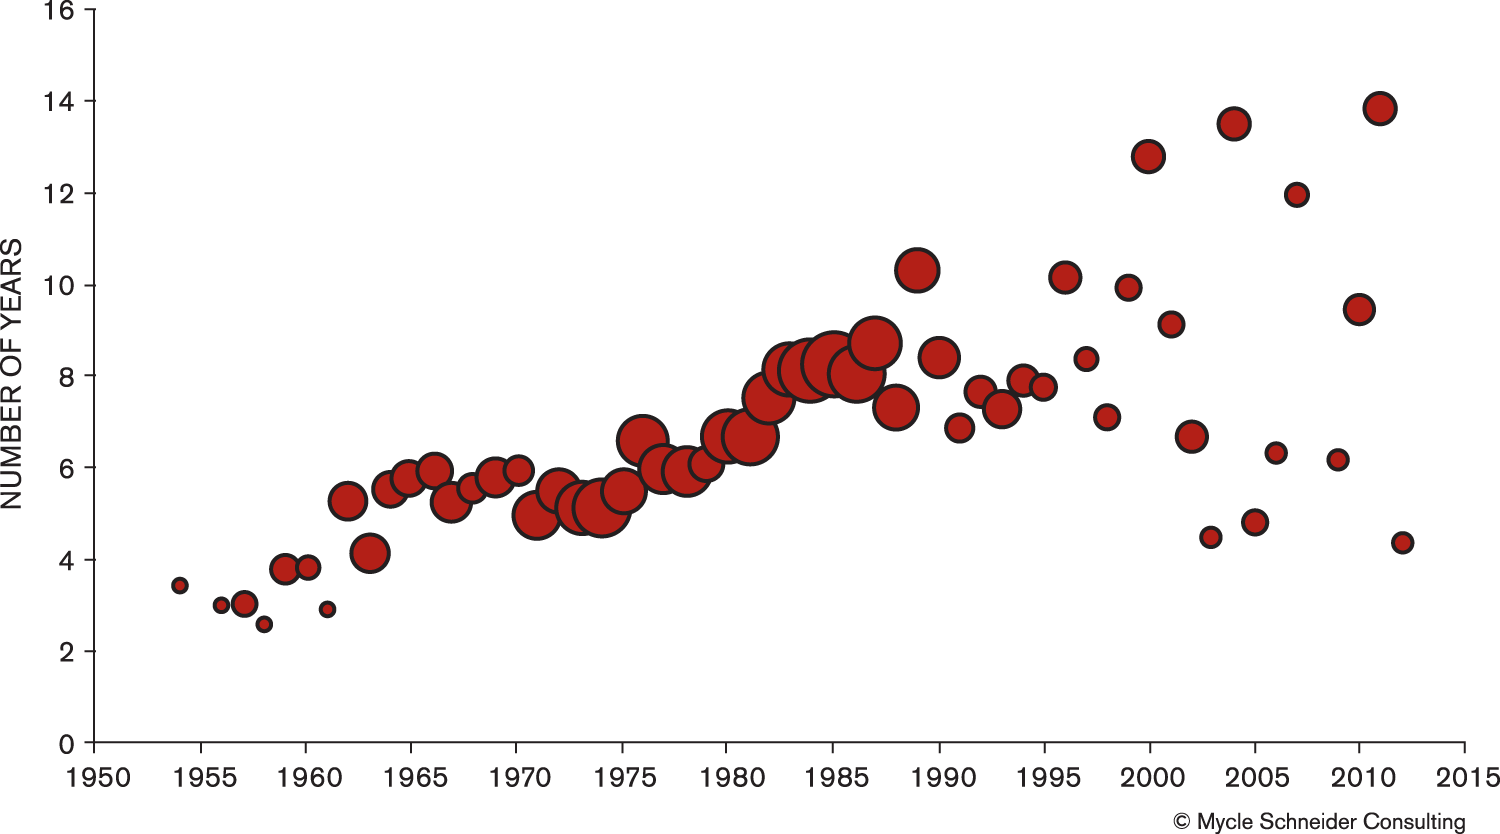
Figure 4 shows the relative net income of major utilities and vendors involved in nuclear power since 2007, with none of the companies surveyed considerably increasing their income over the period. While the loss of Tepco would be expected, the performance of other major nuclear companies is rather surprising. As reflected in the declining credit rating, Areva has done particularly badly over the past year, with a net income of 883 million euros in 2010
8
shifting to a loss of 2.4 billion euros in 2011. South Korea’s Kepco has also experienced significant losses in the past few years and has stated that electricity prices are so low that it cannot cover its operating costs. Consequently, its financial prospects are beholden to national policy; the government controls 51 percent of the firm’s shares.
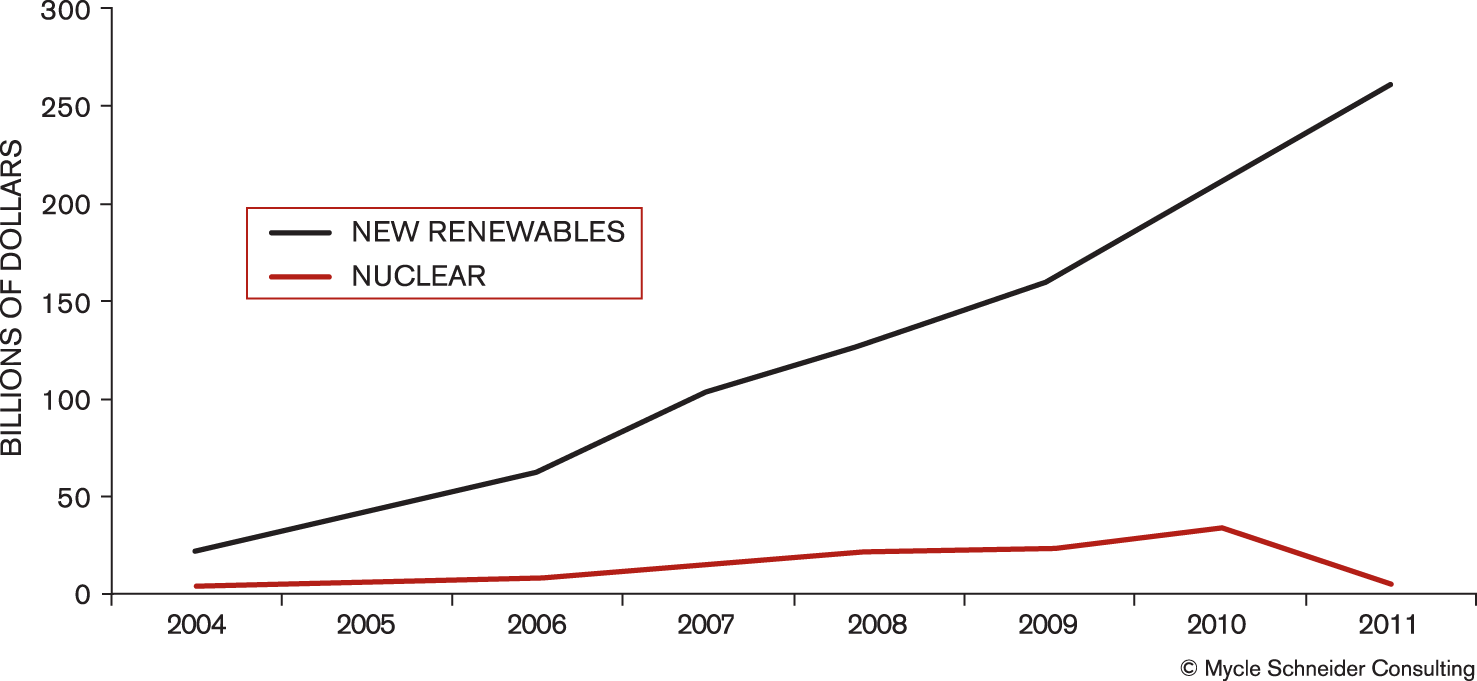
Relative changes in net income of major nuclear companies, 2007–2011 Global investment decisions in new renewables and nuclear power, 2004–2011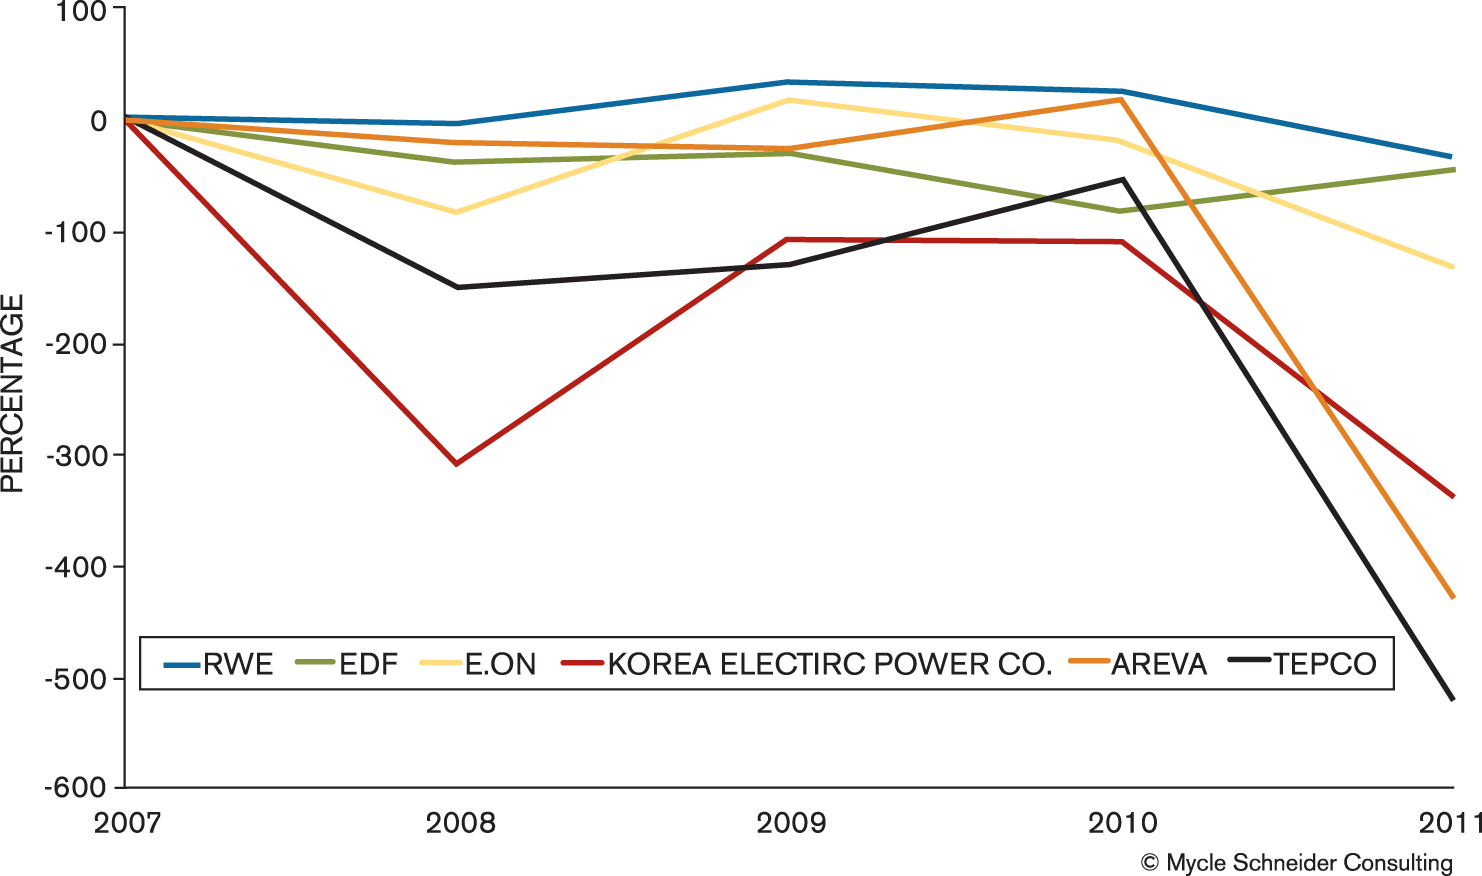
Given the extent to which the financial risks of nuclear investments are now understood by the utilities and the financial sector, it is clear that nuclear plants will not be built without government support. In a revealing presentation, a representative of the French bank BNP-Paribas concluded that “significant government sponsorship will be required in most markets to implement new nuclear” (Muldowney, 2012).
Nuclear power vs. renewable energy deployment
Given the diversity of energy services—cooking, heating and cooling, lighting, communication, mobility, motor torque—there is no silver bullet or single technology that will create the low-carbon energy future dictated by climate change. A number of factors will determine the relative roles and ranking of different technologies, old and new, in the future energy mix.
Nuclear, wind, and solar capacity increases around the world, 2000–2011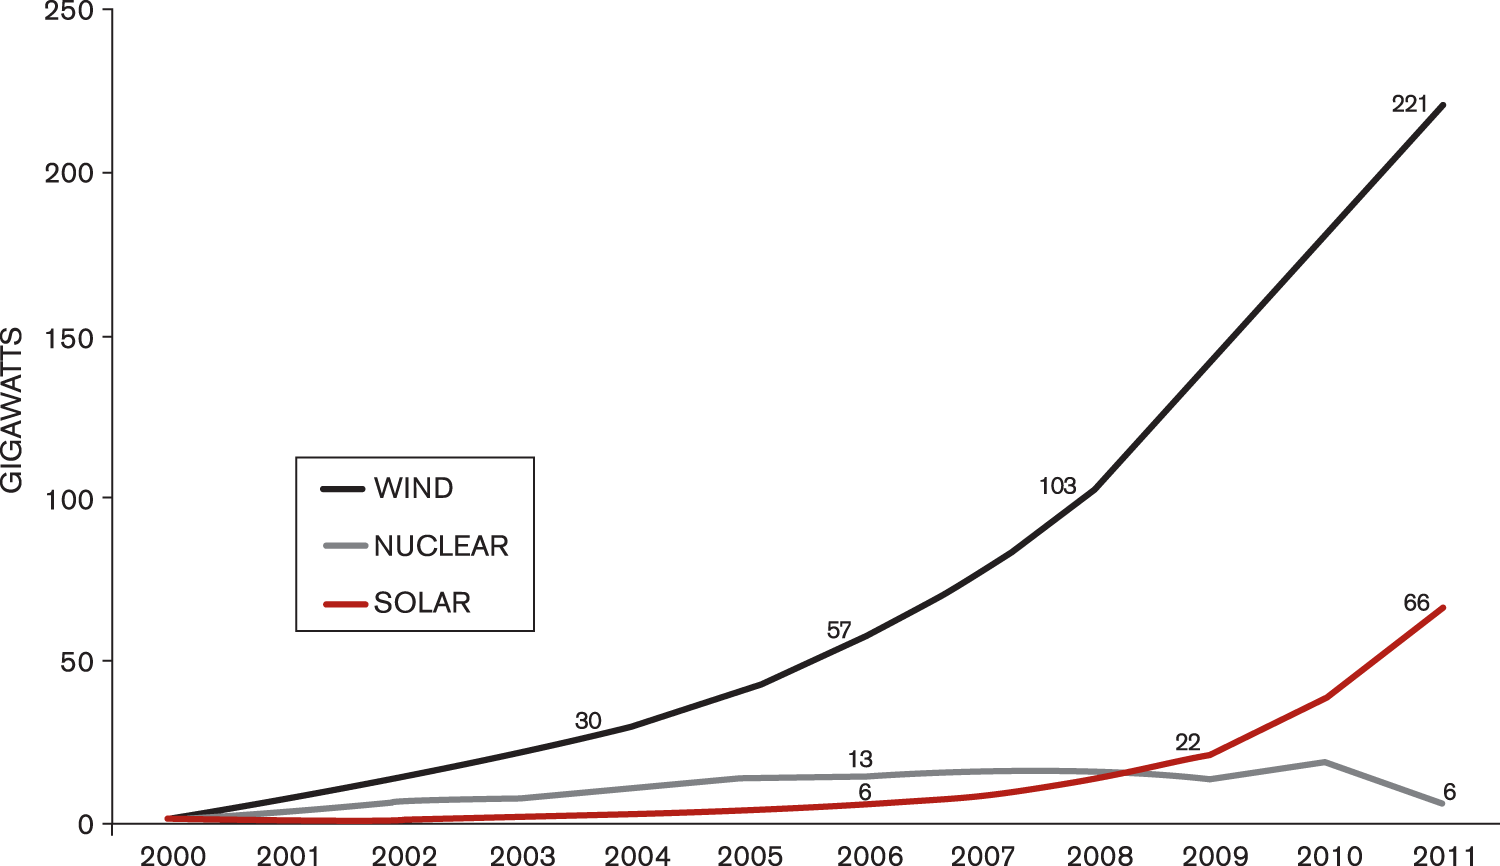
Investment
According to an assessment by Bloomberg New Energy Finance, global investment in clean energy reached a new record of $260 billion in 2011, up 5 percent from 2010 and almost five times the 2004 total of $53.6 billion. According to Michael Liebreich, CEO of Bloomberg New Energy Finance, there was a 36 percent increase in investment in solar technology in 2011, to $136.6 billion, nearly double the $74.9 billion investment in wind power. The largest single type of investment was the asset financing of utility-scale renewable energy projects. Interestingly, the second-biggest category of investment was the financing of distributed renewable power technology, largely rooftop photovoltaic installations, which reached $73.8 billion.
Nuclear’s installation disadvantage
The IAEA estimates that starting a new nuclear program in a country without experience can take between 11 and 20 years, and the French safety authorities assume a minimum of 15 years to set up an appropriate framework. The long lead times and complexity of the commissioning and construction of nuclear plants create risk. The history of the global nuclear industry is littered with examples of projects that have been proposed or begun but never opened for business.
The European Wind Energy Association, on the other hand, likens building a wind farm to the purchase of a fleet of trucks: The turbines are bought at an agreed fixed cost and on an established delivery schedule. Although some variable costs are associated with the civil works, these are very small compared with the overall project cost (EWEA, 2003). The construction time for onshore wind turbines is relatively quick, with smaller farms completed in a few months, and most well within a year. The contrast with nuclear power is significant.
As a result of marked differences in installation cost and time, new renewable energy has greatly outpaced nuclear energy in recent years. Over the past decade, the deployment of net new nuclear capacity has been outpaced by wind power by a factor of 37, and even the volume of photovoltaic solar power added during the decade has overtaken nuclear on the global level by a factor of 10.
China reflects an accelerated version of the global situation. Installed windpower capacity grew by a factor of 25 in five years to reach close to 63 gigawatts, equivalent to the French nuclear fleet 9 and five times more than the Chinese nuclear capacity. Solar capacity was multiplied by a factor of 47 in those five years.
Skeptics of renewable energy highlight the variable output of some technologies. A consequence of variability is the lower output per installed megawatt than that of traditional power stations. But despite this, electricity generated by non-hydro renewable generation is now becoming significant, both nationally and globally.
In 2011, wind power produced 330 terawatt hours more electricity than it did at the turn of the century, which is a four times greater increase than was achieved by the nuclear sector over the same period. The growth in solar-photovoltaic generation has been impressive in the past decade, with a tenfold increase in the past five years. While the overall global contribution of nuclear power still exceeds, by a factor of six, that of solar and wind power, this gap is rapidly closing.
In 2011, for the first time since the buildup of the nuclear program in Germany, the power production from renewables, at 122 terawatt-hours (gross), was only second to lignite (153 terawatt-hours), and exceeded that of coal (114.5 terawatt-hours), nuclear power (102 terawatt-hours), and natural gas (84 terawatt-hours). Total renewables output increased by 19 percent over the previous year and represents now one-fifth of the German power generation, up from 3 percent in 1991. The growth rate in recent years has been particularly impressive in the solar power sector. Within two years, about 15 gigawatts of photovoltaic capacity was added to the grid, bringing the total to 25 gigawatts, and solar power generation tripled to 19 terawatt hours in 2011.
The crossover
Climate change, resource efficiency, and security of the energy supply have influenced rapid development of renewable energy. Furthermore, some governments have seized upon the development of renewables as a means of future economic growth. Some governments have introduced financial-support schemes to enable renewables to compete in many liberalized energy markets, to balance the lack of inclusion of environmental externalities in the market price, to counter historic subsidies for other energy forms, and to aid in diversification of the energy supply.
These support schemes recognize that the costs of renewable energy will fall due to technology development and economics of scale. The costs of photovoltaic solar have fallen dramatically, with a 75 percent drop since 2008 and 45 percent alone in 2011. The wind sector has also seen significant declines (Liebreich, 2012). Consequently, the framework for renewable energy support schemes aims to reward the market pioneers with higher prices, while reducing the level of support as the technologies become more mature. The clearest example of this is in Germany, which has been at the forefront of renewable energy deployment. The feed-in tariff that supports rooftop photovoltaic solar installations fell 58 percent between 2008 and 2012 (Solar- und Windenergie, 2012).
One trend that illustrates the rise of renewable energy is the increasing appearance of grid parity, which occurs when the unit cost of renewable energy is equal to the price that end users pay for their electricity. 10 At grid parity, it makes economic sense, regardless of government support schemes, for consumers to generate their own electricity rather than purchase electricity from the grid. Numerous studies have shown that grid parity has already been achieved in Germany, Denmark, Italy, Spain, and parts of Australia.
A detailed study on photovoltaic grid parity by Christian Breyer and Alexander Gerlach of Q-Cells SE, the largest producer of solar cells in Europe, examined more than 150 countries covering 98 percent of the world’s population. It concluded that “[g]rid parity events will occur throughout the next decade in the majority of all market segments in the world, starting on islands and regions of good solar conditions and high electricity prices” (Breyer and Gerlach, 2012).
While there is some criticism of the term “grid parity,” what is clear is that the costs of photovoltaic solar electricity have fallen dramatically, and solar is becoming competitive without subsidies in an ever-increasing number of markets. This trend will have far-reaching implications for investors in generating capacity and for management of grid systems.
Three years ago, photovoltaic solar provided 1 percent of Germany’s electricity demand; today it is around 4 percent and is expected to reach 7 percent in 2016. The impact of this new capacity can be seen at midday, when solar production and demand are at maximums. A study by the Institut für Zukunfts Energie Systeme compared the prices on the German power exchange during the day between 2007 and 2011. Photovoltaic solar provided an average of nearly one-sixth of total demand in May 2011. The study showed that this production held down prices during times of peak demand.
Between January and April 2012, the average baseload kilowatt-hour was negotiated on the spot market at 4.5 cents, or 13 percent lower than during the first quarter of 2011 (IWR, 2012).
Some analysts consider photovoltaic solar energy to be competitive with nuclear new-build projects under current real-term prices. The late John O. Blackburn of Duke University calculated a “historic crossover” of solar and nuclear costs in 2010 in North Carolina. Whereas “commercial-scale solar developers are already offering utilities electricity at 14 cents or less per kilowatt-hour,” Blackburn estimated that a new nuclear plant would deliver power for 14 to 18 cents per kilowatt-hour (Blackburn and Cunningham, 2010). In April 2012, a California auction of photovoltaic solar power cleared at an average bid price of 8.9 cents. 11
Some of the best US windpower projects contracted in 2011 to sell power for 3 cents per kilowatt-hour—a price that new nuclear projects could not come close to matching. 12
The post-Fukushima reality
After Chernobyl, the nuclear industry struggled for 10 years to develop a survival strategy. It was sold to the world as revival. In reality, however, many nuclear companies and utilities were facing great difficulty before the disaster at Fukushima. Seventeen months after 3/11, it is likely that the decline of the industry will only accelerate. It appears increasingly obvious that nuclear systems are neither economically competitive, nor acceptable from environmental or social perspectives.
The nuclear establishment has had a long history of failing to deliver on exuberant promises and glossing over glaring problems. Today, installed nuclear capacity is not even one-tenth of what the IAEA projected in the 1970s for the turn of the century.
There are now around 400 nuclear power reactors in operation. Because financial and other realities militate strongly against new nuclear construction, the nuclear industry is pushing to keep existing units operating as long as possible. One-third of the nuclear countries generated their historic maximum of nuclear electricity in 2011, raising troubling questions about the depth of the nuclear safety assessments— so-called “stress tests”—carried out around the world after the Fukushima disaster. The future of the nuclear industry increasingly depends on cash-abundant state economies, wealthy utilities, experienced builders with a large knowledge base, favorable public opinion, and generous safety authorities. However, the choice of countries with that profile is narrow.
Footnotes
Funding
Support for this research has been granted by various funders over the years and the most recent edition of the report received funding from the Swiss Energy Foundation, the German Hermann Hatzfeldt Foundation, and an anonymous donor.