
Abstract
Climate science and nuclear weapons testing have a long and surprisingly intimate relationship. The global networks that monitored the Fukushima radiation plume and forecasted its movement are the direct descendants of systems and computer models developed to trace fallout from weapons tests. Tracing radioactive carbon as it cycles through the atmosphere, the oceans, and the biosphere has been crucial to understanding anthropogenic climate change. The earliest global climate models relied on numerical methods very similar to those developed by nuclear weapons designers for solving the fluid dynamics equations needed to analyze shock waves produced in nuclear explosions. The climatic consequences of nuclear war also represent a major historical intersection between climate science and nuclear affairs. Without the work done by nuclear weapons designers and testers, scientists would know much less than they now do about the atmosphere. In particular, this research has contributed enormously to knowledge about both carbon dioxide, which raises Earth’s temperature, and aerosols, which lower it. Without climate models, scientists and political leaders would not have understood the full extent of nuclear weapons’ power to annihilate not only human beings, but other species as well. In the post-Cold War era, US national laboratories built to create the most fearsome arsenal in history are now using their powerful supercomputers, their expertise in modeling, and their skills in managing very large data sets to address the threat of catastrophic climate change.
Keywords
As the disaster unfolded at the Fukushima Daiichi Nuclear Power Station in March 2011, steam and smoke from explosions, fires, deliberate venting, and firefighting efforts carried radioactive material high into the air. Borne on westerly winds, the radiation plume began to spread. Downwind populations waited nervously for news: Where would it travel? How much radiation did it carry, and how much would remain by the time it reached their shores? One group stood ready to track the Fukushima plume: the Comprehensive Test Ban Treaty Organization (CTBTO).
The CTBTO maintains a global network of some 60 monitoring stations designed to measure airborne radionuclides. But because the network’s principal purpose is to detect aboveground nuclear weapons tests, initial reports suggested that the organization’s data would be kept secret (Butler, 2011). Yet on March 15—just four days after the tsunami and three days after the first explosion—the CTBTO released a forecast of the plume’s likely path across the northern Pacific (Broad, 2011). As the catastrophe continued, the organization’s researchers, the Austrian Central Institute for Meteorology and Geodynamics, and other agencies acquired data from the CTBTO’s Pacific stations. Using computer models of atmospheric transport, which simulate the movement of aerosols and the air parcels that carry them, the researchers produced forecasts showing the plume’s eastward flow toward the west coast of the United States. Large audiences viewed these simulations not only in traditional media, but on YouTube and other Internet news sources.
These transport models also allowed CTBTO member states to work backward from the data in order to estimate the Fukushima “source terms” (the amounts of radioisotopes released by the damaged reactors). These estimates showed that large emissions of radioactive iodine and cesium must have taken place immediately after the first explosion—long before the first significant radiation releases officially reported by the Tokyo Electric Power Company, or Tepco, the reactor operator (Wotowa, 2011). Widely publicized, the estimates contributed to mounting concern about Tepco’s management of the emergency and its failure to release data in an honest and timely manner.
The elements of this situation—data from a global monitoring system, computer models of the atmosphere, and the use of aerosols as tracers—are direct descendants of an old and surprisingly intimate relationship between climate science and nuclear affairs. Without nuclear weapons tests, much less would be known about the atmosphere than what is understood today. In particular, nuclear testing and nuclear weapons research have contributed enormously to knowledge about both carbon dioxide, which raises Earth’s temperature, and aerosols, which lower it.
The benefits of fallout monitoring
The somewhat macabre title of the late atmospheric chemist Lester Machta’s 2002 review article, “Meteorological Benefits from Atmospheric Nuclear Tests,” points to the many ways that meteorologists have increased their knowledge by tracking radioactive materials in the atmosphere. Tracing carbon as it cycles through the atmosphere, the oceans, and the biosphere has been crucial to understanding anthropogenic climate change, and fallout monitoring and stratospheric sampling have contributed to today’s global observing system.
Planners for the earliest, relatively small nuclear weapons tests did not expect fallout to spread far. Yet soon after the Trinity nuclear test held in New Mexico, cornstalks from fields more than 1,000 miles away contained enough radioactivity to ruin x-ray film interleaved with paper made from those cornstalks (Eisenbud et al., 1995). As bombs grew larger and test shots took place at higher altitudes over the years, fallout spread farther. Facing problems with its film stock, the Eastman Kodak Company installed air filters and radiation detectors at its factory in Rochester, New York (Harley, 1976). In 1951, the company threatened to hold the Atomic Energy Commission liable for fallout-damaged film products (Eisenbud, 1994).
During the Castle Bravo thermonuclear test in 1954, commanders ignored a weather forecast predicting strong high-altitude winds at the Bikini Atoll site. The bomb produced a 15-megaton blast, three times more powerful than expected. The resulting fallout poisoned hundreds of Marshall Islanders, US servicemen observing the test, and the crew of the luckless Japanese fishing vessel Lucky Dragon, one of whom died. Following panic in Japan and a clumsy Eisenhower administration cover-up attempt, the United States paid Japan $15 million in compensation.
These events, and others like them, led to the creation of worldwide fallout monitoring networks. A continental network of gummed-film collectors (which trapped fallout particles on one-foot-square pieces of flypaper-like film mounted horizontally on stands above the ground), established by the Atomic Energy Commission’s Health and Safety Laboratory in 1951, was eventually extended to some 200 Air Force weather stations around the world. The United Kingdom and the World Meteorological Organization organized additional fallout monitoring networks between 1956 and 1964. Just as today’s CTBTO network was used to estimate the Fukushima source terms, the US Air Force used these fallout monitoring systems in combination with aircraft data and weather maps to “track back” Soviet nuclear detonations to their secret test sites (Harley, 1976; Machta, 2002).
Natural and artificial radiocarbon
Atmospheric nuclear testing had another outcome that proved enormously consequential: It produced large quantities of radioactive carbon-14, also known as radiocarbon. Cosmic rays produce this isotope naturally at a predictable rate in the upper atmosphere. Thermonuclear tests, which launched debris clouds into the stratosphere, injected large amounts of “excess” radiocarbon—nearly doubling the atmospheric concentration of this material by the time aboveground testing ended in 1963 (Figure 1).
Radiocarbon levels in the atmosphere, 1945–2000.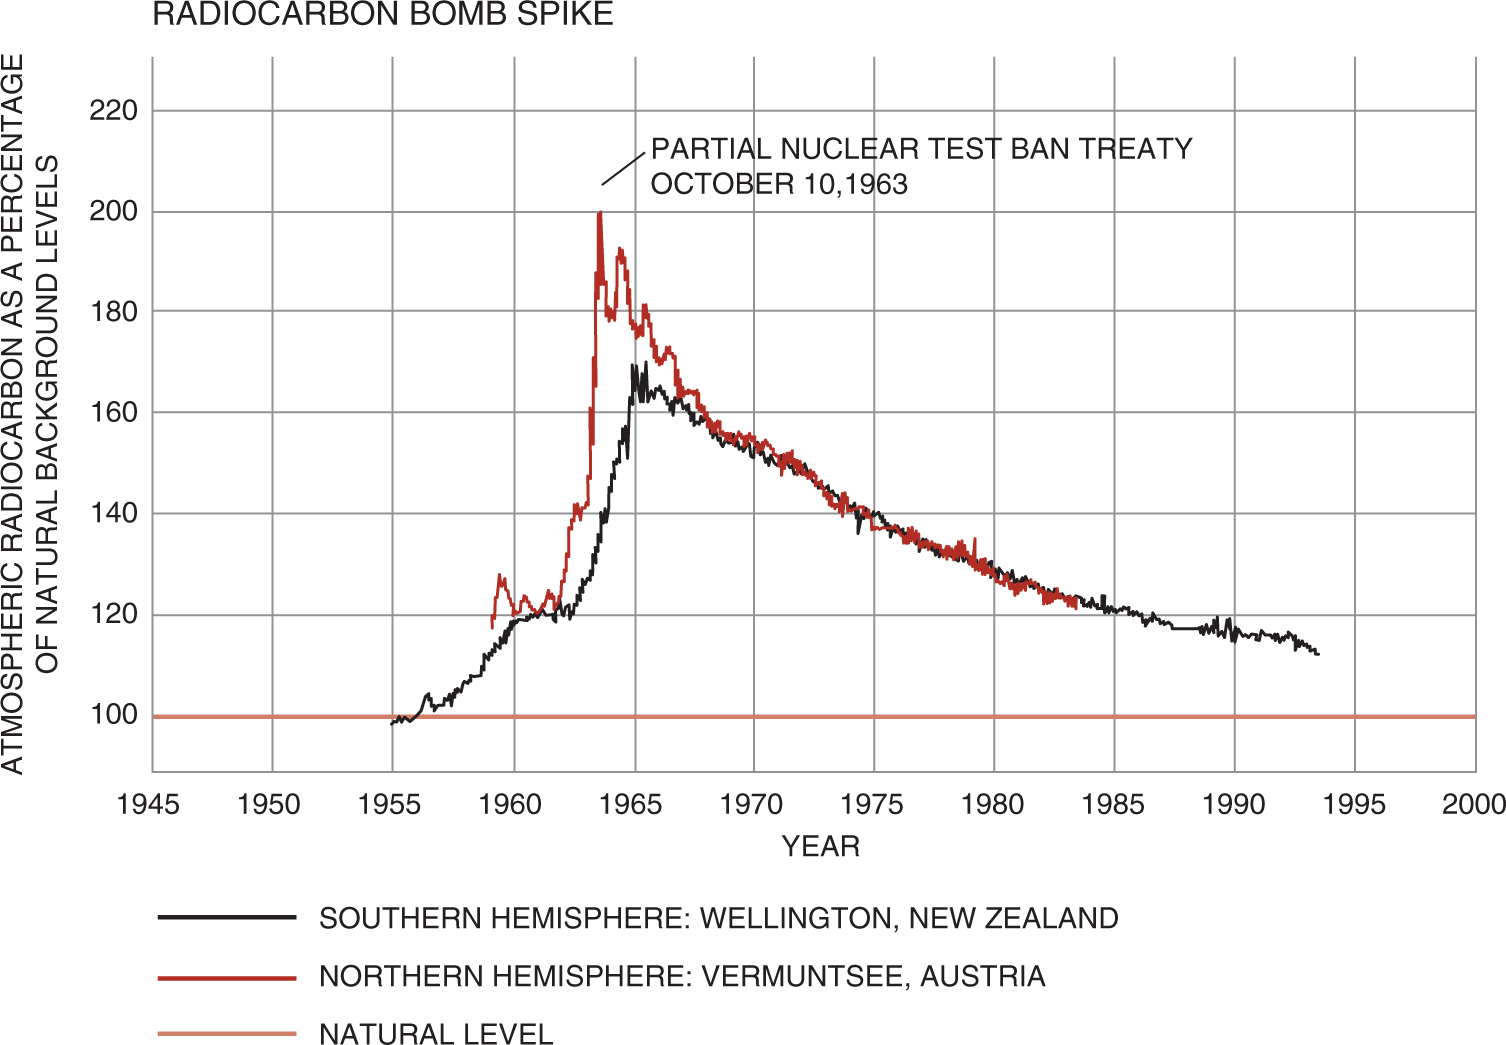
Bomb or “excess” radiocarbon provided the first highly effective way to trace the path of individual parcels of air at high altitudes. In the 1950s, climatologists still knew embarrassingly little about circulation in the stratosphere. How much and how rapidly did gases mix there? How long did stratospheric aerosols remain aloft? Did they cross the equator readily, or not? Scientists had few tools with which to answer such questions. Artificial satellites did not yet exist, high-flying jet aircraft were new, and systematic large-scale sampling by radiosondes (weather balloons) was just beginning.
From 1953 to 1955, and again in 1957, scientists from Argonne National Laboratory, the Weather Bureau (which later became the National Weather Service), and the University of Chicago’s Fermi Institute for Nuclear Studies (which later became the Enrico Fermi Institute) used high-flying balloons to collect air samples at altitudes between 45,000 and 100,000 feet. They then analyzed carbon dioxide, radiocarbon, and tritium concentrations of the samples (Hagemann et al., 1959). Their results revealed some previously unknown and important facts. First, carbon dioxide concentrations were nearly uniform (about 310 parts per million) at all altitudes, demonstrating that the gas mixed rapidly and consistently throughout the atmosphere. This meant that measurements taken at just a few places should be sufficient to monitor the global concentration of carbon dioxide. Second, bomb radiocarbon had spread from the Marshall Islands test site to higher latitudes both north and south of the equator.
Other, similar studies confirmed that fallout spread throughout the stratosphere—globally—within about two years (Broecker and Walton, 1959; Rafter and Fergusson, 1957). Residents of the southern hemisphere would thus not be spared the consequences of a major nuclear exchange.
Studies of natural radiocarbon, begun before World War II, also had major relevance for climate science. Plants ingest carbon dioxide, which contains a small, stable percentage of radiocarbon. Animals ingest plants, so all living things contain an amount of radiocarbon that is readily determined. After they die, the radiocarbon in their remains gradually decays, leaving only non-radioactive carbon-12. This allows scientists to date fossils by measuring how much radiocarbon they still contain and to precisely track the carbon cycle (the circulation of carbon between the atmosphere, the biosphere, and the oceans).
By 1950, physical chemist Willard Libby and graduate student Ernest Anderson had estimated the global distribution of natural radiocarbon. (Libby, incidentally, also studied fallout and became a member of the Atomic Energy Commission in 1954.) Learning of Libby’s research, Hans Suess, an Austrian nuclear physicist who had worked on nuclear power for the Germans during World War II, realized that he could use natural radiocarbon to estimate the rate at which the oceans absorb carbon dioxide. Among other things, Suess observed that coal contains virtually no radiocarbon (because it is ancient by comparison with the 5,600-year half-life of carbon-14). Therefore, he realized, industrial-era fossil fuel combustion had effectively “diluted” the atmosphere’s natural radiocarbon with non-radioactive carbon. Suess was among the first scientists to take up the otherwise neglected work of Guy Stewart Callendar, who had connected a steady increase in atmospheric carbon dioxide with fossil fuel combustion and linked it to a global average temperature increase between 1890 and 1930 (Callendar, 1938, 1939, 1949; Fleming, 2007). 1
Suess went on to work with oceanographer Roger Revelle at the Scripps Institution of Oceanography. Revelle, too, had studied the byproducts of nuclear weapons tests; in 1946, he commanded a large US Navy scientific mission to Bikini Atoll, following the earliest tests there (Weart, 2007). Together, Revelle and Suess wrote a seminal study showing that, at 1950s rates of consumption, the oceans could absorb only about 80 percent of the carbon dioxide produced by fossil fuel combustion. The result would explain why measurements showed a steady increase, since the nineteenth century, in the atmospheric concentration of carbon dioxide.
That paper, published in 1957, contained Revelle’s famous remark that “human beings are now carrying out a large scale geophysical experiment of a kind that could not have happened in the past nor be reproduced in the future” (Revelle and Suess, 1957). It also spurred Revelle to support Charles Keeling in establishing carbon dioxide monitoring stations in Antarctica and at Mauna Loa, Hawaii. These stations became the source of one of the few undisputed facts in the global warming controversy, namely the rise in atmospheric carbon dioxide from about 280 parts per million before the industrial era to some 397 parts per million today (Keeling, 1960, 1976; Keeling and Whorf, 2005).
Weather forecasting and climate modeling
Weather forecasting by computer simulation dates to just after World War II, when Princeton University mathematician John von Neumann catalyzed a well-funded effort by military agencies and the Weather Bureau to develop computerized forecast models. Von Neumann, who had been deeply involved in the Manhattan Project, selected weather forecasting over many other possible applications for the earliest electronic digital computers because it bore a strong mathematical similarity to nonlinear fluid dynamics problems that cropped up in nuclear weapons design. In addition, weather forecasting could demonstrate the non-military value of digital computers, expanding the base of support for further work with the new, still unproved machines (Aspray, 1990; Edwards, 2010).
By 1955, numerical weather prediction—a combination of data analysis and computer simulation—had emerged as a major new technique, spurred (and funded) in large part by Navy and Air Force interests (Fleming, 2010; Harper, 2008). By 1960, laboratories in the United States, Scandinavia, and the United Kingdom were trying to extend weather forecasting to longer time scales. Their ultimate aim was what von Neumann called “the infinite forecast”: simulation of the atmosphere’s global circulation over periods long enough to explore the fundamental principles of Earth’s climate. The first prototypes of general circulation models (global climate models) were built at Princeton in the laboratory that von Neumann helped establish (Phillips, 1956). A direct descendant of that lab, the Geophysical Fluid Dynamics Laboratory, remains one of the world’s foremost climate research centers (Edwards, 2010).
Five pioneering general circulation models were built between 1955 and 1965. One of these was created by Cecil Leith, a mathematician who had worked on the Manhattan Project. At Oak Ridge and the Lawrence Radiation Laboratory (now the Lawrence Livermore National Laboratory), Leith was among the first mathematicians to develop numerical methods for solving the fluid dynamics equations needed to analyze shock waves produced in nuclear explosions—methods that are very similar to those required to simulate atmospheric motion. Early climate modelers and nuclear weapons designers frequently made use of the same textbook, Robert Richtmyer’s Difference Methods for Initial Value Problems, which stemmed directly from Richtmyer’s earlier work with von Neumann (Richtmyer, 1957; von Neumann and Richtmyer, 1950).
When Leith expressed an interest in weather, Livermore meteorologist Joseph Knox took him to MIT and introduced him to two of the foremost numerical modelers of their time. Encouraged, Leith set about writing his own general circulation model code for the Livermore Advanced Research Computer. Leith used a stop-action camera to transform graphical printouts of his model results into a crude animated movie—a very unusual form of scientific visualization for that time. Many pioneering climate modelers still remember that six-minute film, which vividly demonstrated that Leith’s numerical model really could simulate atmospheric motion.
When I recorded Leith’s oral history in 1997, he recalled Edward Teller’s fascination with his model, and with the related problem of weather prediction:
I always had to argue with Edward about this matter. He would say, “Either the atmosphere is very stable, in which case it is very predictable, … or it’s unstable, in which case it’s controllable.” Because, he thought, “I can do a little thing and have a big consequence.” Well, the answer of course is that it’s chaotic. You can do a little thing and have a big consequence, but it’s an unpredictable consequence. So I kept trying to explain that to him, and I think I finally … got the message through. But Edward was very enthusiastic about weather control. (Leith, 1997)
Teller was far from alone in his enthusiasm. Military projects on weather and climate control funded up to half of all US research in meteorology during the 1950s (Edwards, 2010; Fleming, 2010).
Though he abandoned his own climate model within a few years, Leith had a considerable influence on climate research. In the 1960s, general circulation modeling became a major new research area, transforming the field of climatology from an observational and statistical science into one dominated by computer simulation. Most of this research took place at civilian laboratories unconnected to nuclear affairs, but some of the national laboratories continued their work on atmospheric transport models, fallout monitoring, and other concerns related to meteorology. Livermore, in particular, continued to support an atmospheric studies group.
In the 1970s, with the restructuring of the national laboratories under the new Energy Research and Development Administration along with concern about damage to the ozone layer by proposed commercial supersonic aircraft, Livermore managed a vigorous program of research under the Climate Impacts Assessment Program. Much of the lab’s research focused on fallout, regional air pollution, acid rain, the possible ozone-depleting effects of nuclear war, and similar questions.
Work went on after the climate assessment ended, in Livermore’s long-lasting High Altitude Pollution Program, which reported to the Federal Aviation Administration (Glantz et al., 1985). Starting in 1977, the reorganized Energy Department mounted the world’s largest single program of carbon dioxide research, with an annual budget of $10 million to $15 million. This placement reflected the historical work of laboratories including not only Livermore, but also Brookhaven and Oak Ridge.
Climatic consequences of nuclear war
The climatic consequences of nuclear war represent another major historical intersection between climate science and nuclear affairs. Concerns emerged early: During the Manhattan Project, Teller speculated that a nuclear explosion might “ignite” the atmosphere, leading to a formal study concluding that it would not (Konopinski et al., 1946). In the 1950s, the US public connected fallout with unusual weather (Hart and Victor, 1993). After the Partial Test Ban Treaty in 1963, these concerns faded, and for the next two decades few people worried about climatic effects.
During that period, the vast Cold War research enterprise devoted to analyzing nuclear weapons effects grew ever larger and more sophisticated. Yet, amazingly, the nuclear damage estimates developed by military researchers took virtually no account of the dust, fire, and smoke effects of nuclear blasts. Instead, in an astonishing case of self-inflicted organizational blindness, researchers focused only on shock waves and fallout. 2 As it happened, the notion of “nuclear winter” emerged not from military studies, but from other quarters altogether.
One was the study of aerosols: dust, sulfuric acid, soot, and other airborne particles. Climatologists had long suspected that large volcanic eruptions cooled the global atmosphere (by reflecting solar radiation back into space), but systematic research into this effect began only in the 1960s. By 1970, climatologist Hubert Lamb had created a “dust veil index” based on estimates of major volcanic eruptions. He and many others used the index to calculate the cooling effects of volcanoes (Lamb, 1970).
Concern with anthropogenic aerosols reached a peak in the early 1970s with proposals to introduce up to 500 supersonic aircraft (the eventual Concorde) into global aviation. Exhaust from those aircraft and the space shuttle, proposed around the same time, would inject substantial amounts of nitrogen oxides, water vapor, sulfuric acid, and silver particles (from the shuttle) into the stratosphere (Baldwin et al., 1976). In response, the US Transportation Department initiated the crash three-year Climate Impact Assessment Program, which has been called “the first major integrated assessment of an environmental issue” (Consortium for International Earth Science Information Network, 1995). Hundreds of scientists were involved in the assessment, which cost an estimated $60 million (Glantz et al., 1985).
A 1971 study found that aerosols posed a greater risk to climate stability than carbon dioxide:
An increase by a factor of 4 in the equilibrium dust concentration in the global atmosphere, which cannot be ruled out as a possibility within the next century, could decrease the mean surface temperature by as much as 3.5°K [sic]. If sustained over a period of several years, such a temperature decrease could be sufficient to trigger an ice age! (Rasool and Schneider, 1971)
Paleontology also contributed to nuclear winter theory. In 1978, Luis Alvarez—a nuclear physicist and an alumnus of the Manhattan Project, where he helped design the Fat Man bomb—and several colleagues discovered a thin iridium layer at the Cretaceous-Tertiary (K-T) boundary, formed about 65 million years ago, at some 30 locations around the world. They hypothesized that the layer’s source was a colossal meteor, which exploded upon impact with the energy of a billion Hiroshima-size nuclear weapons, immolating forests and injecting a gigantic dust cloud into the stratosphere. Comparing this with the 1883 Krakatoa eruption—and noting the radiocarbon fallout studies that showed rapid global dispersal of stratospheric dust—they speculated that the meteor impact plunged Earth into years of darkness. Planetary temperatures plummeted, suppressing most photosynthesis. The great reptiles rapidly starved to extinction, along with many other species (Alvarez et al., 1980).
Two years later, inspired by both the work on volcanoes and the widely reported Alvarez results, atmospheric chemists Paul Crutzen and John Birks published The Atmosphere after a Nuclear War: Twilight at Noon (Crutzen and Birks, 1982). Using a two-dimensional computer model of atmospheric transport—a conceptual ancestor of the models used to track the Fukushima radiation plume—they calculated that a large nuclear exchange would have effects similar to the K-T meteor, igniting not only forests and cities but also oil and gas fields, refineries, and other highly concentrated fuel sources. The resulting smoke and photochemical smog would probably darken the atmosphere for several weeks or longer, they wrote, and photochemical reactions with these pollutants would deplete the ozone layer by some 65 percent at latitudes above 45 degrees. This result was in accordance with prior estimates from a 1975 National Research Council study (National Research Council, 1975).
The remaining history of the nuclear winter debate is better known than these more obscure origins. In 1983, two independent groups, one in the Soviet Union and another in the United States, analyzed the spread of smoke and dust after a major nuclear exchange using simple climate models (Aleksandrov and Stenchikov, 1983; Turco et al., 1983). The two groups reached similar conclusions: Within days, the northern hemisphere’s surface temperature would drop below freezing and would remain there for up to six months. Just as in the K-T extinction, the smoke pall would soon surround the globe, disrupting ecosystems and agricultural production worldwide, with extremely severe consequences for humanity. A scientific debate ensued in which some climate scientists argued that more sophisticated modeling showed somewhat less serious consequences—more like a nuclear autumn than a nuclear winter (Thompson and Schneider, 1986).
Yet that was far from the end of the story. Along with the discovery of the Antarctic ozone hole in 1985, nuclear winter brought the prospect of massive human-caused damage to the planetary atmosphere out of the realm of distant speculation and into the close-at-hand fears of the US public. It played a significant role in the endgame of the Cold War (for a detailed account, see Badash, 2009). Research on nuclear winter stopped in 1990, but some of the principals from the 1980s debates revived it in 2006, using the latest generation of climate models. Their current consensus is that “nuclear winter theory was correct, and that, in fact, the effects would last for many years, much longer than previously thought” (Robock, 2010).
The national laboratories and post-Cold War climate research
The 1987 Montreal Protocol on the Ozone Layer rapidly followed the nuclear arms reduction agreements of 1985 and 1986—which Mikhail Gorbachev (at least in retrospect) attributed in part to his knowledge of nuclear winter theory. These successes seemed to demonstrate that humankind could react sensibly and forcefully to threats to the global atmosphere. They created optimism among atmospheric scientists that carried them forward as they dedicated themselves to averting another form of anthropogenic climate change: greenhouse warming.
Meanwhile, with the Cold War over and research on nuclear weapons in decline, the national laboratories faced a quandary: What would justify their continued existence? Among the labs’ greatest assets were their many powerful supercomputers, their expertise in numerical modeling of fluid dynamics, and their skills in managing very large data sets. Many of the labs used these capabilities to refocus their work on environmental problems, particularly those that could make use of advanced computational techniques.
Climate change fit this profile perfectly. Livermore, in particular, has made especially important contributions to climate change research ever since. In 1988, the year the Intergovernmental Panel on Climate Change was founded, Livermore climate scientist Jerry Potter persuaded climate modeler W. Lawrence Gates to join the lab and organize a large-scale, systematic analysis of climate models. Until then, climate modeling had generally proceeded as a craft affair. Each lab’s computer models were typically one-offs with idiosyncrasies in mathematics, parameterization, and programming. This made the causes of differences in model outputs very difficult to diagnose. Furthermore, the field lacked standard benchmarks. Model results have to be compared with data, but which data? And over which period?
Gates’s Atmospheric Model Intercomparison Project and its several successors established suites of standard model runs (such as runs attempting to reproduce the observed climate of the twentieth century), standard data sets against which model results are compared, standard parameter settings, and other ways of putting all models on a common footing for diagnosis (Gates, 1992; Gates et al., 1999). These climate model intercomparisons have had two major effects on climate change science. First, they have greatly improved understanding of climate models’ strengths and weaknesses. Second, they have helped transform climate change research from a frontier field to a reliable and robust knowledge infrastructure by standardizing (at least in part) the practices of climate modelers (Edwards, 2010). They play a central role in the periodic scientific assessments of the Intergovernmental Panel on Climate Change. The umbrella organization that leads them, the Program on Climate Model Diagnosis and Intercomparison, remains at Livermore where it first began.
The national laboratories are contributing to climate change research in other important ways. Livermore also hosts the Earth System Grid, a federated system for storing, cataloging, and delivering the vast volumes of climate-simulation data currently produced by laboratories around the world. Some climate laboratories, including the National Center for Atmospheric Research, now outsource many of their model runs to supercomputers housed at the national laboratories. As it has since 1982, Oak Ridge continues to run the Carbon Dioxide Information Analysis Center, one of the world’s most important data centers for the study of radiatively active gases (gases that absorb incoming solar radiation or outgoing infrared radiation, affecting the planetary heat balance). Thus, these labs play a fundamental supporting role in creating climate knowledge.
Many of the links that connect this story seem perverse. Without nuclear weapons and fallout, we might know much less than we do about the atmosphere. Without climate models, we would not have understood the full extent of those weapons’ power to annihilate not only human beings, but other species as well. Today, the laboratories built to create the most fearsome arsenal in history are doing what they can to prevent another catastrophe—this one caused not by behemoth governments at war, but by billions of ordinary people living ordinary lives within an energy economy that we must now reinvent.
Footnotes
Acknowledgements
The author thanks Alan Robock, Jerry Potter, and Warren Washington for helpful comments.
Funding
This research received no specific grant from any funding agency in the public, commercial, or not-for-profit sectors.