
Abstract
Housing wealth is the largest component of wealth for a majority of Swedish households. Whereas investments in housing are merely defined by income, the returns on this investment (capital gains) are dependent on local housing market dynamics. Since the 1990s, local housing market dynamics in Swedish cities have been altered by the upswing in levels of socio-spatial inequality. The simultaneous up- and downgrading of neighbourhoods is reflected in house price developments and exacerbates the magnitude of capital gains and losses. This article proposes that the selective redirection of housing pathways that causes an upswing in socio-spatial inequality translates into an uneven distribution of capital gains as well. A sequence analysis of the housing pathways of one Swedish birth cohort (1970–1975), based on population-wide register data (GeoSweden), is used to explain differences in capital gains between different social groups in the period 1995–2010. The results indicate higher capital gains for individuals with higher incomes and lower gains for migrants. When socio-spatial inequality increases, the more resourceful groups can use their economic and cultural capital to navigate through the housing market in a more profitable way.
Introduction
Wealth inequality, as a separate dimension of socio-economic stratification, has recently attracted much scholarly attention (Piketty, 2014). Although housing wealth is the largest component of wealth for the majority of households, only a few studies focus on the mechanisms that shape the accumulation of this form of wealth over the life course (Spilerman, 2000). Country studies only show that housing wealth is generally more equally distributed than financial wealth, but less than social security wealth 1 or income (Appleyard and Rowlingson, 2010). Wind, Lersch and Dewilde (2016) argue that housing wealth inequality among homeowners originates from three drivers: (1) the purchase price; (2) mortgage size and amortisation; and (3) capital gains and losses. A comparison of 17 European countries shows that housing and welfare policies influence to what extent housing wealth increases with social class, but due to its cross-sectional set-up, the role of the drivers of housing wealth inequality remains unclear.
The first two drivers of housing wealth implicate a clear link with the labour market, since high-income groups are likely to buy more expensive homes and have a higher propensity to amortise their mortgage. Capital gains and losses, on the other hand, are affected by housing market dynamics that distribute them unequally through time and space. Limited British and Australian evidence suggests that capital gains are more common among high-income groups (Burbidge, 1998; Hamnett, 1999). They ‘tend to move more frequently, and had moved upmarket in the 1980s’, with higher returns on their investments as a consequence (Hamnett, 1999: 101). Recently, Newman and Holupka (2016) found that capital losses in the US during the 2000s have been much more severe for blacks and lower-class individuals than for the middle-class and white population. However, research evidence on how the housing market rather than the labour market function as a mechanism behind wealth inequality is scarce. In this article we contribute to the existing literature by evaluating the selectivity of capital gains in Sweden during a period of increasing socio-economic segregation.
In times of increasing socio-spatial inequality, capital gains and losses can be expected to be more pronounced (see Stein, 1995 for an economic analysis of down-payment constraints). The simultaneous up- and downgrading processes that constituate increasing socio-spatial inequality are matched by upward and downward price mobility in these neighbourhoods (Ley et al., 2002). In this article, we propose housing pathways that coincide with gentrification and downgrading processes as a theoretical bridge between increasing levels of socio-spatial inequality and increasing levels of wealth inequality. Housing pathways show how residential mobility alters the social balance in neighbourhoods, and how the profitability of residential moves is affected by the in/out-migration of others (causing gentrification/downgrading). Like in most Western countries, redirected housing pathways have produced more polarised cities in the shift from an industrial to a post-industrial society as a result of globalisation and welfare state restructuring (Sassen, 1991; Wacquant, 2007). In Sweden, this process is speeded up due to far-reaching liberalisations in the sphere of housing policy and housing finance since the 1990s (Andersson and Kährik, 2015). In addition, between 1995 and 2010, house prices increased by 243% in the country as a whole, and more than tripled in Stockholm 2 (Ekonomifakta, 2016). This makes Sweden a particularly suitable case to capture the consequences of the trend towards financialisation and marketisation that is prevalent all across Europe.
In the current article, we analyse the distribution of capital gains across income, educational and migrant groups. We explain differences regarding capital gains based on the housing pathways of these groups. Using longitudinal register data covering the entire Swedish population, we summarise the variation in housing pathways of a birth cohort born between 1970 and 1975, living in large and medium-sized cities, during the period between 1995 and 2010. We make a threefold contribution to the debate on the causes and consequences of wealth inequality. First, we propose housing pathways as a theoretical bridge between the upswing in socio-spatial inequality and the surge in wealth inequality. Second, we provide evidence on capital gains and losses in an institutional context that has not been studied yet. Sweden has a stronger tradition of social policy and spatial planning than the Anglo-Saxon countries, and has experienced a different trajectory of deregulation. Third, our results are based on unique register data with wide coverage instead of small-scale surveys or aggregate statistics that have previously been used to shed light on capital gains and losses.
Housing pathways: Linking socio-spatial inequality and capital gains
Between 1995 and 2010, socio-spatial inequality in Swedish urban regions increased. 3 This development is part of a larger trend that saw a major upswing during the severe economic recession that hit Sweden in the early 1990s (Andersson and Hedman, 2016). Areas that were worst hit by the economic crisis and subsequently downgraded were to a large extent already poor before, whilst areas that suffered less tended to be better off previously (Andersson, 1998). Hedin et al. (2012) suggest that this trend is reinforced by a neo-liberal turn in Swedish housing policy. Since the 1990s, housing subsidies have been reduced and have shifted from the supply to the demand side, while public housing has been sold and housing finance has been deregulated (Holmqvist and Turner, 2014). This has reshuffled, concentrated and enlarged the capital flow through the built environment.
The upswing of socio-spatial inequality took place all across the western world, although its timing and drivers might differ in Sweden (Tammaru et al., 2015). Globalisation, and the consequent polarisation/professionalisation of the labour market, are mentioned as drivers of socio-spatial inequality (Friedmann, 1986; Sassen, 1991). Moreover, the turn from an industrial to a post-industrial economy has increased the importance of face-to-face encounters and centrality, which has boosted the demand for housing at central locations (Lees et al., 2013; Ley et al., 2002). Furthermore, the liberalisation of (housing) finance has resulted in larger liquidity that could be invested in neighbourhoods with low house prices in close proximity to neighbourhoods with high prices (Guerrieri et al., 2013; Smith, 1996). The parallel up- and downgrading of neighbourhoods and increasing socio-spatial inequality are the result of either (1) increasing levels of income inequality enlarging the existing differences between neighbourhoods or (2) selective migration patterns of social groups. In the case of Sweden, it is likely to be a combination of both. The magnitude of capital gains and losses is dependent on the housing pathway: pathways through upgrading neighbourhoods are expected to be more profitable. In the remainder, we focus on the selectivity of certain housing pathways, their contribution to the increasing levels of socio-spatial inequality in Sweden and the implication for capital gains and losses.
Income polarisation as a driver of neighbourhood change
Residential mobility often has a reproductive role in relation to the distribution of social classes over urban space. Rather than changing existing socio-spatial inequalities, mobility patterns stabilise existing patterns over time. On an individual level, however, preferences for housing tenures, housing types or neighbourhood types might vary across the life course. Nevertheless, most residential moves take place between areas with a comparable social status and ethnic composition due to structural constrains (other locations are unaffordable) and cognitive constrains (other locations are unknown) (Sharkey, 2012). Although income increases are found to be associated with moves to more expensive housing in the US, this type of mobility confirms the social status of both the neighbourhood of departure and the neighbourhood of arrival (Morrow-Jones and Wenning, 2005).
An increase in income inequality results in an upswing in socio-spatial inequality if no residential moves occur, or if moves take place between areas with a comparable social status. Tammaru and colleagues (2015) argue that a decrease of income stability among the lower income strata and a decline in their relative position as a consequence of welfare state restructuring, labour market deregulations and the shift towards a globalised post-industrial economy result in negative consequences for neighbourhoods with an over-representation of these groups. At the same time, the strengthened position of the high-skilled service workers, followed by a subsequent increase in their bargaining power on the housing market, is a mechanism behind upgrading in neighbourhoods where they are overrepresented.
As a result of the deregulation of production markets, abandonment of state monopolies, financial deregulation and a general cutback in welfare (Bergh and Erlingsson, 2009), income inequality has risen faster in Sweden than in the rest of Europe (OECD, 2014). On the basis of evidence from Malmö between 1991 and 2010, Scarpa (2014) concludes that neighbourhoods with an overrepresentation of low-income groups showed signs of downgrading as a result of the worsened income position of their inhabitants (especially during periods of crisis (Andersson and Hedman, 2016).
Selective mobility as a driver of upgrading
The upgrading of neighbourhoods is often portrayed as the result of the selective in-migration of young and highly-educated residents, under the denominator of gentrification. The term describes ‘the transformation of a working-class or vacant area of the central city into middle-class residential and/or commercial use’ (Lees et al., 2013: xv). Whereas individuals with low economic but high cultural capital renovate run-down central apartments in the first wave of gentrification, the process becomes more speculative in later waves (Lees et al., 2013). Financial accounts of gentrification stress that the process is fuelled by the existence of ‘rent gaps’. Rent gaps arise in neighbourhoods characterised by an under-investment in housing, but located in close proximity to locations with high house prices (Smith, 1996).
Swedish evidence reveals that gentrification processes in Sweden are fuelled by changes in the housing regime. Since the 1990s, public housing companies have privatised part of their stock (Andersson and Turner, 2014). Housing pathways that contribute to gentrification often flow through properties that have been converted from regulated public rental housing to tenant-owned cooperative housing. 4 Millard-Ball (2002) points out that residential mobility in converted properties in Stockholm is much higher than in other segments of the housing market, due to the initial discount and the increasing popularity of these centrally-located properties. It has been argued that tenure conversion has speeded up gentrification due to an influx of younger, highly-educated and more prosperous households in these properties (Millard-Ball, 2002).
A more market-based sorting of individuals over urban space is realised through the implementation of neo-liberal spatial planning practices. Developers are encouraged to build ‘successful places’ where human capital can be housed. As a continuation of the former top-down, social-democratic modernist mode of spatial planning, local governments have invested in the creation of these ‘pockets of richness’ (Baeten, 2012). The increasing role of the market in the sorting process has meant that the housing pathways of the poor are more and more directed towards the (downgrading) outskirts, whereas the housing pathways of the middle class concentrate in the (upgrading) central areas.
Selective mobility as a driver of downgrading
Neighbourhood downgrading is generally associated with the outmigration of middle-class residents to avoid the negative externalities (e.g. criminality, low-quality public amenities and schools, stigmatisation etc.) of being located in an area that is increasingly home to a low-SES or ethnic minority underclass, although the relative importance of different factors differs between countries and contexts (Wacquant, 2007; Wilson, 1987). In Sweden, the most distressed neighbourhoods are increasingly also characterised by a high share of non-western immigrants (Andersson and Hedman, 2016). There is also evidence showing that immigrants have a higher risk of remaining in these types of neighbourhoods (Van Ham and Manley, 2015). Ethnically selective housing pathways can to some extent be explained by differences in acquisition of different tenure forms. Although factors that are generally associated with moves into homeownership (marriage, child birth) are more present among the immigrant population (mainly of Finnish, Yugoslavian, Iraqi and Somali decent), they have a smaller chance than the native population to end up in homeownership, and if they do, they enter this tenure later in the life course due to a lack of financial resources (Abramsson et al., 2002; Magnusson Turner and Hedman, 2014). When they move into homeownership, they are also more likely to remain in or near immigrant-dense neighbourhoods where house prices stagnate compared to majority white neighbourhoods. Financial accounts of downgrading stress that investments are gradually drawn away from such neighbourhoods when the housing stock ages and the affluent population moves out (Aalbers, 2011).
Housing pathways and capital gains
In the period between 1995 and 2010, socio-spatial inequality in Sweden increased, partly due to selective migration processes. Conventional gentrification theories stress the economic possibility of acting upon cultural preferences regarding housing (Lees et al., 2013), resulting in a spatial clustering of highly-educated high-income households. Others argue that new waves of gentrification are triggered by the rent-seeking behaviour of starters with high cultural capital and knowledge of the local housing market (Hochstenbach and Boterman, 2015). Conversely, the lack of economic capital prevents low-income households to move out of disadvantaged areas, making them ‘stuck in place’ (Sharkey, 2012). Housing pathways cover (1) moves between neighbourhood types and housing tenures, and (2) in situ upgrading and downgrading processes within the neighbourhood of residence. The upswing in socio-spatial inequality can be expected to be caused by a higher number of highly-educated, high-income households moving into neighbourhoods with a higher social status at the outset, which in turn are more likely to be subject to in situ upgrading processes. Since house prices generally reflect up- and downgrading processes (see Freeman, 2006 for a discussion on gentrification, house prices and displacement), capital gains and losses are expected to be unevenly distributed among social groups.
To sum up, individuals with an immigrant background or a low socio-economic status are increasingly ‘trapped’ in rental housing where no capital gains are made, or in ownership in downgrading neighbourhoods. Natives and individuals with high socio-economic status are more likely to follow housing pathways characterised by moves into homeownership in upgrading neighbourhoods. Hence, the latter groups are likely to represent the ‘winners’ on the housing market in terms of financial profit from their housing consumption. Based on this conclusion, we formulate two hypotheses:
Hypothesis 1: Capital gains on the Swedish housing market between 1995 and 2010 are unevenly distributed towards native, higher-income and higher-educated individuals.
Hypothesis 2: The uneven distribution of capital gains across social groups can be explained by differences in their housing pathways regarding tenure, neighbourhood composition at the moment of in-migration and the development of the neighbourhood during the period of residence.
Data and method
Data and sample
Analyses are based on register data covering the entire Swedish population and the properties they have lived in between 1995 and 2010 (GeoSweden). The longitudinal annual data allows us to follow people’s occupational career, family life course and housing pathway through time. The population under observation comprises individuals born between 1970 and 1975, who resided with their parents or in rental housing in 1995 and resided ever since in the three metropolitan areas (Stockholm, Gothenburg, Malmö) or in the 10 next-largest cities (Uppsala, Västerås, Örebro, Linköping, Helsingborg, Jönköping, Norrköping, Lund, Umeå, Gävle). Per household, only one individual is selected. This cohort is the oldest of which we can follow the accumulation of housing wealth from the ‘beginning’. Our focus is on the larger cities, since these are the main arena of processes of gentrification and downgrading. In total, our sample consists of c. 70,000 individuals.
Variables
The magnitude of capital gains and losses on the housing market is the dependent variable of our analysis. First, we calculate the magnitude of capital gains and losses for each spell in homeownership or cooperative housing. This is the difference between the house value at the moment of purchase and the house value at the moment of sale (or: the value in 2010), expressed as a percentage of the housing value at the beginning of the spell. For tenant-owned cooperatives, for which we have no data on individual apartments, capital gains are based on the value changes of the real estate as a whole. It should be noted that values are based on taxation values, rather than purchase prices. Taxation values are based on transaction prices for similar dwellings in the surroundings, and updated on a bi-/tri-annual basis. We expect to capture the longer-term value development of the dwelling since the methodology of calculating taxation values is unchanged through the years. Since any bias is directed downward (due to delayed tax evaluations), our variable capital gains should be regarded as a conservative estimate. The total capital gain over the period between 1995 and 2010 is the sum of the capital gains realised in different spells, weighted by the spell length.
Income, education and migrant status are used to investigate the uneven distribution of capital gains. Income is measured as the log of the average post-tax, post-transfer revenues between 2008 and 2010 (to filter out short-term fluctuations). Although one may argue that the initial income is more important since it better represents people’s ability to buy into the ownership segment, we argue that the income at the end of the observation period better represents social status for this cohort, given their young age at the start of the observation period. The educational level is also measured at the end of the observation period and is classified in four categories, based on the program duration: less than 12 years, 12 years, 13–14 years and 12 years and more. We consider someone a migrant when this person is born outside Sweden.
We control for individual characteristics and events that occur during the life course. First, we control for different partnering trajectories, because income pooling heavily impacts upon the possibilities one has to realise housing preferences. We distinguish between stable cohabitation, separation-single and separation-repartnered trajectories. Note that we consider someone as cohabiting when married or registered at the same address with children. 5 Second, we control for moves between areas with a different degree of urbanity in Sweden (e.g. from a large to a medium-sized city, or the other way around). The exposure to housing market fluctuations is measured by (1) the year of moving into homeownership or cooperative housing, and (2) the number of spells in these tenures. Finally, we control for the participation in tenure conversion from public housing into cooperative housing, gender and the presence of children in the household.
Housing pathways
Five complementary housing pathways are proposed as mechanisms explaining the distribution of capital gains across social groups. One pathway describes the tenure status of each spell (homeownership, cooperative or rental housing). Two pathways describe the immigrant composition of the neighbourhood at the moment of in-migration and the in situ changes in the share of immigrants during the spell. Moreover, two pathways describe the educational composition of the neighbourhood at the moment of in-migration and the in situ changes of the share of individuals with a university degree during the spell. The neighbourhood composition is measured by the percentage of migrants (low, medium, high) and the percentage of residents with a university degree (low, medium, high). The boundaries between the three groups are defined as +/–0.5SD from the mean in the period under observation. As for the in situ changes, the mean is based on the first three spells in cooperative housing or homeownership. Neighbourhood information is calculated on the SAMS (Small Area Market Statistics) level, containing between 1000 (smaller cities) and 2000 (Stockholm) residents. Note that we only calculate neighbourhood characteristics for spells in homeownership and tenant cooperatives, since residence in rental housing does not produce any capital gains.
We use second generation sequence analysis to construct clusters of housing pathways. These clusters are based on a dissimilarity index, following from the (predefined) ‘costs’ of deleting/inserting or replacing one spell. These pathways are better suited than event-history models to capture the longitudinal dynamic in the life course (Aisenbrey and Fasang, 2010). In housing studies, they are used to map migration chains (Stovel and Bolan, 2004) and the realisation of housing preferences over time (Coulter et al., 2016).
The modal sequence plots in Figure 1 show a graphical representation of the ideal-typical pathways in every clustering. The pathways are sorted from common (high N) to uncommon (low N). In every clustering, the pathways differ from each other in terms of timing of moving into tenure forms or neighbourhood types. Figure 1a shows that the most common tenure pathway is characterised by a long period in rental housing before moving into homeownership. Switches from cooperative housing to homeownership are less common, whereas moves out of homeownership constitute the least followed trajectories. Figure 1b shows that moves into neighbourhoods with a low or medium share of residents with an immigrant background are far more common than those into a neighbourhood with a high share of immigrants, due to an overrepresentation of immigrants in rental housing and a high degree of spatial concentration of tenures in Sweden (Grundström and Molina, 2016). Moreover, Figure 1c shows that it is uncommon that the share of immigrants increases in later stages of the pathway. The most common pathways display a stable or a decreasing share of migrants in the neighbourhood (Early stable, Mid decreasing). Figure 1d shows that moves into neighbourhoods with a low share of higher-educated residents are less common among homeowners and cooperative dwellers. This is not surprising given the higher educational level of owner-occupiers in general. The most common clusters (Mid high, Early high) are characterised by a short or medium spell in rental, followed by a move into a neighbourhood with a high level of education (15,000 and 10,000 individuals). As with immigration, we find that the most common trajectory regarding in situ changes is a stable pattern of modest variation (Figure 1e). Not only does the level of education tend to be high at the moment of in-migration, but many individuals also follow pathways where the level of education in the neighbourhood is increasing.
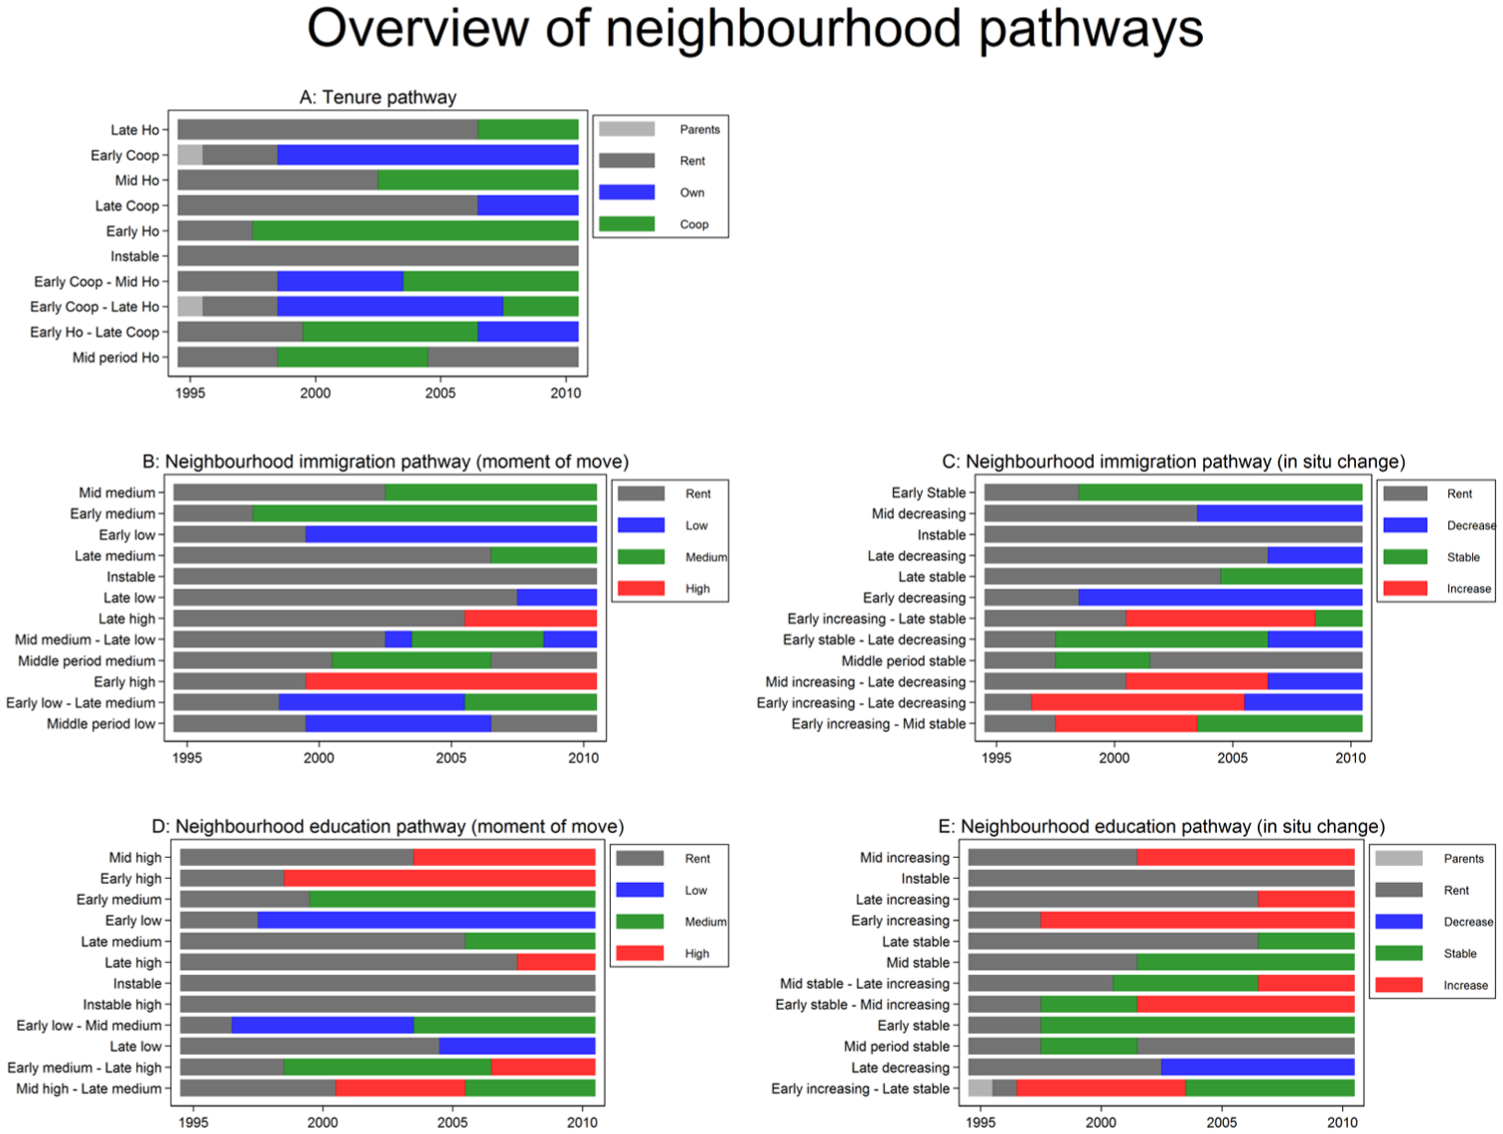
Modal sequence plots of five types of housing pathway clusters, sorted from common (high N) to uncommon (low N).
Methods
The social selectivity of capital gains and losses is analysed through OLS-regression models run step-wise. The initial model only contains the three variables that capture social selectivity (income, education, migrant status). We then add: (i) control variables related to personal characteristics and life course events; (ii) characteristics of the housing tenure pathway, namely the length of residence in homeownership and cooperative housing, and the total number of spells; (iii) the average percentage of residents with a university degree and migrants at the moment of in-migration across all spells, and the average development of the share of migrants and residents with a university degree across all spells. In this way, we capture the effect of both residential choices and in situ changes. We proceed with a descriptive analysis of the social profile of the five housing pathways in terms of income, education and migrant status. Whereas the regression analysis shows which types of residential choices and in situ developments are profitable, the descriptive analysis of housing pathways shows how common different housing pathways, consisting of more and less profitable elements, are among the social groups. Furthermore, it contextualises the associations found in the regression analysis by identifying the ‘winners’ and ‘losers’ in terms of housing wealth.
Results
Selective capital gains and losses
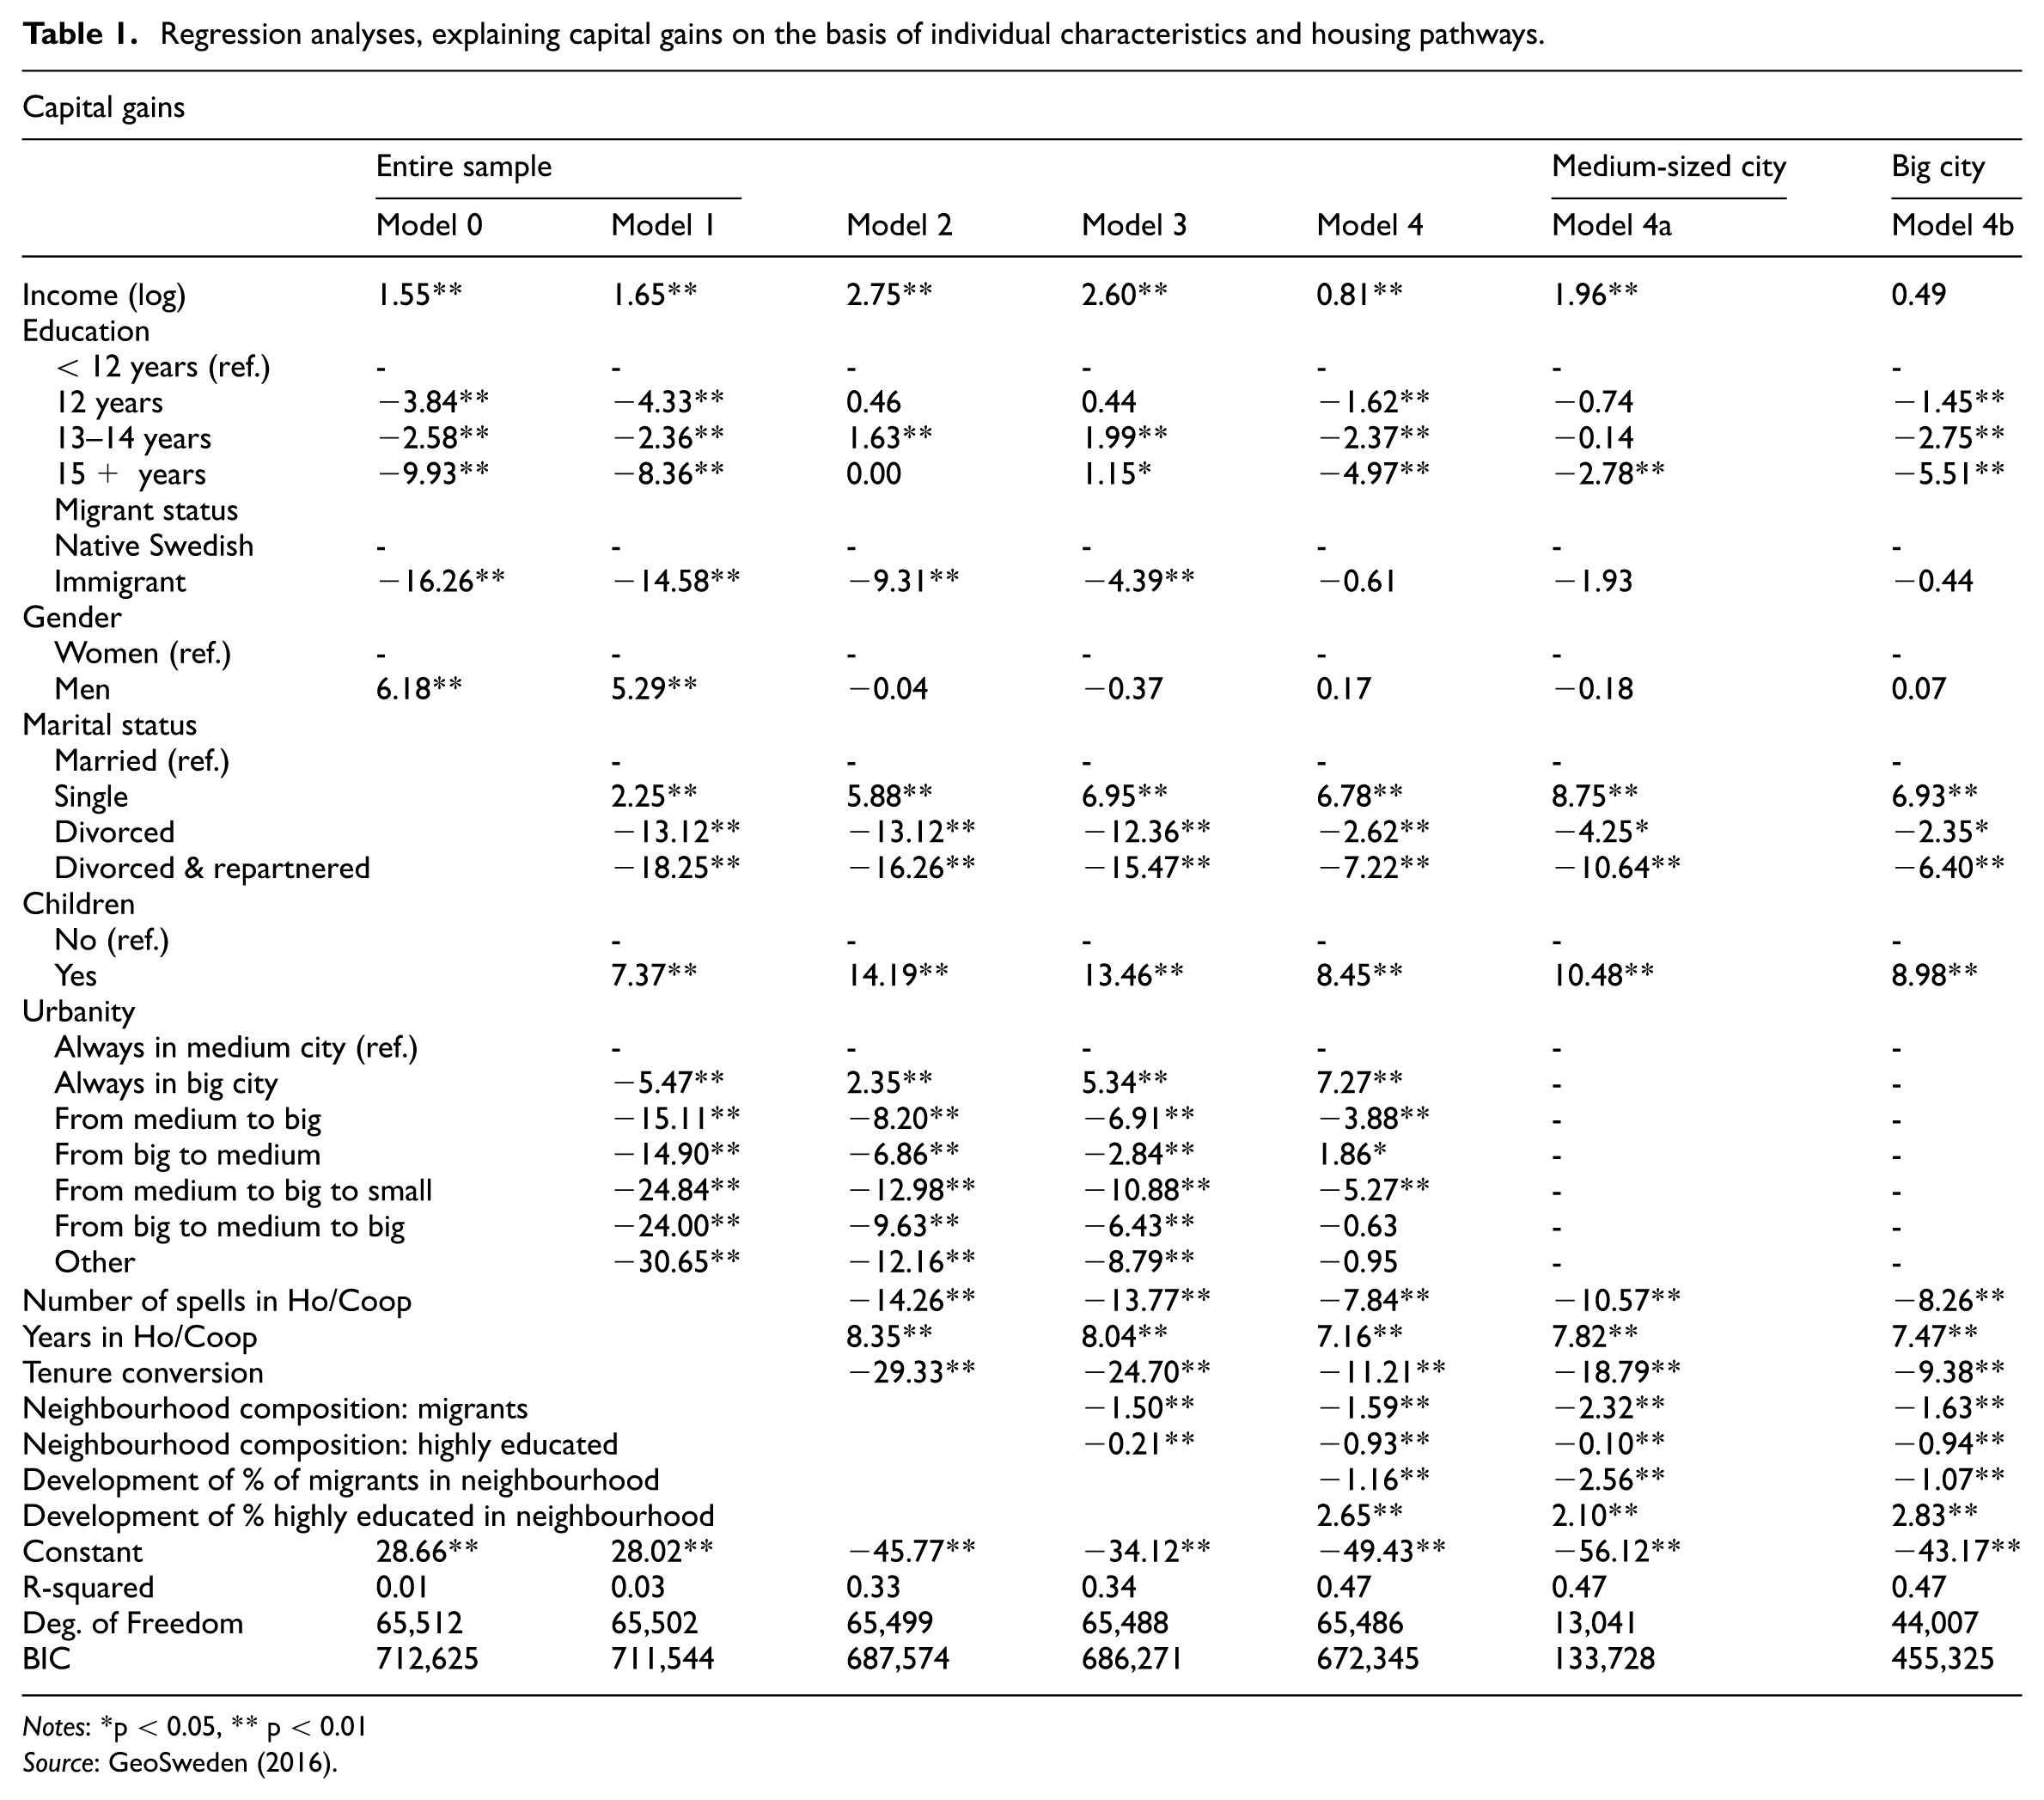
In Model 0, Table 1, we investigate the association between four individual level characteristics (income level, educational level, migrant status and gender) and the magnitude of capital gains and losses between 1995 and 2010. First, we find that post-tax, post-transfer income is positively associated with capital gains, as is being male. Education, however, is negatively associated with the magnitude of capital gains. Being a migrant is also negatively related. In Model 1, control variables are included, describing the household composition and partnering history. Model 1 shows that the family life course has an effect on capital gains. Compared to first-time married couples, being single is associated with higher capital gains, whereas being divorced (and re-partnered) and having children is associated with lower capital gains. We suggest that the positive effect of singlehood is due to an overrepresentation in small (cooperative) apartments in gentrifying neighbourhoods. Moreover, compared to residing in medium-sized cities, residence in larger cities, as well as moves between cities of different sizes, has a negative effect on capital gains. Model 1 predicts 21% capital gains for a low-income, lower-educated male migrant who is married, living with children in a large city, against 39% capital gains for a high-income, highly-educated native Swede (male, married, living with children in a large city). In Model 2, we include the length of residence in homeownership or cooperative housing, the number of residential moves and whether someone participated in tenure conversion. The coefficient for the length of residence in homeownership or cooperative housing is strongly positive. The model predicts that each additional year in homeownership or cooperative housing is associated with an eight percentage point growth of capital gains. Depending on the socio-economic status of the individual, the model predicts between 20 and 40% capital losses after one year, but 70 to 90% capital gains after 15 years’ continuous residence in homeownership. The inclusion of this variable drastically improves the model fit (now 33% explained variance) and results in a change of the effect of education, where the strong negative coefficient for a high level of education turns to zero. This means that the former negative effect of education and residence in a larger city has been due to shorter exposure to one of the ownership tenures. We argue that highly-educated individuals (in the larger cities) have a prolonged educational career and therefore postpone moves into homeownership or cooperative housing. Furthermore, those living in larger cities enter homeownership or cooperative housing at a later moment in their life course due to an overrepresentation of temporary residence and a tight housing market. A positive association between residence in one of the larger cities and capital gains is unsurprising given the large surge in house prices in Sweden’s metropolitan areas. Also, the gender effect disappears after including control variables. The number of residential moves is negatively associated with capital gains.
Regression analyses, explaining capital gains on the basis of individual characteristics and housing pathways.
Notes: *p < 0.05, ** p < 0.01
Source: GeoSweden (2016).
In Model 3, information on residential choice is added. The average share of migrants in the neighbourhoods one has been living in between 1995 and 2010, at the moment of in-migration, is negatively associated with capital gains, as is the average share of highly-educated residents. The inclusion of these variables slightly includes the model fit. We conclude that the length of residence in homeownership better explains capital gains than the type of neighbourhood one moves into.
Model 4 shows the effect of developments in the neighbourhood composition during the period of residence. An increase in the share of migrants is associated with lower capital gains, whereas an increase in the share of highly-educated residents is associated with higher capital gains. If the share of migrants increases by one percentage point, capital gains will decrease by 1.2 percentage points, whereas a one percentage point increase in highly-educated residents increases capital gains by 2.7 percentage points. After including neighbourhood development, the effect of being a migrant disappears, the effect of divorce experience becomes much lower and the effect of a higher education turns negative. The results indicate that migrants and divorcees are overrepresented in neighbourhoods with an increasing share of migrants and/or a decreasing share of highly-educated people. Higher-educated individuals are, on the other hand, overrepresented in neighbourhoods with an increasing share of highly-educated residents. Between 1996 and 2010, a low-income, low-educated, male migrant living in Stockholm (married, with children) lost more than half his housing wealth according to predictions by the regression model, whereas a corresponding individual who has a high income, is highly-educated and a native Swede almost doubled his housing wealth.
The last two models compare the results for a sample of individuals who during the entire period 1995–2010 resided in the three large cities with those who have resided in the medium-sized cities. The non-significant coefficient for income for inhabitants in the large cities together with their stronger (negative) coefficients for education indicate that the role of neighbourhood change is more important in explaining capital gains in the larger cities due to higher degrees of socio-spatial inequality.
Earlier in this article, we presented two hypotheses. Hypothesis 1 stated that capital gains are unevenly distributed towards native, higher-income and higher-educated individuals. Hypothesis 2 stated that the uneven distribution of capital gains is the outcome of housing pathways regarding tenure, neighbourhood composition and neighbourhood changes. Our results confirm hypothesis 1 as far as income and ethnicity are concerned, whereas education is negatively correlated with capital gains unless length of residence in the ownership segment is controlled for. We also find confirmation for hypothesis 2. The length of residence in homeownership, and changes in the neighbourhood composition regarding the share of migrants and highly-educated individuals, in particular explain why capital gains are distributed unevenly. Especially in the large cities, where a fiercer upswing of socio-spatial inequality has occurred, capital gains are more unevenly distributed towards higher-income groups and native Swedes.
Housing pathways and capital gains
Table 2 shows descriptive statistics regarding the social selectivity and profitability of different pathways in each cluster. Whereas the regression analysis in Table 1 shows the impact of several basic features of the housing career and the overall effect of residential moves and neighbourhood developments on capital gains, the descriptive analyses in Table 2 allow us to map the consequences of more complex – and realistic – sets of housing pathways. As for the tenure pathway (Table 2a), the most common pathway (‘Late Ho’) is among the least profitable due to the short exposure to homeownership, and is followed by a rather diverse group in terms of income, education and migration status. In line with the results of the regression analysis in Table 1, we conclude that pathways characterised by a longer exposure to homeownership or cooperative housing are more profitable due to the constantly rising house prices. Higher-educated individuals are overrepresented in three pathways characterised by early moves into cooperative housing (‘Early Coop’, ‘Early Coop – Mid Ho’, ‘Early Coop – Late Ho’). We expect that they moved into this urban tenure of multi-family housing during their studies or right afterwards, using their moderate early-career incomes to buy a share in a cooperative. Those who moved into (generally more suburban) homeownership later on fared less well in terms of capital gains. This is not surprising since central areas experienced more rapid price increases than peripheral locations between 1995 and 2010. However, all three pathways belong to the top five most profitable pathways in this clustering (capital gains between 39% and 62%). Low-income earners are overrepresented in pathways characterised by moves out of homeownership before the end of the observation period (the ‘Instable’ and ‘Mid period Ho’ pathways). It seems that they fall out of homeownership due to their more precarious economic position. Especially the ‘Instable’ pathway is unprofitable (3% capital gains). Two pathways stick out with a high percentage of migrants: ‘Instable’ and ‘Late Coop’. Both pathways comprise a short exposure to the two ownership tenures, which strongly reduces capital gains.
Descriptive statistics on the selectivity and profitability of five types of housing pathway clusters in terms of capital gains and losses.
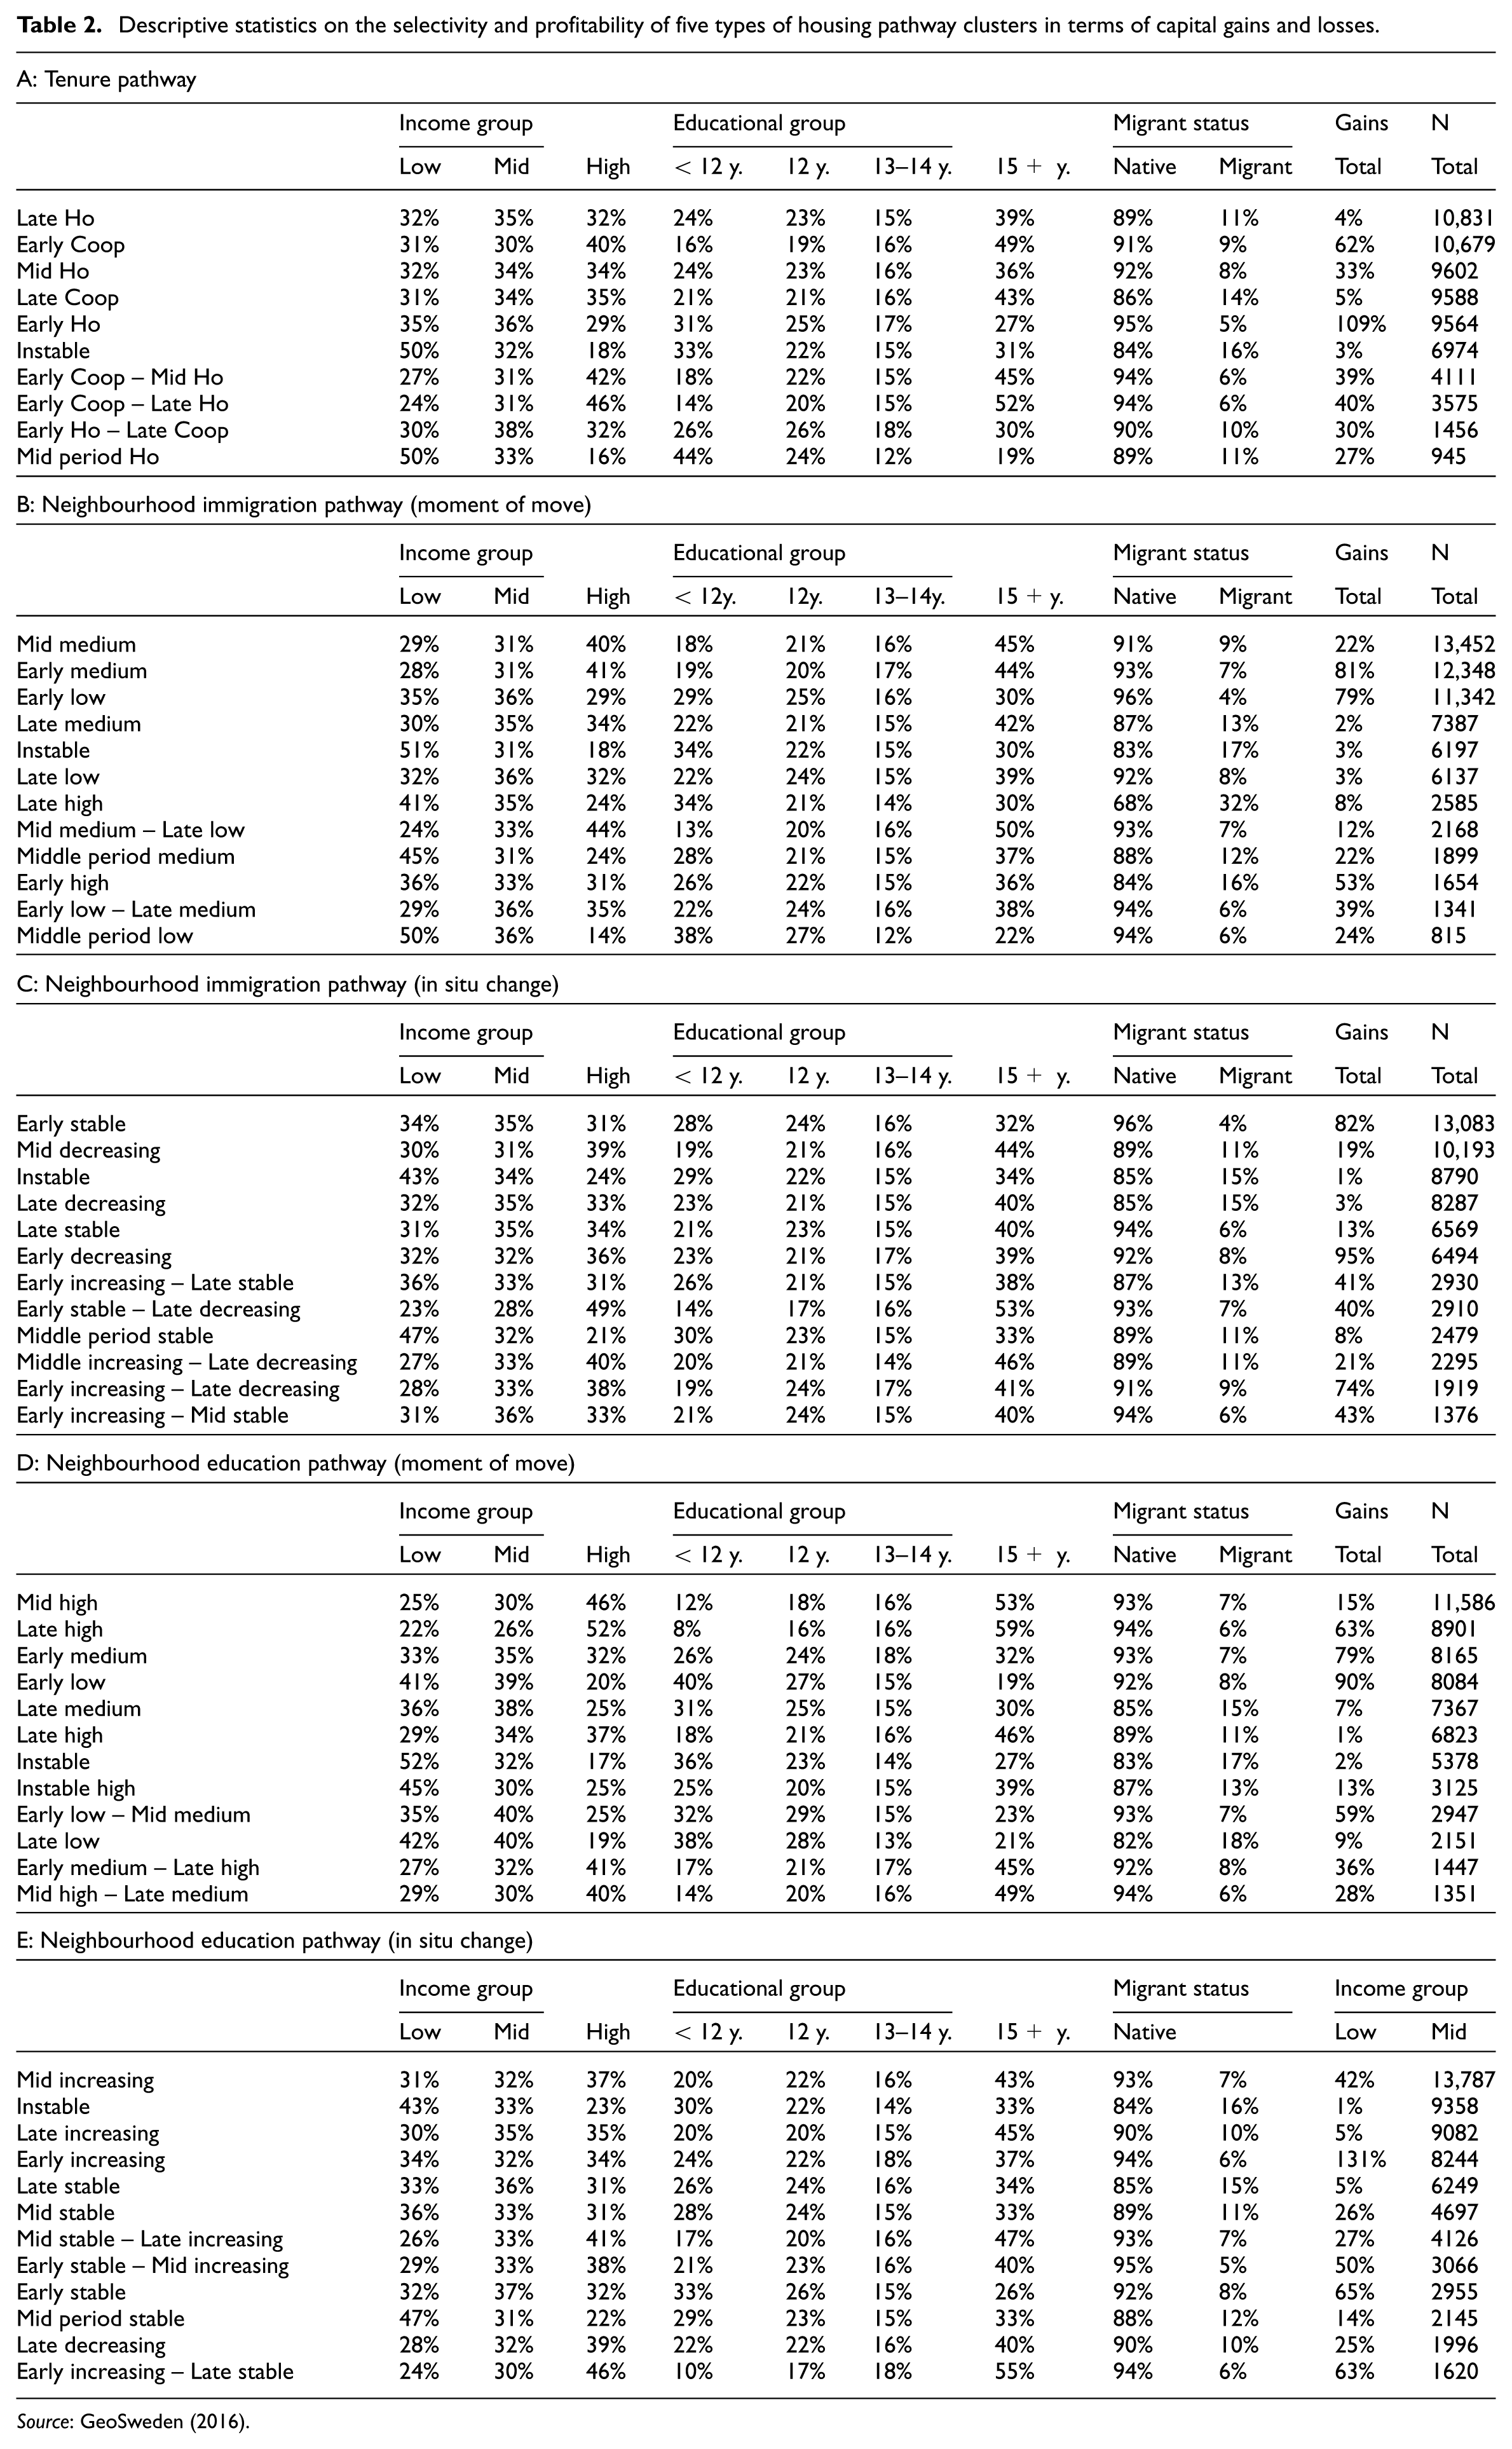
Source: GeoSweden (2016).
As for the pathways related to immigrant composition at the moment of residential mobility, the most common pathways, with about 15,000 individuals in each, are ‘Mid medium’, i.e. remaining in rental for a short spell and then moving into a neighbourhood with a medium share of immigrants (some also start in a neighbourhood with a high share and then move on into medium), and ‘Early medium’, which is a similar pattern but with an earlier move into neighbourhoods with a medium-level share (see Table 2b). Both pathways are characterised by high shares of high-income earners (40% and 41%) and highly-educated people (45% and 44%). Capital gains are much higher for the ‘Early medium’ than for the ‘Mid Medium’ cluster, due to a later move into homeownership or cooperative housing in the latter case. As could be expected on the basis of studies on the high degree of ethnic segregation in the Swedish context (Grundström and Molina, 2016), migrants move disproportionately often into neighbourhoods with a high concentration of migrants (the ‘Late high’ and ‘Early high’ pathways). These clusters are also characterised by a slightly lower share of high income earners and highly-educated people, but it should be noted that these shares are still high. Almost a third of the individuals following the ‘late high’ pathway’ have 15 years of schooling or more. This number is equivalent to the ‘early low’ pathway cluster, with the fewest migrants. If we compare housing pathways in which an early move into homeownership is accompanied by a move into a neighbourhood with a low or a high share of migrants, it is remarkable that the move into an immigrant-dense neighbourhood results in lower capital gains (53% versus 79%).
Regarding in situ changes in terms of the share of migrants (Table 2c), we find that the most common cluster is one in which individuals move into a neighbourhood with a certain share of migrants early on, whereas this share remains relatively constant during the time of residence (‘Early stable’). This is not surprising, given the stable development in ethnic segregation over time and the generally low and stable share in ownerships areas (Hedman and Andersson, 2015). With capital gains of 82%, this is the second most profitable pathway in the clustering. The most profitable housing pathway is one in which individuals move into neighbourhoods with a declining share of migrants at an early moment in the life course (‘Early decreasing’). Comparing the ‘Early stable’ pathway with the ‘Early decreasing’ pathway, the latter is associated with higher capital gains (95%) than the previous (82%). The more profitable pathway cluster contains a slightly higher share of immigrants, but a higher share of highly-educated residents. We expect this to be the profile of gentrification neighbourhoods, in which staying put can be a profitable option for the previous majority group (migrants, potentially higher-educated or medium-to-high income) when gentrifiers move in (highly-educated individuals). Four of the ideal typical pathways start with a spell in a neighbourhood that displays an increasing share of migrants, but none ends in such a spell. This is a sign that individuals tend to move away from these kinds of surroundings, and of a further concentration of immigrants in immigrant-dense rental neighbourhoods.
It could be expected, given the generally higher level of education in the ownership segment compared to rentals, that most individuals belong to clusters where the level of education in the neighbourhood is high. This is also what we find: the two most common clusters, ‘Mid high’ and ‘Late high’ (with 11,000 and 9000 individuals respectively) are characterised by a short or medium spell in rental, followed by a move into a neighbourhood with a high level of education (Table 2d). The individual post-transfer, post-tax income in the period 2008–2010 seems to be strongly associated with the neighbourhood income at the moment of in-migration. High-income earners are overrepresented in all the pathways with at least one spell in a neighbourhood characterised with a high share of highly-educated residents. Conversely, migrants are overrepresented in the ‘Late low’, ‘Late medium’ and ‘Instable’ clusters. However, large capital gains are not only realised by housing pathways through neighbourhoods with a relatively large share of highly-educated residents. The largest capital gains are found in the ‘Early medium’ pathway (79%), followed by the ‘Late high’ (63%) and the ‘Early low – Mid medium’ pathway (59%). The larger share of high-income earners in the ‘Early medium’ compared to the ‘Late medium’ pathway suggests that this might be due to in situ changes.
Looking closer at in situ changes (Table 2e), we find that high-income earners are overrepresented in nearly all clusters characterised by at least one spell in a neighbourhood with an increasing share of residents with a high educational level, and in the only cluster characterised by one or more spells in a neighbourhood with a decreasing share of residents with a high educational level (‘Late decreasing’). By far the largest capital gains can be found in the ‘Early increasing’ cluster (131%), characterised by an early move into a neighbourhood with an increasing share of highly-educated inhabitants during the period of residence. None of the income or educational groups is overrepresented in this cluster. This might be the result of upgrading processes in which a formerly majority working-class neighbourhood becomes mixed in terms of income. The share of migrants following this housing pathway is low. The least profitable housing pathways comprise longer spells in rental housing and/or a middle spell in a neighbourhood with a stable share of highly-educated residents. Lower-income groups seem to be slightly overrepresented in these pathways.
Altogether, the selectivity of capital gains on the housing market can be largely explained by the housing pathways people follow (see Table 2). However, the most profitable housing pathways (an early increasing share of highly-educated residents: 131%; an early decreasing share of immigrants: 95%) are mixed in terms of income and education. Both residents with a lower social status who stay put, and newcomers with a higher social status, profit from the upgrading process. Other pathways that are associated with relatively high capital gains consist of moves into neighbourhoods with low shares of migrants and high shares of highly-educated people, and are selective to higher income and educational groups. Moreover, capital gains among migrants and low-income earners are limited due to their later moves into homeownership or cooperative housing. Early moves into cooperative housing have contributed to larger capital gains among higher-educated individuals.
Conclusion
Local housing market dynamics lift up house prices in some periods and in some neighbourhoods, whereas they lower them in others. This means that moving into the right/wrong area at the right/wrong moment in time can generate windfall profits/losses for individual homeowners. However, in the academic debate on housing wealth inequality, capital gains and losses are largely overlooked (exceptions include Hamnett, 1999, and Newman and Holupka, 2016). Instead, the accumulation of housing wealth is implicitly viewed as a function of income, determining the initial purchase price of the dwelling, the initial size of the mortgage and the mortgage amortisation. In this line of reasoning, the increase in income inequality in Sweden (and across Europe; Alderson et al., 2005) is the main cause behind increasing levels of housing wealth inequality. Such accounts leave out the option that the housing market itself might be an engine under housing wealth inequality. It is likely that the role of the housing market has only gained importance in recent decades with the increase in socio-economic segregation (Tammaru et al., 2015), especially in Sweden which became one of the most liberal-governed housing markets in the EU in the 1990s (Hedin et al., 2011). A more unequal development of house prices within urban regions increases the importance of making the right residential decisions. This article focuses on capital gains and losses on the housing market of the 13 largest Swedish cities between 1995 and 2010, for a cohort born between 1970 and 1975 that lived in rental housing or with their parents in 1995 and then at some point entered homeownership or cooperative housing (in Sweden equivalent to homeownership in apartment buildings).
Our results suggest that capital gains and losses on the housing market are unevenly distributed towards high-income, native Swedes. Hence, in this specific housing market and period, housing wealth inequality is not just an outcome of differences in purchasing power on the housing market, but also of uneven returns on this initial investment. This finding provides support for Hamnett’s (1999) claim that capital gains increase with social class. Moreover, it supports Newman and Holupka’s (2016) finding that capital gains are unevenly distributed towards the white high-income population, even in a period of continuously rising prices. Interestingly, highly-educated individuals have initially lower capital gains than their lower-educated counterparts as a result of their later entry into homeownership or cooperative housing. However, after this postponed entry into homeownership or cooperative housing, they accumulate capital gains at a faster rate.
The uneven distribution of capital gains can to a large extent be explained by the housing pathways people follow. Lower-educated people and migrants are overrepresented in housing pathways characterised by a late entry into homeownership or cooperative housing, or an exit out of these tenures which both result in less capital gains. In situ changes in the neighbourhood composition regarding the share of migrants and highly-educated people between 1995 and 2010 are the best predictors of capital gains. However, the most profitable pathways (through neighbourhoods with a decreasing share of migrants or an increasing share of highly-educated people) are followed by people with various backgrounds. This concerns especially gentrification neighbourhoods where both the population that stayed put and the newcomers with a higher social status could profit from increasing house prices. The overrepresentation of highly-educated people in neighbourhoods with a low or moderate share of migrants, and a high share of residents with a university degree, partly explains their advantageous position vis-a-vis lower-educated people in terms of capital gains. Neighbourhoods with a higher social status from the outset fared better than those with a lower social status.
Making up the balance sheet of the period between 1995 and 2010, native Swedes with high incomes and high educational attainments could cluster together, since homeownership and cooperative housing in neighbourhoods where they were already over-represented became unaffordable for other social groups. Decennia of market-oriented reforms on the Swedish housing market (the privatisation of public housing, the liberalisation of mortgage finance etc.) have contributed to a more market-based sorting of individuals over the urban space. Although this has inflated house prices across the board, low-educated, low-income individuals and migrants have barely profited. The selective redirection of housing pathways that constitutes socio-spatial polarisation enlarges housing wealth inequality between natives and migrants, lower- and higher-educated people, and lower and higher income groups, due to divergent returns on their investments in housing. Both economic and cultural capital contribute to this outcome since only the affluent are able to buy into neighbourhoods with a high (and increasing) status, whereas only those with knowledge of the urban housing market (cultural capital) know where investments in housing become part of a new gentrification frontier with larger returns (Hochstenbach and Boterman, 2015). In conclusion, the Swedish housing market has, during the late 1990s and early 2000s, become a major engine under housing wealth inequality due to market-oriented reforms and a subsequent upswing in socio-spatial inequality.
Footnotes
Acknowledgements
We would like to thank Matz Dahlberg, Roger Andersson and Bo Bengtsson and Dominic Teodorescu for their comments on earlier drafts and two anonymous reviewers for their careful reading of the manuscript and valuable suggestions.
Declaration of conflicting interests
The author(s) declared no potential conflicts of interest with respect to the research, authorship, and/or publication of this article.
Funding
The research leading to these results has received funding from the European Research Council under the European Union’s Seventh Framework Programme (FP/2007-2013) / ERC Grant Agreement no. 283615 (ERC Starting Grant HOWCOME, Changing Housing Regimes and Trends in Social and Economic Inequality), and ERC Grant Agreement no. 615159 (ERC Consolidator Grant DEPRIVEDHOODS, Socio-spatial inequality, deprived neighbourhoods, and neighbourhood effects).