
Abstract
Age is an important known driver of residential sorting, yet little is understood about how age segregation is affected by housing unaffordability. This relationship is particularly pertinent given trends of increasing housing inequalities and population ageing, in Europe and elsewhere. Using harmonised population data for small areas linked with local house price statistics and household incomes in England and Wales, this paper examines the scale of, and links between, residential age segregation and housing unaffordability. The results reveal a strong association between increasing housing unaffordability (for sales and rentals) and increasing residential age segregation (beyond other local characteristics). This association is particularly marked in urban and rich (least deprived) areas. This points to increasing spatial polarisation along the intersections of wealth and age: not only are the wealthiest parts of the country, where housing is particularly unaffordable, becoming increasingly demarcated socio-economically but also by age. This implies that age-related life course processes are integral to the trends observed more broadly of increasing socio-spatial polarisation.
Introduction
Age segregation – a social concern?
This paper is concerned with describing and explaining contemporary patterns of residential age segregation in England and Wales. This is important because it pertains to the spatial manifestations of intergenerational relations and structural inequalities, which are examined in this paper through a focus on housing. The current interest in residential patterns by age can be contextualised in demographic shifts towards an ageing population seen in many more-developed nations, and what has become known as ‘the housing crisis’ in the UK. Housing per se has become a UK policy priority on the agenda of intergenerational fairness (House of Lords, 2019) and more recently in the Levelling Up White Paper (HM Government, 2022). Clearly, housing debates have gained a prominent and conspicuous profile over the years (The Guardian Editorial, 2022) with the idea that ‘Britain’s stark housing divide is no longer based on class and income but is largely between the generations’ (Grice, 2015). Whilst motivated by the specific recent experience of the UK, the subject of this paper has wider relevance by addressing how neoliberal housing markets are contributing to ever more differentiated housing market segments (Forrest and Hirayama, 2009) including, we argue, along lines of age and generation.
The literature on residential segregation has generally emphasised the undesirable nature of residential separation. This is most evident in debates about ethnic residential segregation in the UK (Catney, 2016; Finney and Simpson, 2009a). Considering residential patterns and trends by age presents an interesting lens for reassessing assumptions and understandings of segregation more generally. In contrast to ethnic segregation, age segregation has been presented from early work as the expected and benign cumulative effect of life cycle residential decisions (Cowgill, 1978). Such an association is well-rooted in ecological theory that portrays specific age groups and families as occupying different types of housing and residential spaces according to their life-cycle stage (Clark and Dieleman, 1996).
The literature variously presents age segregation as more or less desirable (Rosenberg and Everitt, 2001). Some scholars see residential age segregation as beneficial on the basis of efficient service provision to improve older people’s health and wellbeing, and for the pursuit of personal self-actualisation (Golant, 1985; Lloyd et al., 2014). Alternative perspectives express concern that places may become more age uniform, with potentially negative outcomes due to reduced cross-age interactions (Hagestad and Uhlenberg, 2006; Riley and Riley, 2000; Uhlenberg, 2000), which may undermine ‘productive ageing’ and age-friendly communities (Greenfield and Buffel, 2022; Lager et al., 2015; World Health Organization, 2007). In this paper our concern is with the underlying drivers of spatial polarisation; the extent to which housing markets may shape residential patterns, differentially for age groups, such that we see intergenerational residential separation as a by-product of the geographically uneven accessibility of housing, with potential implications for social cohesion.
Age segregation – patterns and trends
In the 2000s, research disentangling the extent, underlying causes of, and social processes involved in residential age segregation was lacking (Andrews et al., 2007). In recent years, research has investigated the transforming spatial relationships between older and younger adults in the US (Winkler, 2013) and UK contexts (Sabater et al., 2017) but this field has by no means been exhausted.
A longstanding theme in the literature is how residential age patterns are associated with urban/rural-ness. In their seminal studies on several American cities in the 1960s and 1970s, Coulson (1968) and Kennedy and De Jong (1977) argued that cities were spatially age differentiated such that older populations were located in older central neighbourhoods, with a transition towards a younger age structure in the suburbs. Similar observations were made in the UK, and interest turned to age-differentiated processes of counterurbanisation (Champion, 2005). Subsequent scholarship pointed to youth urbanisation and a coincident increase in residential age segregation within metropolitan areas in the US through the 1970s and 1980s (e.g. see Cowgill, 1978; Lagory et al., 1980).
While the study of residential age segregation also received attention outside the US during the 1980s (e.g. see Franz et al., 1989 in Germany), it was largely ignored in the 1990s and 2000s, with a few exceptions (e.g. see Schwabe, 2011 on French cities). In recent years, however, there has been renewed interest in high income countries. For example, Winkler (2013) found older and younger adults to be moderately segregated across the United States at the microlevel, and evidence from the UK also suggests that, since the 1990s, residential locales are becoming less age mixed (Dorling and Rees, 2003; Sabater et al., 2017). The results from Sabater and colleagues are important in two regards. Firstly, they show that the level of geographical separation between older and younger adults since the 1990s has increased significantly in most locales; secondly, they indicate that although residential age segregation tends to be higher in rural areas, a rapid increase in age segregation has emerged in urban areas since the 1990s.
Age segregation – a result of housing processes?
Although many studies have found significant relationships between population age groups and their housing circumstances (Mulder, 2006), how these relationships are changing, and their resulting spatial manifestations, are poorly understood, yet may be reinforcing both socio-economic and intergenerational spatial polarisation. We can view housing processes that shape residential patterns at the micro and macro levels and they, of course, are embedded in other factors such as residential preferences or interventions in the built environment that shape residential patterns (Hochstenbach, 2019). However, as pointed out by the influential work of Rex and Moore (1969), the main mechanism of residential segregation is the varying access of households to housing which depends upon housing structures at a macro/societal level. Under conditions of housing shortage, households compete for homes and locations (van Kempen and Şule Özüekren, 1998); those with more resources in terms of income, social contacts, knowledge and political power have greater housing and neighbourhood choice (Savage et al., 2005). Thus, if homogeneity of preference is assumed, in a competitive housing market, spatial separation by age will result between those with more and fewer resources.
An important indicator of (socio-)economic resource deployed for housing is tenure. The UK is a ‘homeowner society’ in which an ‘implicit inclusivity of homeownership ideologies’ has been cultivated over the last half century (Arundel and Ronald, 2021: 1136). The ability to enter home ownership is not only age-related and associated with access to parental support but has distinct spatial patterns (Arundel and Ronald, 2021; Coulter, 2018). A recent study by Andersson et al. (2022) using extensive Swedish data found, for example, a strong degree of spatial overlap in tenure mix and socio-economic mix across neighbourhoods.
This paper brings socio-economic mix and age segregation debates into conversation in a context of ageing and increasing housing precarity, particularly for younger people (Marcuse and Keating, 2006); it examines how life course related housing market dynamics are shaping residential sorting. Given increasing spatial polarisation along wealth lines in cities worldwide (Van Ham et al., 2021) and increasing housing wealth inequalities (Arundel, 2017), we can expect an associated spatial sorting by age, given that, on average, older populations have resources that augment their housing options. We contend that the age and life course dimensions of spatial organisation are a central cog in sorting processes, the mechanisms and consequences of which need to be better understood. Thus, this paper augments extant work by bringing the concepts of residential age segregation and housing unaffordability into debates about intergenerational inequalities and spatial polarisation. It examines the local associations between residential age segregation and housing unaffordability and variation in this by urban-ness and deprivation. The paper addresses two specific questions:
Is age segregation of older and younger adults within small areas in England and Wales explained by local patterns of housing unaffordability?
How is the association between housing unaffordability and age segregation patterned across neighbourhoods according to urban-ness and deprivation?
Data and method
Data sources
In order to investigate the association between patterns of residential age segregation and local levels of housing unaffordability, we combine sub-district data from the 2011 Census with rich small area data on house prices (for sales and rentals) and household incomes for the same year from the Office for National Statistics and the Urban Big Data Centre. The boundaries of 2011 Output Areas (OAs) (181,408) are used as units for the computation of residential segregation for each Middle Layer Super Output Areas (MSOAs) in England and Wales (7201 in 2011). While MSOAs have a similar mean population size (7200) to the 8546 wards in England and Wales (6600), we prefer employing MSOAs as ward-population counts can vary substantially and are also regularly affected by boundary changes. Thus, using OA data across each 2011 MSOAs not only gives sufficiently large populations of age groups while retaining fine-grained spatial variability in age residential patterns, but also allows us to examine whether or not the spatial pattern of age segregation found at district level in other work (Sabater et al., 2017) differs for smaller areas. Since OAs are designed to have similar population sizes (the lower threshold is 100 resident people, and the upper threshold is 625 resident people), population estimates at the OA level are important as they provide insight into local patterns of change and can be interpreted as a measure of population distribution at the neighbourhood level.
Since the focus is on investigating geographical areas smaller than the local authority level, we derive two separate bespoke indicators of housing unaffordability for sales and rentals for each MSOA in England and Wales. The first measure is computed as the local ratio of median house prices to annualised net household income. Median house price data are part of the House Price Statistics for Small Areas (HPSSAs) release, which are based on transactions for property sales recently produced by the Office for National Statistics (ONS). The second measure is computed as the local ratio of median monthly rental prices to monthly net household income. Median rental price data are derived from gross rents (i.e. the amount of rent stipulated in a lease) and obtained from a total of 363,346 adverts from the Zoopla Property Group through a sublicence granted by the Urban Big Data Centre from the University of Glasgow. Although these data do not include all rented properties in England and Wales, they provide a measure of flow of rented properties from one of the major property websites, thus enabling the production and analysis of small area rent price statistics for areas smaller than local authority districts.
Annualised and monthly net household incomes for MSOAs are official income estimates from ONS. These are produced using a combination of survey data from the Family Resources Survey and previously published data from the 2011 Census. Both measures of net household incomes refer to the sum of total income of every member of the household after taking into consideration common deductions from salary (for details see Office for National Statistics, 2016).
As our outcome of interest – dissimilarity between age groups across Outputs Areas within MSOAs – is a measure of spatial variation within the MSOA, it is arguably logical to measure co-variates in a similar manner according to their spatial variation (i.e. within-MSOA). However, at the time of writing data are not available to enable affordability to be calculated for OAs; MSOA is thus the most refined geography for this variable. Incorporating the spatial variation of affordability as a co-variate would necessitate district-level analysis (MSOAs within districts) bringing the disadvantage of reduced spatial nuance to the measurement of segregation. We have, thus, opted to measure co-variates as MSOA level indicators. The benefit of this approach is spatial nuance in our understanding of the patterning of age segregation; the disadvantage is a limitation to our interpretation which is necessarily speculative. We return to this conceptual and operationalisation challenge in the discussion.
In order to account for other local housing characteristics that may be important elements of the socio-economic mechanisms connecting affordability and age segregation, our study also includes information on housing tenure and accommodation type from the 2011 Census. The classification used in our study largely corresponds to the 2011 Census for household tenure, with the following categories: home ownership, rented from council, other social rented and private rented. Information on accommodation type from the 2011 Census identifies the type of housing in each area as well as the characteristics of the housing stock locally: detached, semi-detached, terraced and flats. In addition to the abovementioned variables, we have included information on population densities for each MSOA based on aggregations from Lower layer Super Output Area (LSOA) density estimates of the usual resident population from ONS, and Simpson’s Diversity Index scores of ethnic diversity for each MSOAs in England and Wales in 2011.
Finally, we employ data on household deprivation for MSOAs in England and Wales for the year 2011. This dataset from the Office for National Statistics (2013) provides estimates that classify households by four dimensions of deprivation: employment, education, health and disability and household overcrowding. Since a household is classified as being deprived in none, or one to four of these dimensions in any combination, we derive quintiles of deprivation based on the presence of any combination of the four dimensions of deprivation. For this five-category variable, quintile 1 (Q1) contains the least deprived 20% of households in MSOAs, whereas quintile 5 (Q5) contains the most deprived 20% of households in MSOAs in England and Wales.
Methods
Methodologically, our analysis is divided into three parts. First, we compute one of the most commonly-employed measures of residential segregation, the Dissimilarity Index, to assess how evenly people of different age groups (older and younger) are distributed across small areal units in an urban and rural area. The Dissimilarity Index, which is widely described in the segregation literature (Massey and Denton, 1988), is conceived to measure an unequal geographical spread of one group relative to another group and is generally expressed as a percentage, with index values between 0 and 100, and higher values indicating greater segregation. This value can be interpreted as the percentage of the age group of interest that would have to move neighbourhood in order to have a distribution in each small area that matches its proportion in the total population.
To assess residential segregation by age, our segregation indexes are pair-wise comparisons, with 24 combinations of 5-year age groups from ages 20–24 to 85 and over as well as the following combinations of 10-year age groups: 20–29 versus 60–69, 20–29 versus 70–79, 30–39 versus 60–69 and 30–39 versus 70–79. The Dissimilarity Index is calculated for each of these age pairs across Output Areas that make up each MSOA. This method gives a comprehensive examination of where younger and older people live relative to one another, enabling distinction between life course phases, for small geographical areas. In line with previous research (Sabater et al., 2017), we exclude those aged 18–20 as they would largely reflect concentrations of higher education students in university locations rather than more general social processes. For robustness, segregation analyses were also conducted using the Indices of Isolation and Interaction; these results (not shown) confirm the substantive findings of the analyses presented.
In the second part of the analysis, we apply a multilevel mixed-effects linear regression using Stata’s xtmixed command to examine the association between age segregation (as measured by the Dissimilarity Index) and unaffordability for sales and rentals, while taking into account other local area characteristics (housing tenure, accommodation type, population density and ethnic diversity) via fixed effects. Because MSOAs (level 1) are nested within groups of Local Authorities Districts (LADs) (level 2) and within supergroups of Government Office Regions (GOR) (level 3), we fit a three-level mixed model with random intercepts at both the GORs and the LADs-within-GORs levels. More specifically, there are 10 GORs at level 3, 345 LADs at level 2 and 7201 MSOAs at level 1 of the data hierarchy. All models are fitted by maximum likelihood, and can be expressed as follows:
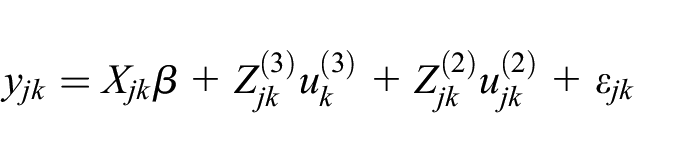
where
In the third part of the analysis, we re-run separate multilevel mixed-effects linear regressions to examine the association between age segregation and unaffordability for sales and rentals while taking into account levels of household deprivation through quintiles, and urban-ness, for MSOAs in England and Wales for the year 2011. We apply the term urban-ness from a slightly modified version of the 2011 urban-rural classification from the Office for National Statistics (2016), which allows for a consistent urban–rural view of datasets at MSOA level. We present results for six categories of urban-ness: (1) urban major conurbation (London), (2) urban major conurbation (other), (3) urban minor conurbation, (4) urban city and town, (5) rural town and fringe and (6) rural villages.
Our analytical strategy consisted of examining the average effect (or so-called fixed effect expressed by the regression coefficient) of housing unaffordability for sales and rentals on residential segregation across all MSOAs nationally first, and then separately for urban and rural MSOAs and quintiles of deprivation. Given that MSOAs are derived from OAs, which were designed to have similar population sizes and be as socially homogenous as possible based on tenure of household and dwelling type, we use a fixed effects model that removes all variation between higher level units (LADs and GORs) from the parameter estimation. This has the advantage of removing all potential unobserved confounding variables at the higher level from the analysis. The examination of the association between the measures of residential age segregation and unaffordability ratios for sales employed the full sample of 7201 MSOAs, whereas the equivalent analysis using unaffordability ratios for rentals used a reduced sample totalling 5944 MSOAs due to the unavailability of rent price statistics in 1257 MSOAs in 2011.
Results
Table 1 gives the means, standard deviations, and extreme values of the dependent variable and covariates used in the multivariate multilevel analysis. Crucially, it shows that there is significant geographical variation for covariates across MSOAs in England and Wales. The largest dispersion (SD) is found within the measure of population density, where the standard deviation is much larger than the mean values, which implies that population density distributions vary greatly across MSOAs. It is also evident that there is a substantial amount of dispersion within the two main predictors of housing unaffordability. For instance, while people in the most affordable areas require on average 2.3 times their annual earnings to buy a home, in the least affordable areas people could expect to pay up to 37 times their annual earnings to purchase a home. As expected, the local levels of housing unaffordability for rentals also differ substantially. For example, in the most affordable areas people spend on average 0.15 times their household monthly earnings to rent a home, while in the least affordable areas people could expect to pay up to 1.8 times their monthly earnings to do so.
Descriptive statistics (dependent variables and covariates) used in the mixed-effects multilevel regression, England and Wales, 2011.
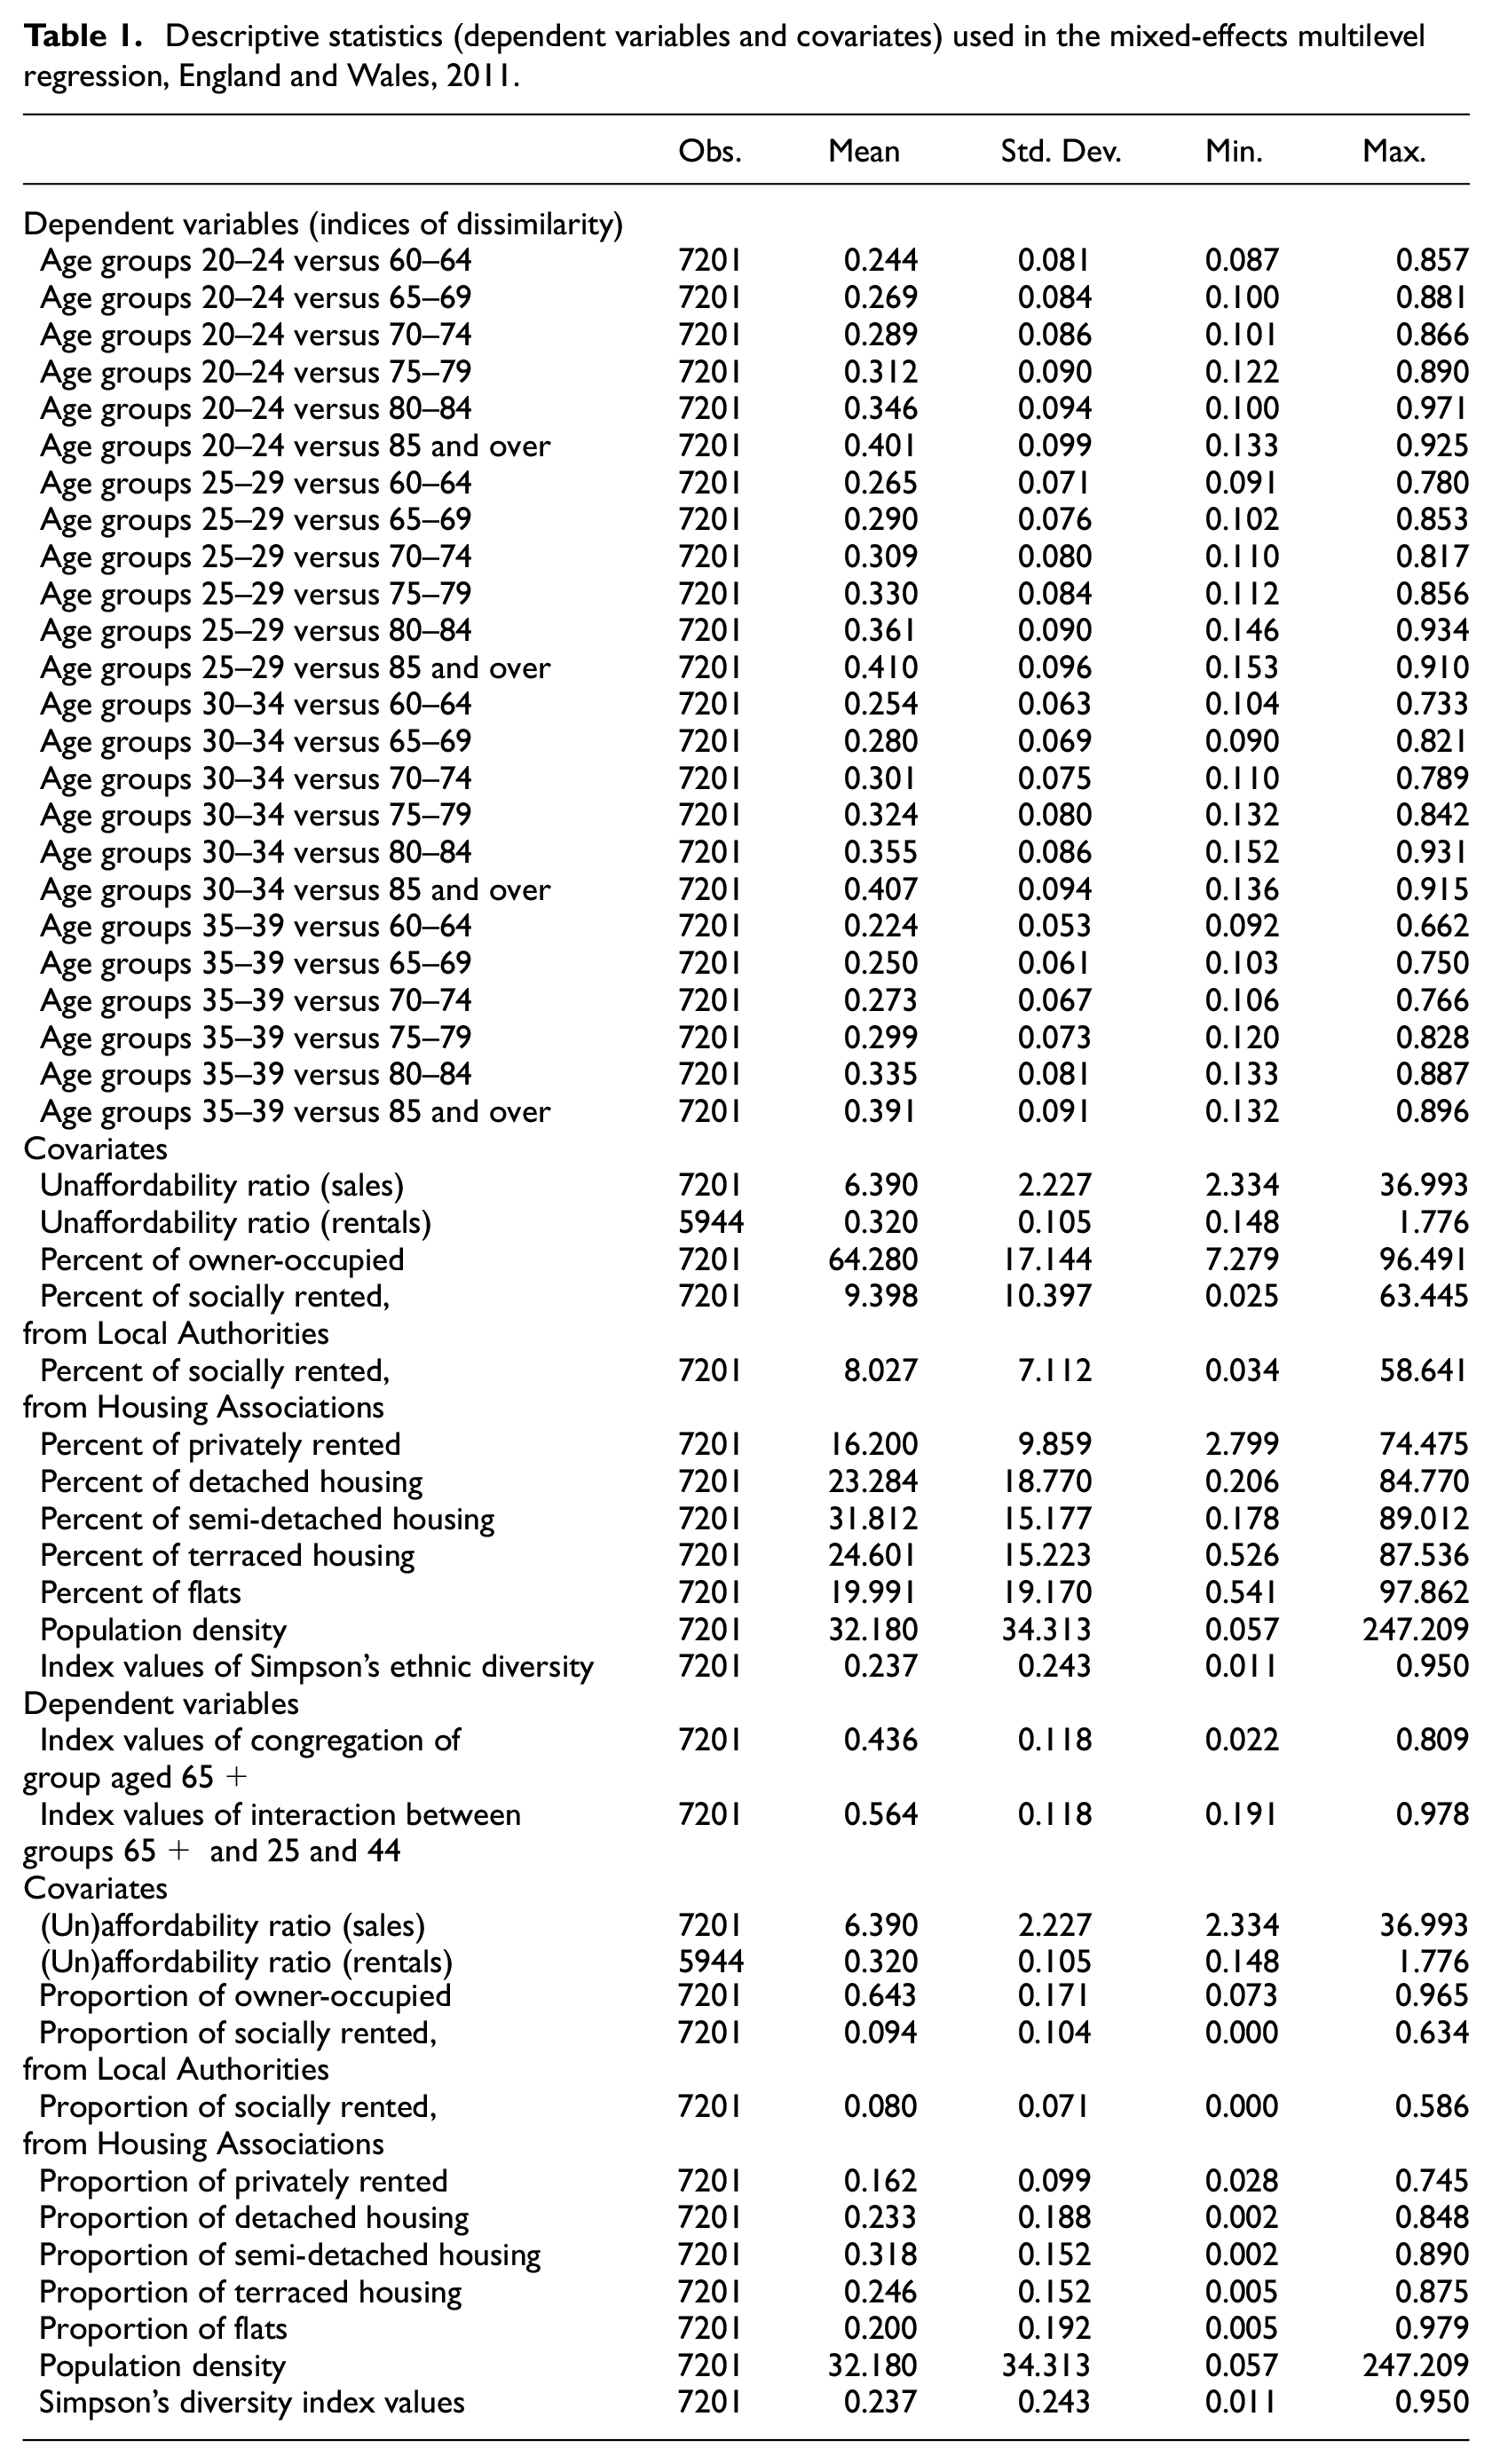
Table 1 also demonstrates the variation and extent of residential age segregation in terms of the unevenness of where younger and older people live within localities (MSOAs) in England and Wales. This corroborates recent studies (Sabater et al., 2017) in highlighting that older and younger groups are increasingly less likely to share a residential area.
Since housing and population characteristics locally are likely to affect the relationship between residential age segregation and housing affordability, in this part of the paper we examine this relationship using a multivariate multilevel approach that takes into consideration key correlates: housing tenure, the characteristics of the housing stock (accommodation types), population density levels and ethnic diversity at the small area (MSOA) level. However, before focussing on our main covariates of interest, we examined as a starting point what portion of the variance in the outcome variable (dissimilarity) is due to cross-region (GORs) and cross-district (LADs) differences compared to MSOA differences. Our results for the first age pair-wise combination (20–24 versus 60–54) indicate that 1.3% of the variance is due to differences across GORs, whereas 11.7% of the variance for both are due to differences across LADs within GORs, with the remaining 87% of the variance attributable to differences across MSOAs. Similar results are found for the rest of the age pair-wise combinations.
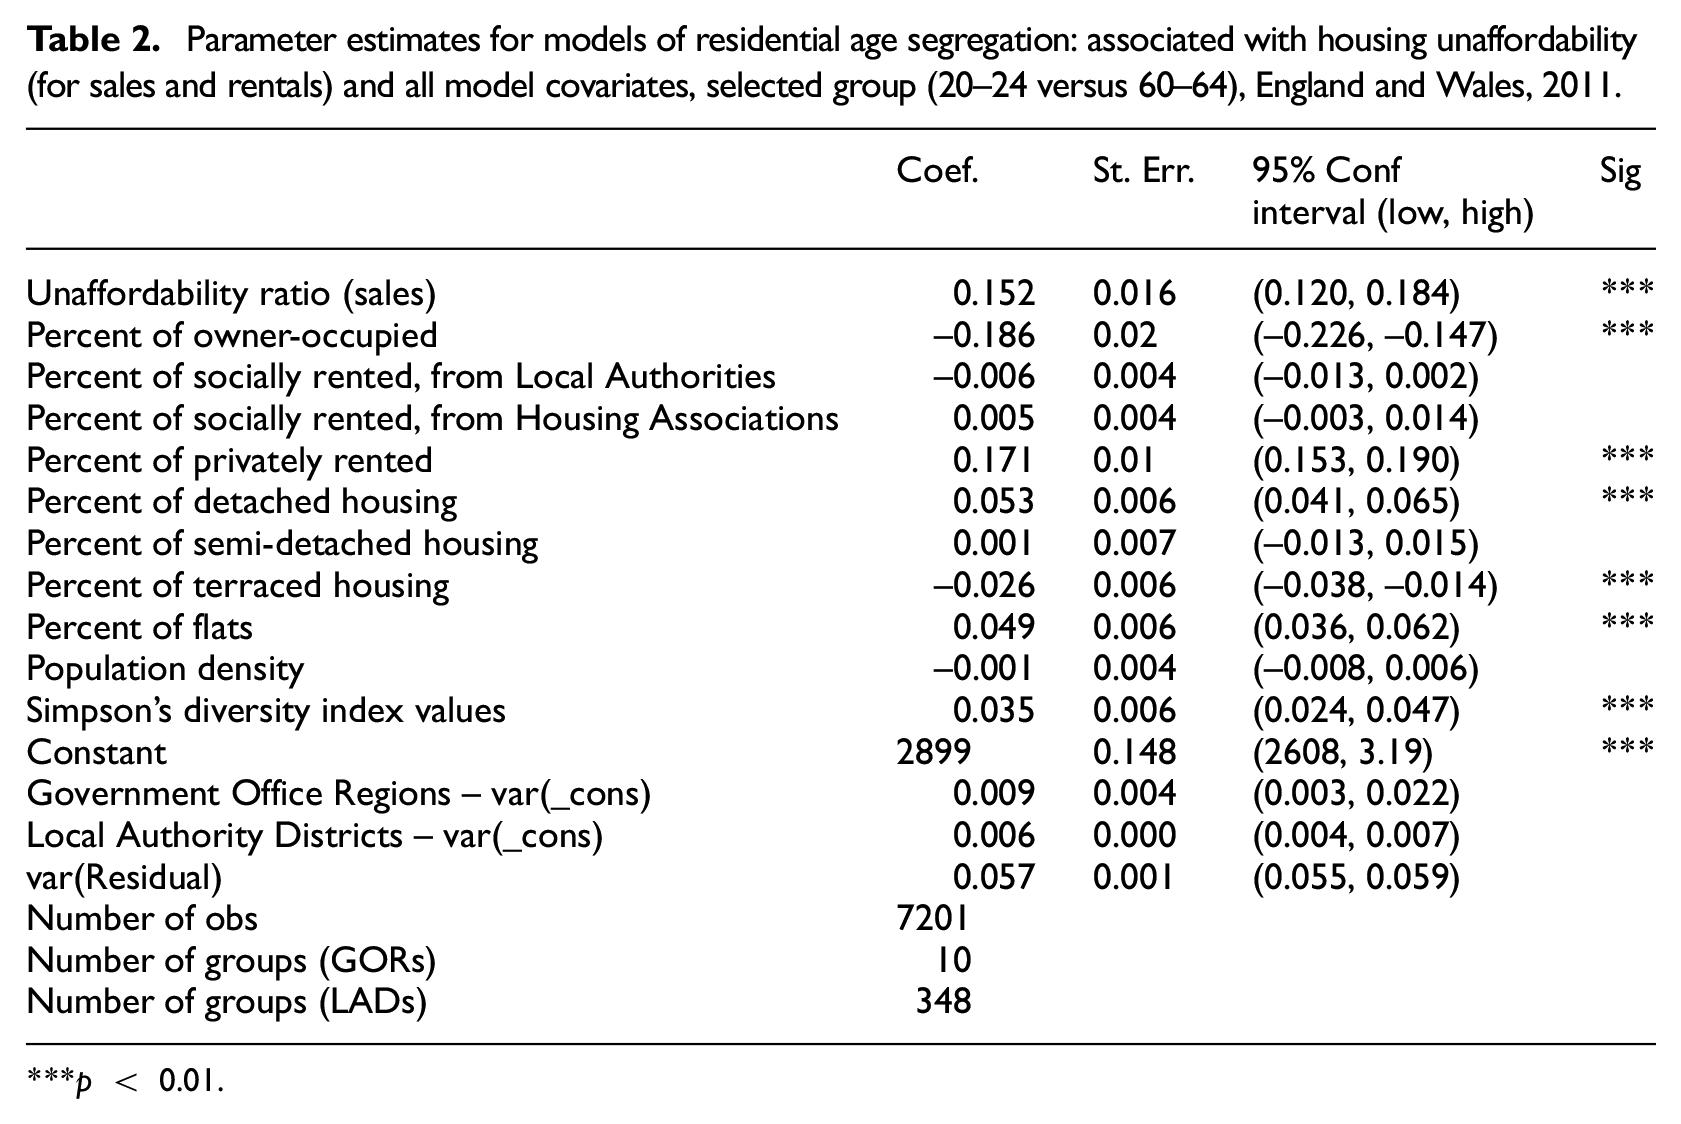
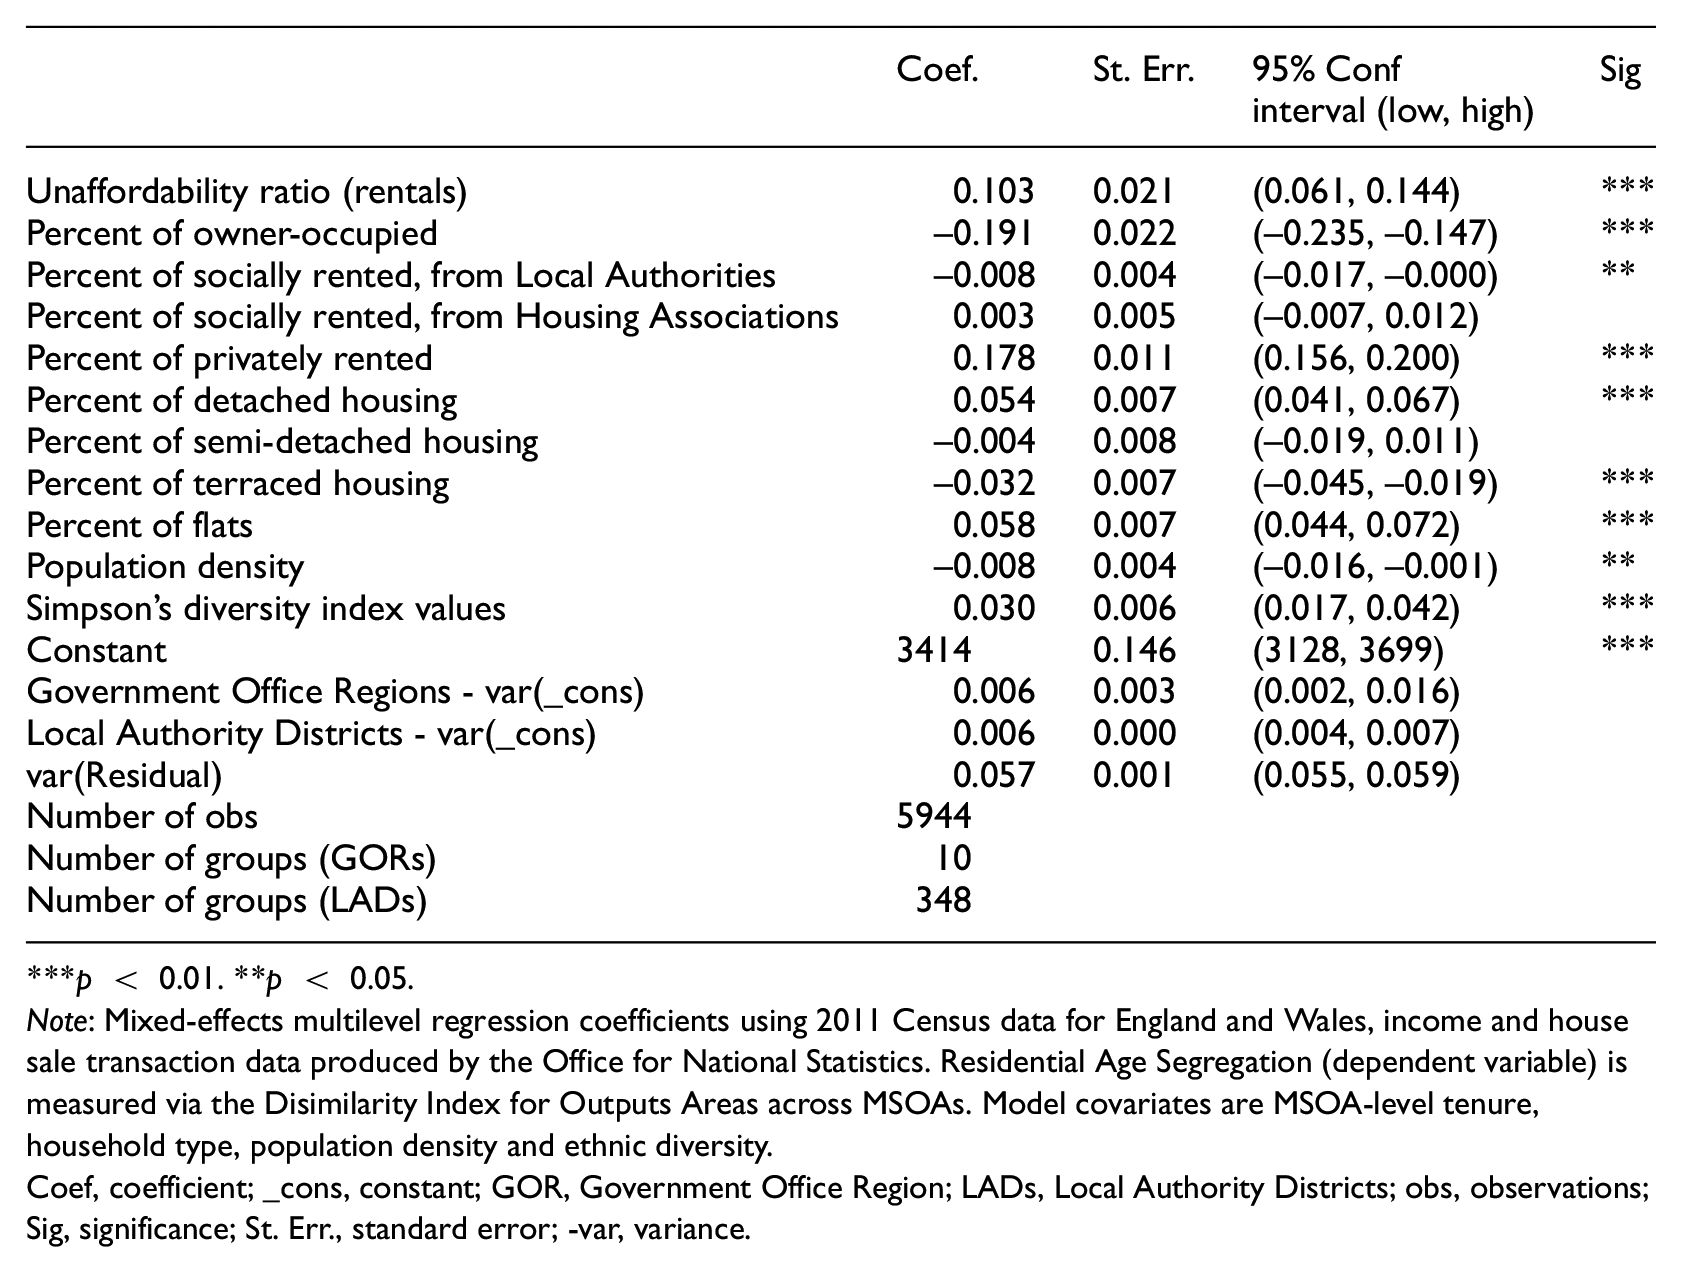
Table 2 displays the change in residential age segregation associated with housing unaffordability (for sales and rentals) with all model covariates for a selected group (20–24 versus 60–64) in England and Wales. The results exhibit a strong relationship between residential age segregation and housing unaffordability for sales and rentals with significant and sizeable effects: a one-unit increase in the unaffordability ratio for sales is associated with an increase in dissimilarity of the selected group by around 15%, whereas a one-unit increase in the unaffordability ratio for rentals is expected to increase dissimilarity of the same group by 10%. The results also show that local housing and population characteristics are important. For instance, in the model for sales various predictors decrease age segregation (percent of owner-occupied and percent of terraced housing) whereas others increase it (percent of privately rented, percent of detached housing, percent of flats and ethnic diversity). In the model for rentals, there is a similar pattern with some predictors associated with a decrease (percent of owner-occupied, percent of socially rented from Local Authorities, percent of terraced housing and population density) and increase (percent of privately rented, percent of detached housing, percent of flats and ethnic diversity) in unevenness or segregation between younger and older groups. It is also clear from the results that only two predictor variables (percent of owner-occupied and percent of privately rented) have an effect on dissimilarity that goes above and beyond the contributed effect of housing unaffordability for sales and rentals. The coefficients for models predicting residential segregation between other age groups show the same substantive conclusions in terms of the association of the co-variates.
Parameter estimates for models of residential age segregation: associated with housing unaffordability (for sales and rentals) and all model covariates, selected group (20–24 versus 60–64), England and Wales, 2011.
p < 0.01.
p < 0.01. **p < 0.05.
Note: Mixed-effects multilevel regression coefficients using 2011 Census data for England and Wales, income and house sale transaction data produced by the Office for National Statistics. Residential Age Segregation (dependent variable) is measured via the Disimilarity Index for Outputs Areas across MSOAs. Model covariates are MSOA-level tenure, household type, population density and ethnic diversity.
Coef, coefficient; _cons, constant; GOR, Government Office Region; LADs, Local Authority Districts; obs, observations; Sig, significance; St. Err., standard error; -var, variance.
In order to interrogate whether the observed effects vary across ages and places, Figure 1 summarises the results of the models by showing the relationship between housing unaffordability for buying a property and residential age segregation for areas categorised according to the ONS Rural Urban classification. This is presented for selected age-group comparisons: the youngest young-adult group (20–24) compared with older adult groups, and the oldest young-adult group (35–39) compared with older adult groups. These age groups represent different stages of housing career with, in general, the youngest-young group having less economic resources and more housing precarity (in terms of higher rates of residential mobility and of private renting; Coulter et al., 2020). On average we would expect the older young-adults (35–39) to have more similar housing opportunities and demands to older adult groups, compared with the youngest young-adults.
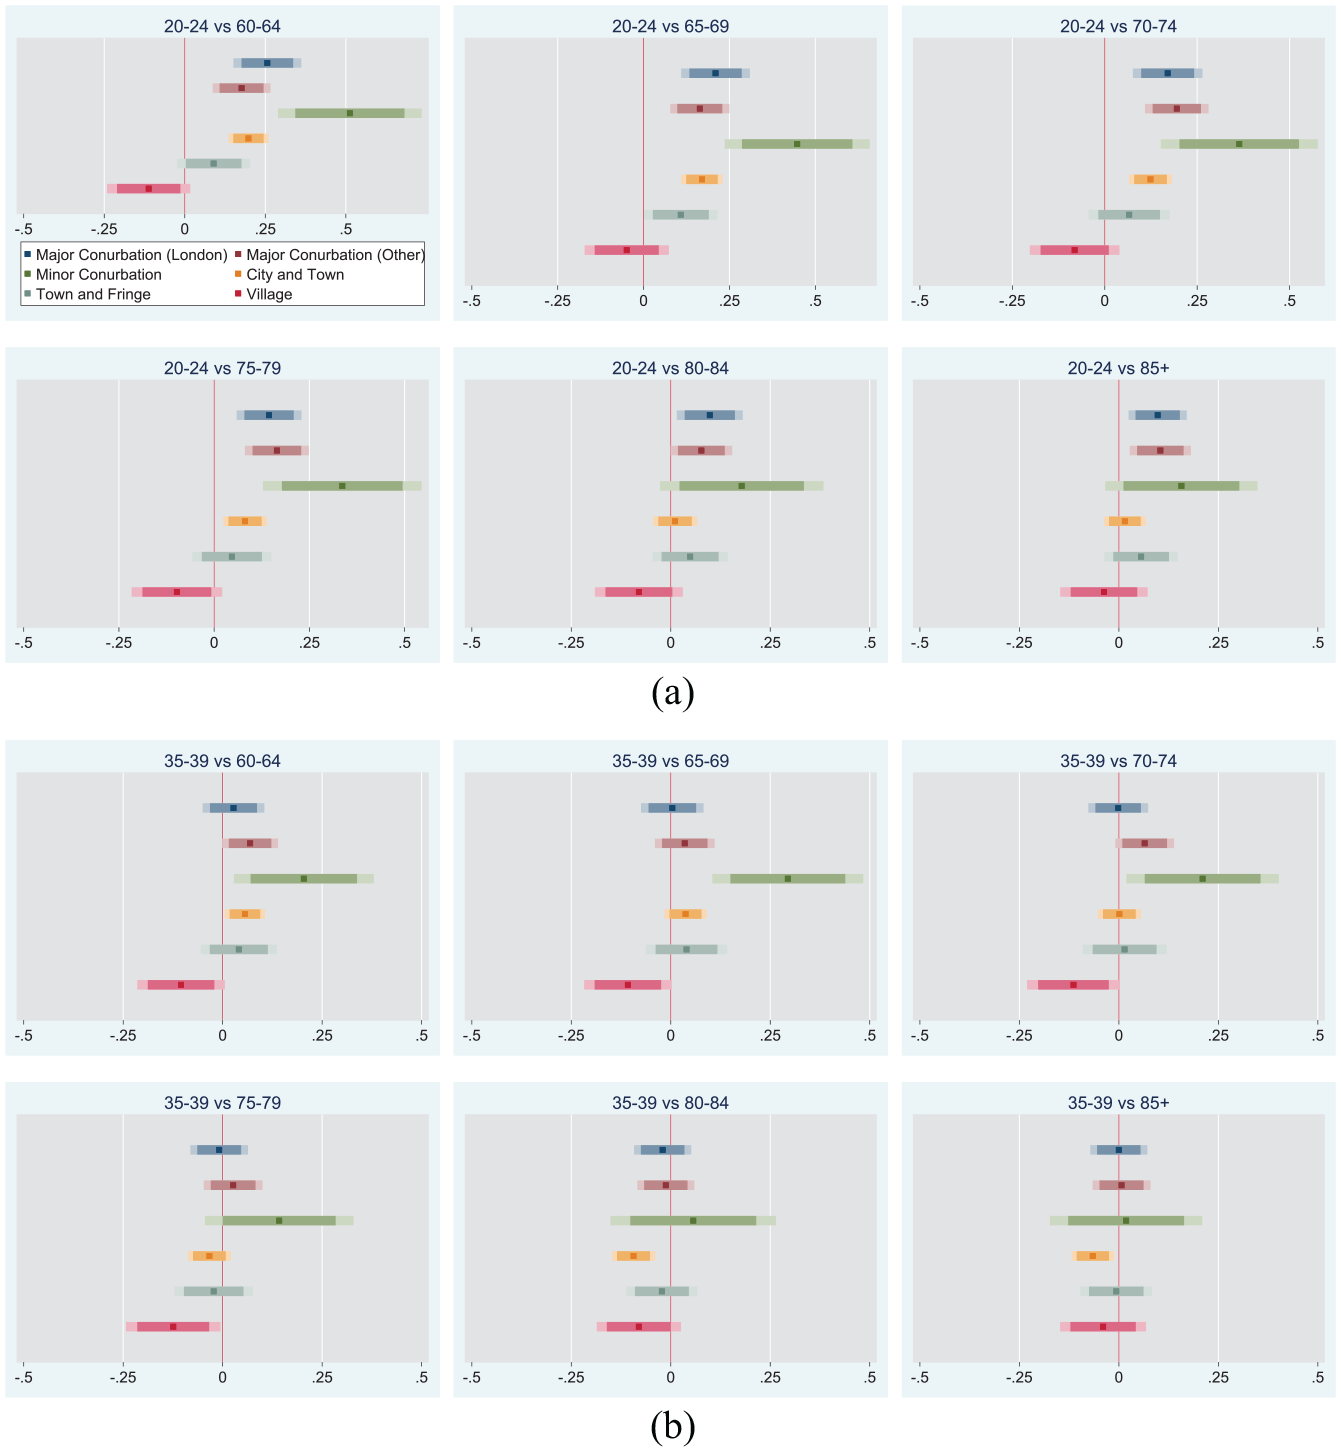
Parameter estimates for residential age segregation in urban and rural areas associated with housing unaffordability (for sales), for pair-wise age comparisons, England and Wales, 2011: (a) 20–24 years olds compared with older age groups and (b) 35–39 year olds compared with older age groups.
The charts plot the change in residential age segregation associated with a one-unit increase in housing unaffordability. Each bar in the charts thus indicates, for the neighbourhoods in the urban–rural category, the impact of the unaffordability of buying a property in that area on its age segregation, taking into account other characteristics of the neighbourhood (and controlling through the modelling strategy for influences at higher level geographies). The results of this analysis reveal that in most urban areas (major conurbations within and outside London, minor conurbations and cities and towns) there is a positive association between unaffordability levels for sales and segregation levels between older and younger groups. For instance, a one-unit increase in housing unaffordability is associated with a 52% increase in unevenness or segregation between the age groups 20–24 and 60–64 in minor conurbations in England and Wales. Although this relationship appears to be less strong outside minor conurbations, the evidence suggests that across urban areas there is a positive link that as unaffordability increases residential segregation between older and younger groups also increases. On the contrary, the relationship between unaffordability for sales and segregation between older and younger groups in rural areas is either non-significant (towns and fringe) or negative (villages) in most cases.
The deeper insight into segregation patterns provided through the pair-wise comparisons between 5-year younger and older age groups is evident; the association of the unaffordability of buying a house with increased in residential segregation by age in urban areas is particularly strong between the younger groups (aged 20–24 and 25–29) across the majority of older age groups, at least to the age of 75–79. As housing unaffordability increases in minor conurbations, segregation also increases, as demonstrated by the following pair-wise combinations: 20–24 versus 65–69 (48%), 20–24 versus 70–74 (34%), 25–29 versus 65–69 (34%) or 25–29 versus 70–74 (27%). Although this relationship is less strong between the other younger groups (aged 30–34 and 35–39) and older age groups, the pattern of greater segregation as unaffordability increases remains, particularly in minor conurbations and major conurbations outside London. These results reveal that local urban patterns of housing unaffordability matter for age segregation.
Figure 2 shows the relationship between housing unaffordability and residential age segregation for rentals, in urban compared to rural areas. While the analysis provides a similar picture to that for housing sales, particularly in minor and major conurbations (within and outside London) for the younger age groups (e.g. 20–24) and across the majority of older age groups, it is clear that the association is weaker or non-significant in the analysis with information on rentals. For instance, a one-unit increase in the levels of unaffordability for rentals is associated with 65% and 20% increases in age segregation for the age groups 20–24 versus 60–64 in minor conurbations and major conurbations outside London respectively. In contrast, a one-unit increase in unaffordability levels for rentals is associated with a 12% increase in age segregation for the age groups 25–29 versus 60–64 in major conurbations outside London, but non-significant in minor conurbations. Although the results seem to indicate that unaffordable housing for sales is having a greater impact on age segregation than unaffordable housing for rentals, the latter also seems to have a detrimental effect on age segregation in major conurbations, including London. Further, the evidence suggests that unaffordable housing for rentals may not only be having an impact on residential age segregation in large cities like London where house prices tend to be highest, but may also be affecting the other urban areas, with the exception of cities and towns.
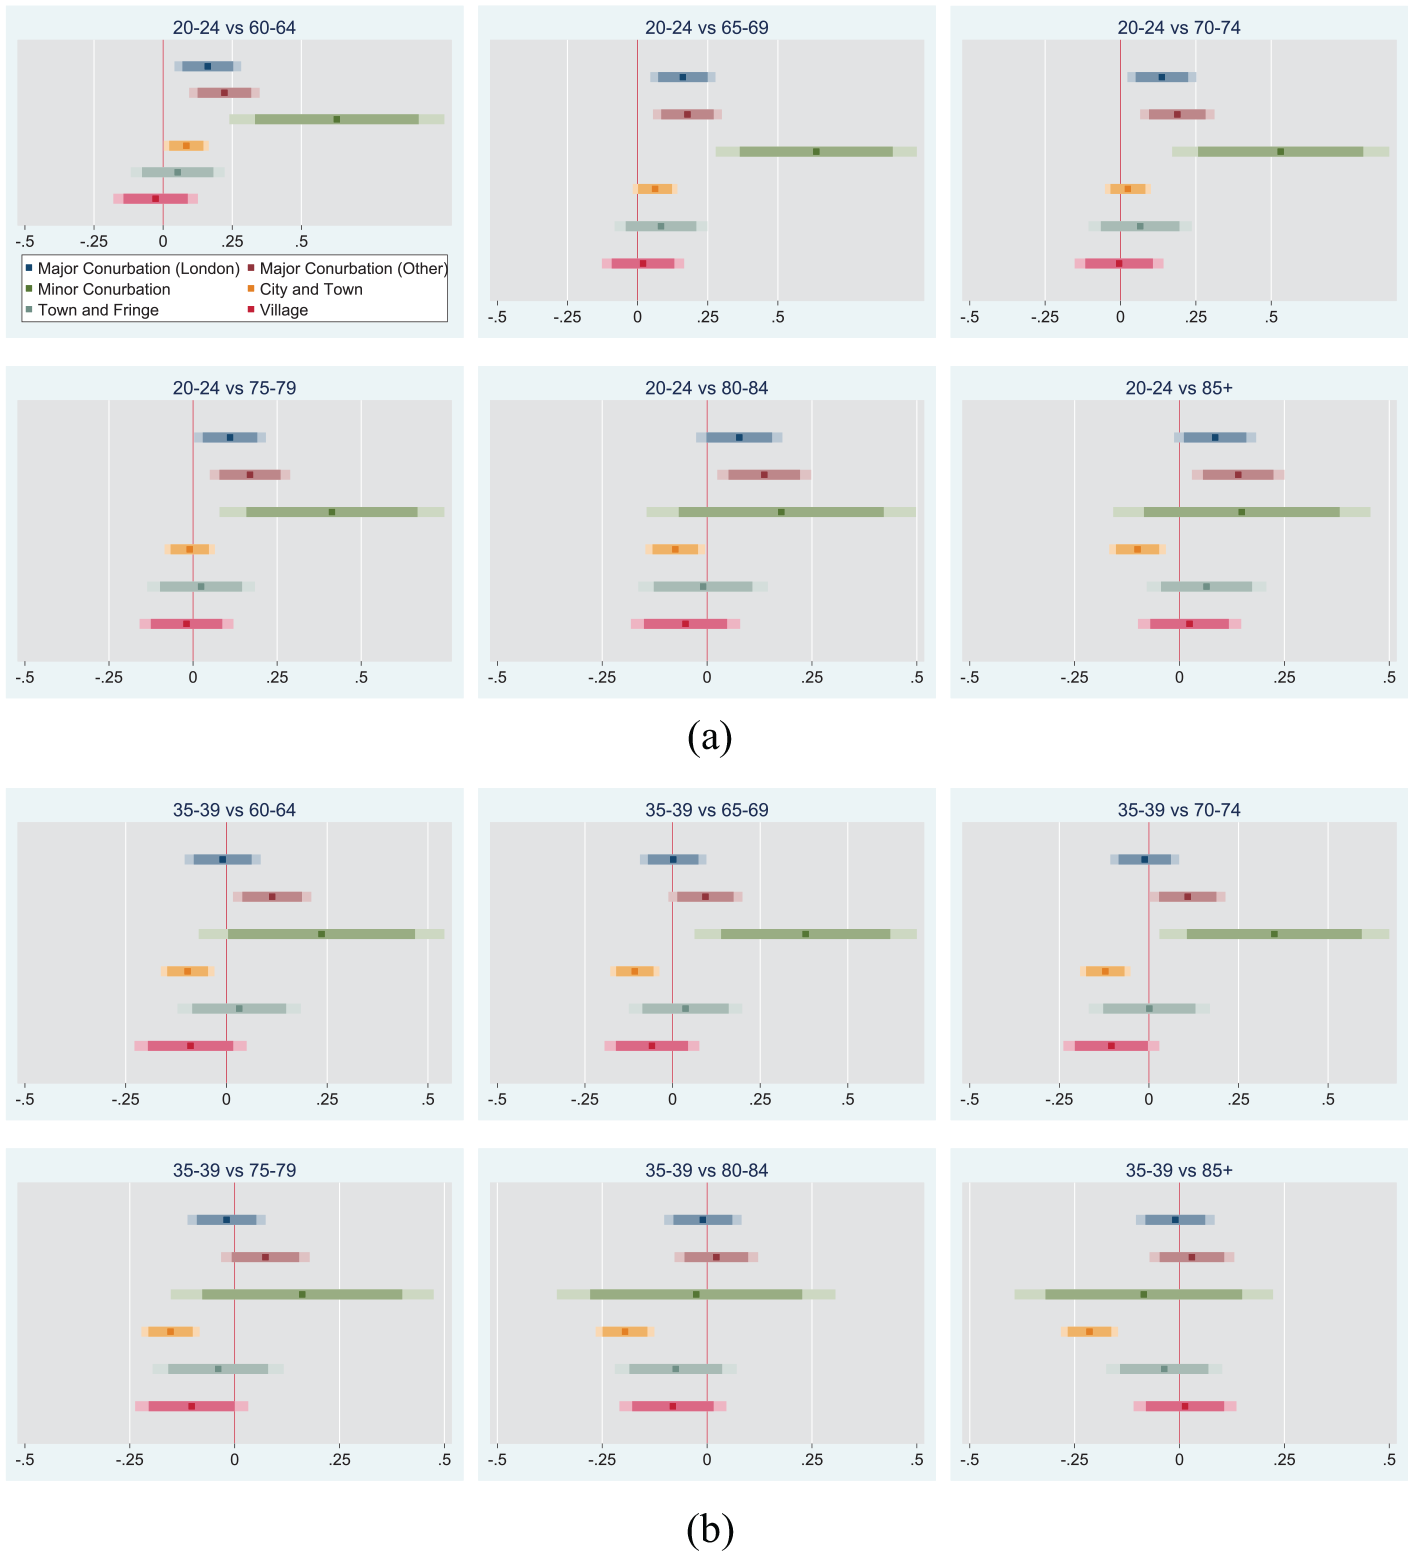
Parameter estimates for residential age segregation in urban and rural areas associated with housing unaffordability (for rentals), for pair-wise age comparisons, England and Wales, 2011: (a) 20–24 year olds compared with older age groups and (b) 35–39 year olds compared with older age groups.
While the analyses presented offer a consistent pattern of the detrimental effects of housing unaffordability for residential age segregation in urban areas, the findings for rural areas are more heterogeneous. It is possible that this is a result of sales and, above all, housing units available to let being less well represented in rural areas, thus making any association between unaffordability and segregation less pronounced or even non-significant.
Figure 3 further nuances our understanding of the geographical variation in the relationships between housing unaffordability and increased residential age segregation by taking into account the socio-economic contexts of the dynamics of residential age sorting. Figure 3 presents the change in age segregation associated with housing affordability for house buying (sales) for areas grouped by levels of household deprivation. Since our previous analysis highlighted that the widespread trend of increasing residential age segregation associated with increasing housing unaffordability is particularly marked in urban areas, results are only shown for these areas and for four combinations of 10-year age groups from ages 20–29 to 70–79.
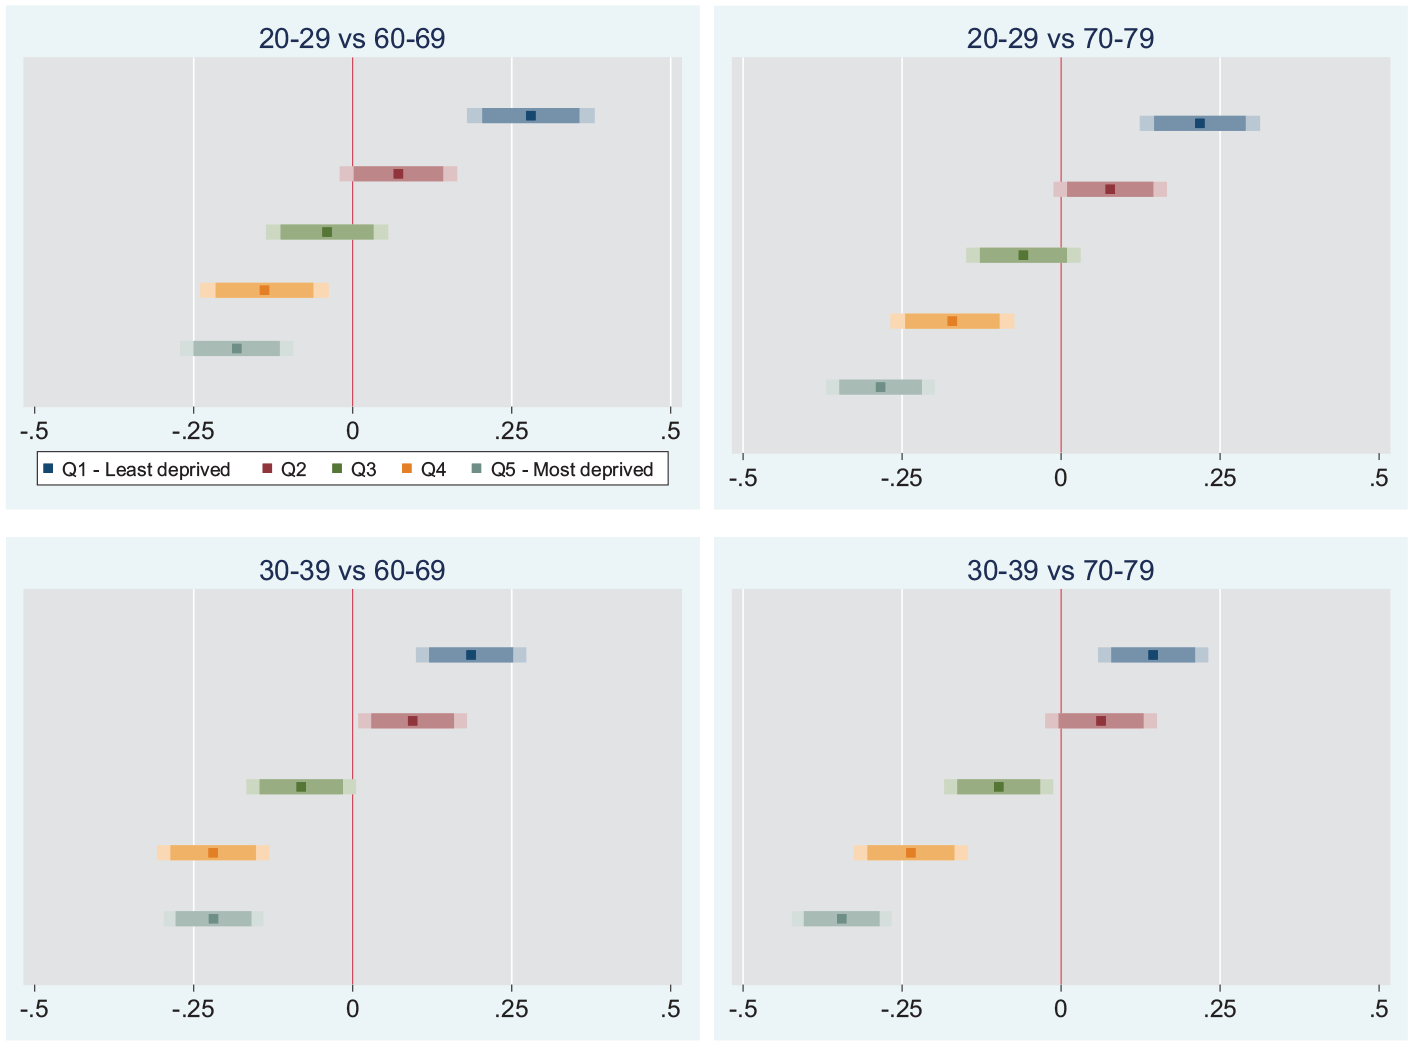
Parameter estimates for residential age segregation associated with housing unaffordability (for sales) in urban areas through pair-wise age comparisons and quintiles of area-level household deprivation, England and Wales, 2011.
The results reveal that the least deprived areas (Q1) systematically display the strongest association with age segregation levels (see Supplemental Appendices 1–4 for full models). Thus, an increment of unaffordability in the least deprived areas for sales is associated with the largest increases in age segregation as demonstrated by the following pair-wise combinations: 20–29 versus 60–69 (27%), 20–29 versus 70–79 (21%), 30–39 versus 60–69 (16%) or 30–39 versus 70–79 (13.5%). Meanwhile, the opposite is found in the most deprived areas (Q5) where an increment of unaffordability for sales is associated with the largest decreases in age segregation for the same age pair-wise combinations: 20–29 versus 60–69 (−17%), 20–29 versus 70–79 (26.5%), 30–39 versus 60–69 (−18.5%) or 30–39 versus 70–79 (−29%). A very similar relationship is identified when information about unaffordability for rentals is used (Figure 4). The least deprived areas (Q1) systematically display the strongest association with regard to age segregation levels, although the impact of unaffordability levels for rentals is clearly more pronounced than for sales (see Supplemental Appendices 1–4 for full models). In other words, the effect of unaffordability (for sales and rentals) on age segregation is greatest in the least deprived areas, and this implies that age-related processes are integral to the more broadly observed trends of increasing spatial (socio-economic) polarisation.
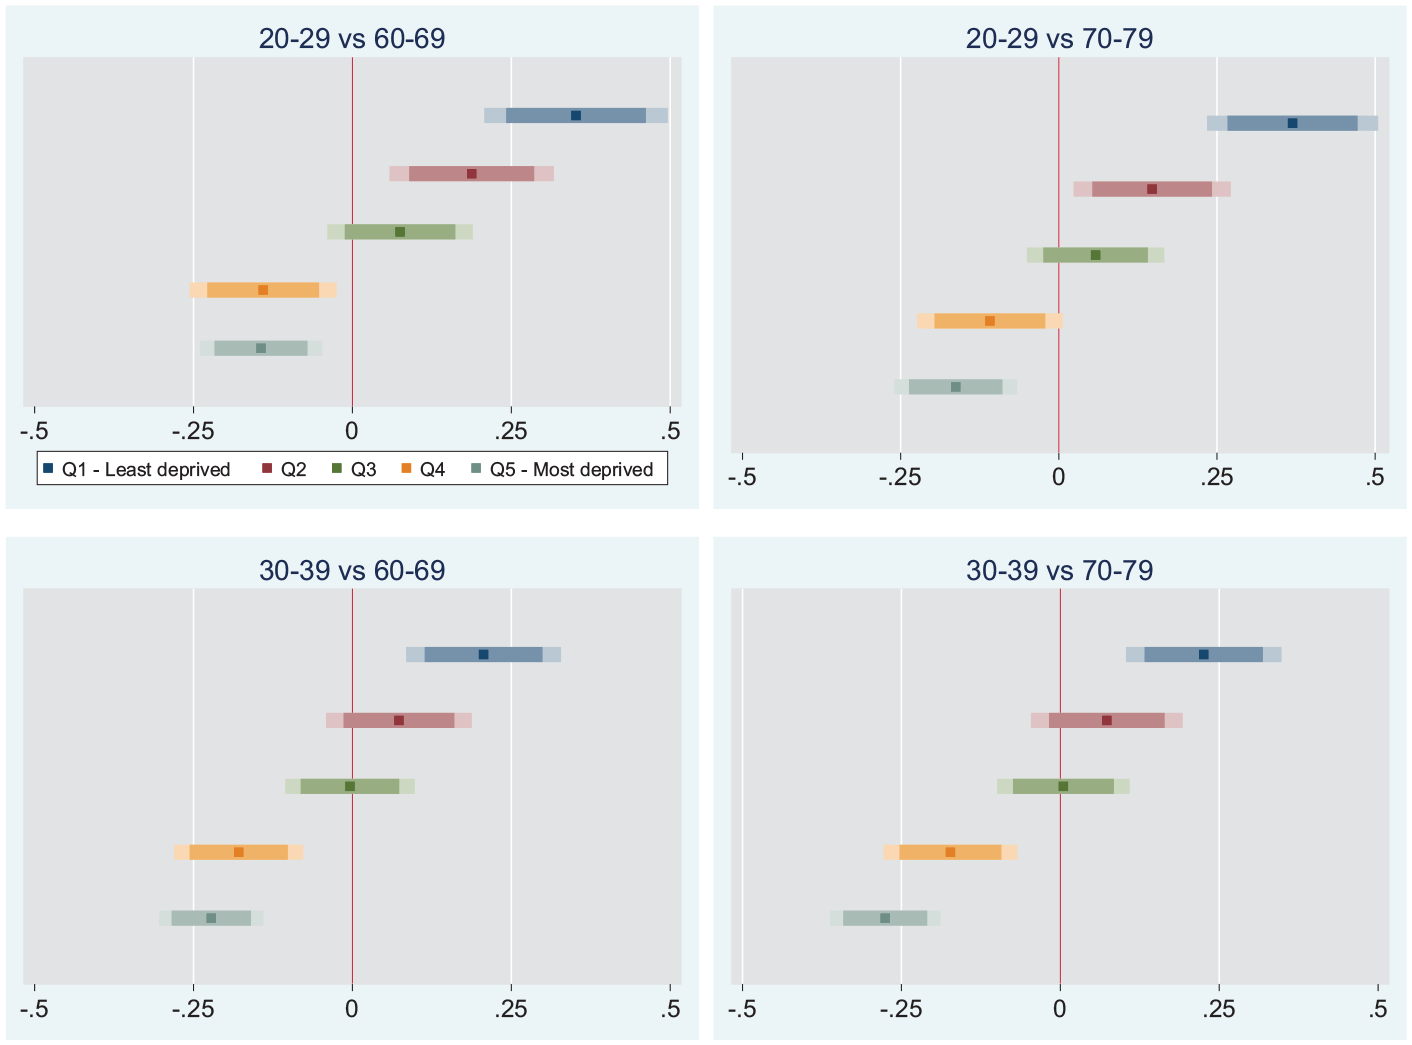
Parameter estimates for residential age segregation associated with housing unaffordability (for rentals) in urban areas through pair-wise age comparisons and quintiles of area-level household deprivation, England and Wales, 2011.
To summarise, our analyses using a novel indicator of housing affordability for sales and rentals in association with age segregation represented by the Dissimilarity Index, in a multi-level framework with area-level co-variates, have revealed a strong and significant positive association between increasing housing unaffordability and increasing residential age segregation across small areas of England and Wales. The associations are less strong for rural areas (villages) and the oldest group of younger adults (35–39) compared to older ages, but hold consistently across multiple age groups in ages 20–34 compared with older ages, and across urban areas. The impact of unaffordable housing on age segregation has a social gradient such that it is greatest in those areas that are least deprived, which correspond to the least affordable neighbourhoods.
Discussion and conclusion
Our results have evidenced the strong association between increasing housing unaffordability (for sales and rentals) and increasing residential age segregation (beyond other local characteristics) in urban areas. In other words, in England and Wales, as the gap between incomes and housing costs grows, older and younger populations are being residentially sorted such that age-mixing is reduced and spatial age-polarisation is growing, bringing increasingly age-homogenous neighbourhoods. Furthermore, this is most marked in rich (least deprived) neighbourhoods: the wealthiest parts of the country are becoming increasingly demarcated not only socio-economically but also by age.
It may be that the relationship between increasing housing unaffordability and increasing residential age segregation identified in this paper reflects the wealth differences between older and younger generations, a result of the life course accumulation of resources (Dorling, 2014). In addition, our findings point to current levels of housing unaffordability producing new spatial manifestations of age separation.
For the purposes of the elaboration of interpretation of our findings and their implications, let us focus on the results for the residential patterning of youngest young-adults (age 20–24) and young older-adults (age 60–64) for whom we see a particularly marked result. We have found that housing unaffordability is associated with increased residential segregation between these two groups. In other words, the residential spread of younger and older adults within local areas (MSOAs) is more uneven for places where housing is more unaffordable (as represented by the relation between average house prices and incomes). This is particularly emphasised in cities and towns, and in the least deprived (wealthiest) localities. Age segregation is also greatest in places with greater proportions of rental properties (and, conversely, more even in places with larger proportions of owner-occupied properties).
Why might we see these results? Following the directions of the literature outlined above, let us consider this in terms of housing markets and different life course–wealth residential trajectories of these generations. One plausible interpretation is that the wealthy urban localities with high proportions of private renting where unaffordability is creating segregation retain their attraction for younger and older populations yet the housing options of the young adults – with fewer economic resources and greater mobility – are reduced and they are squeezed to the more precarious (and cheaper) clusters of housing within the locality. In other words, and in line with Andersson et al. (2022), we can speculate that young adults moving into relatively wealthy urban neighbourhoods are unable to afford the parts of the neighbourhood with higher proportions of older residents and owner-occupied housing.
We can interpret the finding of age-mixing associated with increased housing unaffordability in the most deprived areas in parallel: one explanation may be that young adults (and, potentially, older adults) who find themselves economically excluded from less deprived localities are moving to more deprived neighbourhoods. We might speculate that this represents new forms of gentrification that are eschewing residential age mixing, and that this might be most prevalent in large urban centres (such as London, Manchester) that have seen both population growth and particularly steep increases in housing costs.
Further empirical exploration would unravel the nature of urban dynamics with regard to age, wealth, life course and housing markets. The limitations to the explanatory capacity of the analyses in this paper point to the need for future studies to consider within–area variation in housing affordability (and other area characteristics) alongside within–area variation in residence-by-age (age segregation). This would ideally be at a range of scales, including small area (e.g. Output Area within MSOA in a UK context) (Andersson et al., 2022). Any attempt to understand changing local age geographies will be incomplete without attending to the age-stratified demographic dynamics of local population change, particularly internal migration, and its socio-economic patternings. Age segregation research can be guided by ethnic segregation literature in finding understanding through a focus on the locally-embedded components of population change (Finney and Simpson, 2009b), with commonalities in the significance of age in shaping the ethnic compositions of neighbourhoods (Sabater and Catney, 2019).
Further work to understand the associations evidenced in this paper could also usefully take into account the socio-economic function (and change) of localities; and a longitudinal approach would be particularly valuable in understanding the processes of local population change (Coulter et al., 2020). Understanding more precisely the mechanisms through which housing unaffordability is connected to increasing residential age segregation undoubtedly also requires attention to housing decision making and access within younger and older cohorts, and the interactions between them. For example, Arundel and Hochstenbach (2020) have demonstrated that the differential ability of young adults to afford first-time homeownership in upward-trajectory housing markets is a contributory factor in the spatial polarisation of both housing markets and household housing wealth accumulation. Intergenerational relations also matter: a number of scholars have noted the significance of parental resources and intergenerational wealth transfers in supporting young adults in(to) home ownership (Arundel and Hochstenbach, 2020; Coulter et al., 2020). It may be that the effects of increasing housing unaffordability are compounded by differential financial capability within age groups such that the age segregation observed is cross cut and compounnded by socio-economic differences (wealth). In other words, housing market factors may be driving spatial polarisation simultaneously along age and class lines so that neighbourhoods are increasingly ‘young and poor’, ‘young and rich’, ‘old and poor’, ‘old and rich’. Corroboration of this will be possible for the UK context with the use of the forthcoming 2021/2022 Census data.
The increasing age segregation in association with rising housing unaffordability may also be seen as representing (being driven by) unfulfilled residential desire (Coulter, 2017), either in an inability to move or in an inability to move to the most desirable kind of place. We speak here of the inability of a household to meet its housing needs. For older people, being involuntarily ‘stuck’ in place may have negative consequences given that moving can be beneficial for wellbeing in later life (Finney and Marshall, 2018). When this is combined with reduced interaction with younger generations, which has been found to have socially isolating effects (Burns et al., 2012), this raises social and policy concerns. For younger people too, age segregation may reflect their reduced ability to meet housing needs (unfulfilled desire), which has been documented (Hoolachan and McKee, 2019). Residential and housing research can beneficially invest attention in better understanding residential needs and desires across the life course, how these are (not) being met, and how this is stratified by age, class and other aspects of social identity and differentiation.
A striking aspect of this paper’s findings is the strength of the relationship between housing unaffordability and age segregation in urban areas. Our results show that it is in towns and cities that housing market processes are most markedly shaping age sorting. It is clear that age segregation is interwoven with socio-economic segregation. Our findings show that the effect of unaffordable housing (for sales and rentals) on age segregation is greatest in the least affordable areas, which are also the richest (least deprived). This implies that age-related processes are integral to the trends observed more broadly of increasing spatial (socio-economic) polarisation (Van Ham et al., 2021). In other words, the neighbourhoods that are becoming increasingly isolated socio-economically may be also polarising in other ways, including along lines of age and generation. Segregation studies need to fathom, conceptually and methodologically, how to depict the intersecting axes of spatial inequalities.
Overall, we can conclude that the current urban housing markets in England and Wales, particularly the levels of and inequalities in affordability, are forcing people to separate residentially such that we see increasing age polarisation. We should be hesitant in suggesting that the drivers of the patterns and trends observed in this paper are about division between generations or an explicit desire from old and young to live separately, but are rather about the operation of housing market forces. In due course, so some arguments go, it may be that reduced cohesion and generational divisions result from spatial distance (e.g. Uhlenberg, 2000). Policy has an opportunity to intervene in relation to both Intergenerational Fairness and Levelling Up agendas, for example by facilitating settlement in the emerging age-mixed populations of more deprived urban locales and enabling affordable housing in more wealthy areas. No doubt, the role of housing markets needs more attention in the contemporary segregation literature. Urban Studies is important in this regard, for understanding housing desires and experiences, interrogating the operation of housing markets, in evidencing patterns of urban change and their drivers, and in specifying a policy agenda on the potential problems of residential age polarisation driven by housing inequalities.
Supplemental Material
sj-docx-1-usj-10.1177_00420980221121088 – Supplemental material for Age segregation and housing unaffordability: Generational divides in housing opportunities and spatial polarisation in England and Wales
Supplemental material, sj-docx-1-usj-10.1177_00420980221121088 for Age segregation and housing unaffordability: Generational divides in housing opportunities and spatial polarisation in England and Wales by Albert Sabater and Nissa Finney in Urban Studies
Footnotes
Acknowledgements
The authors are grateful to the Managing Editor, Professor Chris Leishman, and the three anonymous reviewers for their careful reading of our manuscript and their useful insights and suggestions. We also acknowledge and are grateful to the Urban Big Data Centre from the University of Glasgow for granting a sublicence to analyse rental price data derived from adverts of the Zoopla Property Group, and to the Office for National Statistics for the rest of the rich small area data on house prices and household incomes. Census data are copyright of the Crown and reproduced with permission of the Controller of HMSO. The authors alone are responsible for the interpretation of the data.
Declaration of conflicting interests
The author(s) declared no potential conflicts of interest with respect to the research, authorship, and/or publication of this article.
Funding
The authors disclosed receipt of the following financial support for the research, authorship, and/or publication of this article: This work was carried out with partial financial support from the Economic and Social Research Council through the ESRC Centre for Population Change under grant ES/R009139/1.
Supplemental material
Supplemental material for this article is available online.
References
Supplementary Material
Please find the following supplemental material available below.
For Open Access articles published under a Creative Commons License, all supplemental material carries the same license as the article it is associated with.
For non-Open Access articles published, all supplemental material carries a non-exclusive license, and permission requests for re-use of supplemental material or any part of supplemental material shall be sent directly to the copyright owner as specified in the copyright notice associated with the article.