
Abstract
The neighbourhood in which people live reflects their social class and preferences, so studying socio-spatial mobility between neighbourhood types gives insight into the openness of spatial class structures of societies and into the ability of people to leave disadvantaged neighbourhoods. In this paper we study the extent to which people move between different types of neighbourhoods by socio-economic status in different inequality and segregation contexts in four European countries: Sweden, the Netherlands, the UK (England and Wales), and Estonia. The study is based on population registers and census data for the 2001–2011 period. For England and Wales, which has long had high levels of income inequalities and high levels of socio-economic segregation, we find that levels of mobility between neighbourhood types are low and opportunities to move to more socio-economically advantaged neighbourhoods are modest. In Estonia, which used to be one of the most equal and least segregated countries in Europe, and now is one of the most unequal countries, we find high levels of mobility, but these reproduce segregation patterns and it is difficult to move to less deprived neighbourhoods for those in the most deprived neighbourhoods. In the Netherlands and Sweden, where income inequalities are the smallest, it is the easiest to move from the most deprived to less deprived neighbourhoods. The conclusion is that the combination of high levels of income inequalities and high levels of spatial segregation tend to lead to a vicious circle of segregation for low-income groups, where it is difficult to undertake upward socio-spatial mobility.
Introduction
Social inequality and residential segregation are increasing in European countries and cities (Piketty 2014; Tammaru et al., 2016). Although segregation per se need not necessarily be a problem (see for instance Merry, 2016), it can lead to a range of social problems. These problems can operate through negative neighbourhood effects on, for example, education and employment (e.g. Nieuwenhuis and Hooimeijer, 2016; Nieuwenhuis et al., 2013, 2017; van Ham et al., 2012), high levels of segregation may affect the opportunities people have in life and this may lead to a ‘vicious circle of segregation’ for low-income individuals, that often operates over generations (Tammaru et al., 2017). The spatial concentration of low-income groups in neighbourhoods with affordable housing arises because of their limited financial resources which restricts options in the housing market. Since most children attend the school nearest to their home, residential segregation is often reproduced in school segregation, which in turn can lead to labour market segregation (see, for instance, Harris, 2017). Cumulatively, the residential to school and work trajectory translates into different incomes and affects where people live (van Ham et al., 2018). These socio-spatial structures are then inherited from one generation to the next (Hedman et al., 2015; Sharkey, 2013). Hence, housing and segregation become part of overall structures of social inequalities in our societies.
When the consequences of individual poverty and living in a deprived neighbourhood are observed within a life course framework (de Vuijst et al., 2016; Kleinepier et al., 2018), it becomes important to ask whether these phenomena are temporary or structural in an individual’s life. High levels of income inequalities and socio-economic segregation in a country may become an obstacle for upward social and spatial mobility (Nieuwenhuis et al., 2016), and consequently, the existing social and spatial structures may become more rigid over time. It can be expected that the ability of people to move from a deprived neighbourhood to a more affluent neighbourhood is related to the overall opportunities for socio-spatial mobility in a country. If this is the case, and if living in a deprived neighbourhood negatively affects socio-spatial mobility, then a vicious circle of deprivation may occur (van Ham et al., 2018).
This paper investigates socio-spatial mobility defined as movement of people between different residential neighbourhoods with differing levels of social deprivation. We are particularly interested in the extent to which people can move from a more deprived to a less deprived neighbourhood – that is, to undertake upward socio-spatial mobility – in different countries representing different inequality and segregation contexts. While comparative research on segregation has started to emerge (Arbaci, 2007; Maloutas and Fujita, 2012; Tammaru et al., 2016), there is hardly any comparative research on socio-spatial mobility. One reason for a lack of comparative studies is the lack of comparative longitudinal data. Research on patterns of segregation can rely on (repeated) cross-sectional data but studying socio-spatial mobility requires individual-level longitudinal data, where individuals can be followed between at least two points in time. This paper uses longitudinal census data and register data from Estonia, the Netherlands, Sweden, and England and Wales, to answer the following research questions:
To what extent are there between-country differences in the extent to which people move between neighbourhoods with different deprivation levels?
To what extent are there between-country differences in people’s ability to move from the most deprived to the least deprived neighbourhoods?
Can country-specific characteristics – most notably levels of inequality and residential segregation – help us to better understand the between-country differences in the spatial mobility patterns across neighbourhoods with different levels of deprivation?
The choice of countries for comparison, Estonia, Sweden, the Netherlands, and England and Wales, is partially pragmatic, because of data availability, but also because they represent very different income inequality and residential segregation contexts. Estonia used to have one of the lowest levels of income inequalities and socio-economic segregation when it was part of the Soviet Union (Marcińczak et al., 2015). During the large-scale social transformations in Eastern Europe after the fall of the Berlin Wall in 1989, Estonia has become one of the most unequal and residentially segregated countries in Europe (Musterd et al., 2017). In England and Wales income inequalities and residential segregation have been high for decades (Manley and Johnston, 2014). Income inequalities in Sweden and in the Netherlands are low compared with Estonia, and England and Wales, although especially in Sweden the level of inequality and segregation is rising sharply (Andersson and Kährik, 2016; Musterd and van Gent, 2016). To account for deprivation levels, we employed individually linked population register data on social benefits for the Netherlands and Sweden, while for England and Wales, and Estonia we used individually linked census data on unemployment for the years 2001 and 2011.
Factors shaping differentialsocio-spatial mobility between socio-economic groups
Residential segregation between socio-economic groups is largely a result of selective residential mobility into and out of different types of neighbourhood as well as between cities, albeit that in situ changes within neighbourhoods also play a role (Bailey et al., 2017). One of the first frameworks to understand socio-spatial mobility patterns generating residential segregation was provided by the Chicago School (Park et al., 1925). Their explanatory framework refers to the ‘natural forces’ that adapt people to their environment and leads to the sorting of different social groups into different parts of the city. This framework was developed further through a factorial ecological approach (Berry and Kasarda, 1977) and GIS-based segregation studies and advanced spatial modelling (Wong, 2003), demonstrating that residential segregation is largely a function of (a) people sorting into neighbourhoods based on their individual and household characteristics, and (b) spatial distribution of housing and a households’ preferences towards certain types of housing. This sorting is a consequence of spatial mobility between cities of different sizes and rural municipalities (Champion, 2001; Fielding, 1998; Geyer and Kontuly, 1993), between the city and suburbs (Hochstenbach and Musterd, 2018; van den Berg et al., 1982), and between neighbourhoods within cities (Clark and Onaka, 1983; Madrazo and van Kempen, 2012).
Individual and household characteristics affecting socio-spatial mobility
When it comes to individual and household characteristics, differences in resources are often considered to be the most important driver of differential socio-spatial mobility of socio-economic groups (Rex and Moore, 1967). Income is the most important resource as money buys choice on the housing market (Hedman et al., 2011; Hulchansky, 2010), but other resources such as education, knowledge, and networks, are also part of the mobility capital required by households (Kaufmann et al., 2004). However, income and other resources do not explain all differences in socio-spatial mobility between groups as differential residential preferences also play a role (Clark and Fossett, 2008; Mulder, 2007). The combination of high resources and residential preferences of the top socio-economic groups are usually driving up levels of residential segregation as they strive to translate their income into living in the most attractive cities and neighbourhoods (Hulchansky, 2010; Maloutas, 2016). Housing has become a key element of the investment portfolios of high-income households, pushing up house prices in the most desired neighbourhoods (Madrazo and van Kempen, 2012; Préteceille, 2007). Increasing house prices and rents in certain neighbourhoods, combined with reductions in social and housing benefits, have resulted in undesired mobility of lower income households who are forced to leave certain neighbourhoods. Increasing prices can also lead to undesired immobility for low-income households, who are unable to move to better neighbourhoods because of a lack of resources (Coulter et al., 2015).
Residential choices are also influenced by factors such as the life course stage of a household, and the household size and composition. These factors influence the type, size, tenure and price of dwellings that households need (Leetmaa et al., 2015; Madrazo and van Kempen, 2012; Rossi, 1955). Previous research shows that young people aged between 20 and 35 are by far the most mobile age group; households living in small dwellings and renters are more mobile than households living in larger dwellings and owners; and mobility and residential choices are often related to events in other important life domains such as family formation and dissolution, education and job career (Dieleman, 2001; Kulu, 2008; Kulu et al., 2018). Demographic trends such as population ageing or increasing numbers of single parents further affect socio-spatial mobility, often by reducing mobility because of spatially bounded social and kin networks needed to facilitate the exchange of physical care, childcare and other forms of assistance (Coulter et al., 2015). Such mutual support is especially important for lower-income groups, thus reducing further their spatial mobility and facilitating residential rootedness (Cooke, 2011; Preece, 2017).
In most countries there are also substantial differences in socio-spatial mobility and residential segregation between ethnic and racial groups. Although spatial assimilation theory predicts that immigrants progressively integrate residentially (Alba and Nee, 1997; Park et al., 1925), levels of ethnic segregation remain high in European cities (Arbaci, 2007; McAvay and Safi, 2018). A main factor is the high rate of immigration, which can put the housing sector under pressure, especially in major cities (Pittini et al., 2017). Within cities, immigrants search for affordable housing, which is often clustered in specific low-income, often already immigrant-dense, neighbourhoods (Andersson and Kährik, 2016; Wessel, 2016). Place stratification theory highlights the constraints to socio-spatial mobility of ethnic minorities. Ethnic minorities tend to be less successful on the labour market (Gorodzeisky and Semyonov, 2017), and their residential choices are partly shaped by the preferences of both the major and minor groups to live together with co-ethnics (Clark and Fossett, 2008), and discrimination on the labour and housing markets by the majority population (Auspurg et al., 2017; Zschirnt and Ruedin, 2016). The school choice of families also matters as parents of the native population tend to choose their residential neighbourhood based on school quality, and that often means leaving or avoiding neighbourhoods with higher levels of deprivation and a higher presence of ethnic minorities (Bernelius and Vaattovaara, 2016; Boterman, 2013; Wessel and Nordvik, 2018). As before, it is probable that those in minority groups are less likely to be able to afford to explore such choice because of financial constraints.
Housing and other institutional and macro-level factors affecting socio-spatial mobility
Socio-spatial mobility is related not only to individual and household characteristics and preferences, but also to macro- and institutional-level factors and policies that affect differential access to housing by socioeconomic groups (Andersen et al., 2016; Madrazo and van Kempen, 2012; Musterd and Ostendorf, 1998). These factors operate at different levels (Dieleman, 2001; Tammaru et al., 2016). For example, labour market dynamics are strongly affected by global influences, while demographic developments, welfare systems and housing policies are mainly set on national levels, and housing prices and tenure structures vary between and within the cities. There is an ongoing debate about whether globalisation brings along professionalisation or polarisation to labour markets (Butler et al., 2008; Hamnett, 1994; Tammaru et al., 2016). In European immigration countries, the outcome of globalisation is rather an ethnically divided labour market with professionalisation and higher incomes being more common among the native workforce compared with immigrants and ethnic minorities (Costa and de Valk, 2018; Marcuse and van Kempen, 2002). Globalisation and its effects on labour markets is thus one of the root causes for the growth of income inequality since the 1980s (Alvaredo et al. 2018).
Although the growth of income inequality is a global phenomenon, national-level policies play a role in how equally or unequally incomes are distributed in a given society. In our case study countries, the Gini index is lowest in Sweden (25), followed by the Netherlands (27), England and Wales (32), and Estonia (35). Higher levels of income inequality reduce intergenerational social mobility, a phenomenon that has been popularised as a Great Gatsby Curve (Krueger, 2012). In other words, differences in country-level policies lead to very different inequality and social mobility contexts. In the UK and Estonia, income inequalities are high and there is much less social mobility compared with Sweden and the Netherlands (Figure 1). Socio-spatial mobility is further shaped by access to housing; housing policies can reduce or increase the role of income inequality in generating differential socio-spatial mobility patterns of socioeconomic groups (Fujita and Maloutas, 2012). Housing systems vary between countries in many ways, for example when it comes to the share of homeownership, the tenure structure, rental regimes (dual/unitary), the allocation of social housing, and housing subsidies to low-income groups (Kemeny, 1995; Pittini et al., 2017). Housing is also one of the most costly policy fields and a high burden for the budgets of many European countries. The roll-back of welfare states in the past few decades has thus strongly affected housing in Europe, leading to increased importance of market forces in the housing sector (Andersson and Kährik, 2016).
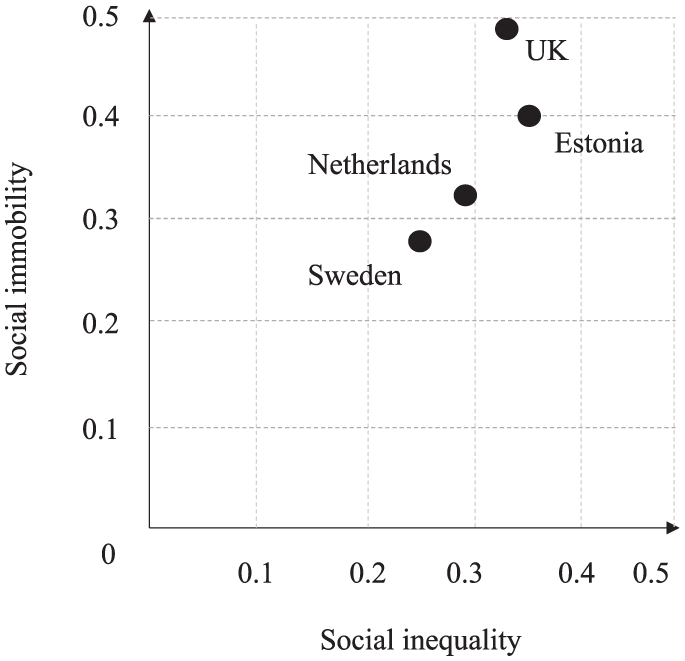
Income inequality (Gini index) and intergenerational social immobility (income elasticity) in the case study countries.
Changes in national-level housing policies have been especially harmful for low-income groups (Dewilde and De Decker, 2016), who have retreated to residualised social housing in the cities (Kleinhans and van Ham, 2013), or moved out from major cities altogether (Fitchen, 1995; Hochstenbach and Musterd, 2018). For high-income groups, the most important large-scale trend has been gentrification (Tammaru et al., 2016). Temporarily, this brings along social mixing, followed by an increase of segregation as high-income groups take over the city centres where socio-economic upgrading of desirable neighbourhoods takes place (Atkinson and Bridge, 2005; Leal and Sorando, 2016). The out-migration of low-income groups from the central parts of major urban regions, and the clustering of high-income groups in the centre has led not only to increased socio-economic segregation within European cities (Tammaru et al., 2016), but contributes to persistent regional socio-economic divides as well (Adams et al., 2016).
At the city level, urban planning shapes the location of different types of dwellings in different parts of the city (Clark and Fossett, 2008), but planning also affects the locations of other factors important in residential decision making such as workplaces (Dieleman, 2001), schools and other amenities important for families with children (Méndez and Gayo, 2018). The more homogenous neighbourhoods are, in terms of housing, the more likely it is that different socio-economic groups sort into different types of housing and into different types of neighbourhoods. For example, in cities with large numbers of modern housing estates built in the 1960s through the 1980s, such neighbourhoods have become areas where lower-income groups tend to concentrate (Andersson and Kährik, 2016; Hess et al., 2018; Wessel, 2016). In countries with social mixing policies still firmly in place, such as Finland, levels of segregation rise at a slower rate (Saikkonen et al., 2018).
Relations between income inequality, residential segregation and socio-spatial mobility
Income inequality is positively correlated to socio-economic segregation (Musterd and Ostendorf, 1998) and negatively to intergeneration social mobility, with the latter relationship being popularised as a Great Gatsby Curve (Krueger, 2012). It follows that, in a context of high income inequality, not only will residential segregation be high, but it follows that the fortunes of children will depend more on the fortunes of their parents compared with children growing up in a low-inequality context. As income inequality reduces social mobility, there are reasons to expect that higher levels of residential segregation reduce socio-spatial mobility as certain neighbourhoods get out of the reach of low-income households. Put differently, the higher the level of income inequality and the level of residential segregation between socio-economic groups, the more rigid the socio-spatial structure of the society becomes and the more difficult it is to undertake socio-spatial mobility. However, at times of growing income inequality and residential segregation, socio-spatial mobility may be intense as low-income and high-income groups sort into different neighbourhoods of the city. Estonia is an interesting case in this respect. As a result of dynamic macro-economic changes, Estonia has moved from the group of countries with the lowest level of income inequality (Gini was 23 in 1990) to the group with the highest level of income inequality (35) in Europe by today.
As with social mobility, there is a strong intergenerational dimension to socio-spatial mobility as socio-spatial disadvantages tend to be transmitted from parents to children, both (a) directly as parental wealth is important for children in entering the housing market, and (b) indirectly, via the transmission of context as children end up living in similar places to their parents and are thereby subject to similar contextual influences (d’Addio, 2007; Hedman et al., 2015; Hochstenbach and Boterman, 2017; Sharkey, 2013). Furthermore, parents not only have an important role in shaping the educational choices of their children but also influence the school choice of their children since schools are often neighbourhood based (Benson et al., 2014). Hence, the inter-generational transmission of wealth and poverty has both social and spatial dimensions (Nieuwenhuis, 2018; van Ham et al., 2018).
The intergenerational transmission of residential (dis)advantage continues as children leave their parental home. Children who grow up in affluent neighbourhoods often experience a temporary drop in the socio-economic status of their neighbourhood when they leave the parental home (moving to student housing), but they are likely to end up in high status neighbourhoods later in life (van Ham et al., 2014). This is partly caused by parental wealth shaping their residential careers (Hochstenbach, 2018). For young people from more affluent families, the ‘Bank of Mum and Dad’ often helps them by co-financing the start of their housing career. In England and Wales, about 25% of homebuyers rely on parental help (The Guardian, 2017). What is more, such intergenerational wealth transmission elevates housing prices, with the effect that the most desirable segments of the housing market get out of the reach of those who are less well off. This leads to a weakening of the link between house prices and income from work (Marcińczak et al., 2017).
Hypotheses
Previous research has established that higher levels of income inequality tend to increase socio-economic segregation and to reduce social mobility. We hypothesise that higher levels of residential segregation between socio-economic groups also reduces socio-spatial mobility between neighbourhood deprivation types; in other words, that the Great Gatsby Curve characterises not only social but also socio-spatial processes. The mechanism that links higher levels of socioeconomic residential segregation to reduced socio-spatial mobility is based on spatial differences in house prices between cities and between neighbourhoods. As income inequality rises, house price differences between neighbourhoods and levels of socioeconomic segregation rise as well; as a result there is less choice for low-income groups. At times of growing income inequalities, socio-spatial mobility can temporarily increase as high-income and low-income groups sort into different neighbourhoods.
In general, as levels of residential segregation grow, it is increasingly difficult for low-income households to undertake upward socio-spatial mobility. The saturation point is determined by country-specific contextual factors. Based on the levels of income inequality in our case study countries, we expect that it is easier to move from deprived neighbourhoods to less deprived neighbourhoods in Sweden and in the Netherlands than in England and Wales, and Estonia. We also expect intense upward and downward socio-spatial mobility in Estonia since this country has moved from being a low inequality to a high inequality country, which is likely to result in an intense sorting process of low-income and high-income groups into different dwellings and neighbourhoods.
Data and methods
Data for this study came from linked national registers and censuses. Because we are interested in socio-spatial mobility, longitudinal data are crucial to enable the identification of moves of individuals between neighbourhood types (see below). For the Netherlands, we used population register data from the Statistics Netherlands’ System of Social Statistical Datasets (SSD). The SSD is an extensive system of longitudinal data sets, combining, amongst others, population, tax, and housing registers, covering the full population of the Netherlands since 1999. Geographic information is available on a 100 m × 100 m and 500 m × 500 m grid cell basis (Bakker et al., 2014). In this study, we used 500 m × 500 m grid cells, which is consistent with the average neighbourhood sizes of about 1000 inhabitants.
The Swedish data source is also a population register, derived from Statistics Sweden and compiled into the GeoSweden database owned by the Institute for Housing and Urban Studies. The database contains annual demographic, geographic, socio-economic and housing information on the entire Swedish population since 1990. The lowest spatial units in the data consist of 100 m × 100 m grid cells, which have been merged into 500 m × 500 m grids for the current study, which makes them comparable with the units used for the Netherlands. Using only areas with a minimum of five in-sample inhabitants (see later in this section), the neighbourhood population in these areas varied from five to 5465 people, with a mean of 61.19 people (because of many sparsely populated areas in the country).
The data for England and Wales were derived from the 2001 and 2011 censuses. For the purpose of this study we used Lower Super Output Areas (LSOAs) as geographical units. These areas are frequently used by the UK Government as functional neighbourhoods for policy delivery and assessment. Critically, for the analysis presented, the LSOAs have remained largely consistent 1 between the two census periods, allowing the comparison of population characteristics without the concern of change in areal boundaries influencing results. Because we were interested in following individuals over time rather than simple comparable totals for the LSOAs the data used are specially derived from the Office for National Statistics Longitudinal Sample (ONS-LS), 1% of the population of England and Wales. The advantage of these data is the potential for linkage over time, a disadvantage is that, unlike the registers from Sweden and the Netherlands, and the Estonian data, it is a sample, not the full population.
Data for Estonia came from the two last censuses of 2000 and 2011, and included the full population of Estonia. Statistics Estonia has linked the 2000 and 2011 censuses by personal identification code. The database included the full set of demographic, geographic, socio-economic, and housing information as regularly collected in censuses, as well as the smallest spatial planning units of the country of approximately 1000 people on average.
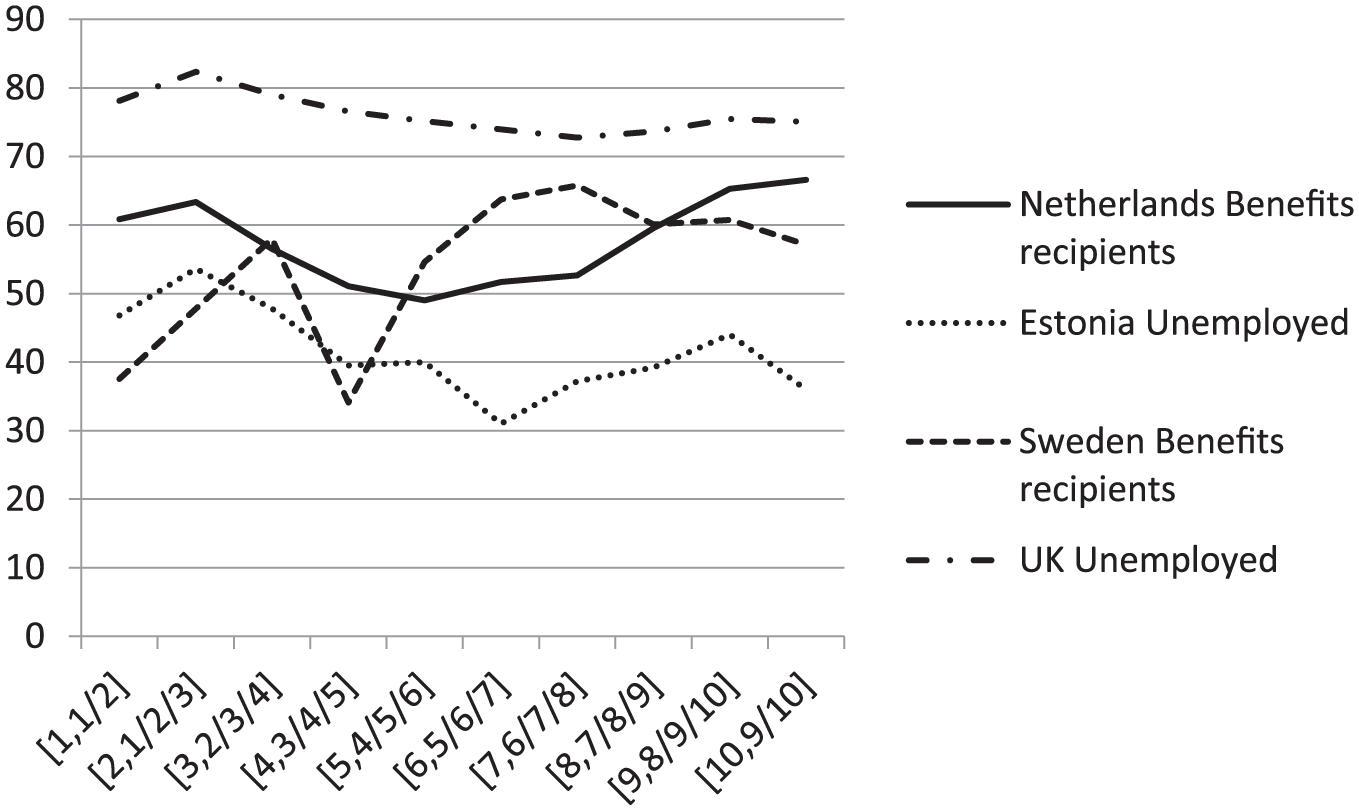
For each country we selected all individuals in the data living independently (i.e. not living at home with their parents in 2001 and not institutionalised in both 2001 and 2011), and who had a valid address in the data in both years. We selected both movers and non-movers, because the immobility of non-movers also reflects differences between countries’ spatial mobility patterns: in some countries it may be more difficult to be residentially mobile. For all four countries we had access to the following information: the neighbourhood in which individuals lived on 1 January 2001 and on 1 January 2011, and a measure for the level of neighbourhood deprivation of the 2001 and 2011 neighbourhoods. Because of the differences in data collection between the four countries, there was no simple way to construct comparable data. To make the data as comparable as possible, we identified the most comparable measures of neighbourhood deprivation in each of the national data sets (see Table 1).
Comparison of measures and data between the four countries.
Sources: Eurostat, (2017) Statistics Estonia, Statistics Netherlands, Statistics Sweden, ONS, GB Statistics Authority.
To compare socio-spatial mobility patterns between the four countries, we created four 10 × 10 matrices for individuals combining deprivation in the neighbourhood of origin for 2001 with deprivation in the neighbourhood of destination in 2011 (see Appendix A; Tables A1–A4). Although deprivation is a continuous measure we categorised it into deciles measuring the proportion of individuals receiving unemployment benefits or social security benefits (the Netherlands and Sweden) or the proportion of individuals registered as unemployed (England and Wales, and Estonia). The reason for choosing different indicators in different countries is pragmatic and data-driven: we were unable to find suitable measures that were exactly the same. However, by choosing unemployment and people who are on unemployment or social security benefits, we used two measures that are clearly related to each other, which maximises comparability. The deciles of neighbourhood deprivation are country-based and were calculated for the full population of each country, excluding those not at risk of becoming unemployed, that is, those individuals who were older than 65, children living at home, and institutionalised individuals.
Results
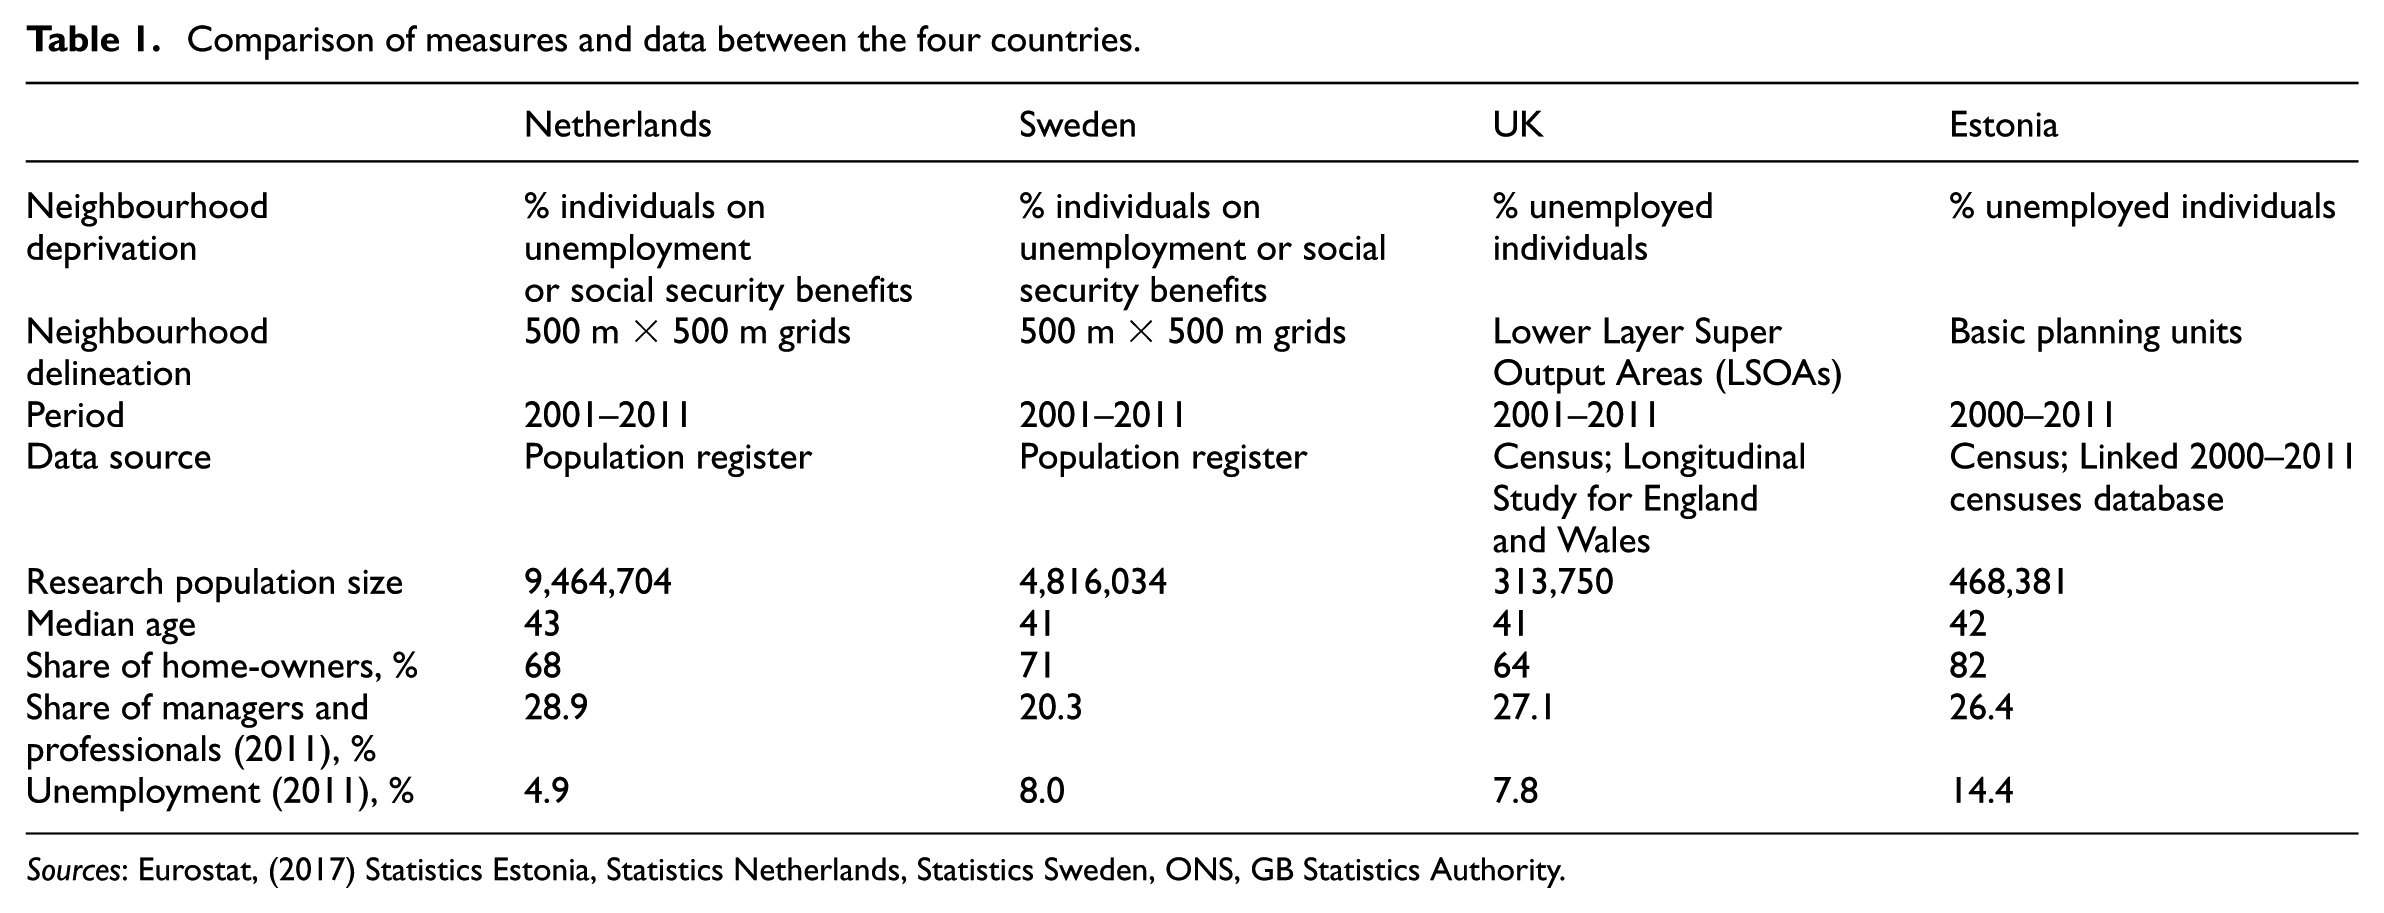
By plotting a socio-spatial mobility curve for each country (Figure 2) we first examine the share of people remaining in the same decile of neighbourhood deprivation over the 2001–2011 period in the four countries. The lines show the relative stickiness of the population in neighbourhood deprivation deciles. Decile 1 are the least deprived neighbourhoods and decile 10 are the most deprived neighbourhoods. The ‘U-shape’ of the mobility curve is similar in all four countries; people who live in the least deprived and most deprived neighbourhoods are the most likely to stay in a similar neighbourhood compared with people living in more socially mixed neighbourhoods. This outcome can have two explanations. First, there may be a methodological explanation because there are both floor and ceiling effects in the data: people living in the most (and least) deprived neighbourhoods cannot move to neighbourhoods that are even more (or less) deprived. The second explanation is more substantive. Those with low incomes have fewer resources to move upwards, while more affluent people are likely to stay where they are because they are satisfied with their living conditions, thus reducing their willingness to move. People living in socio-economically mixed areas are more likely to move either downward or upward within the neighbourhood hierarchy to satisfy their desires and preferences.
Percentage of individuals that lived in an area within the same decile of deprivation in 2001 and 2011. The notation [X,Y] means: X = decile in 2001, Y = decile in 2011. 1 = the least deprived decile; 10 = the most deprived decile.
If the substantive interpretation is correct, we expect to find differences in socio-spatial mobility between our case study countries that would reflect their income inequalities and residential segregation contexts. Returning to the figure, there is a stark contrast in socio-spatial mobility between England and Wales on the one hand and Estonia, Sweden and the Netherlands on the other hand. The mobility curve across neighbourhood deprivation levels is much flatter in England and Wales than in the other three countries, that is, people living in England and Wales are more likely to remain in the neighbourhood deprivation type of origin than people living in the other three countries. The contrast between England and Wales and the other three countries becomes even more pronounced when examining how many people lived in an area with the same decile of deprivation in 2001 and 2011. In England and Wales 60–70% of the people have not experienced any change in neighbourhood type over that period, while only 10–50% of people have been socio-spatially immobile in Estonia, Sweden and the Netherlands. Thus, the substantive interpretation is supported.
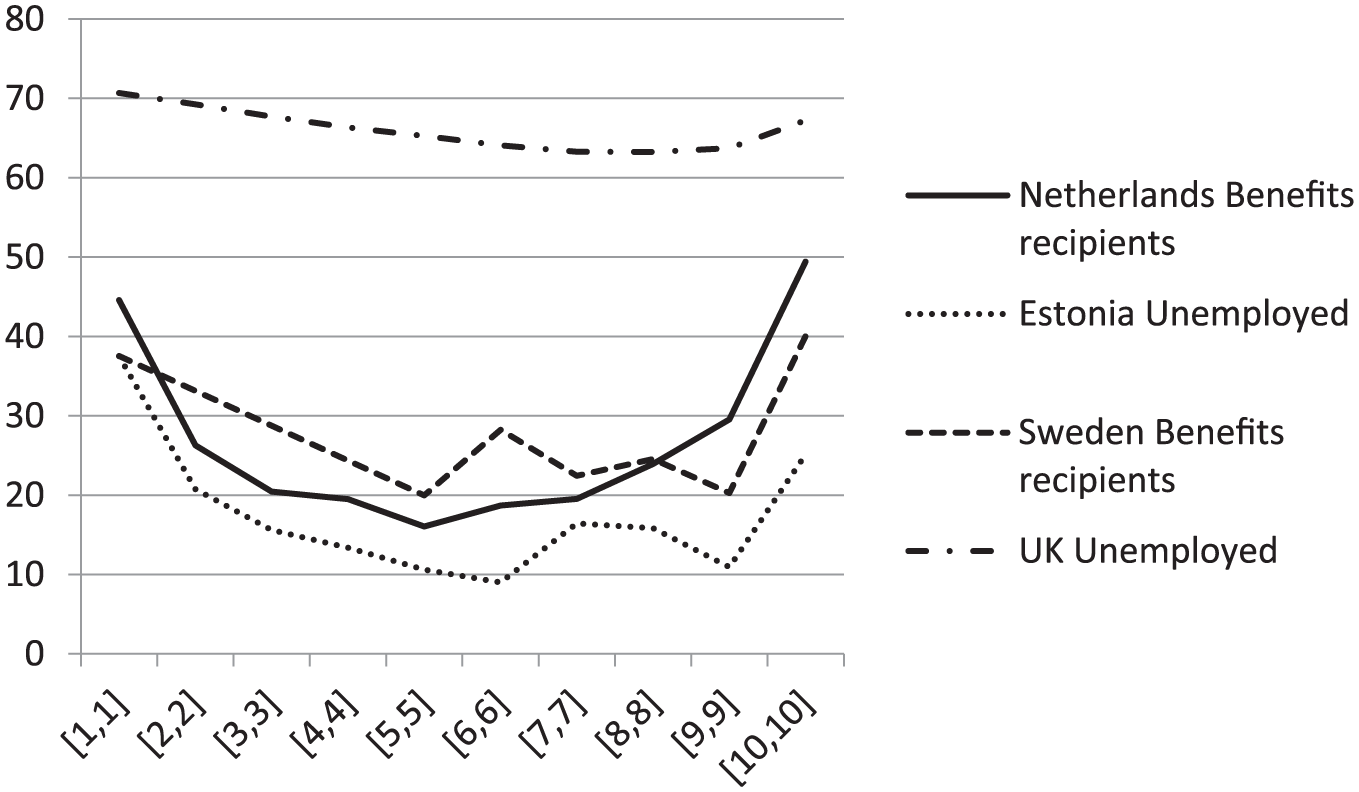
Most moves take place between neighbouring decile categories, that is, people tend to move to neighbourhoods that are either one decile ‘up’ or ‘down’ compared with the origin neighbourhood. In other words, spatial mobility generally does not result in dramatic changes in the social-spatial context where people live. It is also possible that people may live in a neighbourhood that is on the ‘border’ of a decile, so a relatively small shift in socio-economic status may move this neighbourhood to the next decile ten years later, whilst a larger move in the middle of a decline group may not be recorded at all. To avoid the former problem and because we are interested in the more substantial shifts in the socio-spatial context of mobile people, we will combine people who live in the neighbourhood with the same, and one lower, or one higher decile of deprivation between 2001 and 2011. Figure 3 shows that, having combined these groups, the differences between countries are now less pronounced, but still indicating that there is more socio-spatial stickiness in England and Wales compared with Estonia, Sweden and the Netherlands. More in-depth analysis of our data shows that only 10–20% of the change of neighbourhood deprivation context is because neighbourhoods themselves change deprivation decile because of neighbourhood social upgrading or downgrading. This implies that most of the change we capture in our analyses is due to people moving between neighbourhoods. Still, the most common mobility pattern relates to moving to a neighbourhood with a similar socio-economic profile to that of the neighbourhood of origin. Comparing Figure 3 with Figure 2 shows that about 50% of the socio-spatial mobility in all four countries is micro-mobility – that is mobility between adjacent deciles.
Percentage of individuals that lived in an area within the same, one lower, or one higher decile of deprivation in 2001 and 2011. The notation [X,Y] means: X = decile in 2001, Y = decile in 2011. 1 = the least deprived decile; 10 = the most deprived decile.
The country ranking in Figure 3 is similar to that in Figure 2; people in England and Wales are the least mobile and people in Estonia move most between neighbourhood types. The pathways for Sweden and the Netherlands cross, indicating that, in the Netherlands, people living in the less deprived neighbourhoods are socio-spatially more mobile compared with Sweden, but in Sweden, people living in the most deprived neighbourhoods are socio-spatially more mobile than in the Netherlands. Furthermore, the mobility curve in Sweden is not ‘U-shaped’ after aggregating moves to neighbouring deprivation decile categories. This indicates stronger residential stability in the socially mixed neighbourhoods than in the other three countries.
The spatial isolation of low-income groups is often seen as the most negative side of high levels of social segregation. Hence, we are particularly interested in the ability of people in these groups to move out from the most deprived neighbourhoods into less deprived neighbourhoods (i.e. upward socio-spatial mobility). The differences between countries in the percentage of people that move to less deprived neighbourhoods by at least two deciles (Figure 4) and that move to more deprived neighbourhoods by at least two deciles (Figure 5) shows another part of the story.
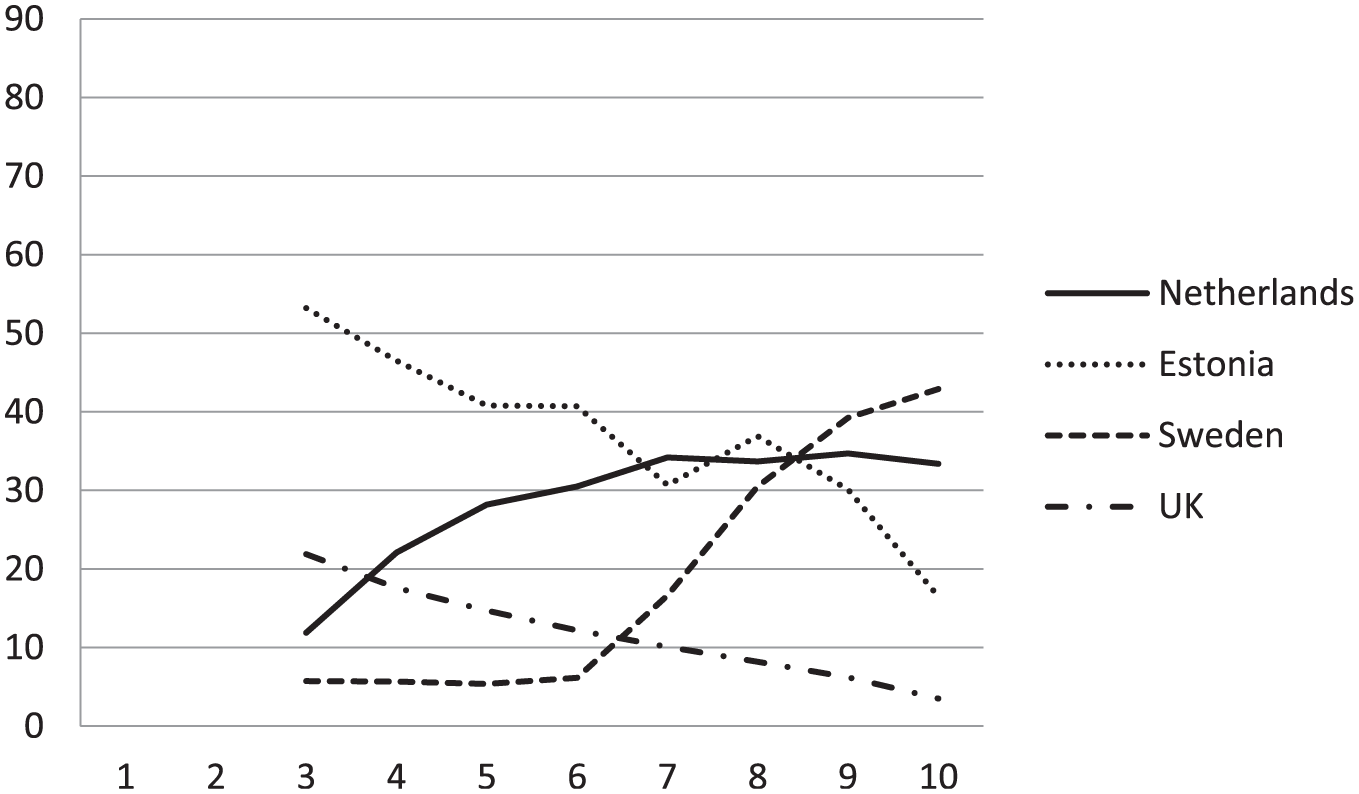
The percentage of moving individuals by country and origin decile who
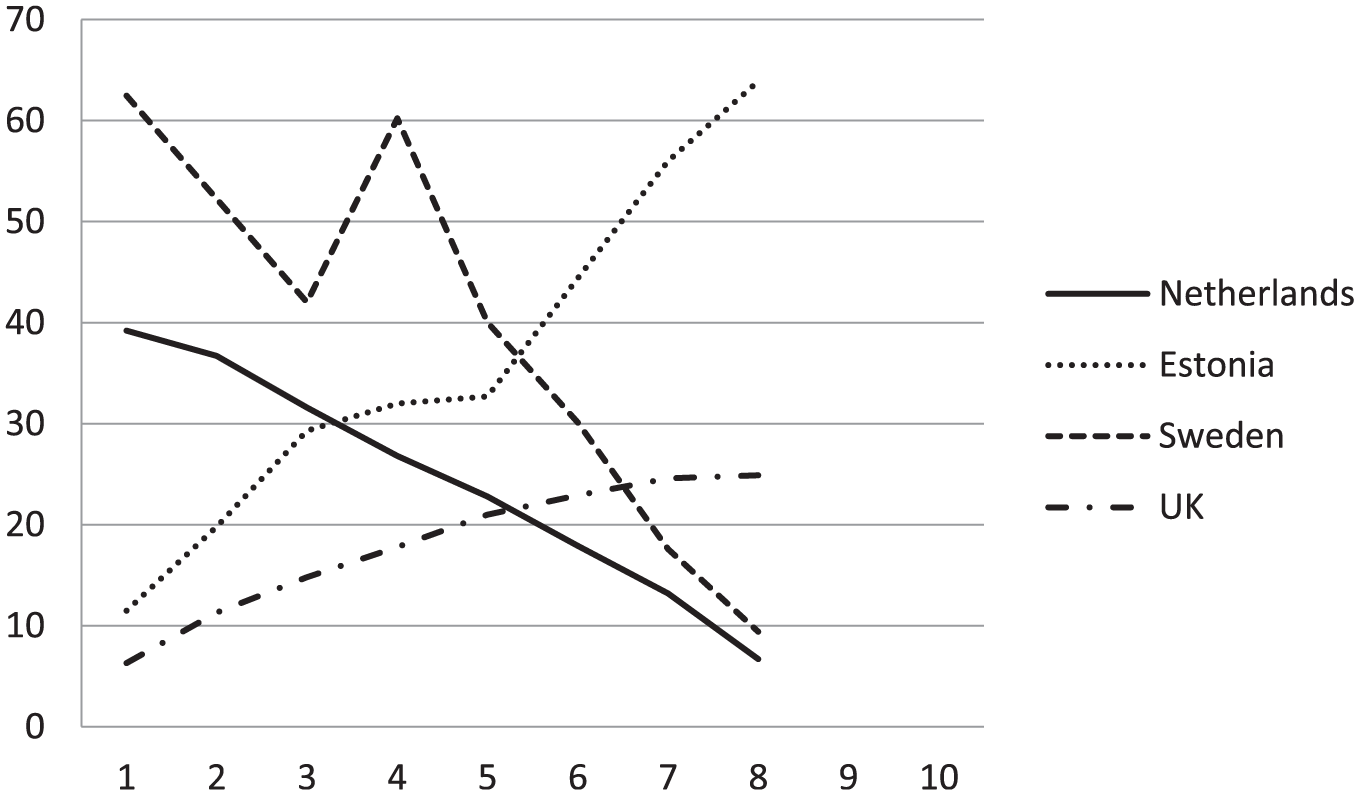
The percentage of moving individuals by country and origin decile who
Figure 4 shows that both in England and Wales and in Estonia, people who lived in less deprived neighbourhoods (lower deciles) in 2001 more often moved to less deprived neighbourhoods in 2011 compared with people who lived in more deprived neighbourhoods (higher deciles) in 2001. In other words, segregation between income groups seems to be growing. In contrast, in Sweden and the Netherlands the pattern is the opposite. Here people who lived in more deprived neighbourhoods in 2001 more often moved to less deprived neighbourhoods in 2011 compared with people who lived in less deprived neighbourhoods in 2001. In comparative terms, in Sweden and the Netherlands socio-spatial mobility reproduces segregation less than in Estonia and England and Wales. Figure 5 complements this picture and shows that in England and Wales and in Estonia, people who lived in more affluent neighbourhoods in 2001 (lower deciles) were less likely to move to more deprived neighbourhoods compared with people who lived in more deprived neighbourhoods in 2001. And again, Sweden and the Netherlands show the opposite picture, where people who lived in more affluent neighbourhoods in 2001 more often moved to more deprived neighbourhoods in 2011 compared with people who already lived in more deprived neighbourhoods in 2001.
Conclusions and discussion
Our main findings show that people in England and Wales are the most socio-spatially immobile in terms of moving between neighbourhood types, and that people in Estonia are the most mobile. The intensity of mobility between neighbourhoods of different deprivation levels in Sweden and the Netherlands falls in-between. Furthermore, it is the easiest to move out from the most disadvantaged neighbourhoods in the Netherlands and especially in Sweden.
In England and Wales, the level of income inequality and segregation are high and taken together this has created rigid socio-spatial structures; not only social mobility but also socio-spatial mobility is low because of the large social distance between neighbourhood types. Estonia is a different story as it used to have a very equal income distribution and low levels of segregation under central planning in Soviet times, but after 1991 it has adopted a very liberal welfare regime with high levels of homeownership. This resulted in the rapid growth of income inequalities in the 1990s. As higher-income groups started to translate their economic success into better living conditions, socio-spatial mobility and sorting by income increased in the 2000s. Consequently, Estonia shifted from the position of one of the least socio-economically segregated countries to one of the most segregated countries in Europe in the 2000s. The Netherlands and Sweden, in comparative perspective, still represent strong welfare regimes that allow not only relatively easy upward social mobility but also relatively easy upward socio-spatial mobility.
High income inequalities increase levels of socio-economic segregation (Musterd and Ostendorf, 1998) through the sorting of high-income groups into more affluent neighbourhoods through a process of upward socio-spatial mobility. At the same time, low-income people sort into more deprived neighbourhoods through a process of downward socio-spatial mobility. Even though both Estonia, and England and Wales represent high income-inequality contexts, in Estonia such a context has only been in place for a short period of time, during which we see intense sorting of high-income groups and low-income groups into different neighbourhoods, bringing along rapidly increasing levels of segregation. High levels of income inequality have a longer history in England and Wales, where over time both the social and spatial structures have become more rigid; both levels of income inequality and levels of residential segregation are high. As a result, social mobility and socio-spatial mobility are difficult because of the social distances that must be covered to improve one’s position. All other things being equal, it is easier to undertake upward socio-spatial mobility in the more equal countries of Sweden and the Netherlands.
Our analyses were limited by the available data. To compare the four countries, we strived to construct data sets that were as comparable as possible. However, we had to make decisions that can have consequences for the interpretation of the results. First, we compared neighbourhood deprivation based on unemployment and social security benefits (the Netherlands and Sweden) with neighbourhood deprivation based on unemployment (England and Wales, and Estonia). On the one hand, it is possible that these two operationalisations do not exactly represent the same type of deprivation. Being on unemployment benefits is a temporary state, while being unemployed may be more long-term. On the other hand, social security benefits may also represent a long-term state in a person’s life. Furthermore, there is no way of telling whether someone who is in the census as being unemployed is long-term or short-term unemployed. Both measures contain insecurity about the temporality of deprivation. And second, urban–rural differences vary between the countries. For example, Sweden has vast areas with low population density, while the Netherlands is much more densely populated. As a result, moving from a rural area to an urban area represents a very different type of move in one country compared with another.
To conclude, our findings suggest that high levels of income inequality and segregation lead to a situation where socio-spatial mobility is difficult and where different socio-economic groups get settled in different types of neighbourhoods. In this context spatial mobility generates higher levels of segregation and, once established, higher levels of segregation reduce, ceteris paribus, the spatial mobility between neighbourhood types (Figure 6). Thus, the Great Gatsby Curve characterises not only social, but also spatial processes since high levels of residential segregation and low levels of socio-spatial mobility seem to be related to each other. However, the Great Gatsby Curve only partially characterises mobility–inequality relations from a point in time when income inequalities are already high. By comparing Estonia, and England and Wales, we suggest that over time growing inequalities and segregation levels come along at first with increased spatial mobility, followed by decreased spatial mobility at later stages of the cycle when inequality and segregation levels are high. Hence for understanding the complex interplay between income inequalities, social mobility, residential segregation and socio-spatial mobility, a long-term time-frame of several decades or even generations is needed.
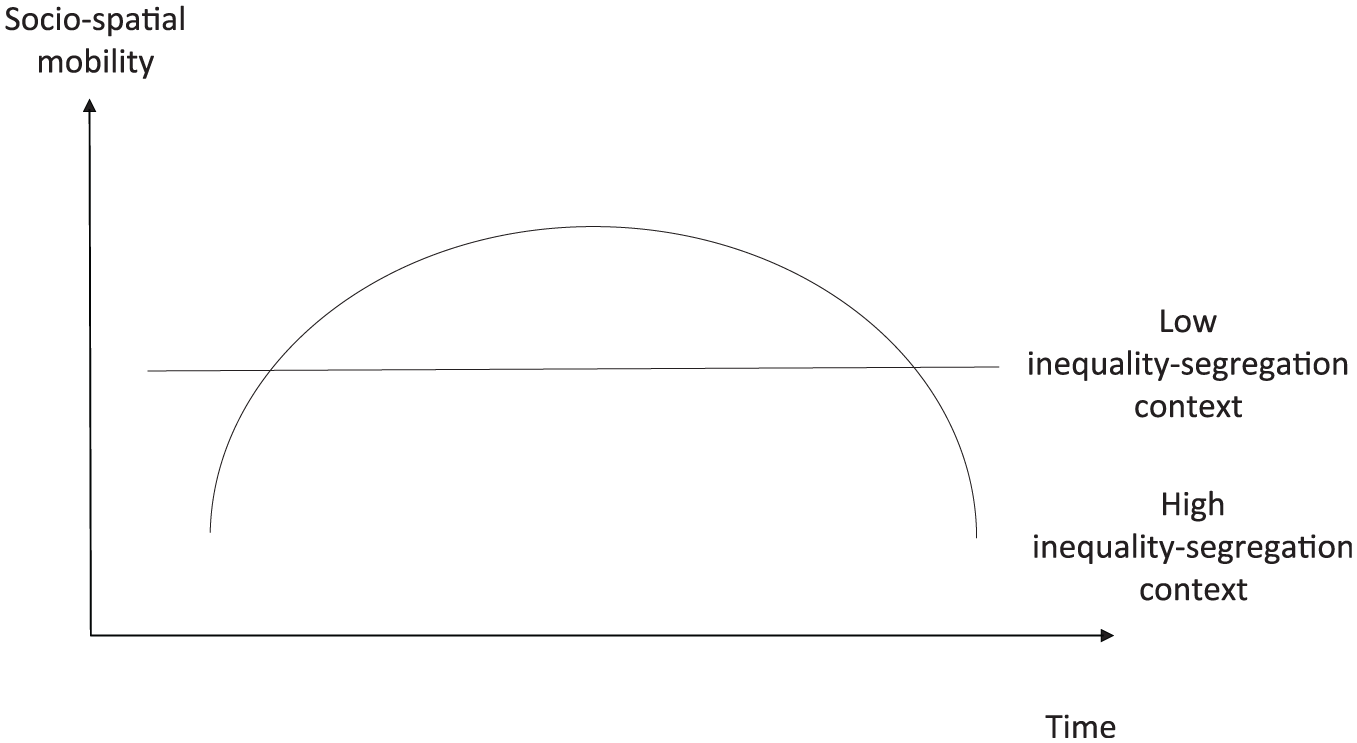
Trajectories of socio-spatial mobility under different income inequality–residential segregation contexts.
Footnotes
Appendix A
Tables A1 through A4 below show the 10 ×10 matrices on which the figures in this paper are based. All tables show the deprivation level (in deciles) of the neighbourhood of origin in 2001 in the rows, and the deprivation level of the destination neighbourhood in 2011 in the columns. Decile 1 shows the least deprived neighbourhoods and decile 10 the most deprived neighbourhoods.
Declaration of conflicting interests
The author(s) declared no potential conflicts of interest with respect to the research, authorship, and/or publication of this article.
Funding
The author(s) disclosed receipt of the following financial support for the research, authorship, and/or publication of this article: We would like to thank Anniko Viko for her assistance in working with the Estonian data. The research leading to these results has received funding from the European Research Council under the European Union’s Seventh Framework Programme (FP/2007-2013) / ERC Grant Agreement no. 615159 (ERC Consolidator Grant DEPRIVEDHOODS, Socio-spatial inequality, deprived neighbourhoods, and neighbourhood effects), and the Estonian Research Council Estonian Research Council (Institutional Research Grant IUT2-17 on Spatial Population Mobility and Geographical Changes in Urban Regions, projects Infotechnological Mobility Laboratory and RITA-Ränne).