
Abstract
Objective
The aims of this study were to develop and validate a prediction model for severe disturbance of consciousness (SDOC) occurring within 30 days of intensive care unit (ICU) admission in patients with non-traumatic intracranial hemorrhage (NTICH), and to compare and validate the predictive value of anion gap (AG), serum albumin, and albumin-corrected anion gap (ACAG) for SDOC in this population.
Methods
This study is a retrospective cohort study. It included a total of 873 patients with NTICH from the Medical Information Mart for Intensive Care (MIMIC-IV) database. These patients were randomly allocated in a 7:3 ratio to a training cohort (n = 611) and a validation cohort (n = 262). Variables selected from the Least Absolute Shrinkage and Selection Operator (LASSO) regression were subsequently entered into a multivariable logistic regression analysis, with those demonstrating a P-value< 0.05 incorporated into the final model to develop a dynamic nomogram. The discriminative ability of the model was evaluated by receiver operating characteristic (ROC) curves and calculating the area under the curve (AUC). Model performance was assessed using calibration curves and the Hosmer-Lemeshow goodness-of-fit test (HL test). Furthermore, decision curve analysis (DCA) was employed to evaluate the net clinical benefit of the model.
Results
We developed a 14-variable prediction model for the occurrence of SDOC within 30 days of NTICH patients’ ICU admission. The prediction model demonstrated satisfactory discriminative ability in the validation cohort, with an AUC of 0.870. Notably, ACAG showed superior predictive performance compared to AG and serum albumin alone. The constructed nomogram exhibited good calibration performance. DCA further confirmed the clinical utility of this predictive model.
Conclusions
This study developed a prediction model for estimating the risk of SDOC within 30 days of admission in patients with NTICH. Furthermore, ACAG demonstrated significant importance in patients who developed SDOC.
Keywords
1. Introduction
Non-traumatic intracranial hemorrhage (NTICH), a severe cerebrovascular condition, represents a major subtype of stroke. Based on etiology, it can be classified into primary and secondary intracranial hemorrhage. 1 Accounting for 49.6% of all stroke-related disability-adjusted life years, NTICH represents a leading cause of disability and mortality worldwide. 2 The 30-day mortality rate for NTICH in European nations remains approximately 40% among elderly patients aged 75 years and older. 3 Approximately half of NTICH patients have moderate to severe disability at discharge. 4 Severe disorder of consciousness (SDOC) refers to a clinical condition characterized by prolonged and significantly impaired consciousness, manifesting as a sustained lack of arousal or responsiveness to oneself and the external environment. 5 Among NTICH, SDOC constitutes a relatively frequent and serious disability, with elevated risk observed in cases featuring substantial hemorrhage volume, brainstem compression, or associated hypoxic-ischemic injury. During rehabilitation, this condition places a considerable burden on patients’ families and impedes recovery outcomes. 6 Acid-base imbalances and electrolyte disturbances commonly occur in NTICH patients during the acute phase, particularly among those with massive hemorrhage, severe consciousness impairment, prolonged bed rest, or those undergoing dehydration/diuretic therapy. Evidence indicates a strong correlation between these metabolic abnormalities and NTICH prognosis.7–9 Thus, evaluating the risk and severity of acid-base imbalances may help risk stratification for SDOC and enables timely intervention in patients with NTICH.
The anion gap (AG) serves as an essential indicator for diagnosing metabolic acidosis, being rapid and readily accessible. It is calculated using the formula: AG = [Na+ (mmol/L) + K+ (mmol/L)] – [Cl- (mmol/L) + HCO3- (mmol/L)]. However, AG values are frequently influenced by the presence of hypoalbuminemia. 10 Albumin, the predominant unmeasured anion in plasma, demonstrates a quantifiable relationship with AG values: for every 10 g/L decrease in albumin concentration, AG decreases by approximately 2.5 mmol/L. Failuring to adjust for albumin levels may lead to the misinterpretation of high-AG metabolic acidosis as either normal-AG metabolic acidosis or even metabolic alkalosis. 11 The albumin-corrected anion gap (ACAG) (mmol/L) = [4.4-(albumin (g/dL))] *2.5+AG (12), developed as an enhancement of the conventional AG, provides a more precise representation of AG values and allows for improved accuracy in assessing metabolic acidosis. 12 Current evidence indicates that the ACAG has garnered increasing interest for its predictive utility in clinical outcomes among patients with critical conditions.13–17 Although some studies have investigated the value of ACAG in mortality risk stratification for stroke patients, 18 and others have explored its role in prognostic models for subarachnoid hemorrhage patients. 19 These studies demonstrate the significant importance of ACAG in stroke. Research on ACAG, particularly those with NTICH, is limited. And the relationship between ACAG and SDOC in NTICH patients has not been examined.
Thus, we conducted this study to develop a prediction model utilizing the ACAG for patients with NTICH, and to compare the differential predictive value between the AG and ACAG.
2. Methods
2.1. Data source
This study is a retrospective cohort study and conforms to the STROBE guidelines (see Supplementary Material). 20 This study complied with the Helsinki Declaration (enacted in 1975, amended in 2024) 21 and utilized the Medical Information Mart for Intensive Care (MIMIC-IV, version 3.1) database. MIMIC-IV is a public critical care database. It was created in 2003 through a collaboration between a US hospital and Massachusetts Institute of Technology (MIT). This large database is well-known for containing detailed clinical information about patients treated in the intensive care unit (ICU). 22 MIMIC-IV stands as one of the most extensive and frequently employed databases in critical care medicine. It provided an essential data resource for the construction of our predictive model. The utilization of MIMIC-IV for this study received approval from the institutional review boards of both MIT and Beth Israel Deaconess Medical Center (BIDMC, Boston, MA, USA). In adherence to ethical guidelines and to protect patient privacy, the dataset employed in this study underwent de-identification and the BIDMC’s institutional review board ruled that informed permission was not required. The author JL successfully has been granted authorization to extract data from the MIMIC-IV database (Record ID: 67205354).
2.2. Study population
The MIMIC-IV database contained records of 180,733 individuals who were admitted to the ICU from 2008 to 2022. Based on the international classification of diseases, ninth revision (ICD-9) codes: 430, 431, 4320, 4321, 4329, and tenth revision (ICD-10) codes: I60, I61, I62. 2,914 patients were admitted to the ICU for the first time with NTICH as their major diagnosis. Only patients who were at least 18 years old were included in this study, with initial ICU admission and glasgow coma scale (GCS) scores
23
recorded within 30 days of ICU admission were collected. Exclusion criteria comprised patients with missing key indicators such as serum albumin and AG following ICU admission, with a GCS score≤8 on the first day of admission, and those who spent fewer than 24 hours in the ICU (Figure 1). Process of NTICH patients screening.
2.3. Variable extraction and outcomes
Baseline characteristics of included NTICH patients.

Data are median [IQR] or n (%). p-values from Kruskal–Wallis test (continuous) or χ2 test (categorical) across trajectory groups.
Abbreviation: ACAG, albumin-corrected anion gap; ACEI/ARB, angiotensin-converting enzyme Inhibitor/angiotensin receptor blocker; AFLB, atrial fibrillation; CCB, calcium channel blocker; COPD, chronic obstructive pulmonary disease; DBP, diastolic blood pressure; GCS, glasgow coma scale; ICU, intensive care unit; INR, international normalized ratio; NTICH: non-traumatic intracranial hemorrhage; PT, prothrombin time; PTT, partial thromboplastin time; RR, respiratory rate; SBP, systolic blood pressure; SDOC, severe disorder of consciousness; SIRS, systemic inflammatory response syndrome; WBC, white blood cell.
In this research, the primary variable of exposure was the initial ACAG measurement recorded following ICU admission The ACAG (mmol/L) = [4.4 - (albumin (g/dL))] *2.5+AG (12). This study’s primary result was that patients with NTICH had SDOC within 30 days of being admitted to the ICU. SDOC denotes a clinical state of sustained and markedly impaired awareness, characterized by a persistent lack of arousal or responsiveness to self and the external environment. 5 GCS score ≤ 8 is traditionally defined as SDOC. 18
Baseline variable missingness.

P-values from t-test, Wilcoxon test, and KS test.
Abbreviation: ACAG, albumin-corrected anion gap; ACEI/ARB, angiotensin-converting enzyme Inhibitor/angiotensin receptor blocker; AFLB, atrial fibrillation; CCB, calcium channel blocker; COPD, chronic obstructive pulmonary disease; DBP, diastolic blood pressure; GCS, glasgow coma scale; ICU, intensive care unit; INR, international normalized ratio; NTICH: non-traumatic intracranial hemorrhage; PT, prothrombin time; PTT, partial thromboplastin time; RR, respiratory rate; SBP, systolic blood pressure; SDOC, severe disorder of consciousness; SIRS, systemic inflammatory response syndrome; WBC, white blood cell.
2.4. Statistical analysis
We performed a normality test for the continuous variables. Mean ± standard deviation for normally distributed data and as median with interquartile range for non-normally distributed data. Categorical variables were presented as counts (percentages).
Patients were stratified into two groups based on the occurrence of SDOC: SDOC and Non-SDOC. Between-group comparisons were performed using the chi-square test or Fisher’s exact test for categorical variables, the independent samples t-test for normally distributed continuous variables, and the Mann-Whitney U test for non-normally distributed continuous variables.
Our patients were randomly allocated in a 7:3 ratio to a training cohort (n = 611) and a validation cohort (n = 262). In training cohort, variable selection was then performed using least absolute shrinkage and selection operator (LASSO) regression followed by multivariate logistic regression to identify risk factors for SDOC development in NTICH patients during the early ICU period and to determine the independent relationship between ACAG and SDOC.
A dynamic online diagnostic nomogram for predicting SDOC was developed based on the selected variables. The prognostic value of ACAG and the constructed model was assessed by calculating the area under the receiver operating characteristic curve (AUC). Differences in AUC values between the model and other scoring systems were compared using the Z-test. Using calibration curves and the Hosmer-Lemeshow goodness-of-fit test (HL test). The clinical utility of the prediction model was evaluated using decision curve analysis (DCA). Spearman correlation analysis was used to assess the correlations between variables.
All data were analyzed using R4.5.1, and p-value<0.05 was considered statistically significant.
3. Result
3.1. Baseline characteristics of patients with versus without SDOC
A total of 873 patients with NTICH were enrolled in this study and followed up for 30 days. The cohort had a median age of 68 years, with 55.9% male. During the ICU stay, 216 patients (24.7%) developed SDOC. With 216 outcome events, the sample size supports a multivariable model with 10-15 predictors according to the Events Per Variable (EPV) rule. Univariate regression analysis showed that SDOC patients had stronger systemic inflammation and metabolic issues than those without SDOC. Their WBC, creatinine, and blood glucose levels were notably higher. (all p < 0.001). Key laboratory measures also showed lower albumin (p < 0.001) and higher AG and ACAG (p < 0.001) in the SDOC group. Although these patients had higher initial GCS scores (p < 0.001), they presented with more severe SIRS scores (p < 0.001). Their heart rate and SBP were elevated, while DBP was relatively lower (all p < 0.001 except SBP p = 0.006). Additionally, the SDOC group had higher incidences of renal failure (p = 0.001). In clinical management, this group used fewer ACEI/ARB, CCB and other diuretics (all p < 0.001). They received mannitol and mechanical ventilation more frequently (all p < 0.001).
Ultimately, patients with SDOC had significantly longer ICU stays (p = 0.036). Every patient in this subgroup died within 30 days (Table 1).
3.2. Development and validation of the predictive nomogram
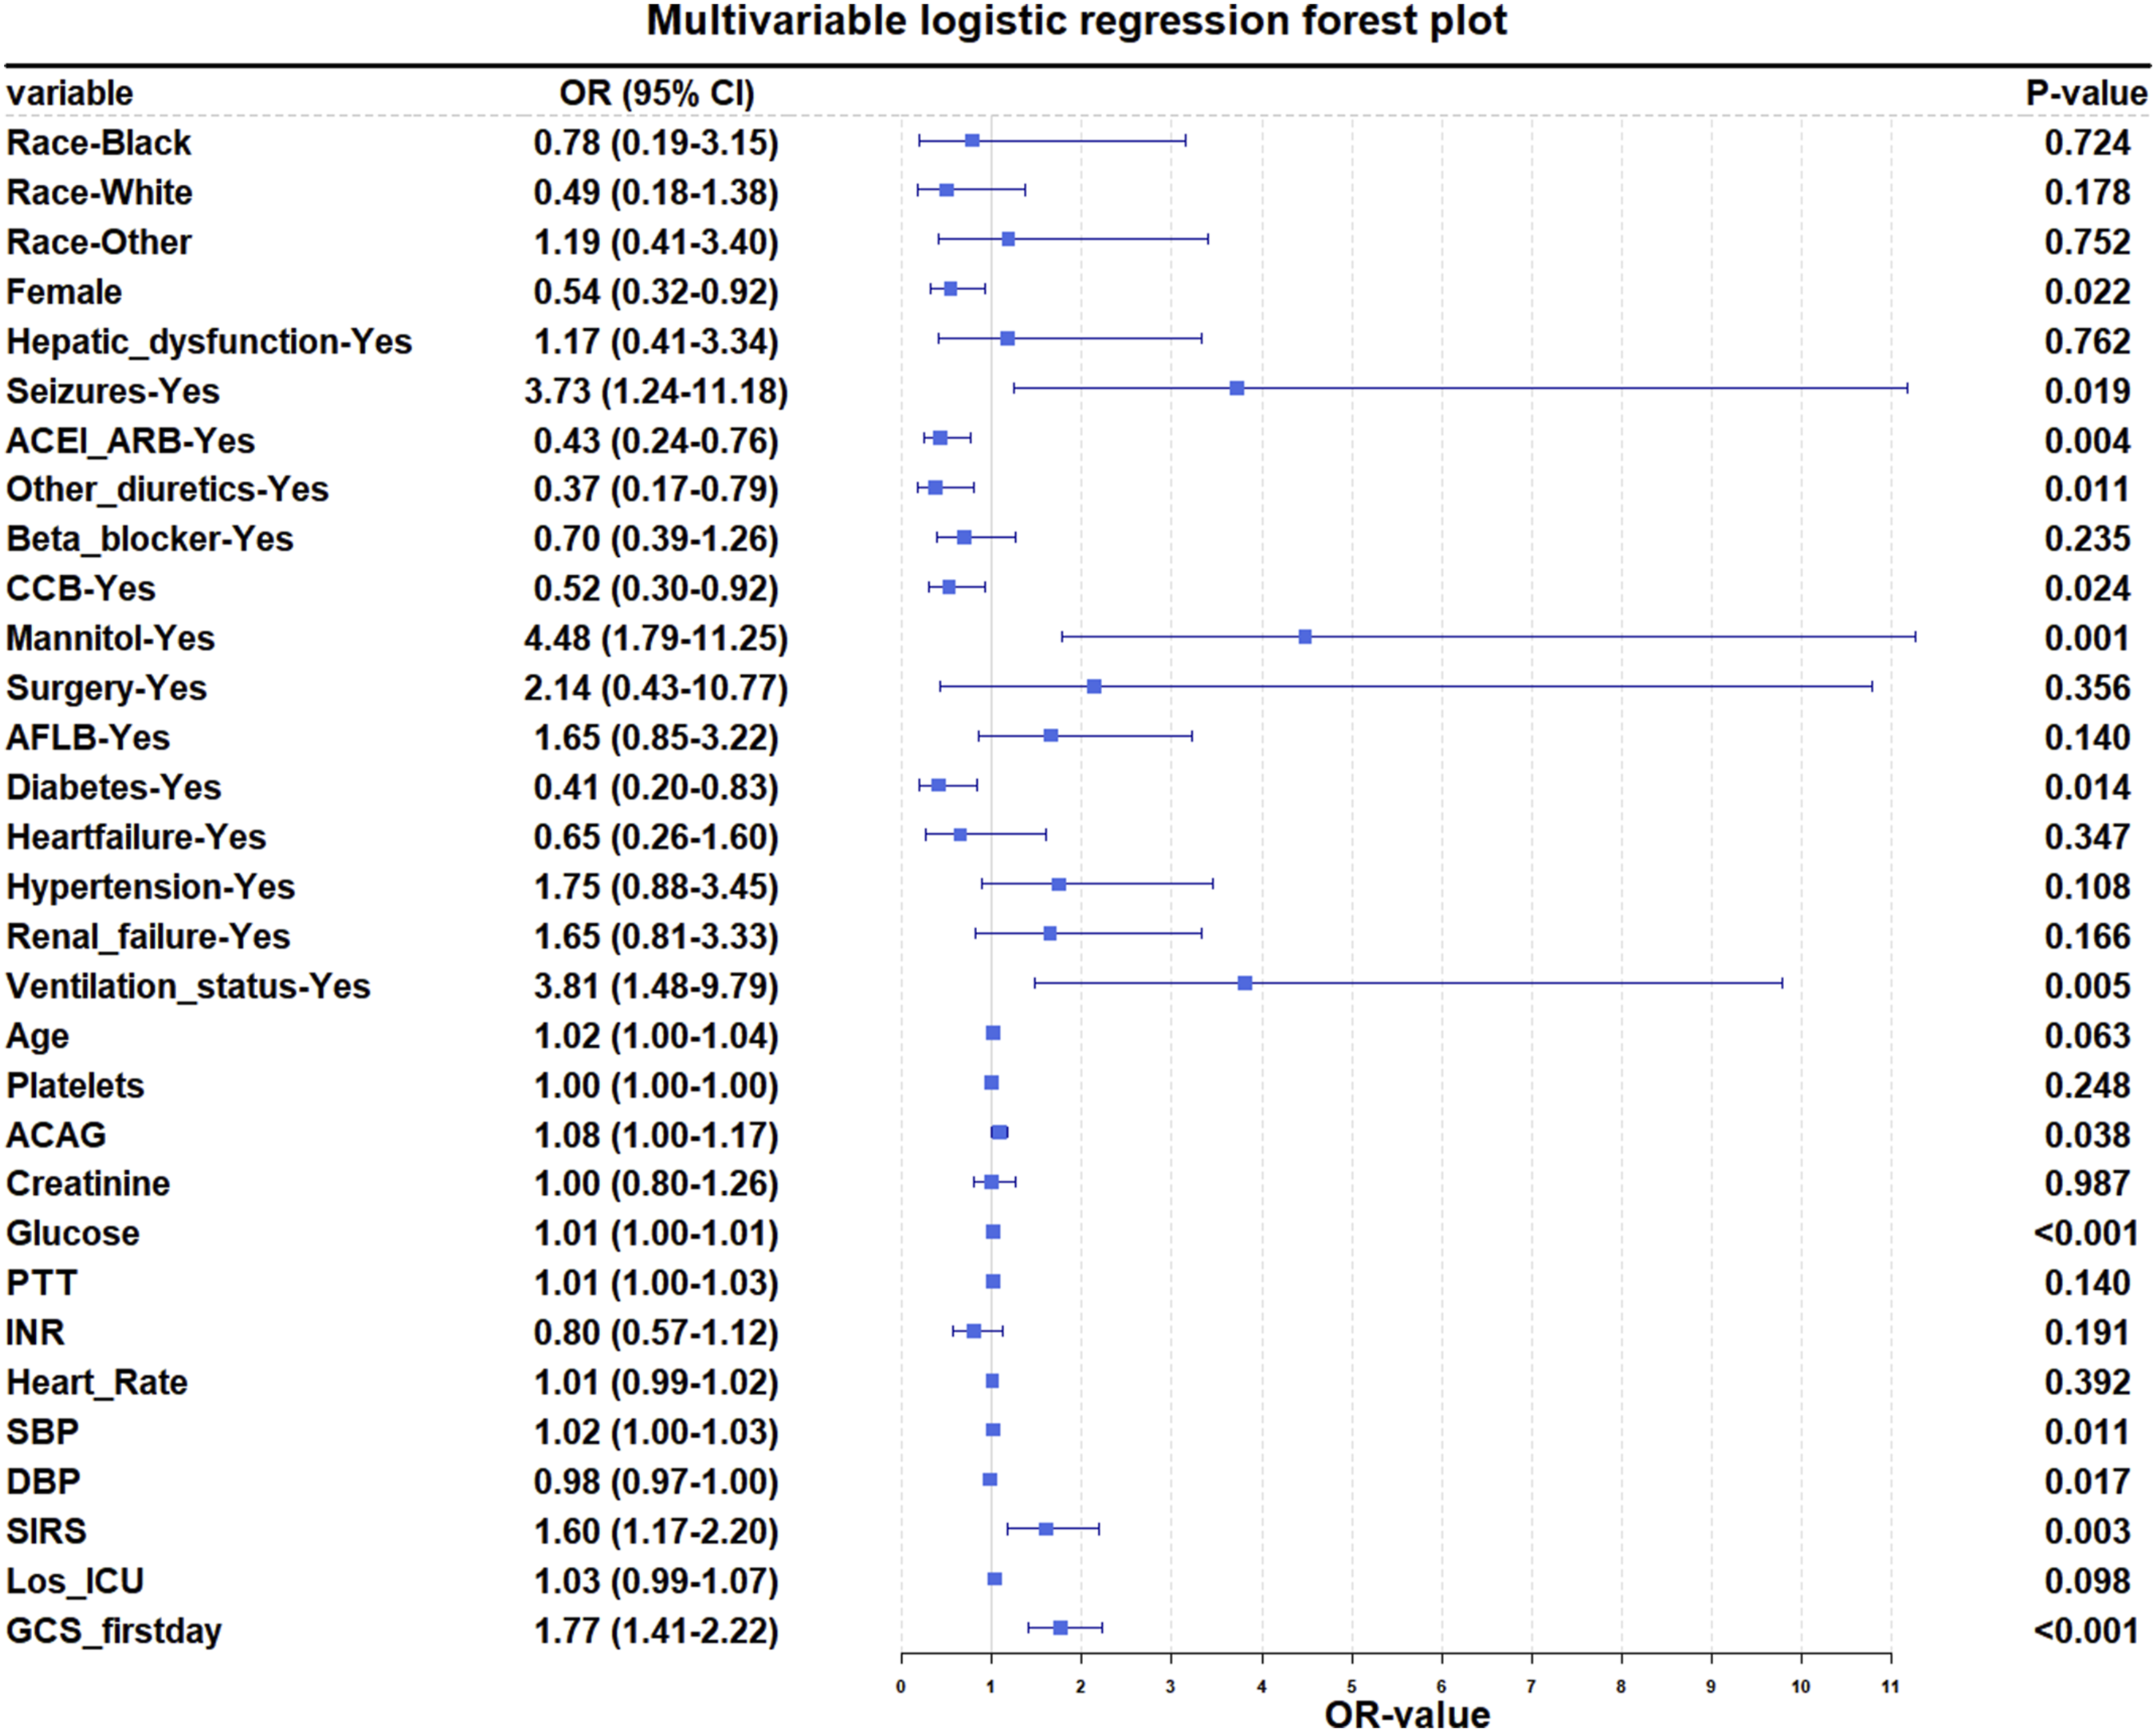
LASSO regression was performed on the training cohort with tuning parameter λ selected at the minimum cross-validated error (λ_min). It identified 29 potential predictors, including race, gender, hepatic dysfunction, seizures, ACEI/ARB, other diuretics, beta-blockers, CCB, mannitol, surgery, AFLB, diabetes, heart failure, hypertension, renal failure, mechanical ventilation status, age, platelets, ACAG, creatinine, glucose, INR, PTT, heart rate, SBP, DBP, SIRS, length of ICU stay and first-day GCS score (Figure 2). These variables were subsequently incorporated into a multivariate logistic regression analysis to identify significant predictors of SDOC in NTICH patients. The analysis revealed 14 factors independently associated with SDOC: gender, seizures, ACEI/ARB, other diuretics, CCB, mannitol, diabetes, mechanical ventilation status, ACAG, glucose, SBP, DBP, SIRS and first-day GCS score (Table 3, Figure 3). Results of the LASSO regression analysis. (a) Plot of the LASSO coefficient profiles. (b) Tuning parameter (λ) selection cross-validation error curve. Multivariate logistic regression model of NTICH in the training cohort. ORs from logistic regression; CI: confidence interval. Abbreviation: ACAG, albumin-corrected anion gap; ACEI/ARB, angiotensin-converting enzyme Inhibitor/angiotensin receptor blocker; CCB, calcium channel blockers; DBP, diastolic blood pressure; GCS, glasgow coma scale; NTICH: non-traumatic intracranial hemorrhage; SBP, systolic blood pressure; SIRS, systemic inflammatory response syndrome. Forest plot of multivariate logistic regression.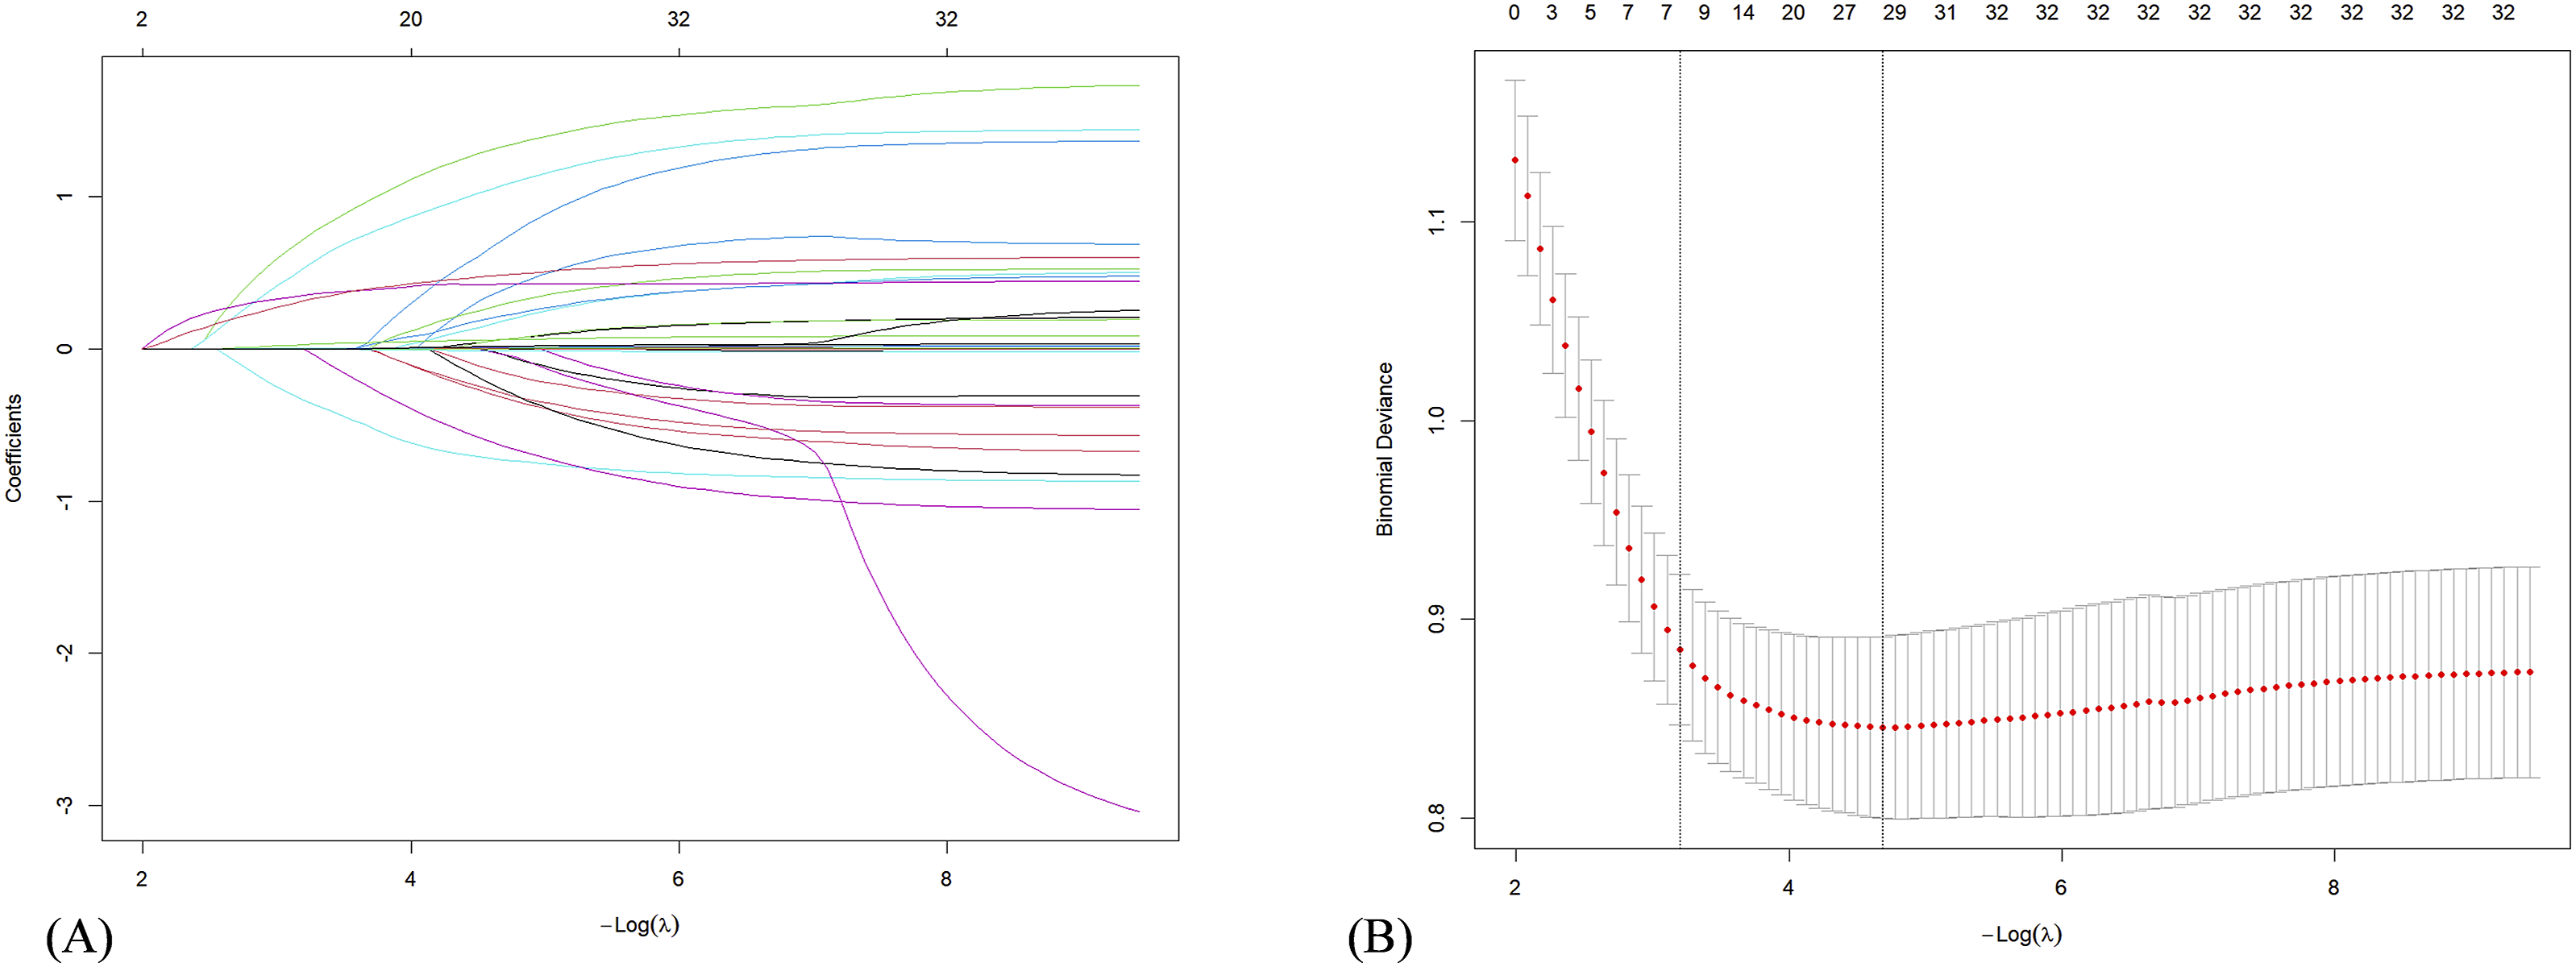

Correlation analysis revealed linear relationships among these fourteen factors (Figure 4). Linear correlation analysis of the indicators. The number in the right of the plot was the correlation coefficient.
3.3. Prognostic value of ACAG in NTICH patients
The AUC values for AG, serum albumin, and ACAG in predicting SDOC among NTICH patients were 0.636, 0.649, and 0.682, respectively. ACAG only slightly improved AUC compared to albumin or AG alone. This indicates that ACAG offers a simple, cost-effective method to identify high-risk SDOC patients early. Its practical design works well in settings with limited resources.
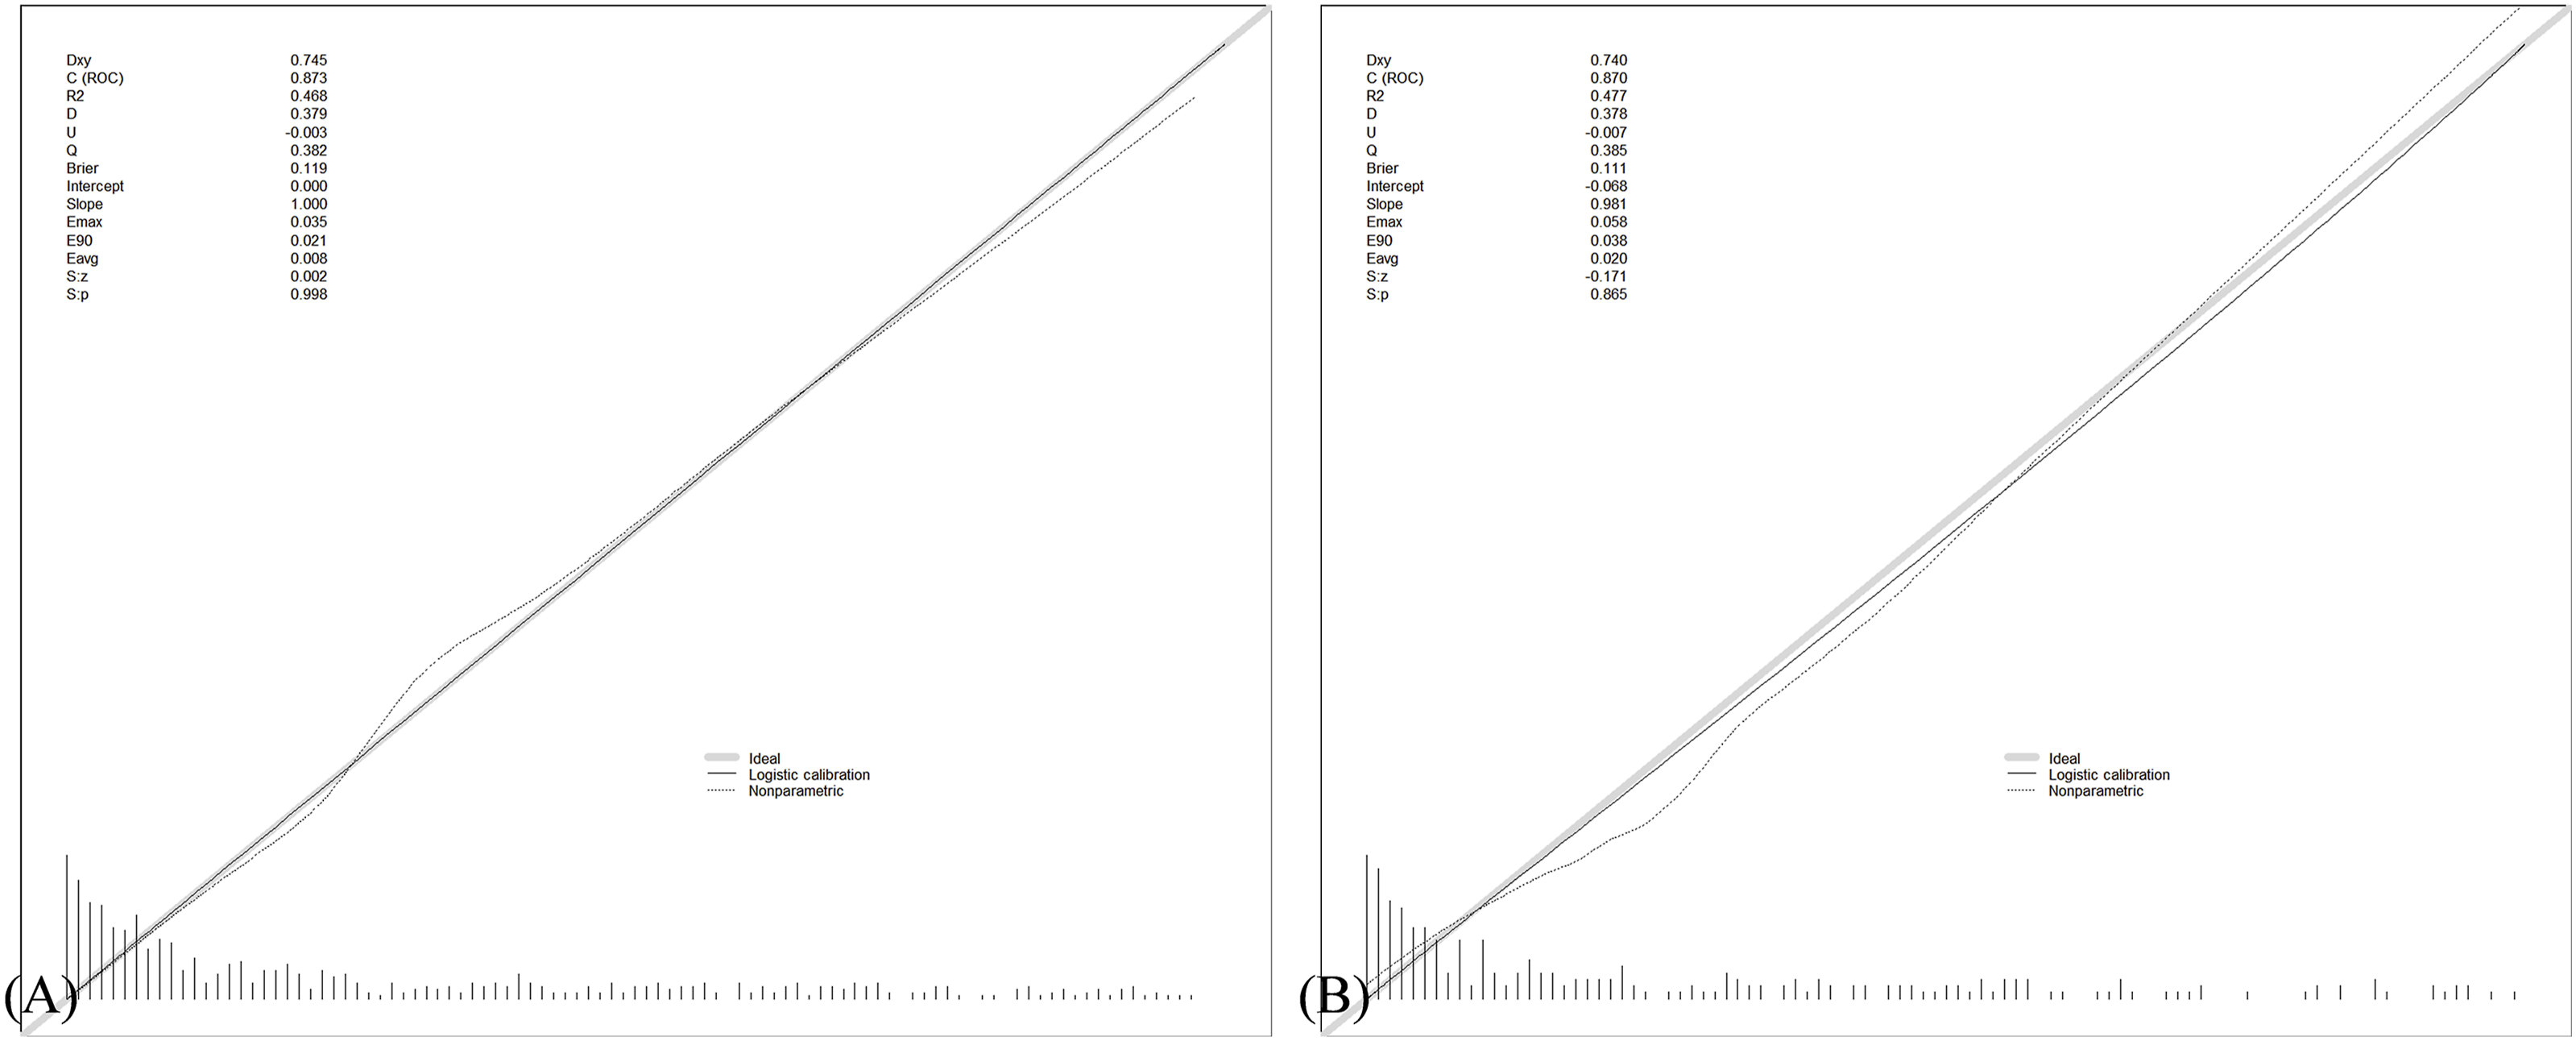
The traditional SIRS scoring system achieved an AUC of 0.771. In comparison, a logistic regression model incorporating gender, seizures, ACEI/ARB, other diuretics, CCB, mannitol, diabetes, mechanical ventilation status, ACAG, glucose, SBP, DBP, SIRS and first-day GCS score yielded a significantly higher AUC of 0.870. This performance was substantially superior to that of the SIRS score (Z = 3.100, p < 0.001), serum albumin (Z = 4.766, p < 0.001), ACAG alone (Z = 4.767, p < 0.001), and AG (Z = 5.347, p < 0.001) (Figure 5). The corresponding nomogram, calibration curve, and DCA for this model are presented in Figures 6–8, respectively. The ROC of the prognostic model for the SDOC of NTICH patients. (a) Prediction model in the training cohort (b) prediction model in the test cohort. Nomogram of the prognostic model for the SDOC of NTICH. (a) Established nomogram in the training cohort by incorporating the following fourteen parameters. (b) Online dynamic nomogram accessible at https://127.0.0.1:5880. Calibration plot of the prognostic model for the SDOC of NTICH. (a) Prediction model in the training cohort (b) prediction model in the test cohort. DCA of the prognostic model for the SDOC of NTICH. (a) Prediction model in the training cohort (b) prediction model in the test cohort.


4. Discussion
This study developed and validated a clinical prediction model incorporating ACAG to identify high-risk patients for SDOC following NTICH. The model integrated 14 key variables including ACAG and demonstrated strong discriminatory power (AUC = 0.870). We found that ACAG not only served as an independent predictor for early SDOC in NTICH patients, but also demonstrated improved predictive performance compared to AG and serum albumin, although the incremental gain was modest. As a readily available biomarker, ACAG can be incorporated into routine monitoring protocols, supporting timely intervention for acid-base imbalances and guiding treatment adjustments. The ACAG-based prediction model provides a high-performance multidimensional tool for clinical assessment of neurological deterioration after NTICH.
Prior research has established the prognostic value of the ACAG in critically ill patients, including its role in risk stratification for mortality following stroke. 18 However, existing literature has primarily focused on the association between ACAG and systemic metabolic abnormalities or overall mortality. 25 Research shows that In patients with sepsis, elevated ACAG is strongly associated with in-hospital mortality. ACAG offers better prediction than using albumin or AG alone. 26 Clinically, ACAG helps guide fluid resuscitation, evaluates toxin clearance, and warns of multiple organ dysfunction. 27
AG’s potential for prognosis in neurocritical care is being investigated. Yet in NTICH patients, protein intake is often insufficient due to illness or stress-driven gastrointestinal issues, resulting in congestion and poor nutrient absorption. 28 These factors impair protein absorption and lead to hypoalbuminemia. As a major unmeasured plasma anion, albumin contributes substantially to the anion gap due to its negative charge. Fluctuations in its concentration directly influence AG. By accounting for serum albumin (ACAG = [4.4 - albuim (g/dL)] × 2.5 + AG), ACAG refines traditional AG. It better reflects true acid-base balance in cases of hypoalbuminemia, supporting clinical diagnosis.
In the ICU, monitoring acid-base balance and metabolic status is standard practice. These parameters indicate the stability of the internal environment and underlying pathophysiological changes. 29 In acute encephalopathy, SDOC is frequently ascribed to primary brain injury. Yet the contribution of metabolic disturbances, a reversible factors that can worsen the condition is commonly missed. Metabolic acidosis can directly impair consciousness or even induce coma by altering neuronal membrane potentials, disrupting neurotransmitter release, and triggering epileptiform discharges. 30 Furthermore ACAG-related metabolic disturbances create a vicious cycle with systemic inflammation and electrolyte imbalances. Together, they worsen the initial brain injury by disrupting blood flow regulation in the brain and increasing cerebral edema. In patients with cerebral hemorrhage, delayed cerebral ischemia can occur, causing ischemic hypoxia and inflammatory responses. At the same time, inflammatory responses trigger changes in systemic metabolism. 31 The release of inflammatory mediators further disrupts renal acid-base metabolism. Existing evidence confirms that elevated serum AG levels correlate with heightened inflammatory biomarkers. 32 Within this context, electrolyte disorders significantly worsen the condition in these patients. Those with NTICH are much more likely to develop hypokalemia and hypocalcemia while hospitalized. 33 Sodium ions, being the main cation in plasma, directly alter AG values when their concentration changes. Hypernatremia affects about 8%–36% of neurocritical care patients. It is most common (up to 36%) in those given mannitol to reduce intracranial pressure. 34
The use of mannitol and mechanical ventilation in the model serves as a robust surrogate marker for NTICH patients with urgently needed intervention due to intracranial hypertension or respiratory failure. Mannitol’s predictive power stems from directly identifying those patients who require the most intensive medical pressure-lowering treatment as a result of life-threatening cerebral edema and elevated intracranial pressure. 35 Mechanical ventilation, specifically positive-pressure ventilation can affect brain function and consciousness in several ways: elevating intrathoracic pressure, which impairs cerebral blood flow and suppresses brain activity. The sedatives used, improper ventilation management, and long-term ventilation-related complications may exacerbate brain injury or delay neurological recovery.36–39 Interestingly, other diuretics (besides furosemide) in the model also showed a protective effect—an apparently contradictory result that still supports our earlier interpretation. Mannitol and furosemide are often used in acute critical care situations, while torasemide and related drugs tend to be chosen for more precise fluid management once the patient is stable.40,41 These drugs work differently in the model, matching the two main stages of care.
Elevated blood glucose and excessively high SBP are directly modifiable risk factors in the model.42,43 They directly drive or exacerbate the metabolic-inflammatory-vascular injury vicious cycle represented by ACAG—through mechanisms such as increased osmotic pressure, aggravated oxidative stress and inflammatory responses, pressure-induced injury, and disruption of cerebral blood flow autoregulation—thereby worsening cerebral edema and leading to impaired consciousness.
The protective effect of ACEI/ARB/CCB medications indicates that a smooth, targeted blood-pressure management strategy was implemented during the acute phase. By limiting the risk of re-bleeding and exerting direct cerebroprotective properties—such as attenuating inflammation and suppressing excitotoxicity—these agents help disrupt the vicious cycle described above, underscoring the positive impact of standardized treatment on patient outcomes.44,45 For patients with pre-existing diabetes, more active glycemic control before admission under chronic disease management leads to relatively stable vascular endothelial function, resulting in lower hemorrhage volume and reduced risk of rebleeding. Additionally, chronic hyperosmolar status pre-conditionally downregulates osmotic pressure in brain cells, leading to less severe edema during the acute phase. A moderate increase in DBP helps protect the brain by improving blood flow without over-stretching vessels, which reduces ischemia in vulnerable brain areas. Regarding gender differences, the protective trend observed in females may be associated with greater intracranial volume reserve capacity. This results in a more gradual rise in intracranial pressure and relatively milder mechanical compression on the reticular activating system for an equivalent hemorrhage volume. 46
This study has several limitations. The model may not encompass all potential predictors of severe consciousness impairment following non-traumatic intracranial hemorrhage. Notably, neuroimaging features such as hematoma expansion, perihematomal edema volume, or ventricular extension were not included, although recent studies have confirmed these as independent predictors of neurological deterioration.47,48 Consequently, the model could fail to identify high-risk patients who exhibit clear imaging progression despite relatively stable metabolic parameters. A single ACAG measurement at admission cannot capture dynamic changes over the critical 72-hour window, potentially missing early signs of metabolic disturbance that precede neurological deterioration. ACAG cannot distinguish among lactic acidosis, ketoacidosis, or uremia, each requiring specific interventions. This may hinder the development of individualized intervention strategies. 49 The 30-day follow-up cannot assess delayed recovery occurring within 1-6 months (observed in 15-20% of patients), 50 which risks misclassifying reversible impairment as persistent severe consciousness impairment. Derived from a single tertiary medical center, the MIMIC database may have racial and healthcare model profiles that differ from those in other countries, limiting the generalizability of findings to healthcare settings with different spectra of hemorrhage etiology and intervention thresholds. The limited sample size also constrains subgroup analyses. To improve model generalizability, future studies should validate it in prospective, multicenter cohorts by incorporating measures such as continuous ACAG monitoring, lactate clearance rate, CT volumetric parameters, and 90-day functional outcomes.
5. Conclusion
This study developed and validated a prediction model for SDOC within 30 days following NITCH, suggesting the potential predictive value of ACAG in this context. The model demonstrated promising discriminative performance and may represent a valuable tool for early risk assessment and personalized intervention. Future research should focus on external validation and mechanistic exploration to facilitate clinical translation.
Supplemental material
Supplemental Material - Development and validation of a prediction model for severe disturbance of consciousness in patients with non-traumatic intracranial hemorrhage using albumin-corrected anion gap: A retrospective cohort study
Supplemental Material for Development and validation of a prediction model for severe disturbance of consciousness in patients with non-traumatic intracranial hemorrhage using albumin-corrected anion gap: A retrospective cohort study by Jianping Liu, Ao Pan, Qianwen Chen, Lihong Zhu, Jun Lyu and Wei Bi in Science Progress.
Footnotes
Acknowledgements
This work is technically supported by the Critical Care Medical Data Subsystem of the Kunlun Big Data Management System. We are grateful to all of the writers for their important contributions to this study and publication. We also thank to the Laboratory for Computational Physiology at the Massachusetts Institute of Technology for creating and maintaining the MIMIC-IV database. The authors used Deepseek (OpenAI) for language editing and polishing of this manuscript. This tool was used solely to improve readability and grammatical accuracy; all scientific content, data analysis, and conclusions were developed and verified by the authors, who bear full responsibility for the integrity and accuracy of the work.
Ethical considerations
This study complied with the Helsinki Declaration. We obtained approval to access data from the MIMIC-IV database.
Consent to participate
The data were de-identified, and the BIDMC Institutional Review Board determined that informed consent was not required.
Author contributions
JL conceived the study. AP and QC conducted literature search, data extraction, and data analysis. JL assisted with quality assessment and manuscript drafting. LZ helped refine the language, style, and research protocol. The corresponding authors actively participated in analysis and provided constructive input. WB and JL managed manuscript review, revision, and finalization.
Funding
The authors disclosed receipt of the following financial support for the research, authorship, and/or publication of this article: Guangdong Basic and Applied Basic Research Foundation Nos. 2024A1515012884 and Beijing Medical Award Foundation Nos. YXJL-2022-0351-0256.
Declaration of conflicting interests
The authors declared no potential conflicts of interest with respect to the research, authorship, and/or publication of this article.
Data Availability Statement
Supplemental material
Supplemental material for this article is available online.
References
Supplementary Material
Please find the following supplemental material available below.
For Open Access articles published under a Creative Commons License, all supplemental material carries the same license as the article it is associated with.
For non-Open Access articles published, all supplemental material carries a non-exclusive license, and permission requests for re-use of supplemental material or any part of supplemental material shall be sent directly to the copyright owner as specified in the copyright notice associated with the article.