
Abstract
Objective
The creatinine-to-albumin ratio (CAR) has recently been recognized as a composite biomarker reflecting both renal function and nutritional status, showing strong prognostic relevance across diverse diseases. However, its prognostic significance in gastrointestinal bleeding (GIB) remains unclear. This study aimed to investigate the association between CAR and mortality risk in patients with GIB and to explore potential non-linear risk patterns to identify a candidate inflection point for exploratory stratification.
Methods
We conducted a retrospective cohort study using the MIMIC-IV database, including adult patients with a first ICU admission for GIB, identified by ICD-9/10 codes. Patients with GIB were stratified into quartiles by CAR levels. Survival outcomes were evaluated using Kaplan–Meier curves, multivariable Cox regression, receiver operating characteristic (ROC) analysis, and restricted cubic spline (RCS) modeling. To develop a clinically applicable tool, the Boruta algorithm identified key prognostic variables, which were incorporated into a Cox-based nomogram. Model discrimination, calibration, and clinical utility were assessed using ROC, bootstrap-corrected calibration curves, concordance index (C-index), and decision curve analysis (DCA). External validation was performed in the eICU-CRD cohort. Predictors were derived from data recorded within the first 24 hours after ICU admission, consistent with an early ICU-course risk model.
Results
A total of 1,611 patients (median age 66 years) were included. All-cause mortality was 18.6% at 28 days and 26.8% at one year. Patients in the highest CAR quartile had significantly higher mortality than those in the lowest (31.3% vs. 7.2% at 28 days; 42.4% vs. 11.7% at 365 days; both p<0.001). In multivariable models, CAR independently predicted mortality (28-day HR 1.29, 95% CI 1.09–1.53; 365-day HR 1.24, 95% CI 1.07–1.43). ROC analysis showed moderate discrimination, with CAR outperforming creatinine or albumin and adding incremental value to ICU-window AIMS65 (operationalized using data recorded within the first 24 hours after ICU admission). RCS and subgroup analyses showed consistent results, and external validation supported the generalizability of the CAR–mortality association and the non-linear pattern. The final nomogram integrating five predictors (sepsis, APTT, CAR, TB, and BUN) demonstrated strong discrimination (28-day AUC 0.779, 95% CI 0.750–0.807), good calibration, and a corrected C-index of 0.774.
Conclusions
Elevated CAR independently predicts mortality in GIB and may aid early ICU-course (first-24-hour) risk stratification. Any candidate inflection point derived from spline analyses should be considered exploratory and requires further validation before clinical adoption.
Keywords
Introduction
Gastrointestinal bleeding (GIB), a potentially life-threatening condition frequently encountered in clinical practice, is conventionally categorized into upper and lower gastrointestinal bleeding. 1 The predominant etiologies include peptic ulcer disease, mucosal erosions, malignancies, and portal hypertension-related lesions. 2 Clinical manifestations vary with bleeding site and severity, presenting as hematemesis, melena, or hematochezia; massive hemorrhage may progress to hypovolemic shock. 3 In the United States, GIB accounts for more than 400,000 hospital admissions annually, 4 with associated mortality rates of 6%–10% for UGIB and 4%–10% for LGIB. 5
Severe GIB predisposes patients to critical complications—including nosocomial infections, cardiovascular events, acute kidney injury (AKI), and multiple organ dysfunction syndrome (MODS)—that substantially increase in-hospital mortality.6,7 These high-risk patients often require emergent blood-product transfusion, intensive care unit admission, and surgical intervention, resulting in considerable healthcare resource utilization and economic burden.8,9
Serum creatinine, an end-product of muscle metabolism, is a widely used biomarker of renal function.10,11 Elevated levels typically reflect reduced glomerular filtration rate (GFR) attributable to intrinsic renal pathology or prerenal hypoperfusion.12,13 In acute GIB, rapid blood loss decreases systemic perfusion, compromising renal blood flow and elevating serum creatinine as GFR declines. 14 Increased serum creatinine has been identified as an independent predictor of adverse outcomes in GIB, including higher ICU admission rates and mortality. 15
GIB-induced ischemic injury triggers systemic inflammation and oxidative stress, leading to endothelial dysfunction, increased vascular permeability, and subsequent hypoalbuminemia due to transcapillary albumin leakage.16,17 Given albumin’s essential roles in maintaining intravascular volume, antioxidant activity, and immunomodulation,18,19 its depletion exacerbates tissue edema, impairs cellular function, and accelerates multiorgan failure.
The CAR integrates these two clinically relevant biomarkers and may thus provide additional prognostic utility by simultaneously reflecting renal dysfunction and systemic metabolic derangement. Although elevated CAR has demonstrated prognostic value in acute pancreatitis, sepsis, and cerebrovascular disease,20–22 its clinical utility in GIB remains insufficiently investigated. Importantly, whether CAR provides incremental prognostic information beyond established GIB-specific risk scores (eg, AIMS65), 23 and how its risk gradient behaves across the full exposure range, remain unclear. Using a large ICU cohort from MIMIC-IV with external validation in the multicenter eICU-CRD database, this study aimed to (1) evaluate the association and prognostic performance of early CAR (within the first 24 h of ICU admission) in patients with GIB; (2) identify a candidate inflection point of CAR for exploratory risk stratification (hypothesis-generating), rather than establishing a definitive clinical cutoff; (3) compare CAR with creatinine, albumin, and AIMS65 and assess whether incorporating CAR improves discrimination beyond AIMS65; and (4) explore potential non-linear exposure–response patterns using restricted cubic splines and develop an externally validated nomogram and web-based calculator for individualized risk estimation.
Materials and methods
This study is reported in accordance with the Strengthening the Reporting of Observational Studies in Epidemiology (STROBE) statement. 24
Data source
MIMIC-IV v3.1 is a publicly available, de-identified critical care database comprising comprehensive electronic health records from intensive care unit (ICU) patients at Beth Israel Deaconess Medical Center (Boston, MA, USA). Our study period was determined by the temporal coverage of the latest publicly available release of MIMIC-IV (v3.1), which includes ICU admissions from 2008 to 2022. We included all eligible patients within this available window to maximise sample size and improve the robustness of our analyses. Developed by the MIT Laboratory for Computational Physiology, the database was accessed by an author following institutional approval and completion of mandated ethics training (Certification ID: 67058598). The MIMIC-IV v3.1 database was queried and the analytic dataset was extracted on April 28, 2025; all analyses were performed using this fixed database version. For external validation, we used the eICU Collaborative Research Database (eICU-CRD) and included the 2014–2015 year cycles. The eICU-CRD database was searched/queried and the validation dataset was obtained/extracted on May 3, 2025. This study is a retrospective cohort study, conducted in accordance with the Declaration of Helsinki (1975, as revised in 2024). Given that this was a retrospective secondary analysis of a publicly available, de-identified dataset, additional ethical approval was not required (not applicable), and informed consent was waived.
Study population
We extracted data from the MIMIC-IV database, initially identifying 3,826 adult patients with a first-time ICU admission for gastrointestinal bleeding, as defined by ICD-9/10 codes (complete code list in Supplemental Table 1). Patients were selected using complete (consecutive) sampling. After excluding individuals with an ICU stay of less than 24 hours or missing key laboratory values (serum creatinine and albumin), 1,611 patients were retained in the final analytic cohort. Participants were then stratified into quartiles based on their CAR for comparative analysis (Figure 1). A flow diagram of study participants.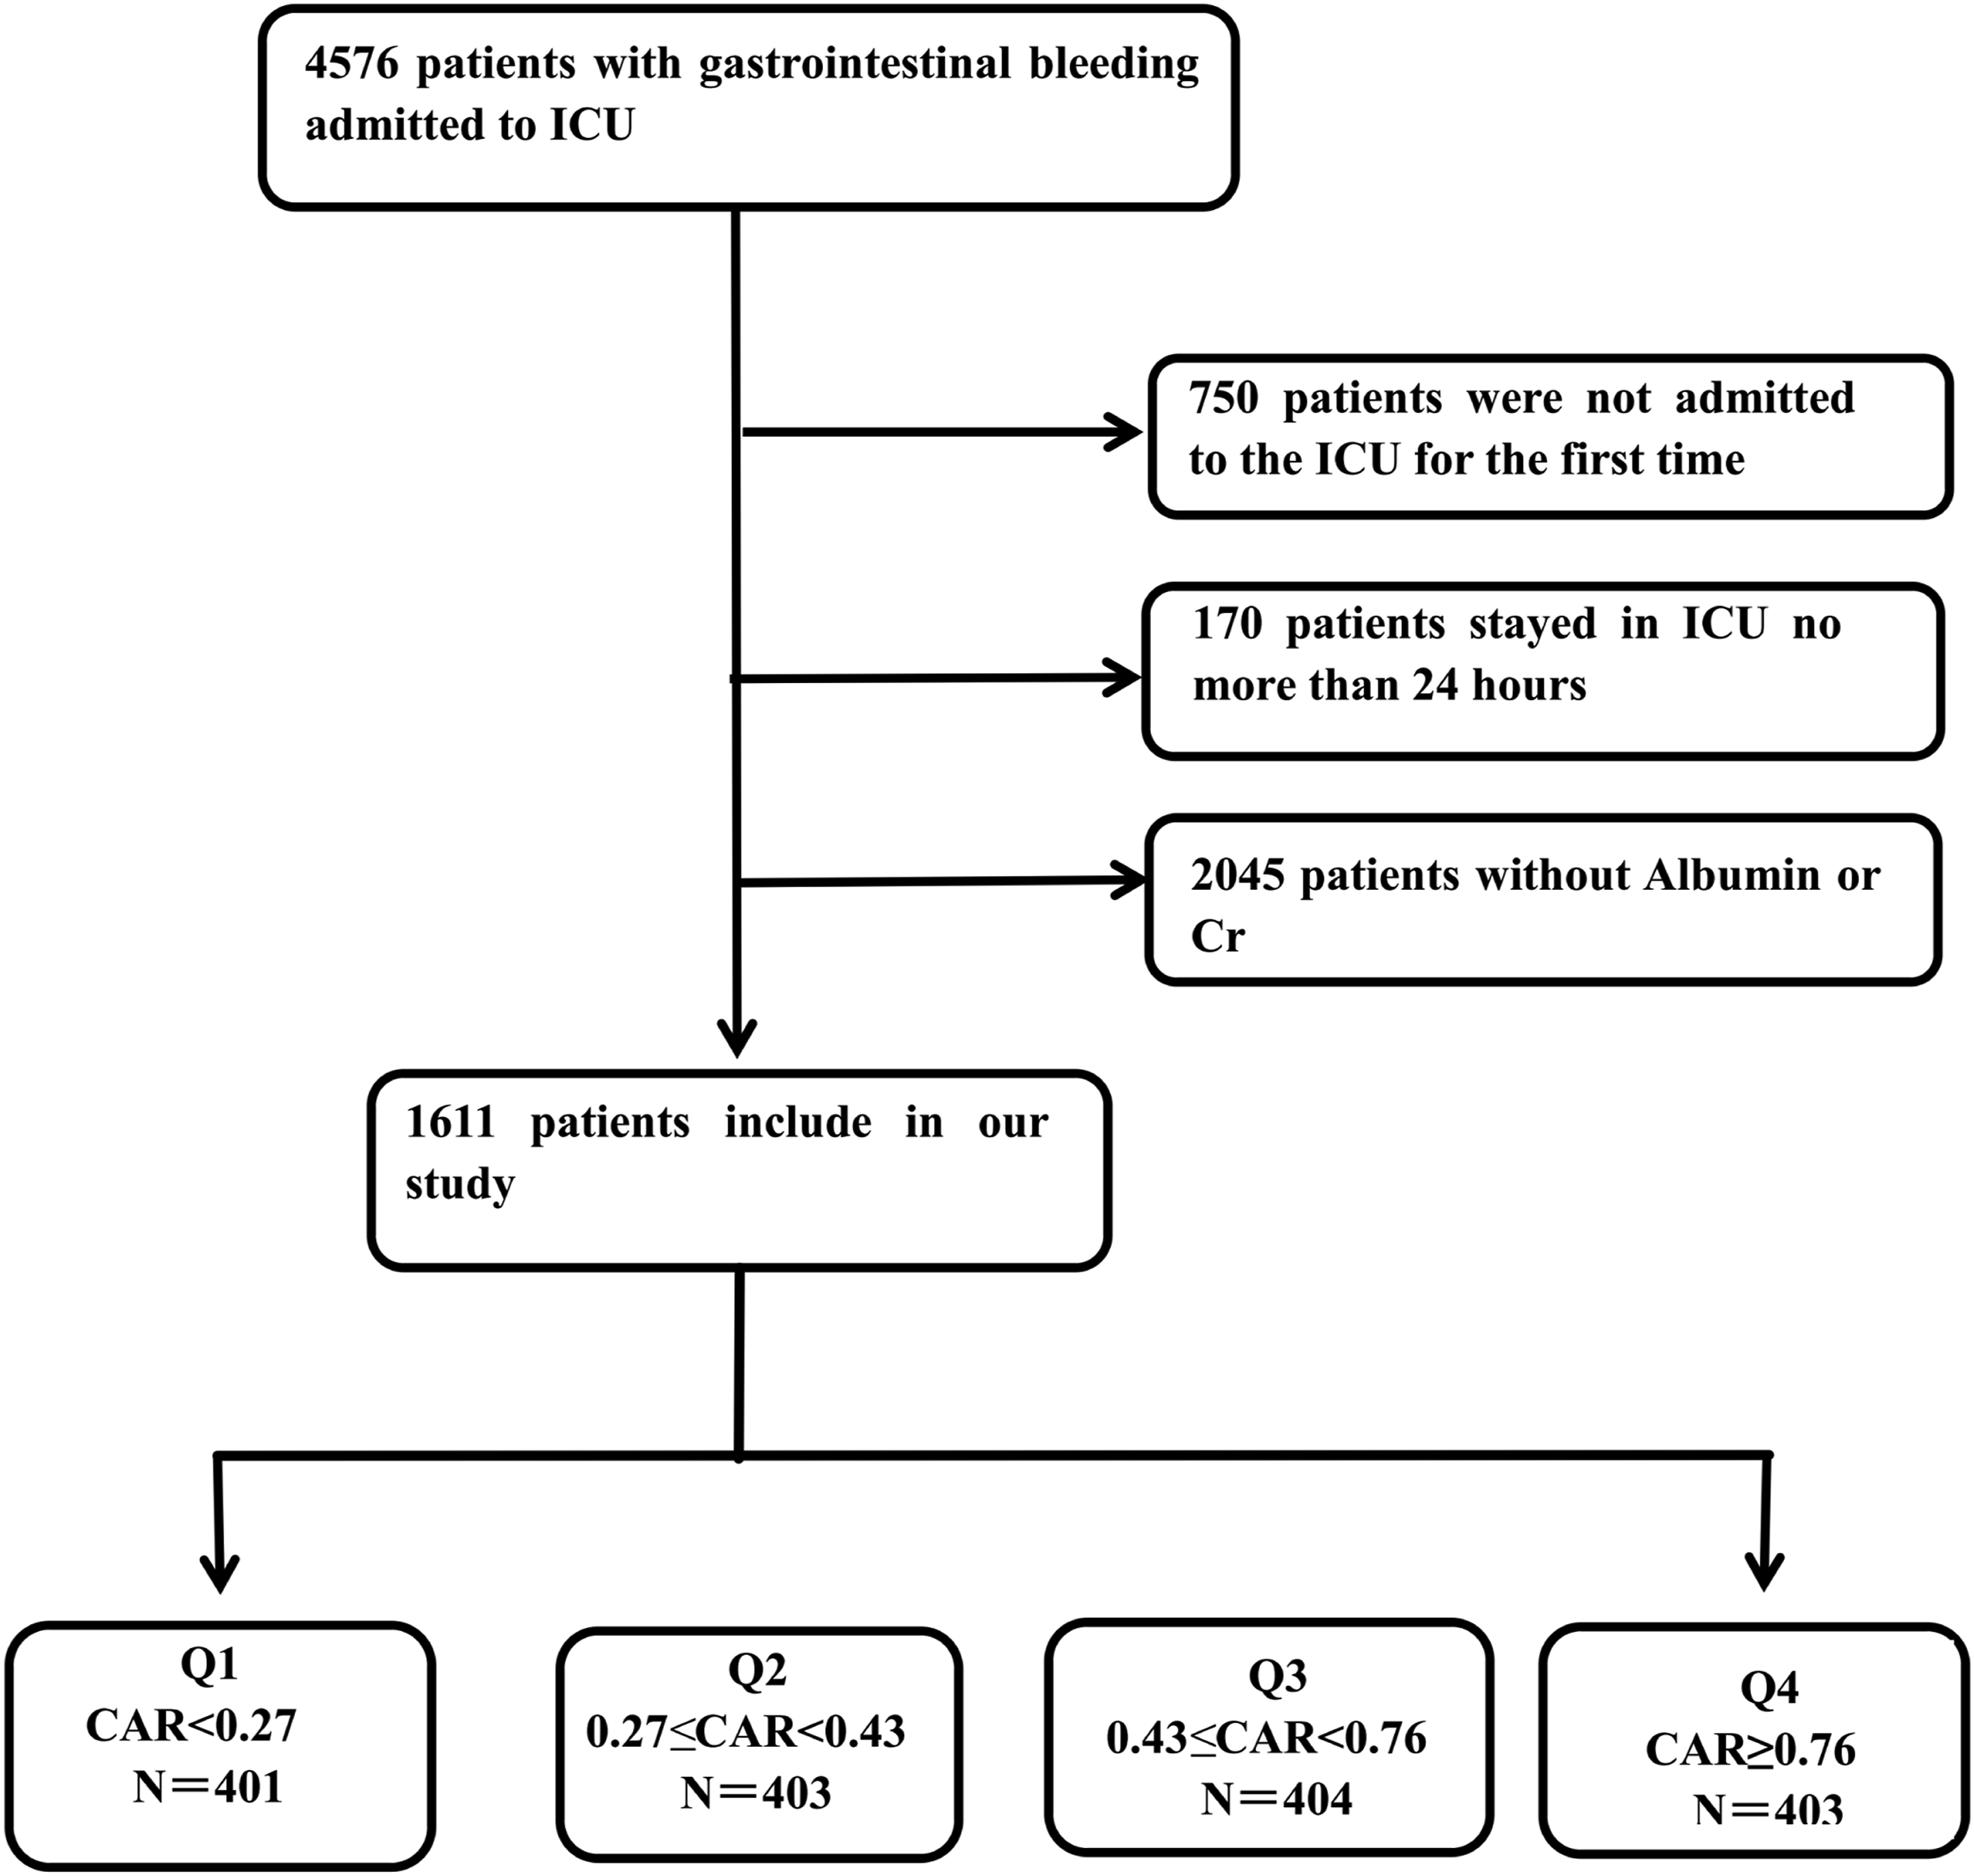
Data processing and variable selection
Data extraction was conducted using PostgreSQL. Continuous variables were derived from the mean of all measurements recorded within the first 24 hours of ICU admission, whereas categorical variables were based on the first documented assessment. Accordingly, the primary analyses represent an early ICU-course (first-24-hour) risk model rather than an immediate triage/admission score. The selected variables spanned six domains: (1) demographics, (2) vital signs, (3) laboratory results, (4) illness severity scores (including the gastrointestinal bleeding–specific score AIMS65), (5) comorbidities, and (6) therapeutic interventions (Supplemental Table 2).
AIMS65 operational definition: AIMS65 was calculated using data recorded within the first 24 hours after ICU admission, consistent with the prespecified predictor time window. One point was assigned for each of the following: (1) age ≥65 years; (2) serum albumin <3.0 g/dL; (3) INR >1.5; (4) systolic blood pressure ≤90 mmHg; and (5) altered mental status, defined as the first recorded Glasgow Coma Scale score <14 after ICU admission. When multiple measurements were available within the window, continuous variables were summarised according to our prespecified approach (the 24-hour mean).
Variables with missing data exceeding 20% were excluded. Remaining missing values were imputed using multiple imputation by chained equations (MICE) implemented in R (package mice), generating 10 imputed datasets (m=10) using default settings. Each imputed dataset was analysed separately, and estimates were pooled using Rubin’s rules to obtain final coefficients and 95% confidence intervals. The maximum missingness across included covariates was 6.7%. Patients with missing serum creatinine or albumin were excluded a priori; therefore, CAR was calculated without missingness. The CAR was calculated as serum creatinine (mg/dL) divided by serum albumin (g/dL).
Outcome measures
The primary endpoint was 28-day all-cause mortality, while the secondary endpoint was 365-day all-cause mortality. The two time horizons were chosen to reflect acute-phase and longer-term prognosis, respectively. Survival status at both 28 days and 365 days was available for all included patients.
External validation cohort (eICU-CRD) and validation procedures
External validation was performed using the eICU Collaborative Research Database (eICU-CRD), a publicly available, de-identified multicenter ICU database in the United States. Using the same prespecified criteria as in the MIMIC-IV analysis, we identified adult patients admitted to the ICU with gastrointestinal bleeding and applied identical inclusion/exclusion criteria, including exclusion of ICU stay <24 hours and exclusion of patients with missing serum creatinine or albumin required for CAR calculation.
Variables were harmonized across databases using consistent definitions and time windows. Specifically, continuous variables were summarized using measurements recorded within the first 24 hours of ICU admission (mean within the window), and categorical variables were derived from the first documented value. CAR was calculated as serum creatinine (mg/dL) divided by serum albumin (g/dL).
External validation focused on 28-day all-cause mortality and was conducted by replicating the primary analytic framework in eICU-CRD using the covariates available in this database (ie, the covariates required for the fully adjusted Cox model in the derivation cohort). We evaluated the association between CAR and 28-day mortality using multivariable Cox proportional hazards models, assessed potential non-linearity using restricted cubic splines, and compared discrimination using ROC analyses for CAR and AIMS65.
Statistical analysis
The normality of continuous variables was assessed using the Kolmogorov–Smirnov test, with all variables demonstrating non-normal distributions (p < 0.05). Continuous variables were therefore expressed as medians with interquartile ranges (IQRs), and group comparisons were performed using the Mann–Whitney U test. Categorical variables were presented as counts with percentages, and inter-group comparisons were conducted using Pearson’s χ2 test or Fisher’s exact test, as appropriate. Survival analysis was performed using Kaplan–Meier curves stratified by CAR quartiles, with between-strata differences assessed via log-rank tests.
For the primary outcome of 28-day all-cause mortality, we implemented a staged analytical approach. Potential covariates were initially screened through univariate analysis (retention threshold p < 0.05), followed by stepwise multivariable selection (retention p < 0.05) with assessment for multicollinearity (VIF < 5 required for inclusion). Three progressively adjusted Cox proportional hazards models were developed: Model 1 (adjusted for demographics: age, sex, race); Model 2 (additional adjustment for Red Cell Distribution Width and Systolic Blood Pressure); and Model 3 (fully adjusted with all significant covariates from the selection process). CAR was examined both as a continuous variable and by quartiles (with Q1 as the reference) to evaluate potential dose–response relationships. The proportional-hazards assumption was assessed using Schoenfeld residuals, and no violation was detected (P=0.244).
Model discrimination was assessed by comparing AUC values among CAR alone, clinical scoring systems, including the gastrointestinal bleeding–specific score AIMS65, and combined models incorporating CAR with these scores. ROC curves and AUCs for both 28-day and 365-day mortality were estimated using standard binary classification methods based on fixed time-point outcomes. Survival status at both time horizons was available for all included patients; therefore, there was no loss to follow-up and no censoring for these endpoints, and time-dependent ROC methods accounting for censoring were not required. AUCs were compared using the DeLong test. RCS with three knots were used to examine potential non-linear associations between CAR and outcomes. To further explore the potential non-linear relationship between CAR and patient prognosis, we used log10-transformed CAR as a continuous variable (referred to as CAR1) and applied a three-knot (10th, 50th, 90th centiles) RCS Cox regression model. Based on this framework, comprehensive subgroup analyses were then performed across clinically important patient populations, including those with sepsis, cirrhosis, diabetes, heart failure (HF), myocardial infarction (MI), ischemic heart disease (IHD), and patients receiving mechanical ventilation (MV). Interaction effects were evaluated using likelihood ratio tests comparing models with and without interaction terms under this corrected significance level.
To strengthen clinical applicability, the Boruta machine-learning algorithm was applied to identify the most informative predictors of 28-day mortality. Variables retained by Boruta were subsequently entered into a multivariable Cox proportional hazards model. Based on this model, a nomogram was developed using the “rms” package in R to provide individualized survival estimates. Model performance was evaluated by the area under the ROC curve, Harrell’s concordance index (C-index), calibration with 1,000 bootstrap resamples, and DCA. External validation was conducted in the independent multicenter eICU-CRD cohort to confirm robustness and generalizability. All statistical analyses were conducted using R (version 4.2.2).
Results
Patient demographics and baseline characteristics.
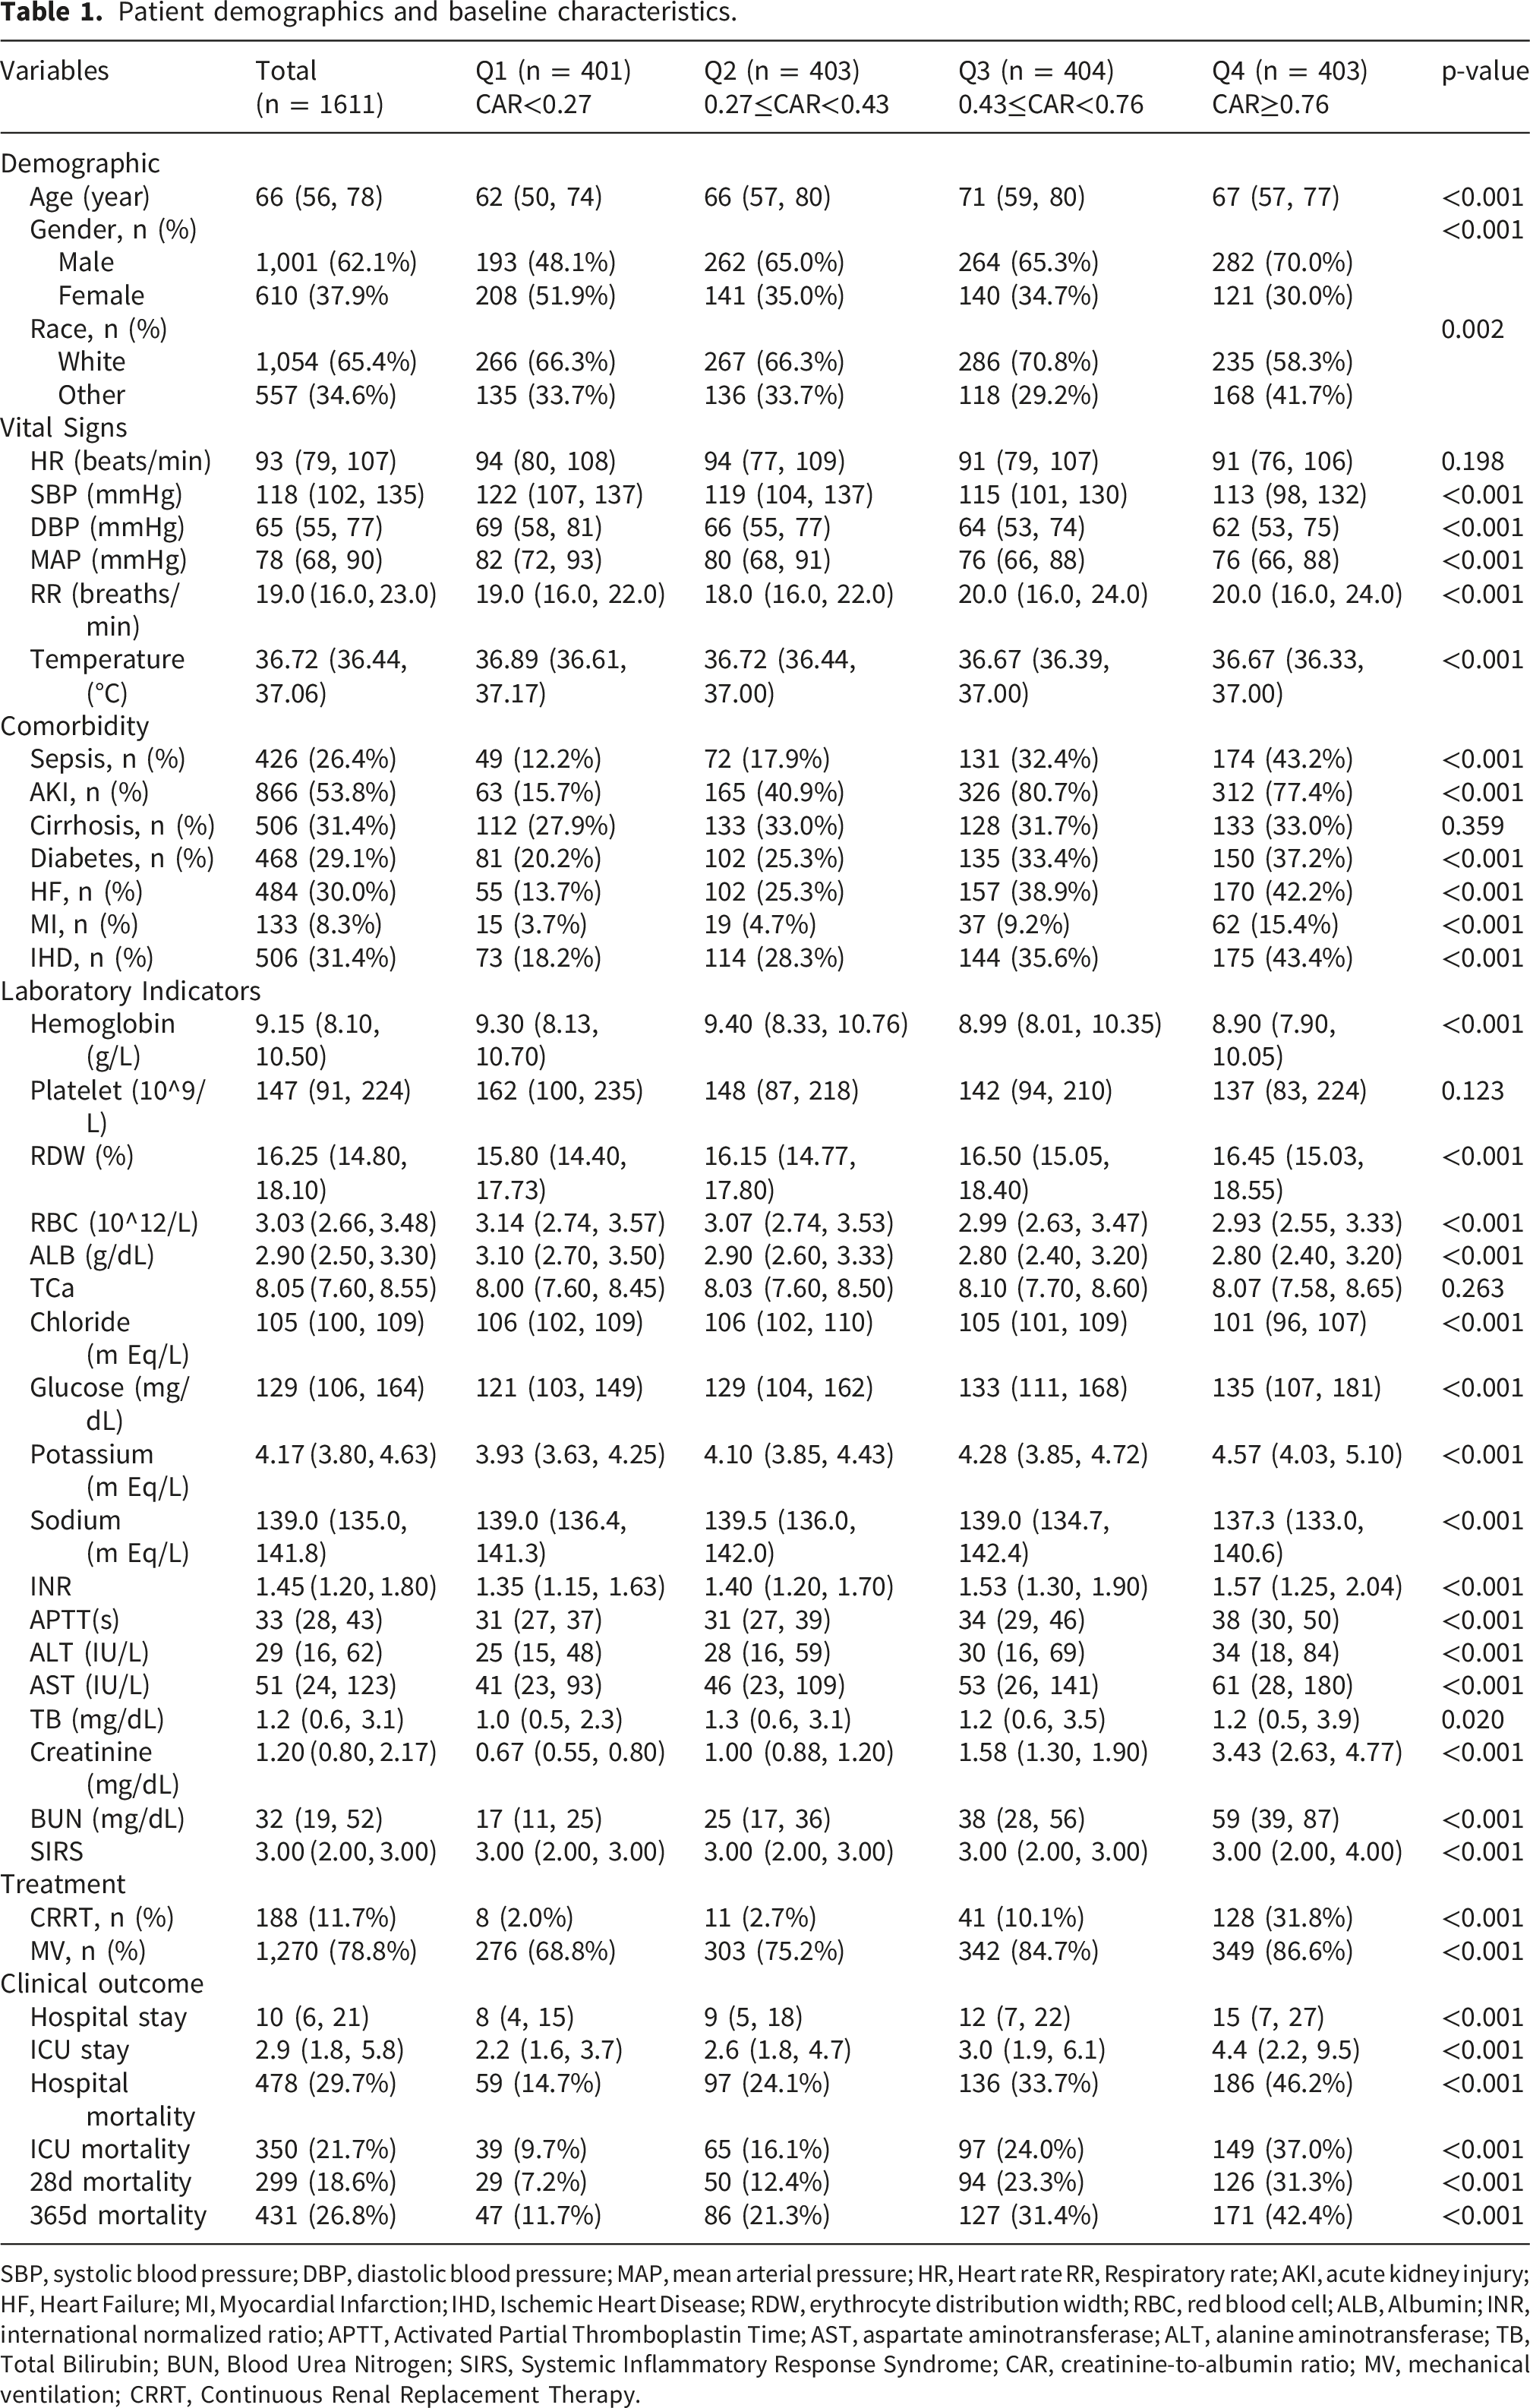
SBP, systolic blood pressure; DBP, diastolic blood pressure; MAP, mean arterial pressure; HR, Heart rate RR, Respiratory rate; AKI, acute kidney injury; HF, Heart Failure; MI, Myocardial Infarction; IHD, Ischemic Heart Disease; RDW, erythrocyte distribution width; RBC, red blood cell; ALB, Albumin; INR, international normalized ratio; APTT, Activated Partial Thromboplastin Time; AST, aspartate aminotransferase; ALT, alanine aminotransferase; TB, Total Bilirubin; BUN, Blood Urea Nitrogen; SIRS, Systemic Inflammatory Response Syndrome; CAR, creatinine-to-albumin ratio; MV, mechanical ventilation; CRRT, Continuous Renal Replacement Therapy.
Age progressively increased from a median of 62 years (IQR 50–74) in Q1 to 71 years (IQR 59–80) in Q3, before declining slightly to 67 years (IQR 57–77) in Q4 (p < 0.001). Male representation rose significantly from 48.1% (Q1) to 70.0% (Q4) (p < 0.001). Progressive deterioration in renal function was evident, with serum creatinine levels increasing from 0.67 mg/dL (IQR 0.55–0.80) in Q1 to 3.43 mg/dL (IQR 2.63–4.77) in Q4 (p < 0.001).
The prevalence of comorbidities exhibited a quartile-dependent increase, with diabetes increasing from 20.2% (Q1) to 37.2% (Q4) (p < 0.001) and heart failure increasing from 13.7% (Q1) to 42.2% (Q4) (p < 0.001). Critical care interventions were more frequent in higher CAR groups: mechanical ventilation use rose from 68.8% (Q1) to 86.6% (Q4) (p < 0.001), and continuous renal replacement therapy (CRRT) utilization increased markedly from 2.0% (Q1) to 31.8% (Q4) (p < 0.001).
Hospital and ICU lengths of stay also exhibited progressive increases, with median durations rising from 8 days (IQR 4–15) to 15 days (IQR 7–27) (p < 0.001) and from 2.2 days (IQR 1.6–3.7) to 4.4 days (IQR 2.2–9.5) (p < 0.001), respectively. Mortality rates showed significant quartile-dependent variation, with 28-day mortality increasing from 7.2% (Q1) to 31.3% (Q4) (p < 0.001) and ICU mortality rising from 9.7% (Q1) to 37.0% (Q4) (p < 0.001).
Most laboratory parameters, including hemoglobin levels and liver enzymes, exhibited statistically significant trends (p < 0.05), with the exception of platelet count (p = 0.123). These findings highlight substantial clinical and biochemical heterogeneity across CAR quartiles, with higher CAR levels being associated with greater disease severity, increased resource utilization, and worse clinical outcomes.
Primary outcomes
Kaplan–Meier survival analysis demonstrated that patients in the highest CAR quartile (Q4) had significantly poorer survival rates at both the 28-day and 365-day follow-ups (log-rank p < 0.001; Figure 2). Kaplan-Meier survival analysis curves for all-cause mortality in patients with GIB at 28-d and 365-d of hospital admission.
Three sequentially adjusted Cox models were constructed to test the association between CAR and mortality. Variables were selected through univariable screening (p < 0.05), followed by multivariable analysis; collinearity was excluded. The final multivariate models were adjusted for age, sex, race, systolic blood pressure (SBP), red cell distribution width (RDW), total calcium (TCa), total bilirubin (TB), activated partial thromboplastin time (APTT), sepsis, cirrhosis, diabetes, MV, and the ICU severity score OASIS.
28-day mortality risk
Continuous CAR
Each unit increase in CAR was associated with a 29% to 67% elevation in mortality risk across models (Model 1: HR 1.67, 95% CI 1.44–1.94; Model 2: HR 1.60, 95% CI 1.38–1.87; Model 3: HR 1.29, 95% CI 1.09–1.53; all p ≤ 0.003).
Quartile-based analysis
Compared to Q1 (reference), hazard ratios increased progressively—Q2 (HR 1.86, 95% CI 1.17–2.94; p = 0.008), Q3 (HR 3.67, 95% CI 2.40–5.60; p < 0.001), and Q4 (HR 5.20, 95% CI 3.45–7.89; p < 0.001) in the minimally adjusted model. After full adjustment (Model 3), the gradient persisted (Q2 HR 1.45, p = 0.113; Q3 HR 2.16, p < 0.001; Q4 HR 2.76, p < 0.001), with a significant trend across quartiles (p for trend < 0.001).
365-day mortality risk
Continuous CAR
Per-unit increments in CAR were linked to a 24–63% increased risk of mortality (Model 1: HR 1.63, 95% CI 1.44–1.85; Model 2: HR 1.57, 95% CI 1.38–1.79; Model 3: HR 1.24, 95% CI 1.07–1.43; all p ≤ 0.004).
Quartile stratification
Association between CAR and mortality in gastrointestinal bleeding.

Model 1: adjusted for Age, Gender, and RACE.
Model 2: adjusted for Age, Gender, RACE, SBP, and RDW.
Model 3: adjusted for Age, Gender, RACE, SBP, RDW, TCa, APTT, TB, Sepsis, Cirrhosis, Diabetes, MV, and OASIS.
Sensitivity analyses (robustness of exposure definition)
To assess the robustness of the exposure definition, we recalculated CAR using the first available creatinine and albumin measurements on the first ICU day (FCAR). We also excluded patients who received albumin infusion on day 1 (n = 92) or CRRT on day 1 (n = 183) and repeated the fully adjusted analyses. In addition, to account for baseline renal dysfunction and renal replacement therapy, we repeated the analyses after excluding patients with pre-existing CKD (n = 391) and those who received CRRT on day 1 (n = 183). The results were consistent with the primary analyses (Supplemental Table 3; Supplemental Table 4).
ROC curves
To assess the prognostic value of CAR, creatinine, and albumin, ROC curve analyses were performed for both 28-day and 365-day mortality. Additionally, the predictive performance of the established gastrointestinal bleeding–specific risk score AIMS65 was evaluated, along with its combination with CAR (AIMS65+CAR) (Figure 3; Table 3). The combined model (AIMS65+CAR) was constructed as a multivariable prediction model incorporating AIMS65 and CAR, and ROC were derived from the model output (predicted risk), rather than by simple arithmetic addition. ROC curves for predicting all-cause mortality in patients with GIB at 28-d and 365-d of hospital admission. Information of ROC curves in Figure 3. ROC, receiver operating characteristic; AUC, area under the curve; CI, confidence interval; Cr, Creatinine; ALB, Albumin; CAR, creatinine-to-albumin ratio; AIMS65, Albumin, INR, Mental status, Systolic blood pressure, Age ≥65.

CAR alone demonstrated moderate discriminative ability. For 28-day mortality, its AUC was 0.678 (95% CI 0.645–0.710), significantly higher than that of Cr or ALB (DeLong test, p < 0.001). For 1-year mortality, CAR achieved an AUC of 0.669 (95% CI 0.640–0.698), again outperforming the individual biomarkers (Supplemental Figure 1).
Importantly, integrating CAR with AIMS65 further improved predictive accuracy. For 28-day mortality, the combined model (AIMS65+CAR) yielded an AUC of 0.685, compared with 0.644 for AIMS65 alone. Likewise, for 1-year mortality, AIMS65+CAR achieved an AUC of 0.675, compared with 0.636 for AIMS65 alone. Because ROC analysis focuses on discrimination, these ROC-derived cutoffs are presented as classification thresholds and are not intended as clinical risk-stratification thresholds.
Restricted cubic spline analysis
Using RCS regression with adjustments for potential confounders, we assessed the associations between CAR1 and both 28-day and 365-day mortality. The results demonstrated that CAR1 exhibited a significant global association with mortality risk (P-overall < 0.05) for both time points, with evidence of non-linearity (P-nonlinear < 0.05).
A piecewise Cox regression analysis identified a consistent inflection point at log10(CAR) = –0.026 (corresponding to CAR ≈ 0.94 on the original scale). Below this inflection point, each unit increase in log10(CAR) was associated with an exponential rise in mortality risk, whereas above the threshold, the risk stabilized, and the HR was no longer statistically significant (Figure 4). Accordingly, if a pragmatic cutoff is needed for risk stratification, the back-transformed RCS/segmented-model inflection point (CAR ≈ 0.94) may serve as a candidate reference value for exploratory (hypothesis-generating) risk stratification. However, this value should not be interpreted as a definitively validated clinical cutoff and warrants further external and prospective validation before clinical implementation. Association between CAR and survival with the RCS function at 28-d and 365-d of hospital admission.
Subgroup analyses
To further investigate potential effect modification by comorbidities strongly associated with gastrointestinal bleeding prognosis, we conducted subgroup analyses. No significant interaction effects were observed in subgroups stratified by age, sex, race, sepsis, liver cirrhosis, diabetes, heart failure, myocardial infarction, ischemic heart disease, or mechanical ventilation (all interaction P > 0.0025). These findings suggest that the association between CAR and mortality remains consistent across these clinically relevant subgroups (Figure 5). Forest plots of subgroup analysis of the relationship between all-cause mortality and CAR in patients with GIB admitted at 28-d and 365-d of hospital admission.
Prognostic factor identification and nomogram construction
To enable early risk stratification and strengthen clinical applicability, we applied the Boruta machine-learning algorithm to identify the most informative predictors of 28-day mortality (Supplemental Figure 2). Five variables—sepsis, APTT, CAR, TB, and blood urea nitrogen (BUN)—were retained and incorporated into a nomogram (Supplemental Figure 3) to estimate individual survival probabilities at 28 days.
Discriminative performance was assessed using ROC curve analysis. The nomogram achieved strong predictive accuracy, with an AUC of 0.779 (95% CI 0.750–0.807) for 28-day mortality (Supplemental Figure 4). Internal validation with 1,000 bootstrap resamples yielded bias-corrected calibration curves that closely approximated the ideal reference line (Supplemental Figure 5). The bias-corrected Harrell’s concordance index (C-index) was 0.774, confirming the robustness and consistency of the model. DCA further demonstrated meaningful net clinical benefit (Supplemental Figure 6).
To promote clinical translation, we implemented the nomogram as an interactive web-based calculator. By entering the five predictors and a specified time horizon, clinicians can directly obtain individualized mortality risk estimates. The calculator is freely accessible at https://once.shinyapps.io/dynnomapp/.
External validation using the eICU-CRD cohort
External validation was performed in an independent multicenter cohort from the eICU Collaborative Research Database (eICU-CRD). Using the same inclusion/exclusion criteria as in MIMIC-IV, we harmonized predictor definitions and time-window rules and applied the finalized 5-variable nomogram (with fixed coefficients derived from the MIMIC-IV derivation cohort) to generate predicted 28-day mortality risk. ROC curve analysis confirmed good discriminative ability of the nomogram, with an AUC of 0.785 (95% CI 0.765–0.806), and the Harrell’s concordance index (C-index) was 0.783 (Supplemental Figure 7). Calibration analysis showed good agreement between predicted and observed risks, indicating adequate calibration in the external cohort (Supplemental Figure 8).
In addition, to externally validate CAR as a prognostic marker, external validation was performed for 28-day mortality using covariates required for the fully adjusted Cox model. Consistent with the MIMIC-IV results, CAR remained an independent predictor of short-term mortality after multivariable adjustment. The RCS analysis revealed a similar nonlinear association between CAR and mortality as observed in the MIMIC-IV cohort. ROC curve analysis confirmed good discriminative ability, with an AUC of 0.682 for CAR and 0.713 for AIMS65 (Supplemental Figure 9–10; Supplemental Table 5). These findings further support the external validity and potential generalizability of CAR for risk stratification in critically ill patients.
Discussion
Recently, markers such as bilirubin-to-albumin ratio, INR-to-albumin ratio, and serum anion gap show promise in predicting mortality in critically ill gastrointestinal patients.25–27 These indicators reflect key pathophysiological changes, including tissue hypoxia, coagulation abnormalities, and electrolyte imbalances, thereby providing valuable insight into disease severity. However, there remains a need to develop additional clinically accessible biomarkers to improve the efficiency of risk assessment in critically ill gastrointestinal patients. In the derivation cohort, integrating CAR with AIMS65 modestly improved discrimination, whereas in the external cohort AIMS65 outperformed CAR alone, supporting CAR as a complementary biomarker that may add prognostic information to established scores rather than replacing them.
This study demonstrates that, among critically ill patients with GIB, the composite CAR independently predicts all-cause mortality after adjustment for confounders. Kaplan–Meier analysis subsequently revealed a stepwise decline in cumulative survival across successive CAR strata (log-rank P < 0.001). The area under the ROC curve for CAR surpassed that of either creatinine or albumin alone. Integrating CAR with the established AIMS65 score further enhanced model discrimination. RCS regression indicated a nonlinear dose–response relationship between CAR and mortality probability, and stratified analyses confirmed consistent predictive accuracy across subgroups without evidence of interaction. External validation supported the generalizability of the CAR–mortality association, while indicating that AIMS65 remained a strong standalone score.
The CAR has emerged as a robust prognostic indicator in critical care settings. For instance, in a retrospective cohort of ICU patients with acute pancreatitis, a CAR cutoff ≥0.446 was significantly associated with increased all-cause mortality, demonstrating superior predictive performance (AUC: 70.98% on day 28) compared to isolated creatinine (67.91%) or albumin (34.08%) measurements. 20 Similarly, Sun et al. observed that in ICU patients with hemorrhagic stroke, those with CAR >0.408 had a 2.3-fold higher 28-day mortality risk (95% CI: 1.58–3.35; P < 0.001) than those with lower ratios. 22 Among 2,350 septic ICU patients, Chai et al. further confirmed the significant association between elevated CAR and increased 28-day mortality (P < 0.001). 21 Collectively, these studies demonstrate CAR’s utility as a biomarker of systemic inflammatory dysregulation and its prognostic value across heterogeneous critically ill populations.
In patients with GIB, elevated serum creatinine levels typically indicate renal dysfunction. Creatinine, a metabolic byproduct of creatine and phosphocreatine breakdown, is produced at a stable rate with minimal influence from acute metabolic fluctuations or dietary intake.10,28 Its elimination occurs almost entirely via glomerular filtration, with negligible tubular reabsorption. 29 Acute hemorrhage reduces renal perfusion and circulating volume, leading to a decline in GFR. This impairment in renal clearance results in the subsequent accumulation of serum creatinine. 30 Although compensatory mechanisms, such as activation of the renin–angiotensin–aldosterone system, may temporarily maintain renal perfusion, persistent hypovolemia ultimately overwhelms these adaptive responses, worsening renal ischemia and functional decline.31,32 Concurrently, hypoxic stress induces excessive reactive oxygen species (ROS) generation in tubular epithelial cells, contributing to mitochondrial dysfunction and further nephron damage.33–35 Additionally, medications frequently administered to GIB patients—including nonsteroidal anti-inflammatory drugs (NSAIDs), diuretics, and RAAS inhibitors—can exacerbate renal impairment. 36
GIB induces concurrent systemic inflammation and oxidative stress, both of which significantly impair albumin homeostasis. Increased capillary permeability promotes albumin extravasation into the interstitial compartment, while proinflammatory cytokines (particularly TNF-α and IL-6) suppress hepatic albumin synthesis.37–39 Albumin serves multiple physiologic functions that are particularly crucial during acute illness. This versatile protein maintains colloid osmotic pressure, functions as a primary extracellular antioxidant, and binds numerous ligands including fatty acids, endotoxins, and heavy metals.40–43 Its immunomodulatory and free radical-scavenging properties play vital roles in mitigating tissue injury during systemic inflammatory states. 44 Clinically, hypoalbuminemia represents more than simply a marker of malnutrition or inflammatory status. It actively contributes to disease progression through three key mechanisms: (1) impaired detoxification capacity, (2) exacerbation of oxidative stress, and (3) compromised vascular integrity.
The CAR provides a more comprehensive evaluation of physiological stress than isolated renal or hepatic biomarkers by simultaneously reflecting both organ functions. This ratio serves as an integrated proxy for multiple pathophysiological processes—including hypovolemia, systemic inflammation, oxidative stress, and impaired tissue perfusion—making it particularly valuable for risk stratification in critically ill GIB patients.
As it is derived from routinely measured laboratory parameters, CAR represents an easily obtainable, cost-effective, and clinically scalable tool for rapid decision-making using routinely available laboratory data within the first 24 hours of ICU admission. Elevated CAR levels may signal early systemic decompensation, warranting closer monitoring and prompt intervention, whereas stable or low CAR values might indicate hemodynamic and metabolic equilibrium. Due to its strong prognostic implications, CAR assessment could improve early risk prediction and optimize resource allocation in GIB management.
While this study analyzed a large-scale real-world population, several limitations warrant acknowledgment. First, the retrospective observational design precludes causal inference between variables. Second, although our primary analysis was based on a single-center database, the inclusion of an external multicenter validation cohort partially mitigates this limitation. Third, GIB was identified using ICD-9/10 codes, which may introduce misclassification and etiologic heterogeneity (e.g., UGIB vs LGIB; variceal vs non-variceal; active bleeding vs prior history). To partially address this concern, we performed stratified analyses for UGIB and LGIB and observed no significant interaction; however, supportive clinical adjudication (e.g., endoscopic findings/hemostatic intervention, transfusion details, or standardized hemoglobin-drop criteria) was not uniformly available due to database constraints. Moreover, variceal bleeding could not be directly ascertained; therefore, we used cirrhosis status as a pragmatic surrogate in exploratory subgroup analyses, which remains imperfect. Additionally, the lack of granular disease severity stratification restricts our ability to assess prognosis across clinically distinct patient subgroups. Moreover, although we posit plausible mechanistic links between the CAR and inflammatory/malnutrition pathways, experimental validation at cellular and molecular levels remains necessary to elucidate underlying biological mechanisms. Future multi-center prospective studies incorporating standardized severity metrics and clinically adjudicated bleeding phenotypes would strengthen these observations.
Conclusion
In conclusion, higher CAR values were associated with increased mortality in patients with GIB. CAR may complement commonly used risk scoring systems, such as AIMS65, by potentially improving the identification of high-risk patients for early risk stratification. These findings were externally validated in an independent multicenter cohort, and were further translated into a parsimonious nomogram and web-based calculator to support scalable, early ICU-course (first-24-hour) risk stratification and may help inform clinical decision-making for GIB management. Any candidate CAR reference value derived from spline/piecewise analyses should be interpreted as exploratory and requires further validation before being used as a definitive clinical threshold.
Supplemental material
Supplemental material -Creatinine-to-albumin ratio for early ICU-course (first 24 hours) risk stratification of mortality in critically ill patients with gastrointestinal bleeding: A retrospective cohort study
Supplemental material for Creatinine-to-albumin ratio for early ICU-course (first 24 hours) risk stratification of mortality in critically ill patients with gastrointestinal bleeding: A retrospective cohort study by Yiling Ying, Xiangshu Yuan, Xian Zhang, Guangdong Wang, Lang Gao, Yuanshuo Ge, Lihong Lv and Xingyi Yang in Science Progress.
Footnotes
Ethical considerations
The MIMIC-IV database was approved by the Institutional Review Board (IRB) at Beth Israel Deaconess Medical Center (IRB Protocol No. 2001P-001699/14). The eICU Collaborative Research Database (eICU-CRD) is a publicly available, de-identified database; all tables are deidentified to meet the HIPAA safe harbor provision, and the re-identification risk has been certified (HIPAA Certification No. 1031219-2). Given the use of de-identified data and the retrospective secondary analysis design, additional ethical approval was not required (not applicable), and individual informed consent was waived. This study was conducted in accordance with the Declaration of Helsinki (1975, as revised in 2024).
Author contributions
Funding
The authors received no financial support for the research, authorship, and/or publication of this article.
Declaration of conflicting interests
The authors declared no potential conflicts of interest with respect to the research, authorship, and/or publication of this article.
Supplemental material
Supplemental material for this article is available online.
References
Supplementary Material
Please find the following supplemental material available below.
For Open Access articles published under a Creative Commons License, all supplemental material carries the same license as the article it is associated with.
For non-Open Access articles published, all supplemental material carries a non-exclusive license, and permission requests for re-use of supplemental material or any part of supplemental material shall be sent directly to the copyright owner as specified in the copyright notice associated with the article.