
Abstract
Background:
This study investigated the correlation between admission partial pressure of arterial oxygen (PaO2) levels and both in-hospital mortality and 1-year all-cause mortality among patients diagnosed with coronavirus disease (COVID-19) pneumonia.
Methods:
This retrospective cohort study included patients with COVID-19 pneumonia admitted to the First Hospital of Jinzhou Medical University. Restricted cubic spline regression and logistic regression analyses were employed to assess the relation between PaO2 levels and the risk of in-hospital mortality and all-cause mortality within 1 year. Subgroup analyses were performed, stratified by age, sex, presence of cardiac disease, diabetes, hypertension, whether supplemental oxygen was provided during arterial blood gas analysis, and severity of pneumonia.
Results:
The study included 737 participants with in-hospital and 1-year all-cause mortality rates of 15.7% and 26.7%, respectively. Restricted cubic spline analysis revealed an L-shaped association between admission PaO2 levels and in-hospital mortality (P nonlinear <0.001) and a U-shaped relation with 1-year all-cause mortality (P nonlinear <0.001), with a nadir risk of 82 mmHg. Threshold analyses indicated an odds ratio of 0.931 (95% confidence interval (CI): 0.91–0.952) for in-hospital mortality and 0.951 (95% CI: 0.933–0.969) for 1-year all-cause mortality when PaO2 was <82 mmHg. Conversely, when PaO2 was ≥82 mmHg, the odds ratio for in-hospital mortality was 1.022 (95% CI: 0.991–1.055), and for 1-year all-cause mortality was 1.029 (95% CI: 1.004–1.054).
Conclusions:
This study revealed a nonlinear relation between PaO2 levels at admission and both in-hospital mortality and 1-year all-cause mortality in patients with COVID-19 pneumonia, with a notable inflection point observed at approximately 82 mmHg.
Introduction
Severe acute respiratory syndrome coronavirus 2 (SARS-CoV-2) is the causative agent of the COVID-19 pandemic, which has profoundly impacted global health, societal structures, and economies. 1 A significant proportion of patients with COVID-19 pneumonia who experience hypoxemia require hospitalization. 2 Among these hospitalized individuals, approximately 15–30% may develop COVID-19-associated acute respiratory distress syndrome (ARDS). 3 Despite intensive care unit (ICU) support, patients with severe cases continue to exhibit high mortality rates.4,5 Hypoxemia in these patients is marked by a complex interplay of ventilation-perfusion mismatch, endothelial dysfunction, immunothrombosis, and neovascularization. These pathophysiological changes result in increased lung weight, altered compliance, and more pronounced dead space, leading to respiratory compromise and potentially pulmonary fibrosis. 6 Supplemental oxygen therapy is crucial for mitigating hypoxemia and ensuring adequate tissue oxygenation.However, research indicates that excessive oxygen can worsen existing lung injuries in patients with COVID-19. 7 The principal mechanisms involved include hyperoxia-induced epithelial cell apoptosis, disturbances in surfactant metabolism, increased oxidative stress from reactive oxygen species, and a pro-inflammatory response due to elevated angiotensin II following angiotensin-converting enzyme 2 receptor downregulation. Furthermore, imbalances in the pulmonary and gastrointestinal microbiota may increase susceptibility to secondary bacterial infections. 7 Despite the critical importance of oxygen therapy, optimal oxygenation targets remain elusive, with no universally endorsed PaO2 goal for critically ill patients.8,9 Moreover, conventional indices, such as SaO2/FiO2 and PaO2/FiO2 ratios, may inadequately reflect hypoxemia severity in COVID-19 pneumonia or ARDS.10,11 In addition, SpO2 may not reliably predict hypoxia in COVID-19-related ARDS. 12 In view of the aforementioned studies, blood PaO2 level is considered the most accurate indicator for assessing oxygenation status. 13 Therefore, this study aimed to elucidate the relation between PaO2 levels at admission, in-hospital, and 1-year all-cause mortality in patients with COVID-19 pneumonia.
Methods
Study design and participants
This retrospective cohort study included 997 individuals diagnosed with COVID-19 pneumonia between 1 December 2022 and 1 March 2023, at the First Affiliated Hospital of Jinzhou Medical University in Liaoning, China. Diagnosis of COVID-19 pneumonia is made by a combination of positive Reverse transcription polymerase chain reaction or rapid antigen testing conducted on nasal or nasopharyngeal swab samples and chest computed tomography (CT) imaging.
Relevant data on the patients’ demographic characteristics, medical history, treatment modalities, and laboratory findings were extracted from their original medical records. Demographic variables, including age, sex, and smoking status, were collected. Vital signs including body temperature (T), heart rate (HR), and respiratory rate (RR) were recorded. Hospital-related parameters, such as the length of hospital stay and utilization of mechanical ventilation (MV), noninvasive ventilation (NIV), and high-flow oxygen therapy were documented. Additionally, comorbidities, such as hypertension (HTN), diabetes mellitus, coronary heart disease (CHD), cerebrovascular disease, cancer, and chronic obstructive pulmonary disease were noted. Biochemical parameters, including aspartate aminotransferase (AST), alanine aminotransferase, albumin (ALB), urea, and creatinine levels, were measured. Hematological parameters included white blood cell (WBC) count, neutrophil percentage, lymphocyte percentage, platelet count, and hemoglobin (HB) level. Blood gas analyses included partial pressure of oxygen (PaO2), partial pressure of carbon dioxide (PaCO2), oxygen saturation (SaO2), lactate levels, fraction of inspired oxygen (FiO2%), and pH. Blood gas analyses and other hematological parameters were collected within the first 24 hours of admission. All parameters were evaluated using standard laboratory tests.
Inclusion and exclusion criteria
The inclusion criteria for this study were patients diagnosed with COVID-19 pneumonia and aged 18 years or older. The exclusion criteria were as follows: (1) patients lost to follow up, (2) pregnant individuals, and (3) patients lacking PaO2 data or incomplete covariate information. Severe COVID-19 was defined by the presence of any of the following conditions: dyspnea with an RR ≥30/min; SaO2 ≤ 93% on room air; arterial PaO2/fraction of inspired oxygen (FiO2) ≤ 300 mmHg; or lung lesion progression >50% on CT within 24–48 hours. 14 Hyperoxemia and hypoxemia were defined as PaO2 > 100 and <55–60 mmHg, respectively. 9
Sample size
To ascertain the requisite sample size for this study, we consulted current literature indicating a 1-year all-cause mortality rate of 33.6% among patients with COVID-19. 15 Utilizing this mortality rate, it was determined that a minimum sample size of 512 patients is necessary to attain a confidence level of 95% and a precision of 10%. 16
Outcomes
The primary outcome was all-cause mortality during hospitalization and within 1 year after discharge. Additionally, the 1-year survival status of patients after discharge was determined through telephone follow up. The secondary outcome measure was in-hospital mortality. In-hospital death was defined as death occurring during hospitalization or within 24 hours of discharge.
Ethical considerations
This study adhered to the principles outlined in the Declaration of Helsinki and was approved by the Ethics Review Board of the First Affiliated Hospital of Jinzhou Medical University (KYLL2024384). Due to the retrospective nature of this study and the removal of all patient identifying information, informed consent was waived. The reporting of this study is in accordance with the STROBE guidelines. 17
Statistical analysis
Descriptive statistics were used to summarize baseline patient characteristics. The Kolmogorov–Smirnov test was used to assess the normal distribution of variables. Continuous variables were expressed as mean ± standard deviation or median (interquartile range). Categorical variables were presented as absolute values and percentages. The chi-square test or Fisher's exact test was used to analyze categorical variables. Analysis of variance was used for normally distributed continuous variables, whereas the Kruskal–Wallis test was applied for skewed continuous variables.
Logistic regression models were used to determine the odds ratios (ORs) and 95% confidence intervals (CIs) for the association between PaO2 levels and 1-year and in-hospital mortality. The study population was stratified into quartiles based on the PaO2 values. The regression analysis included adjustments for various factors in the three models. Covariates were selected based on variables whose ORs changed by at least 10% after inclusion in the model, as well as clinical significance. Model 1: Adjusted for sex and age. Model 2: Adjusted for Model 1 plus HTN, diabetes mellitus, CHD, cancer, and chronic obstructive pulmonary disease. Model 3: Adjusted for Model 2 plus AST, ALB, urea, creatinine, neutrophil percentage, lymphocyte percentage, FiO2%, and lactate. Restricted cubic spline (RCS) regression was used to assess the association between PaO2 levels and in-hospital and 1-year mortality, respectively. A two-piecewise logistic regression model with smoothing was used to analyze the association threshold between PaO2 and in-hospital and 1-year mortality after adjusting for the variables in Model 3. Likelihood ratio tests and the bootstrap resampling method were used to determine the inflection points.
Interaction and stratified analyses according to age, sex, HTN, diabetes mellitus, CHD, oxygen supplementation, and presence of severe pneumonia were also conducted. Statistical significance was set at p < 0.05, as determined by two-tailed testing. Statistical analyses were performed using R version 4.2.2 and Free Statistics Software version 1.8. 18
Results
Patient characteristics and outcomes
Initially, 997 patients diagnosed with COVID-19 were included in this study. However, 197 patients were excluded from the analyses because of missing PaO2 and covariate data. Additionally, 63 patients lost to follow up were excluded, leaving a final enrollment of 737 patients. Figure 1 illustrates a flowchart of the study participant screening process.
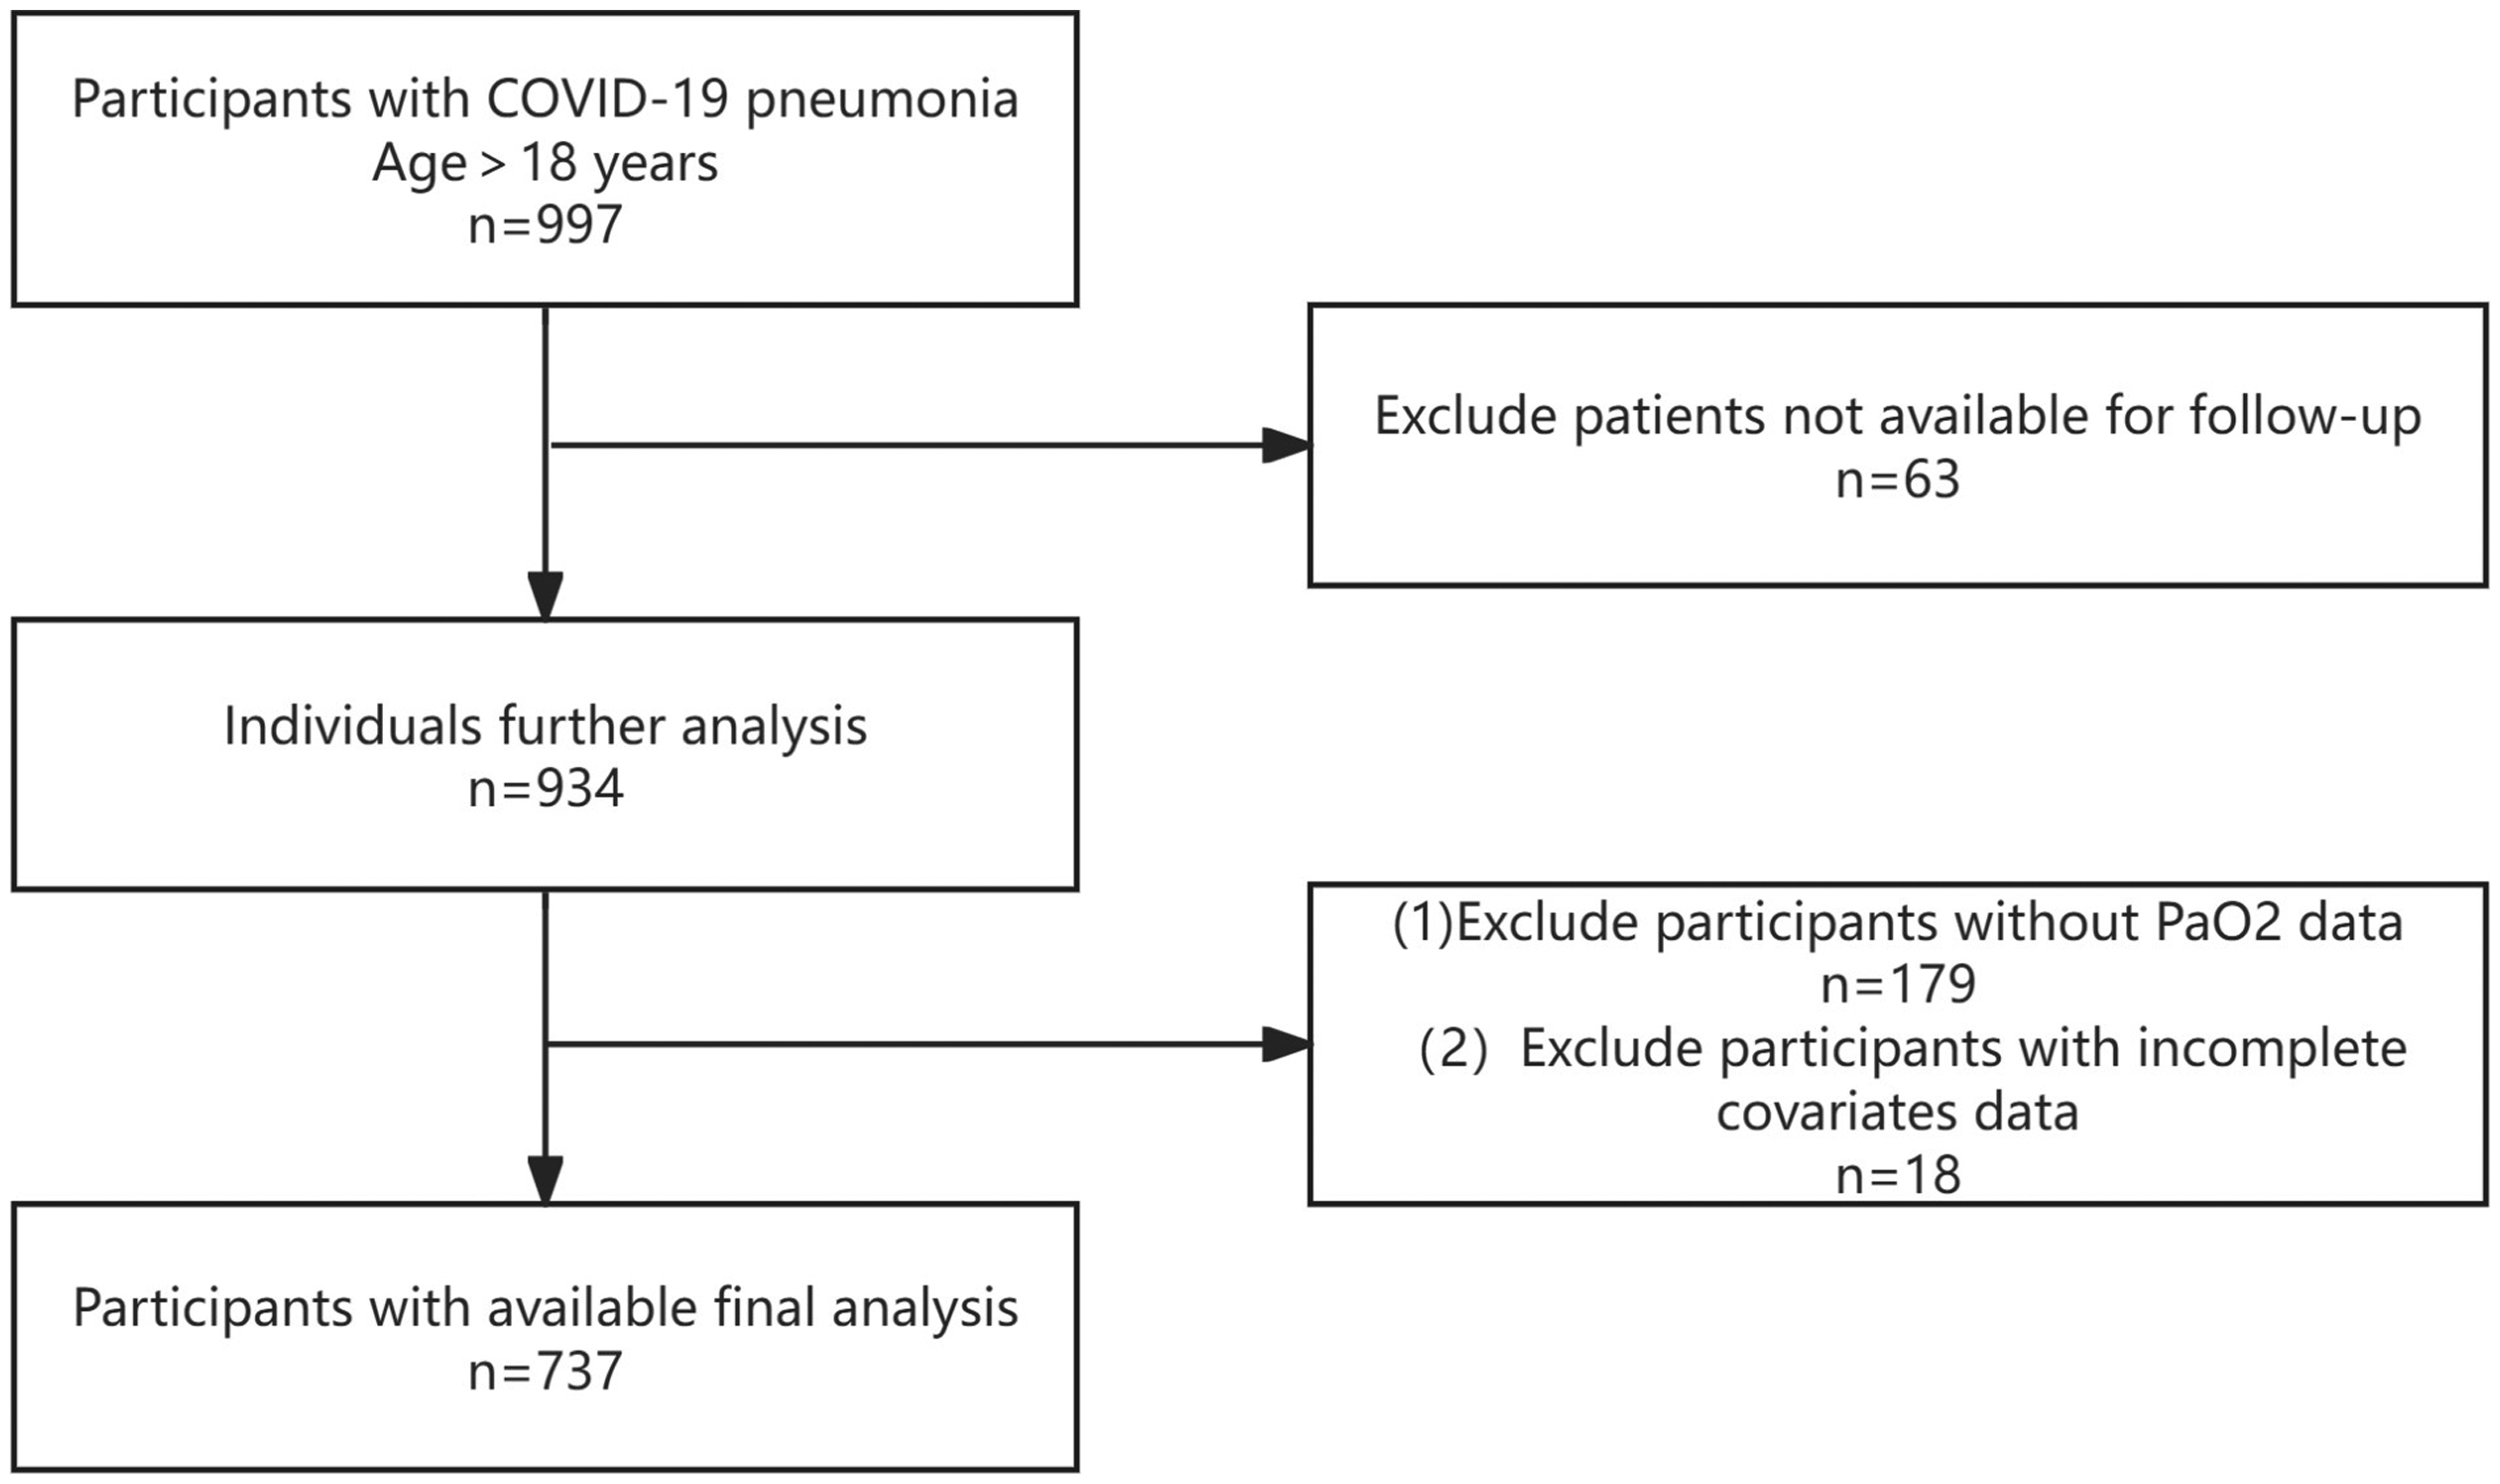
The study's flow diagram.
Table 1 summarizes the demographic characteristics, vital signs, comorbidities, treatments, laboratory findings, and outcomes of the 737 participants. The mean age of the patients included in our study was 73.5 ± 12.2 years, with 425 (57.7%) being men. In-hospital mortality was observed in 116 patients (15.7%), while 1-year mortality occurred in 197 patients (26.7%).
Baseline demographic characteristics of the study population stratified by PaO2.

ALB: albumin; ALT: alanine aminotransferase; AST: aspartate aminotransferase; CHD: coronary heart disease; cLac: lactate; COPD: chronic obstructive pulmonary disease; CVD: cerebrovascular disease; HB: hemoglobin; HTN: hypertension; HR: heart rate; DM: diabetes mellitus; HFNC: high flow nasal cannula; LOS: length of stay; T: body temperature; RR: respiratory rate; MV: mechanical ventilation; NEU%: neutrophil percentage; NIV: noninvasive ventilation; PaCO2: partial pressure of carbon dioxide; PaO2: partial pressure of oxygen; PLT: platelet; Q: quartiles; WBC: white blood cell count.
PaO2 and in-hospital mortality
Univariate analysis demonstrated associations between in-hospital mortality and various factors, including age, length of stay, T, HR, RR, CHD, HTN, FiO2%, arterial PaO2, PaO2/FiO2 ratio, arterial PaCO2, arterial SaO2%, lactate concentration, WBC count, percentage of neutrophils, percentage of lymphocytes, HB, platelet count, AST, ALB, urea, creatinine, use of high-flow nasal cannula (HFNC), NIV, invasive MV, and severe pneumonia (Supplemental Table S1).
When PaO2 was analyzed in quartiles, a significant inverse association was observed between PaO2 and in-hospital mortality after adjusting for potential confounders. Compared with observations in individuals with PaO2 in the first quartile (20.5–59.9 mmHg), the adjusted OR values for PaO2 in the second quartile (60–79.9 mmHg), third quartile (80–99.5 mmHg), and fourth quartile (100–188 mmHg) were 0.2 (95% CI: 0.12–0.35, p < 0.001), 0.19 (95% CI: 0.09–0.4, p < 0.001), and 0.22 (95% CI: 0.08–0.64, p = 0.005), respectively (Table 2). Consequently, the association between PaO2 and in-hospital mortality demonstrated an L-shaped curve (nonlinear, p < 0.001) in RCSs (Figure 2(a)).

(a) The nonlinear relationship between PaO2 and in-hospital mortality in patients with COVID-19 pneumonia. Only 99.5% of the data is displayed. (b) Nonlinear relationship between PaO2 and all-cause mortality at 1 year in COVID-19 pneumonia patients; adjusted for age, sex, hypertension, diabetes mellitus, coronary heart disease, cancer, chronic obstructive pulmonary disease, aspartate aminotransferase, albumin, urea, creatinine, neutrophil percentage, lymphocyte percentage, FiO2%, and lactate.
Association of PaO2 levels with in-hospital and 1-year all-cause mortality in different models.

Model 1 adjusts for age, sex.
Model 2 adjusted for age, sex, hypertension, diabetes, coronary heart disease, cancer, and chronic obstructive pulmonary disease.
Model 3 adjusted for age, sex, hypertension, diabetes mellitus, coronary heart disease, cancer, chronic obstructive pulmonary disease, aspartate aminotransferase, albumin, urea, creatinine, neutrophil percentage, lymphocyte percentage, FiO2%, and lactate.
CI: confidence interval; OR: odds ratio; Q: quartiles; Ref: reference.
In the threshold analysis, the OR for in-hospital mortality was 0.931 (95% CI: 0.91–0.952, p < 0.001) in the participants with PaO2 < 82 mmHg (Table 3). This implies that the risk of in-hospital mortality decreases by 6.9% with every 1 mmHg increase in PaO2. No association between PaO2 and in-hospital mortality was observed when PaO2 was ≥82 mmHg (Table 3), indicating that the risk of in-hospital mortality ceases to decrease with increasing PaO2.
Threshold effect analysis of the relationship between PaO2 levels and both in-hospital mortality and 1-year all-cause mortality.

Adjusted for age, sex, hypertension, diabetes mellitus, coronary heart disease, cancer, chronic obstructive pulmonary disease, aspartate aminotransferase, albumin, urea, creatinine, neutrophil percentage, lymphocyte percentage, FiO2%, and lactate.
CI: confidence interval; OR: odds ratio.
PaO2 and 1-year all-cause mortality
Univariate analysis revealed associations between 1-year mortality and factors, including age, T, HR, RR, CHD, HTN, cancer, FiO2%, PaO2/FiO2 ratio, arterial PaO2, arterial SaO2, lactate concentration, WBC count, percentage of neutrophils, percentage of lymphocytes, HB, platelet count, AST, ALB, urea, creatinine, use of HFNC, NIV, invasive MV, and severe pneumonia (Supplemental Table S2).
When PaO2 was analyzed by quartiles, a significant nonlinear relation between PaO2 and 1-year all-cause mortality was observed after adjusting for potential confounders. Compared with observations in individuals in the third quartile of PaO2 (80–99.5 mmHg), the adjusted OR values for PaO2 and 1-year all-cause mortality in the first quartile (20.5–59.9 mmHg), second quartile (60–79.9 mmHg), and fourth quartile (100–188 mmHg) were 4.05 (95% CI: 2.2–7.46, p < 0.001), 1.77 (95% CI: 1.01–3.12, p = 0.047), and 2.86 (95% CI: 1.26–6.49, p = 0.012), respectively (Table 2). Consequently, the association between PaO2 and 1-year all-cause mortality demonstrated a U-shaped curve (nonlinear, p < 0.001) in RCS (Figure 2(b)).
In threshold analysis, a threshold value of approximately 82 mmHg was identified. Below this threshold, the OR for 1-year mortality was 0.951 (95% CI: 0.933–0.969, p < 0.001), while above this threshold, the OR for 1-year mortality was 1.029 (95% CI: 1.004–1.054, p = 0.0201) (Table 3). This represents a 4.9% reduction in the 1-year risk of all-cause mortality for every 1 mmHg increase in PaO2 when PaO2 was below 82 mmHg and a 2.9% increase in the 1-year risk of all-cause mortality for every 1 mmHg increase in PaO2 when PaO2 was 82 mmHg or higher.
Subgroup and interaction analyses
Subgroup analyses were conducted to assess the potential impact of the relation between PaO2 and in-hospital and 1-year all-cause mortality. Stratification by age, diabetes mellitus, CHD, HTN, oxygen supplementation, and severe pneumonia revealed no significant interactions in any subgroup (Figure 3). However, the p-value for the sex interaction was <0.05, warranting further exploration.

(a) The relationship between PaO2 and in-hospital mortality according to basic features. (b) The relationship between PaO2 and all-cause mortality at 1 year according to basic features. Except for the stratification component itself, each stratification factor was adjusted for all other variables (age, sex, hypertension, diabetes mellitus, coronary heart disease, cancer, chronic obstructive pulmonary disease, aspartate aminotransferase, albumin, urea, creatinine, neutrophil percentage, lymphocyte percentage, FiO2%, and lactate).
Discussion
This retrospective cohort study revealed a robust correlation between PaO2 levels at admission and both in-hospital and 1-year all-cause mortality in patients diagnosed with COVID-19. Moreover, even after adjusting for covariates, the independent nonlinear relations persisted. During the threshold analysis, it was observed that when PaO2 levels fell below 82 mmHg, the OR for in-hospital mortality was 0.931 (95% CI: 0.91–0.952, p < 0.001), and for 1-year all-cause mortality, it was 0.951 (95% CI: 0.933–0.969, p < 0.001). This indicates that with each 1 mmHg rise in PaO2, there was a corresponding decrease in the risk of in-hospital death by 6.9% and a decrease in the 1-year risk of death by 4.9%.Conversely, when PaO2 levels were at or above 82 mmHg, participants exhibited an OR for in-hospital mortality of 1.022 (95% CI: 0.991–1.055, p = 0.1704), and for 1-year all-cause mortality, it was 1.029 (95% CI: 1.004–1.054, p = 0.0201). These findings suggest that there is no discernible association between each 1 unit increase in PaO2 and in-hospital mortality. However, there was a notable 2.9% increase in the 1-year risk of all-cause mortality.
Several studies have explored the association between hyperoxia and mortality outcomes in critically ill patients, particularly those with COVID-19-related ARDS. A study found no significant difference in outcomes between hyperoxemia and normoxemia groups among invasively ventilated COVID-19 ARDS patients, 19 consistent with previous research indicating that hyperoxia alone is not independently linked to in-hospital or 6-month mortality 20 and that the overuse of oxygen does not correlate with mortality. 21 Moreover, investigations have revealed a U-shaped relation between PaO2 levels and mortality and morbidity in patients admitted to ICUs. The lowest mortality rates were observed at PaO2 levels ranging from 100 to 150 mmHg. 8 However, it is important to note that such supraphysiological PaO2 values are generally not recommended due to potential adverse effects. Recent observational studies have further elucidated this U-shaped relation. For instance, Boyle AJ identified that patients with a time-weighted PaO2 range of 93.8 to 105 mmHg exhibited the lowest risk of death among those with ARDS. 22 In addition, de Jonge et al. 23 demonstrated a similar U-shaped relation between PaO2 levels and mortality in patients in the ICU receiving mechanical ventilation, supporting the notion that optimal oxygenation levels are crucial for patient outcomes.
In the context of invasively ventilated patients with COVID-19, Tsonas et al. 19 reported that 28-day mortality exhibited a plateau relation with PaO2 levels on day 1 and a U-shaped relation on day 2, with a minimum PaO2 threshold of 75 mmHg. These findings underscore the complexity of oxygenation management in critically ill patients and highlight the need for individualized approaches to optimize outcomes while avoiding hypoxia and hyperoxia. This investigation delineated a nonlinear association between PaO2 at admission and both in-hospital and 1-year all-cause mortality in patients with COVID-19 pneumonia, with the lowest mortality risk observed at a PaO2 of approximately 82 mmHg. It has been underscored that while maintaining PaO2 within the normal range, careful titration is essential to avert hypoxemia and excessive hyperoxemia. 24
Oxygen plays a dual role in immune response modulation and tissue homeostasis. It enhances the respiratory burst of neutrophils and exerts antibacterial effects by inhibiting bacterial proliferation in tissues. 25 However, the administration of hyperbaric oxygen can lead to oxidative stress, 26 posing a particular threat to pulmonary tissues. For instance, one study demonstrated that after administering 28% oxygen to healthy volunteers for only 1 hour, exhaled breath condensate measurements revealed elevated levels of both interleukin-6 and 8-isoprostane. 27
Numerous investigations have highlighted the prevalence of excessive oxygen administration and resulting hyperoxemia among mechanically ventilated patients with SARS-CoV-2 pneumonia. Exposure to hyperoxemia has been correlated with an increased risk of ICU mortality and ventilator-associated pneumonia. 28 Hyperoxia has multiple effects on various organs. It can directly inflict tissue damage by triggering excessive production of reactive oxygen species, surpassing physiological antioxidant defenses. 29 This phenomenon results in increased apoptosis and an augmented release of endogenous damage-associated molecular pattern molecules, which, in turn, stimulate inflammatory responses, particularly in the pulmonary milieu. 30 Moreover, hyperoxia-induced vasoconstriction may result from diminished NO levels. 31
In the pulmonary context, hyperoxia causes oxidative stress and inflammation, 32 potentially compromising the surface-active substance system, thereby precipitating alveolar collapse and diminishing lung compliance. 33 Additionally, excessive oxygen administration may impede mucosal ciliary clearance and attenuate the antimicrobial capacity of immune cells, predisposing individuals to ventilator-associated pneumonia. 34 Given these detrimental effects, it is prudent to avoid excessive oxygenation, with recommendations suggesting the maintenance of PaO2 levels below 100 to 120 mmHg. 35
COVID-19 pneumonia manifests with three characteristic features: dysregulation of hemostasis leading to heightened clotting propensity, inflammation, and endothelial cell injury, all of which significantly contribute to the development of respiratory failure, particularly in severe cases. Early-stage COVID-19 pneumonia primarily affects the periphery.36,37 Owing to the inability of the body to retain oxygen efficiently, even brief episodes of hypoxemia can rapidly induce irreversible tissue damage, precipitating organ dysfunction (including hypoxic brain injury, stroke, myocardial infarction, and acute kidney injury) or mortality. 38 Hypoxemia in COVID-19 arises from a heterogeneous mismatch between pulmonary ventilation and perfusion, which is primarily driven by immunothrombosis, endothelial dysfunction, and neovascularization. Historically, clinicians have favored aggressive oxygen supplementation to mitigate these risks. However, the necessity of oxygen therapy varies among individuals, with patients having hypoxemia clearly requiring supplemental oxygen therapy. Nonetheless, oxygen requirements should be routinely reassessed, and indiscriminate induction of hyperoxemia should be avoided unless supported by a compelling clinical justification to mitigate the potential risks associated with hyperoxia.39,40 Studies have indicated that PaO2 < 60 and PaO2 > 100 are associated with unfavorable prognoses. 41
This study had several strengths. Primarily, it offers a comprehensive examination of the relation between arterial PaO2 and 1-year all-cause and in-hospital mortality among patients afflicted with COVID-19 pneumonia. This rigorous analysis provides invaluable insights into the development of oxygen therapy strategies tailored to patients with COVID-19 pneumonia. Second, the PaO2 acquisition method employed in this study was both straightforward and cost-effective. Third, the use of multivariate and subgroup analyses bolsters the robustness and consistency of the findings.
However, this study has several limitations. First, its retrospective design and confinement to a single center may have inherently skewed the results. Second, the absence of precise timing and underlying causes of death imposes constraints on data interpretation. Third, the recorded PaO2 values represent only the initial measurements upon admission, precluding the assessment of dynamic fluctuations in PaO2 throughout the hospitalization period. Finally, as a correlational study, it lacks the capacity to definitively infer causality.
Conclusions
In conclusion, this study highlights a curvilinear relationship between PaO2 levels at hospital admission and both short-term and long-term mortality rates in patients with COVID-19 pneumonia, with a turning point around 82 mmHg. Physicians may consider adjusting treatment plans in a timely manner based on arterial oxygen partial pressure, aiming to make rational use of oxygen resources and potentially reducing the risk of mortality associated with hyperoxemia and hypoxemia.
Supplemental Material
sj-docx-1-sci-10.1177_00368504241310737 - Supplemental material for Nonlinear association between admission oxygen partial pressure and in-hospital and one-year all-cause mortality in patients with coronavirus disease pneumonia: A retrospective cohort study
Supplemental material, sj-docx-1-sci-10.1177_00368504241310737 for Nonlinear association between admission oxygen partial pressure and in-hospital and one-year all-cause mortality in patients with coronavirus disease pneumonia: A retrospective cohort study by Ruoqing Zhou and Dianzhu Pan in Science Progress
Supplemental Material
sj-doc-2-sci-10.1177_00368504241310737 - Supplemental material for Nonlinear association between admission oxygen partial pressure and in-hospital and one-year all-cause mortality in patients with coronavirus disease pneumonia: A retrospective cohort study
Supplemental material, sj-doc-2-sci-10.1177_00368504241310737 for Nonlinear association between admission oxygen partial pressure and in-hospital and one-year all-cause mortality in patients with coronavirus disease pneumonia: A retrospective cohort study by Ruoqing Zhou and Dianzhu Pan in Science Progress
Footnotes
List of abbreviations
Acknowledgements
We thank the Free Statistics team for providing technical assistance and valuable tools for data analysis and visualization.
Authors’ contributions
DP designed the study and performed the statistical analyses. RZ drafted the manuscript and collected data. All the authors have read and approved the final manuscript.
Availability of data and materials
The datasets generated and/or analyzed in the current study are available from the corresponding author upon reasonable request.
Declaration of conflicting interests
The authors declared no potential conflicts of interest with respect to the research, authorship, and/or publication of this article.
Funding
The authors received no financial support for the research, authorship, and/or publication of this article.
Ethics approval and consent to participate
The study was approved by the Ethics Review Committee of the First Affiliated Hospital of Jinzhou Medical University (approval number: KYLL2024384).
Supplemental material
Supplemental material for this article is available online.
References
Supplementary Material
Please find the following supplemental material available below.
For Open Access articles published under a Creative Commons License, all supplemental material carries the same license as the article it is associated with.
For non-Open Access articles published, all supplemental material carries a non-exclusive license, and permission requests for re-use of supplemental material or any part of supplemental material shall be sent directly to the copyright owner as specified in the copyright notice associated with the article.