
Abstract
Objective
This study aimed to examine the causal relationship between depression and type-2 diabetes (T2D) and to develop a machine-learning (ML)-driven risk prediction model for T2D.
Methods
This cross-sectional study performed forward and reverse Mendelian randomization (MR) and multivariable MR (MVMR) analyses using GWAS summary data. Data from the National Health and Nutrition Examination Survey 2007-2018 were used to develop a ML–based T2D risk prediction model among individuals with depressive symptoms (n = 790). Nine ML algorithms were compared, incorporating Boruta feature selection, 10-fold cross-validation, and SHapley Additive ExPlanations (SHAP) analysis to identify and interpret key predictors. Moderation analysis was conducted to evaluate whether the triglyceride-glucose (TyG) index and physical activity (PA) influence the relationship between the predictor and the outcome.
Results
Inverse variance weighted MR analysis showed that genetic liability to depression increased the risk for T2D (OR = 1.38, 95% CI: 1.01–1.90), while no significant causal effect was found in the reverse direction. MVMR analysis showed that PA was inversely related to T2D risk (OR = 0.98, 95% CI: 0.96–0.99, p = 0.001). Boruta feature selection identified age and the TyG index as significant predictors. Among nine ML algorithms, LightGBM achieved the most consistent performance, with AUROC values of 0.84 (training) and 0.75 (testing), and PRAUC values of 0.977 and 0.956, respectively. SHAP analysis confirmed that the TyG index had the highest feature importance (mean SHAP value = 0.099), followed by age (0.025). Moderation analysis identified a significant interaction between the TyG index and PA (ΔR2 = -0.007, F = 4.89, p = 0.027).
Conclusions
Our MR results support a causal effect of depression on T2D risk, with the TyG index and physical activity (PA) serving as modulators. Our ML–driven prediction model provides an interpretable screening tool for T2D risk in patients with depressive symptoms.
Introduction
Type 2 diabetes (T2D) and depression often coexist due to shared mechanisms—including chronic inflammation, hypothalamic-pituitary-adrenal axis dysregulation, and insulin resistance (IR), resulting in a bidirectional relationship where each condition can trigger the other.1,2 This interaction emphasizes the necessity of integrated management strategies for both conditions.3,4 Clarifying the causal relationship between T2D and depression is crucial for the development of effective interventions. Mendelian randomization (MR) provides a rigorous framework for causal inference by utilizing genetic variants as instrumental variables, hence reducing confounding and reverse causation prevalent observational studies concerning depression and T2D.
A variety of intricate risk factors—including demographics, comorbidities, health behaviors, and blood chemistry profiles—are associated with both T2D and depression.5–7 Conversely, regular physical activity (PA) has demonstrated both antidepressant and anti-diabetic effects, alleviating the influence of T2D on depression and vice versa.8,9 Despite this, few studies have developed risk prediction models for T2D among individuals with depression (or the reverse) that comprehensively incorporate these risk factors and evaluate how PA modulates their interrelationship.
Recent advances in interpretable machine learning (ML)—such as SHAP-based explainable frameworks for glucose monitoring 10 and multimodal non-invasive blood glucose prediction models 11 —have highlighted the value of combining predictive accuracy with clinical interpretability in diabetes management. Developing an ML-based prediction model can support health professionals in the early identification of individuals at risk for both depression and T2D.
Integrating causal inference analysis with predictive modeling enhances translational risk stratification by moving beyond mere correlation to understand the link between depression and T2D. This study was designed to (1) investigate the causal relationship between T2D and depression, with PA as a moderating factor, and (2) construct and validate an interpretable, ML-driven prediction model for T2D risk among individuals with depressive symptoms.
Materials and methods
MR analysis
We conducted a two-sample bidirectional MR analysis using publicly available GWAS summary-level data. There was no sample overlap between the exposure and outcome GWAS datasets. All datasets were drawn from populations of European ancestry. Individual-level data were not accessed. Three fundamental assumptions are essential for the validity of Mendelian randomization (MR) analyses. First, relevance is critical; the chosen single-nucleotide polymorphisms (SNPs) must demonstrate a strong association with the exposure, as indicated by an F-statistic exceeding 10. Second, independence is necessary; the genetic instruments should be independent of any confounders that could influence the relationship between the exposure and the outcome. Third, the exclusion restriction assumption stipulates that the SNPs must affect the outcome exclusively through the exposure, without any pleiotropic effects.
Data sources
The summary-level datasets for PA, depression, and T2D were obtained from publicly available GWAS databases (https://www.ebi.ac.uk/gwas/). The GWAS IDs (or accession numbers) for PA, depression, and T2D were ebi-a-GCST006099, ukb-d-20544_11, and ebi-a-GCST006867, respectively. The PA dataset has 91,084 individuals of European ancestry and 11,796,201 SNPs. The depression dataset includes 117,782 individuals of European ancestry and 13,571,547 SNPs. The T2D dataset includes 655,666 individuals of European ancestry and 5,030,727 SNPs. SNPs were selected from multiple loci across the genome, reflecting the polygenic architecture of depression and T2D, rather than being limited to single gene regions.
Two-sample bidirectional MR and multivariable MR (MVMR) analysis
The inverse-variance weighted (IVW) model was used as the primary analytical method. MR-Egger regression, weighted median, simple mode, and weighted mode approaches were employed as pre-specified sensitivity analyses to assess the robustness of the primary estimates. Correction for multiple testing was not applied, as the sensitivity analyses were intended to evaluate the consistency of the direction and magnitude of effects rather than to test independent hypotheses. 12 All five methods were implemented in the TwoSampleMR and MR-PRESSO packages.
For MR analysis, the conventional genome-wide significance threshold (P < 5×10⁻⁸) was initially adopted for instrumental variable (IV) selection. However, linkage disequilibrium (LD) clumping and F-statistic filtering resulted in no SNPs with statistical significance, perhaps due to a highly polygenic, heritable nature of depression driven by thousands of common genetic variants across the genome, each with a small individual effect size. Consequently, a relaxed threshold (P < 5×10⁻⁵) was applied for IV selection, with further pruning using a clumping r2 cutoff of 0.001. This approach is considered appropriate for psychiatric traits with limited GWAS power, especially when stringent thresholds do not yield a sufficient number of instruments.13,14 Selected SNPs underwent further pruning using the ieugwasr::ld_clump () function in R, applying a clumping r2 threshold of 0.001 and a clumping window of 10,000 kb. This process was based on the 1000 Genomes Project Phase 3 European (EUR) reference panel (GRCh37/hg19) as implemented in PLINK (v1.9).
Palindromic SNPs with ambiguous allele frequencies were excluded using the harmonise_data () function with action = 2 in the TwoSampleMR package. The F-statistic was calculated for each SNP, and only those with an F-statistic greater than 10 were retained to reduce weak instrument bias. The IVs were harmonized across the exposure and outcome datasets to ensure consistency and compatibility.
Cochran’s Q statistic was employed to evaluate the heterogeneity present in the MR analysis, while a funnel plot was used to visually assess potential heterogeneity. Horizontal pleiotropy was evaluated using MR-Egger regression. Furthermore, a leave-one-out (LOO) analysis was performed to determine whether any single SNP had an outsized effect on the overall causal estimate.
MVMR analysis was conducted following the framework outlined by Sanderson et al., 15 which adapts the two-sample MR method to consider multiple exposures at once. This approach allows for the estimation of the direct causal effect of each exposure, taking into account the influence of the others.
Development of an ML-driven prediction model
Data source and interpolation
The results of the MR analysis showed a significant causal link from depression to T2D but not vice versa (Supplemental Tables 2 and 3). As a result, we attempted to develop a T2D risk prediction model only. We assembled the National Health and Nutrition Examination Survey (NHANES) data (n = 59,842) from six survey cycles between 2007 and 2018 (https://wwwn.cdc.gov/nchs/nhanes/). We then excluded individuals with no data about the PHQ-9 test (n = 28,382), a PHQ-9 score of less than 9 (n = 28,589), and other missing data (n = 2081). The remaining 790 participants were included in the final data analysis, splitting a training cohort (70%) and a testing cohort (30%) (Supplemental Figure 1).
We implemented a survey-weighted generalized linear model using a Bayesian model-fitting paradigm to account for the nuanced data structure for our interpolation efforts. A Gibbs sampling strategy was meticulously applied to generate imputed datasets. Detailed NHANES methodology is available at the Centers for Disease Control and Prevention website (https://www.cdc.gov/nchs/hus/sources-definitions/nhanes.htm).
Definition of depression and T2D
Depression was defined as scoring a 10 or higher on the Patient Health Questionnaire-9
Definitions of risk factors
Comorbidities included in this study were hypertension and sleep disorders. Hypertension was considered present with a “YES” to the following question: Have you ever been told by a doctor or other health professional that you had hypertension? Sleep disorders were considered present with a “YES” to the following question: Have you ever told a doctor or another health professional that you have difficulty sleeping?
Health behaviors included in this study were PA, sedentary time, body mass index (underweight or normal weight or overweight or obese), smoking (non-smokers, former smokers, or current smokers), drinking (non-drinkers or drinkers), and sleep duration (8–12 h, 6–8 h, or less than 6 h). The International Physical Activity Questionnaire (https://sites.google.com/view/ipaq/home) was used to assess vigorous PA (VPA), moderate PA (MPA), or light PA (LPA). Weekly PA volume in MET-minutes per week was calculated as the sum of the scores for VPA+MPA+LPA (walking = 3 METs, moderate PA = 4.0 METs, and vigorous PA = 8.0 METs), and they were classified as low (<500 MET-minutes per week), moderate (500∼1,000 MET-minutes per week), or high (>1,000 MET-minutes per week).
For blood chemistry, a complete blood count (CBC) was calculated from blood samples processed by a Beckman Coulter MAXM analyzer that counts, sizes, and classifies individual cells. The systemic immune-inflammation index (SII) was calculated as the product of platelet count and neutrophil count divided by lymphocyte count. Systemic inflammatory response index (SIRI) was calculated as the product of monocyte count and neutrophil count divided by lymphocyte count. The triglyceride–glucose (TyG) index was calculated as ln [fasting TG (mg/dL) × fasting blood glucose (mg/dL)/2]. Metabolic Score for IR (METS-IR) was calculated by using the formula: METS-IR = Ln [(2 × fasting glucose) + fasting triglycerides) × body mass index]/[Ln (high-density lipoprotein cholesterol)]. The homeostasis model assessment for IR (HOMA-IR) was calculated by using the formula: HOMA-IR = [fasting serum insulin (μU/mL) × FPG (mg/dL)/405]. Detailed procedures for the blood chemistry analyses are available at the CDC website (https://www.cdc.gov/nchs/hus/sources-definitions/nhanes.htm).
Social and demographic factors included in this study were age (18-40 years, 41-65 years, 65 plus years), gender (female vs. male), marital status (married or living with partner, widowed or divorced or separated, or non-married), education (college graduate or above, below college graduate), race (non-Hispanic white, non-Hispanic Black, Mexican American, other Hispanic, or other race), and family income to poverty ratio (below, at, or above the poverty level).
Feature selection and model development
The Boruta algorithm was adopted to determine the variables that were highly correlated with each other. 18 We built prediction models using the following nine ML algorithms. They include logistic regression, decision tree (DT), elastic net (ENet), k-nearest neighbors (KNN), light gradient boosting machine (LightGBM), RF, extreme gradient boosting (XGBoost), support vector machine (SVM), and multilayer perceptron (MLP). Detailed descriptions of the ML algorithms are provided elsewhere. 19
Hyperparameter tuning and validation
For model optimization, we employed grid search to fine-tune hyperparameters. 20 This method exhaustively searches the hyperparameter space to identify the best-performing configurations for each model. We used ten-fold cross-validation to ensure that the model is not overfitting and generalizes well to unseen data.
Model evaluation
The prediction model was evaluated in several ways. 21 The area under the receiver operating characteristic curve (AUROC) was used to measure how well the model distinguishes between classes. The precision-recall area under the curve (PRAUC) was used to handle class imbalance. The Brier score (BS) is a measure of accuracy based on mean squared error. Clinical decision curve analysis (DCA) was used to assess the net benefit of applying the model under different probability thresholds.
Model interpretation
SHapley Additive ExPlanations (SHAP) was used to interpret and explain the final prediction model. 22 We also created a web calculator to make it easier and more intuitive to predict T2D risk probability in individuals with depressive symptoms [https://zhaol2022713269.shinyapps.io/DynNomapp/].
Sample size calculation
The required minimum sample size for constructing this multivariable prediction model was calculated according to the four-criteria framework outlined by Riley et al., 23 utilizing the pmsampsize package in R. The required sample size for model development was estimated at 157, with at least 139 outcome events (two predictors, outcome prevalence = 0.885, Cox-Snell R2 = 0.300). The final analytic sample of 790 participants with 699 T2D events substantially exceeds this requirement, confirming adequate statistical power (Supplemental Table 1).
Statistical analysis
Continuous variables are summarized as means and standard deviations, and non-normal data are summarized as medians and quartiles. Categorical variables are presented as counts and percentages. The chi-square test and one-way analysis of variance were performed to compare group differences in categorical variables and continuous variables, respectively. Pearson correlation coefficients were calculated to assess the relationships between features. Multicollinearity was assessed using the variance inflation factor (VIF). Model fit was evaluated using the Hosmer–Lemeshow (HL) test.
All statistical analyses were conducted in R (version 4.3.2). MR analyses utilized the TwoSampleMR, MRPRESSO, ieugwasr, and plinkbinr packages, and GWAS data were handled with the gwasvcf and gwasglue packages. ML model development and evaluation were performed using the tidymodels framework, with tree-based models implemented through the bonsai package. The doParallel package was used to enable parallel computing, model calibration was evaluated with the probably package, and SHAP interpretability analysis was carried out using a custom SHAP script in R. We used the bruceR::PROCESS() function as an alternative method for moderation analysis in R, specifying the model as follows: PROCESS (DV = T2D, IV = TyG, moderator = PA).
Results
MR and RMR analyses
The IVW method provided suggestive evidence of a positive association between genetic liability to depression and T2D risk (OR = 1.38, 95% CI: 1.01–1.90, p < 0.05); however, the borderline significance and wide confidence interval warrant cautious interpretation of this finding. This means that for every standard deviation increase in depression among the 52 SNPs, the risk of T2D increased by an average of 38%. The other methods also showed significant estimates: OR = 1.67 for MR-Egger, OR = 1.57 for weighted median, OR = 1.97 for simple mode, and OR = 1.87 for weighted mode (Supplemental Table 2).
As shown in Figure 1(a), the MR scatter plot illustrates the significant relationship between the SNP effects on depression and the SNP effects on T2D. All five MR methods produced regression lines with positive upward slopes, supporting a causal relationship between depression and T2D. Heterogeneity of MR analysis was assessed using Cochran’s Q test. The findings showed no significant heterogeneity for the MR Egger method (Q = 61.008, df = 50, p = 0.1368) or the IVW method (Q = 61.082, df = 51, p = 0.1576), indicating that the instrumental variables were relatively consistent, and the estimates remained stable. As illustrated in Figure 1(b), the 52 SNPs were evenly spread out on both sides of the IVW regression line. This further supports the idea that there was no significant heterogeneity in the MR results. As shown in Figure 1(c), sensitivity analysis indicated that the omission of any individual SNP did not affect the effect estimates significantly. The results remained statistically significant in the same direction (the positive side of zero). This suggested that no single SNP unduly influenced the overall estimate. The MR-Egger intercept test (p = 0.8066) and the global pleiotropy test (p > 0.05) further demonstrated the absence of horizontal pleiotropy. As shown in Figure 1(d), the MR forest plot showed that many of the individual estimates and the combined effect are to the right of zero. The results of Mendelian randomization (MR) analysis from depression to type-2 diabetes (T2D). (a) Scatter plot of causal effect. (b) Funnel plot of heterogeneity. (c) Leave-one-out sensitivity analysis. (d) Forest plot of MR.
RMR analysis was conducted to investigate the relationship between T2D (exposure) and depression (outcome). The results of the IVW method showed no significant causal relationship between T2D and depression (Supplemental Table 3).
As shown in Figure 2(a), the RMR scatter plot illustrates the non-significant relationship between the SNP effects on T2D and the SNP effects on depression. The other methods also yielded non-significant estimates. RMR analysis exhibited significant heterogeneity, as indicated by Cochran’s Q statistics for both MR Egger (Q = 368.049, df = 323, p = 0.0425) and IVW (Q = 374.296, df = 324, p = 0.0282). As illustrated in Figure 2(b), the 132 SNPs were not symmetrically distributed around the IVW line. RMR sensitivity analysis yielded unstable results. The MR-Egger intercept test (p = 0.0198) and pleiotropy test (p < 0.05) indicated the presence of horizontal pleiotropy. As shown in Figure 2(c), the LOO plot revealed that several SNPs crossed the null line (zero), suggesting instability and low reliability. As shown in Figure 2(d), the RMR forest plot showed that several SNP estimates and the combined effect cross zero, indicating a lack of a causal relationship between T2D and depression. The results of reverse Mendelian randomization (RMR) analysis from type-2 diabetes (T2D) to depression. (a) Scatter plot of causal effect. (b) Funnel plot of heterogeneity. (c) Leave-one-out sensitivity analysis. (d) Forest plot of RMR.
The MR analysis results indicate a causal relationship from depression to T2D, with consistent estimates across five MR methods and no evidence of pleiotropy or heterogeneity. In contrast, the results of the RMR analysis do not support a causal relationship between T2D and depression.
MVMR analysis
The results indicated that T2D is positively and marginally correlated with depression (OR = 1.49, 95% CI: 0.96–2.31, p = 0.07) and inversely with PA (OR = 0.98, 95% CI: 0.96–0.99, p = 0.001) (Supplemental Table 2).
Conversely, we also assessed the role of PA in the relationship between T2D and depression, with PA and T2D as exposures and depression as the outcome. As a result, T2D showed no significant association with depression, whereas PA was significantly and inversely associated with depression (OR = 0.99, 95% CI: 0.99–0.99, p < 0.001) (Supplemental Table 3).
ML-based risk prediction model for T2D
Descriptive statistics of study participants
The prevalence of T2D was approximately 88.5% (n = 699) in the total study population, with 88.6% (n = 489) in the training cohort and 88.2% (n = 210) in the testing cohort. Individuals with T2D were more likely to be older (p < 0.001), smokers (p = 0.026), and had higher values in SIRI index (p = 0.016), TyG (p < 0.001), METS-IR (p < 0.001), and HOMA-IR (p < 0.001) than individuals with non-T2D (Supplemental Table 4A). The training and testing cohorts were comparable in demographics, comorbidities, health behaviors, and blood chemistry profiles (Supplemental Table 4B).
The heatmaps illustrate the correlations between the study variables (Supplemental Figures 2A and 2B). The largest age group in both cohorts consisted of people aged 41–65 years, and the TyG index was evenly distributed across the two groups.
Feature selection for the T2D risk prediction model
Figure 3 presents the outcomes of Boruta feature selection for the T2D prediction model. The important feature is marked in green (“confirmed”) for further analyses, while the excluded features are marked in red (“rejected”) or blue (“tentative”). As a result, age and TyG were selected as predictors. Boruta algorithm feature selection.
Elimination of multicollinearity
We evaluated multicollinearity by calculating the VIF and eliminated it by removing the variables with the highest VIF individually until all factors had < 4 VIF (Supplemental Table 5).
Goodness of fit testing
The HL test was employed to evaluate the efficacy and consistency of the risk prediction model, yielding a p-value of 0.4681, which exceeds the conventional 0.05 threshold.
Model performance and decision support
Model parameters
The generalization and stability of the predictive model were evaluated using a 10-fold cross-validation method. As a result, the prediction model exhibited AUROC values ranging from 0.76 to 0.91 (Supplemental Figure 3A) and PRAUC values from 0.92 to 0.98 (Supplemental Figure 3B), demonstrating robust discriminatory power. In the training cohort, the XGBoost model exhibited the highest predictive performance, achieving an AUROC value of 0.8393. This was followed by the LightGBM and logistic models, which had AUROCs of 0.8385 and 0.838, respectively (Supplemental Figure 4A). In the testing group, the Logistic model achieved the highest AUROC (0.748), followed closely by LightGBM (0.7457), with both ENet and MLP scoring 0.7445. (Supplemental Figure 4B). In the training cohort, XGBoost had the highest PRAUC value (0.9772), followed closely by LightGBM and Logistic models (both 0.977) and Enet and MLP (both 0.9769) (Supplemental Figure 5A). In the testing cohort, the RF model had the highest PRAUC value (0.9562), followed by the Logistic model (0.9417) and the DT model (0.9412) (Supplemental Figure 5B).
Calibration curve analysis was applied to evaluate the agreement between predicted probabilities and observed outcomes. The LightGBM model had the lowest BS (0.090), followed by Logistic (0.091) and ENet (0.092), indicating strong calibration (Supplemental Figure 6). To further assess clinical utility, we conducted DCA to quantify the net benefits of each model across a range of threshold probabilities. The ENet model yielded the greatest clinical benefit, followed by XGBoost and LightGBM (Supplemental Figure 7). Overall, both the training and testing cohorts demonstrated substantial net benefits. Given its consistent and strong performance across all evaluation metrics, LightGBM was selected as the optimal model for visualization and interpretation.
SHAP interpretability analysis of feature importance
The analysis included a graphical representation of the feature importance ranked by the SHAP value to show the most influential features driving the predictions. Since the LightGBM model showed excellent performance on all metrics, it was chosen as the optimal model for visualization and interpretation. All selected features were subjected to a SHAP analysis of feature importance, and the results are shown in Figure 4(a). The TyG index had the highest SHAP value (0.0987), followed by Age (0.0253). Comparative analysis of the predictor’s SHAP value and predictors at randomly selected individuals for the type-2 diabetes (T2D) prediction models. (a-b) The SHAP value of predictors in the T2D prediction model. (c-d) The prediction of predictors at randomly selected individuals.
Overall, we observed that the TyG index was the most significant risk factor for T2D. Additionally, we attempted to gain a clear understanding of the selected features by grouping them into different categories. This segmentation allowed a nuanced analysis of the SHAP values associated with each category. Detailed categorization plays a crucial role in revealing the unique impact of each segment on the predicted outcome, thereby revealing insights that would otherwise remain hidden when considering the overall feature. As illustrated in Figure 4(b), the TyG index at the levels of Q3 (9.22 – 9.66) and Q4 (9.67 – 12.31) had a positive effect on T2D. Age in the range of 41-65 years and +66 years had a positive effect on T2D. Figures 4(c) and (d) depict the likelihood of developing T2D when our ML-based risk prediction model was applied to a particular individual. E [f(x)] = 0.875 represents the average predicted value for a random individual. For instance, a person aged 18 to 40 years and in the third quartile of the TyG index value has a 92.5% chance of developing T2D.
The moderating effect of PA
Given the well-established metabolic benefits of PA, we aimed to assess whether PA moderates the effect of the key predictors on the risk of T2D. In the predictive model, the most important modifiable predictor (TyG index for T2D) was selected as IV in this section.
Moderating effect of PA on the relationship between the TyG index and T2D
A significant interaction between the TyG index and physical inactivity was observed in the T2D prediction model (R2 = 0.090, Adjusted R2 = 0.087) (Supplemental Table 6). Specifically, the TyG index was positively associated with the risk of T2D (β = 0.184, SE = 0.031, p < 0.001, 95% CI 0.124 to 0.245). Although physical inactivity alone was not significantly associated with the risk of T2D (β = 0.034, SE = 0.026, p = 0.191), the interaction term (TyG × physical inactivity) was significant (β = -0.077, SE = 0.035, p = 0.027, 95% CI -0.145 to -0.009). This finding suggests that being physically active may attenuate the positive association between the TyG index and T2D. The inclusion of the interaction term led to a significant increase in explained variance (ΔR2 = 0.007, F = 4.89, p = 0.027).
Simple slope analysis
The results of the simple slope analysis showed that the TyG index was significantly associated with T2D in both active (B = 0.184, SE = 0.031, t = 5.997, P < 0.001, 95% CI: 0.124 – 0.245) and inactive individuals (B = 0.107, SE = 0.017, t = 6.391, P < 0.001, 95% CI: 0.074 – 0.140) (Supplemental Table 7).
As illustrated in Figure 5, the lines for active and inactive people cross each other at a TyG index value of 9.68. Physically active individuals with a TyG index value of lower than 9.68 may reduce the risk of type 2 diabetes. Yet, the ameliorative effect of PA on T2D risk is not evident in individuals with a TyG index value of higher than 9.68. The moderation analysis in the type-2 diabetes (T2D) prediction model.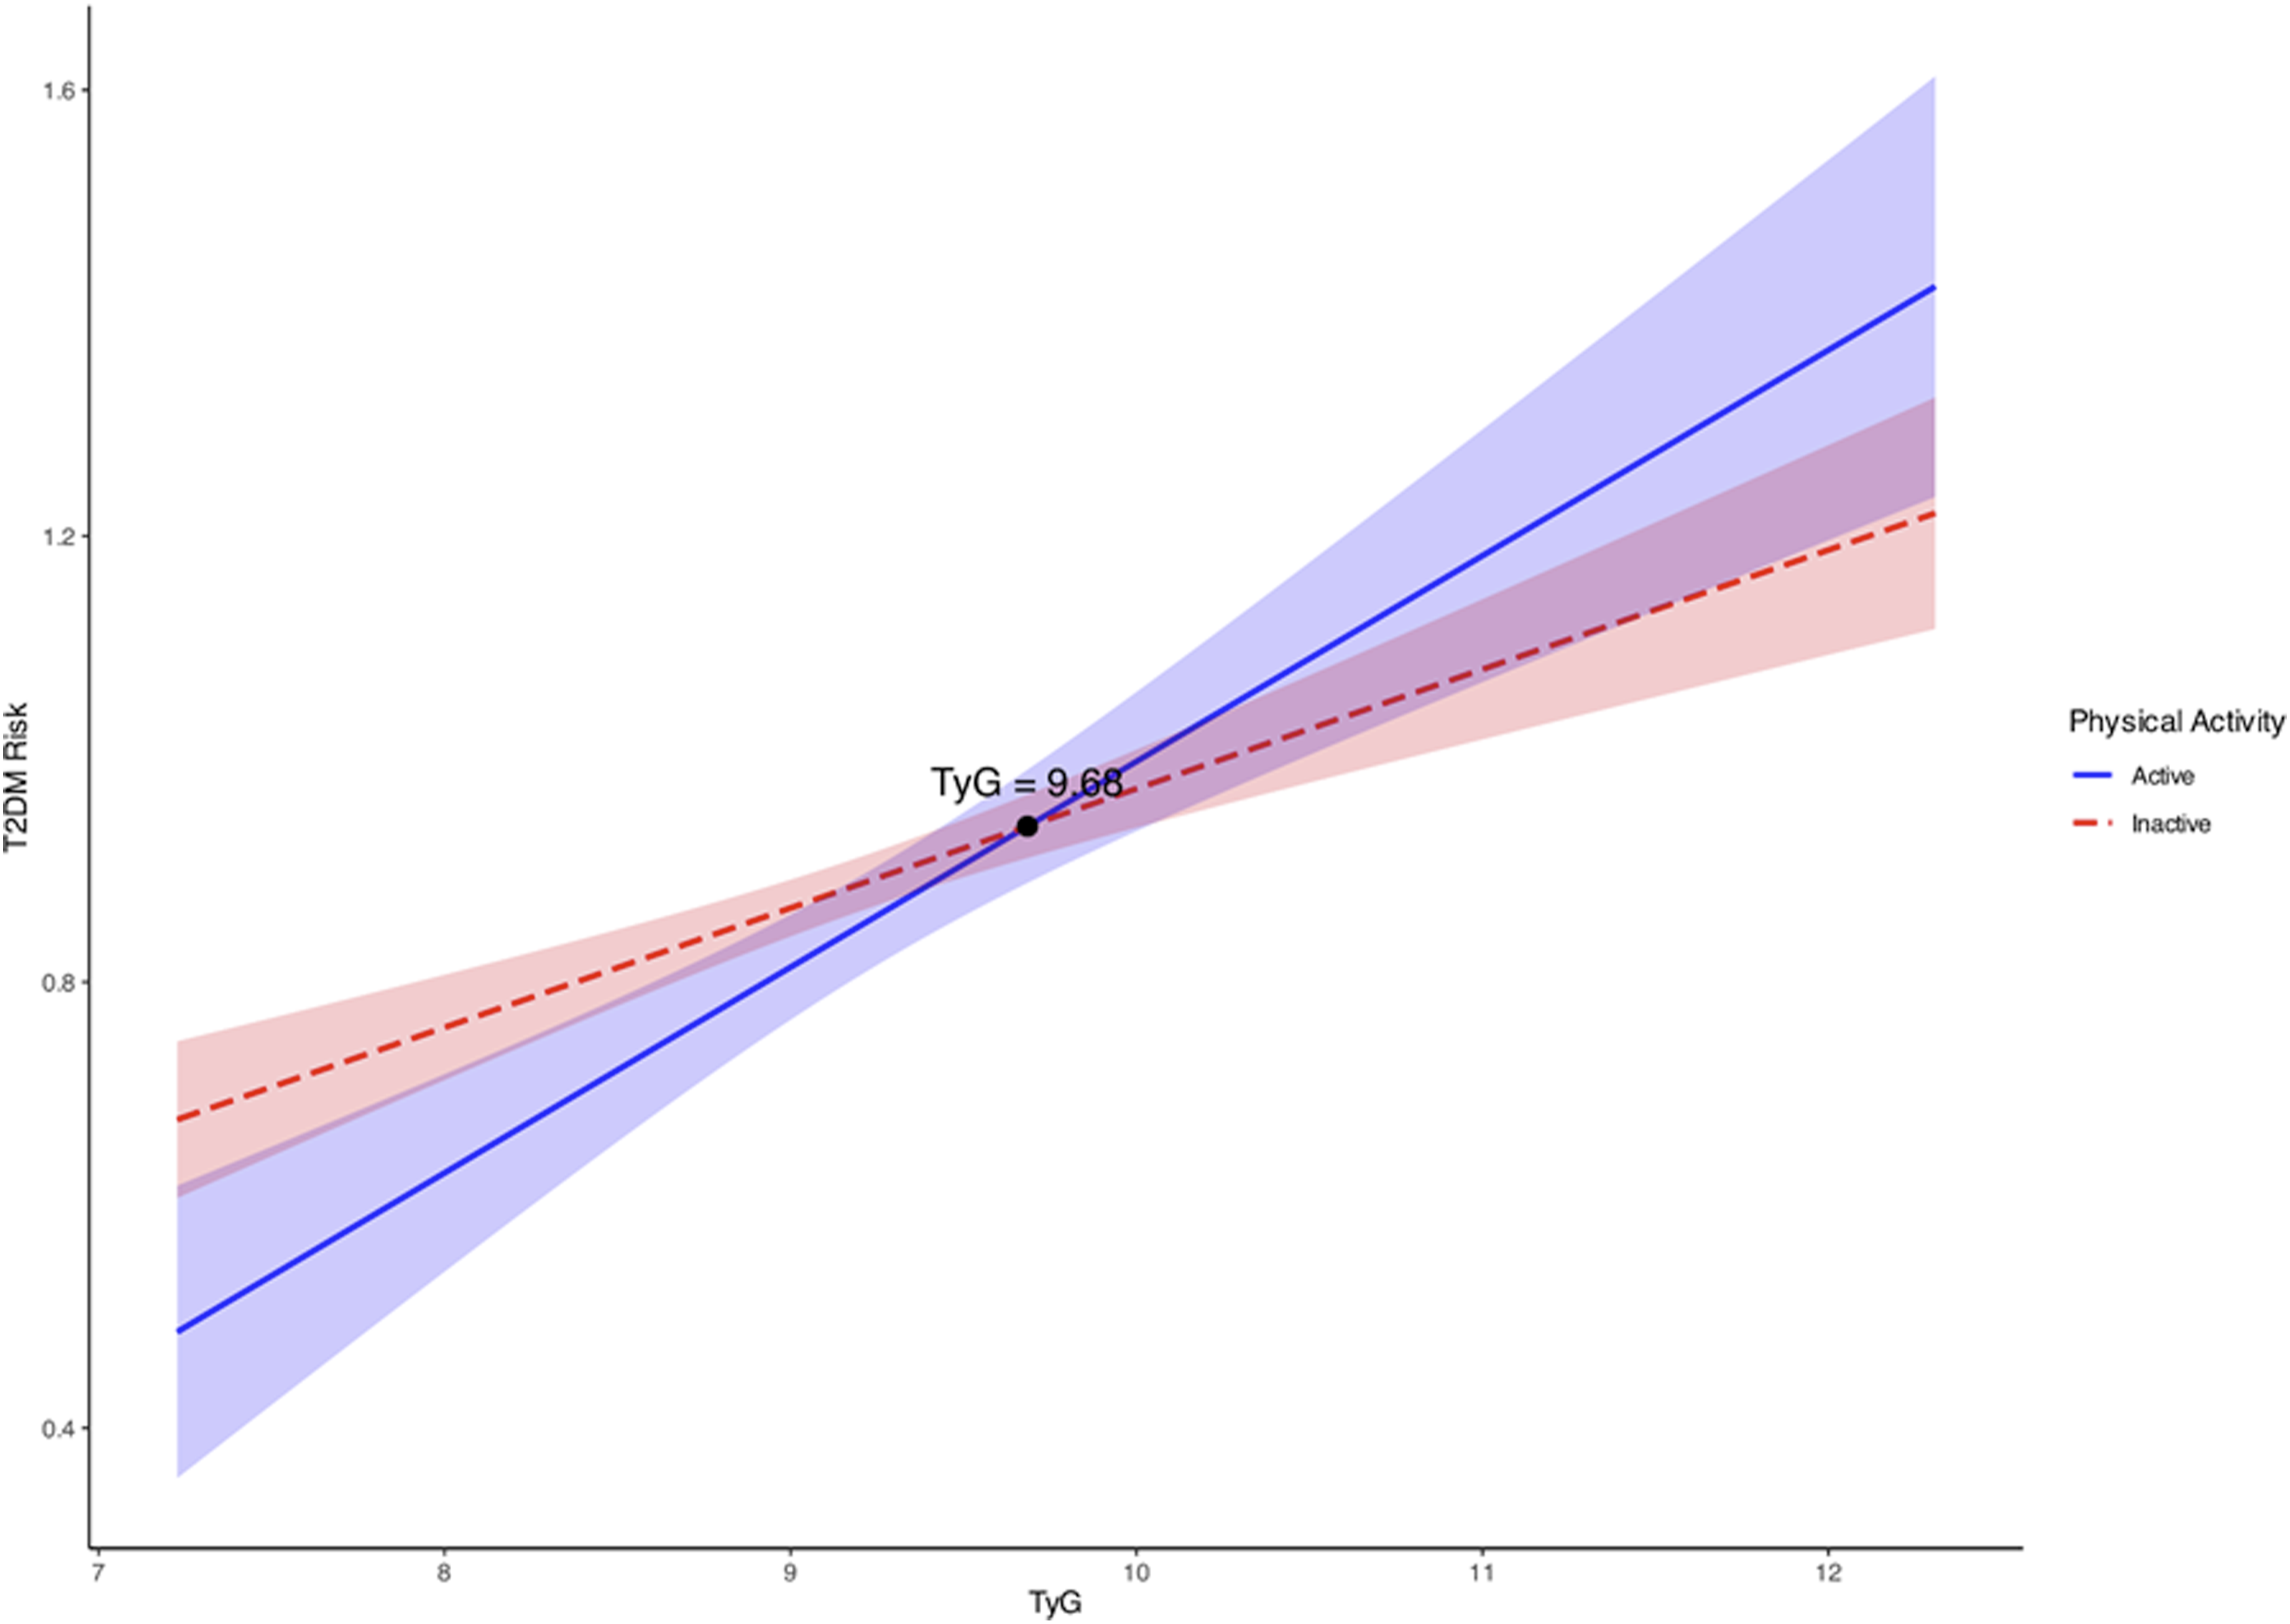
Discussion
This study presents a multi-method investigation of the causal and predictive relationships between depression, PA, and T2D. The results of bidirectional MR analysis support a causal effect of depression on T2D risk; no evidence for T2D causing depression. Multivariable MR found that PA reduces the risk for both T2D and depression.
Confounding variables and reverse causation in observational studies often complicate the identification of a definitive cause-and-effect relationship between depression and T2D. To address this issue, we investigated the causal relationship between depression and T2D by utilizing MR analysis on summary-level GWAS datasets. Unlike prior research that primarily focused on bidirectional relationships, our findings offer novel insights by underscoring the preeminent role of depression as a risk factor for T2D. 24 Furthermore, the results of MVMR analysis suggest that PA may mitigate the detrimental effect of depression on the risk of developing T2D.
Additionally, the ML-based prediction model developed in this study showed that LightGBM achieved the most consistent performance across evaluation metrics. The Boruta feature selection underscored the importance of age and the TyG index in predicting T2D risk among depressed individuals. The resulting two-variable model may offer a simple tool for T2D risk screening in depression-enriched clinical settings, although further research is required to validate and implement the model externally. Moderation analysis showed that PA may alleviate the impact of TyG index on T2D risk, especially among people at an early or moderate stage of IR.
Our ML-driven prediction model showed that the TyG index was a significant predictor of T2D risk among depressed individuals, suggesting the possible involvement of IR in the shared pathology of depression and T2D. In agreement with our study findings, the TyG index is regarded as a more accurate, cost-effective, and accessible biomarker for early detection of IR and metabolic complications compared to using glucose or triglycerides alone,25,26 and it often outperforms HOMA-IR for identifying early metabolic risk and T2D risk. The clinical significance of the TyG index in predicting T2D risk and incidence has been documented in various populations.27,28 The TyG index is also significantly and positively associated with the risk and prevalence of depression in middle-aged and elderly Chinese adults 29 as well as the incidence of depression in US adults with diabetes or pre-diabetes. 30 Taken together, findings from the current study and previous research support the TyG index as a valid early biomarker for the risk of both T2D and depression.31,32
Age is another risk factor for T2D, with diabetes rates steadily increasing with age, particularly after 45. Older adults are more likely to experience IR and a decrease in pancreatic function, along with age-related changes like reduced skeletal muscle and physical inactivity.31,32 Aging is also associated with mitochondrial dysfunction and intramuscular lipid accumulation. 33 Collectively, these age-related changes would increase the risk of developing T2D. As an example, epidemiological studies indicate that the prevalence of T2D increased with age.34,35
Finally, our study results indicated a moderation effect of PA on the relationship between the TyG index and T2D. The preventive effect of PA against T2D has been well established. PA improves skeletal muscle insulin sensitivity in multiple ways, including increased glucose uptake, 36 reduced intramuscular lipid accumulation, 37 and improved mitochondrial function. 38 On the other hand, the observation that the protective effect of PA against T2D is limited to individuals with TyG index values below 9.68 has significant clinical implications. For those in the early or moderate stages of IR, encouraging PA may be an effective initial strategy to reduce the risk of T2D. However, for individuals with advanced IR, PA alone seems insufficient to meaningfully lower T2D risk, highlighting the need for more intensive interventions. From a clinical standpoint, these findings support a tiered management approach: lifestyle modifications as the first-line preventive measure for lower-risk individuals, and the consideration of pharmacological treatments—such as metformin or other insulin-sensitizing medications—for those with more severe IR.
Our study employed several methodological strategies to enhance model robustness. Initially, we utilized 10-fold cross-validation during model training to reduce overfitting; this yielded AUROC values ranging from 0.76 to 0.91 across folds, thereby indicating consistent generalizability. Subsequently, considering the significant class imbalance (∼88% T2D prevalence), we designated PRAUC as the primary performance metric, as it offers greater relevance than AUROC in this context. Furthermore, we employed the Boruta feature selection algorithm to impartially identify relevant predictors and minimize manual selection bias. Finally, we conducted a comparative analysis of nine machine learning algorithms concurrently, ultimately selecting LightGBM based on a thorough assessment incorporating AUROC, PRAUC, Brier score, and decision curve analysis, rather than relying solely on a single metric. We also integrated SHAP analysis to enhance model interpretability and clinical transparency.
Our study presents several key distinctions from previous research. First, we integrate causal inference methods (bidirectional MR and MVMR) with predictive machine learning modeling within a unified analytical framework. This approach enables both accurate T2D risk prediction and causal anchoring of key predictors, such as the TyG index and age. Second, we focus specifically on T2D risk prediction in a depression-enriched cohort, a clinically important yet understudied subgroup. Third, we incorporate physical activity moderation analysis to identify conditions under which lifestyle interventions may mitigate metabolic risk, and we define an actionable TyG index threshold of 9.68 with potential clinical relevance. Fourth, we offer a publicly accessible, web-based risk calculator to facilitate clinical implementation. Collectively, these innovations distinguish our work from previous ML-based T2D prediction models, which typically target general populations and do not integrate causal inference or moderation analysis.
This study has limitations. First, using a less stringent significance threshold could have led to the selection of weaker instrumental variables, potentially compromising the strength of causal inference—particularly in the reverse MR model, where considerable pleiotropy was observed. Second, our prediction model was developed using NHANES data, which is cross-sectional and includes some self-reported information. This introduces the possibility of recall bias and measurement error. As a result, the model assesses current T2D risk in individuals with depressive symptoms, rather than predicting the future onset of T2D. To create a model that can forecast T2D incidence or progression over time, longitudinal cohort data with repeated measurements would be necessary. Third, restricting the analytic sample to individuals with depressive symptoms may have introduced selection bias, as this group typically has a higher metabolic burden than the general population—reflected in the observed T2D prevalence of approximately 88%. While the composite T2D definition adheres to current clinical standards, the resulting class imbalance may limit the generalizability of the machine learning model to broader or lower-risk populations. Caution is warranted when applying this model to populations outside those with elevated rates of depression. Fourth, the prediction model was validated exclusively using an internal 30% holdout testing cohort from NHANES. The lack of external validation in an independent cohort with differing demographic and clinical characteristics limits the assessment of the model’s true generalizability. Future studies should prospectively recruit and validate the model in external depression-enriched clinical cohorts, ideally across multiple healthcare settings, before considering clinical translation. Fifth, the TyG index incorporates fasting glucose as part of its calculation, and fasting glucose ≥ 126 mg/dL is one of the five criteria used to define T2D in this study. While assessments of multicollinearity, 10-fold cross-validation, and the HL goodness-of-fit test collectively indicate model stability and proper calibration, it is important to note that the partial conceptual overlap between TyG and the T2D definition may contribute to the elevated PRAUC values observed and cannot be entirely ruled out as a factor in performance inflation. Sixth, the GWAS datasets used for MR analysis were predominantly based on individuals of European ancestry, which may limit the generalizability of the causal inference results to other populations. Lastly, given the cross-sectional design of the ML analysis and the observational nature of GWAS-derived causal inference, the present findings are best regarded as hypothesis-generating and require prospective validation in independent cohorts before clinical translation.
Conclusions
Our MR results support a causal effect of depression on T2D risk, with the TyG index and physical activity (PA) serving as key mediating factors. Furthermore, our results suggest that the ML–based risk prediction model could be a useful tool for early screening of T2D among individuals experiencing depressive symptoms. Future research should prioritize external validation of the prediction model in prospectively recruited, ethnically diverse cohorts.
Supplemental material
Supplemental material - Interpretable machine learning in type-2 diabetes prediction in patients with depressive symptoms: Insights from mendelian randomization and physical activity
Supplemental material for Interpretable machine learning in type-2 diabetes prediction in patients with depressive symptoms: Insights from mendelian randomization and physical activity by Zhao Li, Xiaoming Qiu, Wenzhong Wu and Hyunsik Kang in science progress.
Footnotes
Ethical considerations
The Institutional Review Board (IRB) waived human subject review because our study is a secondary analysis of de-identified public data from the NHANES.
Consent for publication
Written informed consent for all data has been obtained from the participants, who consented to publication.
Author contributions
ZL: Conceptualization, Methodology, Software, Formal analysis, Data curation, Investigation, Visualization, Writing – original draft, Writing – review & editing.
XMQ: Methodology, Software, Formal analysis, Data curation, Investigation, Validation, Writing – review & editing.
WZW: Methodology, Formal analysis, Data curation, Investigation, Validation, Visualization, Writing – review & editing.
HK: Conceptualization, Methodology, Software, Formal analysis, Data curation, Investigation, Visualization, Writing – original draft, Writing – review & editing, Resources, Supervision, Project administration, Writing – review & editing.
Funding
The authors received no financial support for the research, authorship, and/or publication of this article.
Declaration of conflicting interests
The authors declared no potential conflicts of interest with respect to the research, authorship, and/or publication of this article.
Data Availability Statement
Supplemental material
Supplemental material for this article is available online.
References
Supplementary Material
Please find the following supplemental material available below.
For Open Access articles published under a Creative Commons License, all supplemental material carries the same license as the article it is associated with.
For non-Open Access articles published, all supplemental material carries a non-exclusive license, and permission requests for re-use of supplemental material or any part of supplemental material shall be sent directly to the copyright owner as specified in the copyright notice associated with the article.