
Abstract
Ferroelectric materials have emerged as significant research hotspots within the field of materials science and engineering, primarily due to their unique electrical properties. However, the electrical characteristics of these materials are influenced by various factors, including material composition, microstructure, and preparation processes, which introduce considerable randomness and uncertainty. Traditional experimental and simulation methods are often insufficient for capturing these complex interactions, thereby hindering the prediction and optimization of material performance. This paper presents a novel approach for predicting the electrical properties of ferroelectric materials by utilizing deep neural networks (DNNs). The DNNs are trained using experimental data and serve as a proxy model to predict critical electrical properties, such as the dielectric constant and dielectric peak. The (1-x)Na0.5Bi0.5TiO3-xSrZrO3 ceramics were synthesized via the solid-state reaction method, and both the phase structure and electrical properties of NBT-xSZ were measured. The experimental results indicate that the DNN model effectively captures the intricate influences of factors such as material composition, preparation processes, and microstructure on electrical properties. The discrepancy between predicted values and experimental results remains within an acceptable range. By comparing the absolute error (<5) between measured and predicted data, alongside evaluation metrics such as MAPE, SMAPE, and R², the practicality and reliability of the DNN model are substantiated. The strong performance of this model not only accelerates the development of new materials but also enhances the optimization of the performance of existing materials.
Introduction
Ferroelectric materials have garnered extensive interest across various application domains, including memory devices, sensors, actuators, and energy storage systems, due to their distinctive electrical characteristics.1–3 These properties, such as the dielectric constant, piezoelectric coefficient, and depolarization temperature, play pivotal roles in determining the performance of these materials in real-world applications.4–6 However, the properties of ferroelectric materials are influenced by a multitude of factors, including material composition, microstructure, and the preparation process. These factors introduce significant randomness and uncertainty into the properties of the materials.7,8 Conventional experimental approaches and deterministic simulation techniques often fall short in accounting for these complex factors and their interplay, complicating the accurate prediction and optimization of ferroelectric material properties.
In the past decade, significant advancements have been achieved in the application of computer technology within the field of materials science, particularly concerning the study of ferroelectric materials. The advent of computer simulation and predictive technologies offers an efficient means to rapidly screen and optimize these materials.9–13 Utilizing advanced computational models and algorithms, researchers have been able to elucidate the electrical behavior of materials at the microscopic level and forecast their performance. For example, through machine learning (ML) methods, He et al. 9 identified key descriptors suitable for regression and classification problems related to ferroelectric materials. In regression learning, these descriptors facilitate the development of robust prediction models that accurately forecast residual polarization. Additionally, they proposed an ML strategy based on these descriptors to predict phase coexistence. Askanazi et al. 10 predicted the Curie temperature (Tc) of the ferroelectric BiMe′Me′′O3-PbTiO3 system. For effective feature selection in accurately predicting ferroelectric systems, they determined that the Bi content, B-site cation valence state, ionic radius, and ion displacement are essential features. These features, or their equivalents, must be employed to achieve quantitatively accurate Tc predictions. Furthermore, homovalent and heterovalent BiMe′Me′′O3-PbTiO3 solid solutions exhibit distinct behaviors, and both must be included in the input dataset to ensure high prediction accuracy.
There are also predictions for ferroelectric materials derived from various models and methods. For instance, Yadav et al. 11 developed a multi-level model to predict the properties of ferroelectric perovskite oxide solid solutions. Traditional methods often encounter difficulties when addressing complex solid solutions; thus, this model establishes a relationship between composition, structure, and properties by analyzing features at different scales, ranging from electronic structure and chemical bonding to collective behavior. It utilizes ferroelectric domain walls and cation eccentric displacements as critical connections. Similarly, Samanta et al. 12 employed the discrete microscopic Landau–Ginzburg–Devonshire (dmLGD) method, utilizing A-site and B-site cation displacements as order parameters. Their studies indicate that A-B cation repulsion is a significant interaction that couples the polarizations of adjacent unit cells. By examining domain wall energetics, this research can predict potential energy surfaces for oxygen vacancy migration, as well as the polarization switching and dielectric properties influenced by domain wall motion. Song et al. 13 designed relaxor ferroelectrics in normal ferroelectrics by doping point defects, and employed a phase field model to simulate the influence of these defects on the dielectric constants of BaTiO3 and PbZrTiO3. The study revealed that as the concentration of point defects increases, orthorhombic phase polarized nanoregions (PNRs) gradually emerge within the tetragonal phase of [001]-poled BaTiO3 and PbZrTiO3. Furthermore, the peak value of the dielectric constant rises with increasing defect concentration and shifts toward lower temperatures. This research indicates that utilizing computational technology to predict and guide the properties and structures of ferroelectric materials has become an effective approach. However, these findings also highlight valuable insights into the influence of point defects on the dielectric properties of relaxor ferroelectric materials. The aforementioned research suggests that computer technology can effectively predict and guide the properties and structures of ferroelectric materials. Nonetheless, current studies reveal several challenges that necessitate further investigation, including the resource consumption associated with computational scale and accuracy, the careful selection and optimization of hyperparameter sensitivity, and the understanding of complex physical mechanisms and models through simulation and modeling, as well as their universality and applicability in other systems.
In recent years, advancements in computing power and the evolution of data-driven methods have led to the rapid development of deep neural networks (DNNs) in the field of materials science, providing a novel approach for predicting the performance of ferroelectric materials.14–16 Unlike traditional machine learning methods, which often encounter limitations when processing complex and high-dimensional data, DNNs have emerged as a robust tool for predicting material properties due to their exceptional nonlinear modeling capabilities and automatic feature extraction. Through their deep network architecture and powerful nonlinear mapping abilities, DNNs can automatically learn the intricate relationships between material properties and associated factors from extensive experimental datasets, thereby yielding high-precision prediction models.17–19 In contrast to conventional physical models, DNNs are adept at managing high-dimensional, nonlinear, and diverse input data, enabling them to more effectively capture material properties and their associated uncertainties.20,21
In the study conducted by Sriboriboon et al., 22 DNNs were effectively utilized to investigate ultrathin ferroelectric materials, resulting in a significant enhancement of the sensitivity of piezoelectric response force microscopy (PFM). This advancement allows PFM to detect the weak piezoelectric response of a 10-nanometer-thick Hf0.5Zr0.5O2 film under a low excitation voltage, achieving a sensitivity of 0.3 p.m. Agar et al. 23 investigated the application of deep sequence-to-sequence long-short-term memory (LSTM) autoencoders for the automatic extraction of potential features from nanoscale ferroelectric switches in tensile strain PbZr0.2Ti0.8O3. By utilizing piezoelectric response spectroscopy data, the study identified and quantified elastic hardening events associated with the formation of charged domain walls. This approach underscores the effectiveness of unsupervised neural networks in learning the physical response characteristics of materials. Such research demonstrates that the application of DNN models to ferroelectric materials can enhance experimental efficiency and deepen our understanding of the materials’ microscopic mechanisms through big data analytics. This provides substantial support for the future design and application of ferroelectric materials. 24
This study proposes a method for predicting the dielectric properties of ferroelectric materials using deep neural networks (DNNs). NBT-xSZ ceramics were prepared via a solid-state reaction, and their phase structure and electrical properties were subsequently measured. The DNNs are trained on experimental data and function as a proxy model to predict the key electrical properties of ferroelectric materials. This model utilizes fundamental material properties, including chemical composition, elastic modulus, Poisson's ratio, and sample preparation conditions, as input parameters to generate a substantial number of simulated samples, thereby facilitating rapid predictions of material properties. The effectiveness and accuracy of this method are demonstrated through comparisons with experimental data.
The remainder of this article is organized as follows: Experiment and analysis section introduces the effects of sintering temperature and component content on the properties of NBT-xSZ ceramics, while characterizing the microstructure and electrical properties of the samples to obtain experimental data. DNN model and data preprocessing section and DNN model selection and modeling process section detail the establishment of the DNN model and the data processing techniques employed. Model training and testing section discusses the training and testing of the DNN model, comparing the test results with the experimental findings. Finally, we summarize the experimental results presented in this paper.
Experiment and analysis
Preparation process and characterization methods
(1-x) Na0.5Bi0.5TiO3-xSrZrO3 ceramic (NBT-xSZ, x = 0.1, 0.15, 0.2, 0.25) was prepared by traditional solid-phase reaction method. Raw materials Na2CO3 (99.8%), Bi2O3 (99.0%), TiO2 (98.0%), SrCO3 (99.0%), ZrO2 (99.0%) were added to ethanol by ball milling for 12 h, and then roasted at 1050 °C for 2 h. The calcined porcelain was added to ethanol for secondary ball milling to further reduce the particle size. After drying, add polyvinyl alcohol water (PVA) solution of 10% powder weight (5wt%) as binder. After granulation, the powder is pressed into a billet with a diameter of 0.5 inches. Finally, the billet was calcined at 800°C for 2 hours to eliminate the binder (PVA), and held at 1200 °C, 1220 °C, 1240 °C, 1260 °C, 1280 °C for 2 hours for sintering.
X-ray diffraction (XRD) analysis was conducted using a Japan Intelligent Laboratory Diffractometer (Tokyo, Japan) to characterize the NBT-xSZ ceramic structure. The samples were polished and subsequently annealed at 500°C for 1 hour. The microstructure of the ceramic samples was examined in cross-section using a Desktop SEM (Phenom Star, FEI Electron Optics B. V., Eindhoven, the Netherlands). For dielectric measurements, the sintered samples were polished to a thickness of 0.5 mm, coated with silver paste, and fired at 850 °C for 30 minutes. The dielectric properties were characterized using a 4294A precision impedance analyzer and a programmable furnace (Agilent Technology, Santa Clara, CA, USA). A modified Sawyer circuit (Polyktech PK-DIS1010 K, State College, USA) was employed to measure the electric hysteresis loop.
Experimental results and analysis
As shown in Figure 1(a), both NBT and NBT-20SZ ceramics exhibit a perovskite structure with pseudo-cubic symmetry,25,26 as evidenced by the peaks observed at approximately 40° and 46.5°. In comparison to the NBT ceramic, the diffraction peaks of the NBT-20SZ ceramic appear at a lower angle, indicating an increased c-axial lattice constant. This change may be attributed to the larger ionic radius of the substituting ion, 27 Sr2+ (1.44 Å), which replaces Na+ (1.39 Å), and Zr4+ (0.72 Å), which substitutes Ti4+ (0.605 Å). Furthermore, the dielectric properties of NBT-20SZ demonstrate a smaller variation with temperature across the measurement range, with the dielectric constant at 232°C exhibiting a higher value, as illustrated in Figure 1(b).

(a) Comparison of XRD patterns of NBT and NBT-20SZ ceramics and inset shows local magnifications of the characteristic peaks at 40° and 46.5°. (b) Temperature dependence of dielectric properties at different frequencies.
As illustrated in Figure 2, an increase in the sintering temperature (Ts) corresponds to an increase in the average grain size of the ceramic, which rises from 4.7 to 13.26 μm. Concurrently, the porosity within the ceramic also increases with increasing Ts. This variation in grain size can be attributed to the processes of ion diffusion and particle migration that occur during sintering. The smaller grain size facilitates the formation of a denser structure with fewer defects,25,28,29 thereby enhancing the breakdown electric field of the ceramic. Furthermore, based on the internal stress model related to the grain size effect, 30 it is observed that the internal stress level diminishes as the grain size (or Ts) increases. Research indicates that elevated internal stress levels promote greater heterogeneity in the polar regions of the ceramic, which in turn improves the dielectric response. 31

(a)–(e) SEM images of NBT-20SZ ceramics at different sintering temperatures and insets show the statistical distribution of grain size. (f) Sintering temperature dependence of average grain size.
The phase structure and electrical properties of NBT-20SZ ceramics are summarized in Figure 3. Figure 3(a) presents the XRD diffraction pattern of the NBT-20SZ ceramic samples at various Ts. It is evident that all ceramic samples ex in the lattice constant along the c-axis. Given that the composition of NBT-20SZ remains unchanged, the observed variations in lattice constants are likely attributable to changes hibit a perovskite structure, with no secondary phases detected. As Ts increases, the characteristic peaks progressively shift towards higher angles, as illustrated in Figure 3(b), indicating a reduction in internal stress states,32,33 which may arise from residual stress related to the grain size effect or non-uniform densification.33–35

Comparison of structure and electrical properties of NBT-20SZ ceramics sintered at different temperatures. (a) XRD pattern between 30°and 60° at about 25 °C. (b) Local magnification of the characteristic peaks of the XRD pattern at 40° and 46.5°. (c) Temperature dependence of dielectric properties at different sintering temperatures. (d) Electrical hysteresis loop (at 7 MV/m) at 25°C.
Figure 3(c) illustrates the variations in dielectric properties as a function of Ts. It is evident that as Ts increases from 1200 °C to 1220 °C, the dielectric constant (εr) rises from 943 to 1045. However, with further increases in Ts, the dielectric constant begins to decline, reaching a minimum value of 930 at 1260°C. Figure 3(d) shows the changes in the electric hysteresis loop under an electric field of 7 MV/m, indicating that the maximum polarization (Pmax) exhibits a trend similar to that of the dielectric constant as Ts increases. These experimental results suggest that even with identical preparation procedures, a slight adjustment in the sintering temperature can significantly influence the properties of NBT-20SZ ceramics.
The relaxation behavior of NBT-20SZ above Tm can be characterized using the modified Curie–Weiss law36–39:

In the formula, γ denotes the dispersion coefficient (1 ≤ γ ≤ 2), where γ = 1 indicates a normal ferroelectric, and γ = 2 signifies an ideal relaxed ferroelectric. The dispersion coefficients of NBT-20SZ ceramics at various sintering temperatures were analyzed, with the fitting results presented in Figure 4(a). The fitted γ values for all ceramics exceed 1.7, which correlates with the growth of the ceramic grains. At a sintering temperature of 1200 °C, γ is measured at 1.72, and it initially increases before subsequently decreasing as the sintering temperature rises. At 1220 °C, γ reaches 1.98, indicating that the relaxation degree of the NBT-20SZ ceramics is at its highest.

(a) γ obtained using the Curie–Weiss law. (b) Frequency dependencies at approximately room temperature and the slope of the fitted εr ∼ ln(f) lines.
A dielectric sweep frequency at room temperature was conducted on the NTB-20SZ ceramic, and the dielectric constant as a function of frequency was analyzed and fitted, as shown in Figure 4(b). The plot of permittivity versus logarithmic frequency exhibited a linear correlation. The slope of this linear regression can serve as an indicator of the degree of dielectric dispersion.40–42 Notably, the slope of the fitted εr ∼ ln(f) line displays the same evolutionary trend as that of εr (Figure 3(c)). The ceramic sintered at 1220 °C demonstrates the maximum degree of local polar heterogeneity at approximately 25 °C, which is supported by the evolution of γ. This indicates that the dielectric properties are closely related to local polar heterogeneity. According to the internal stress model concerning the grain size effect and the evolution trend of residual sintering stress, the internal stress level of NBT-20SZ ceramics decreases as the sintering temperature (Ts) increases from 1220 °C to 1260 °C. The enhanced electrical properties of ceramics at 1220 °C may be related to the higher dynamical fluctuation under a higher degree of local polar heterogeneity, 43 because the flatter free energy-polarization profile of systems that with a higher local polar heterogeneity. 40
Figure 5 illustrates the variation in permittivity across different compositions of NBT-xSZ at room temperature, following sintering at the optimal temperature. The data indicate that as the content of SrZrO3 increases, the dielectric constant initially increases before declining, with a peak value observed at the 20SZ composition. This behavior may be attributed to the disruption of the long-range ordered ferroelectric domain structure in NBT ceramics caused by the incorporation of SrZrO3, which subsequently promotes the formation of short-range ordered polar nanoregions, thereby enhancing the dielectric constant.44–47 The changes in composition are a significant factor influencing the properties of ferroelectric materials, alongside other challenging-to-control aspects such as the preparation process and grain size. Therefore, the development of a numerical simulation approach that can predict experimental outcomes and provide guidance throughout the experimental procedure is crucial for advancing research in ferroelectric materials.
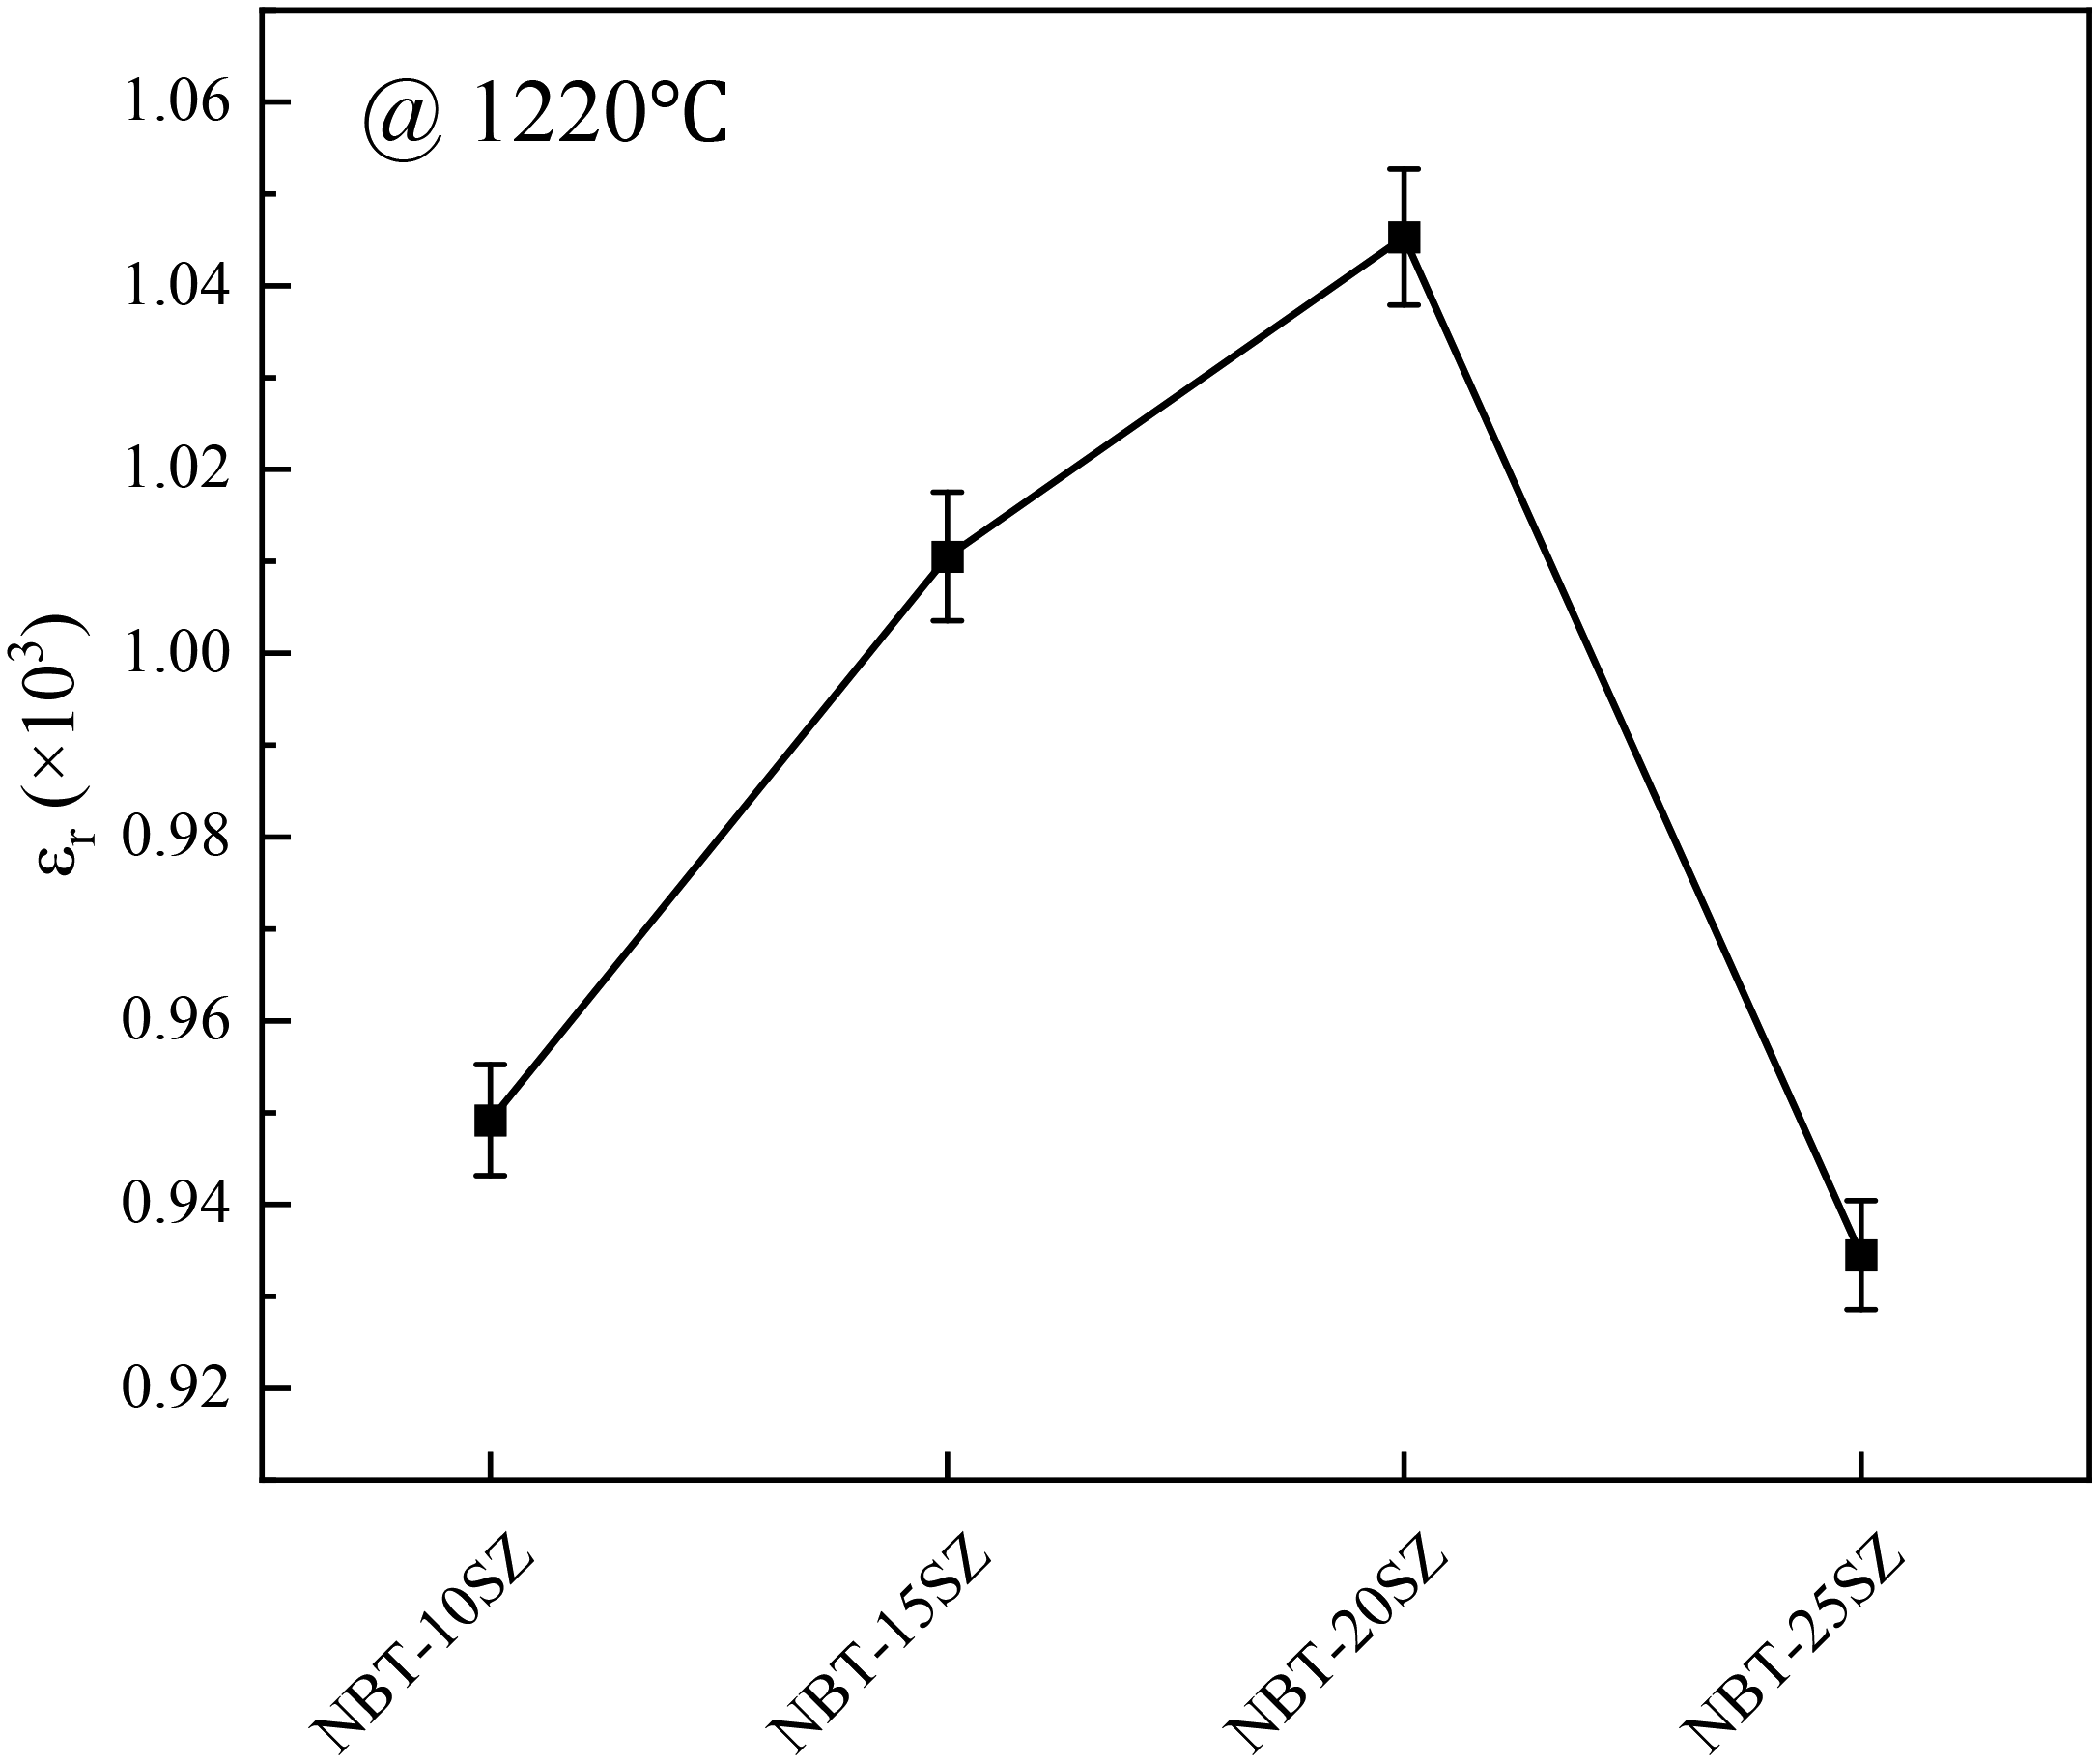
Comparison of dielectric constants of NBT-xSZ sintered (about 25 °C).
DNNs are employed to predict the dielectric properties of ferroelectric materials
DNN model and data preprocessing
Deep neural networks (DNNs) have demonstrated robust predictive capabilities across various domains,48–50 indicating that its application in forecasting the electrical properties of ferroelectric materials holds significant promise. Ferroelectric materials are essential in the fields of sensors, memory devices, and actuators due to their unique electrical characteristics, including the dielectric constant and electrical hysteresis loop. However, these properties are influenced by factors such as material composition, fabrication processes, and environmental conditions, which exhibit considerable nonlinearity and complexity. This complexity presents challenges for accurate predictions using conventional theoretical models and empirical equations.
DNNs can produce high-accuracy predictions even with limited experimental data and demonstrate a commendable generalization capability when applied to new materials or different application contexts. Consequently, the adoption of DNNs in this field has the potential to significantly enhance prediction accuracy and open new avenues for the research and development of ferroelectric materials.51–54
By gathering experimental data, we have amassed an adequate volume to satisfy the training requirements of DNNs, allowing the neural network to discern latent patterns within the data and produce accurate predictions.55–57 The dataset is divided into two distinct subsets for training and testing purposes. The mapping function is established using the training dataset, while the performance of the trained model is assessed with the test dataset. Ultimately, post-processing of the network's output is conducted to translate the predicted values back to their actual counterparts.
When working with diverse data features, substantial variations in the magnitudes of eigenvalues are frequently observed, which can adversely affect the training and predictive accuracy of the model. To address this issue and prevent discrepancies in feature magnitudes from influencing the model, data standardization is commonly utilized. Figure 6 presents a comprehensive overview of the entire training procedure for DNNs, illustrating the methodology employed in DNN-based stochastic analysis. This procedure can be systematically categorized into two primary stages.

Flowchart of DNN-based analysis.
(1) Data preparation: Statistical data are used to standardize the data set. They are divided into training set and test set. The primary aim of standardization is to transform feature data of varying magnitudes into a uniform scale, thereby eliminating discrepancies in magnitude among features. When features possess different magnitudes, they can exert varying degrees of influence on the model's training process. If the data are not standardized, the model may disproportionately focus on features with larger magnitudes while neglecting those with smaller magnitudes, leading to biased training outcomes.
Standardization is a crucial pre-processing step in many machine-learning algorithms, significantly improving both the training efficiency and predictive accuracy of models. In optimization routines such as the gradient descent algorithm, standardized data ensure that the gradients for each feature are on a comparable scale. This promotes faster convergence of the gradient descent algorithm and results in reduced training times. Furthermore, standardization enhances the model's adaptability across diverse datasets, making it more responsive to variations in different features. As a result, this process boosts the model's generalization capabilities. Standardization can be achieved using the following formula:

(2) Training and testing involve the division of the standardized dataset into two distinct subsets: the training set and the test set. The mapping function F is derived from the training set and is subsequently employed to train the model. Following this, the performance of the trained model is evaluated using the test set. After this evaluation, the predicted output

DNN model selection and modeling process
The DNN model was selected for this data analysis task due to its ability to manage multidimensional and complex nonlinear data effectively. The electrical characteristics of ferroelectric materials are influenced by numerous variables that may exhibit intricate nonlinear interactions. The robust fitting capabilities of DNNs allow them to address these sophisticated relationships efficiently. This attribute is particularly important when working with high-dimensional data, giving the DNN a significant advantage in predicting the electrical properties of ferroelectric materials.
The DNN model is briefly outlined, grounded in the principles of linear regression while extending its capabilities to capture the mapping relationship between input and output data. Unlike conventional numerical approaches, DNNs circumvent the necessity of navigating complex physical constraints. Instead, it learns the mapping function by utilizing information derived from the problem's solution alongside the input data. Figure 7 illustrates a typical architecture of DNNs, demonstrating how the forward computation achieves both linear and nonlinear transformations through a combination of linear layers and nonlinear activation functions. The specific equation representing the calculation process of DNNs is presented as follows:

Deep neural network structure.
This section provides a brief outline of DNNs, which are based on the principles of linear regression but extend beyond this framework to establish the mapping relationship between input and output data. Unlike conventional numerical approaches, DNNs eliminate the need to navigate complex physical constraints. Instead, they learn the mapping function by utilizing information derived from both the problem's solution and the input data. Figure 7 illustrates a typical DNN architecture, demonstrating how the forward computation of a DNN achieves both linear and nonlinear transformations through a combination of linear layers and nonlinear activation functions. The specific equation governing the DNN calculation process is presented as follows:

In this research, we selected two prevalent activation functions that are extensively employed in DNNs: Tanh and ReLU. The Tanh function is recognized for its ability to scale inputs to the interval [‒1, 1], while the ReLU function is characterized by its property of setting negative inputs to zero, thereby retaining only positive values. This simplicity in implementation contributes to its high computational efficiency, and the ReLU function has demonstrated strong performance across a variety of forecasting tasks. In Model training and testing section, we provide a detailed analysis of the specific performance and comparative effects of these two activation functions within our model.
To enhance the model's predictive capability, we employ a loss function to evaluate the accuracy of predictions after each forward propagation. In regression tasks, the mean square error (MSE) is a widely used loss function, as it effectively quantifies the difference between the model's predicted values and the actual values. Consequently, MSE is selected as the primary evaluation criterion in this study, where the predicted value is denoted as

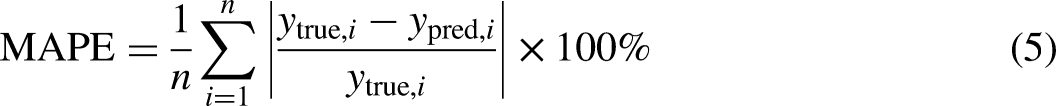
Assessing the performance of DNN models using a single evaluation metric is challenging. Therefore, we incorporate additional measures, including the mean absolute percentage error (MAPE), symmetric mean absolute percentage error (SMAPE), and R-squared (R²), to evaluate the performance of the training model. Furthermore, we introduce absolute error as a criterion to ascertain whether the predicted data meet the experimental requirements. The formulae for these indicators are as follows:


Model training and testing
The dataset is randomly partitioned by generating random indices, which are then used to select data from the complete dataset obtained through experiments to form the test dataset. The remaining unselected data are utilized to train the model, ensuring that it can make accurate predictions and analyses based on a comprehensive understanding of the characteristics of the experimental data. This approach guarantees that the selection of the test dataset is entirely random, thereby effectively evaluating the model's predictive accuracy on unseen data. The number of nodes in the hidden layers is initially determined using an empirical formula, which is subsequently modified and finalized during the training process, as illustrated below. Additionally, Table 1 provides detailed information on several key training and network parameters.

Training hyperparameter settings.
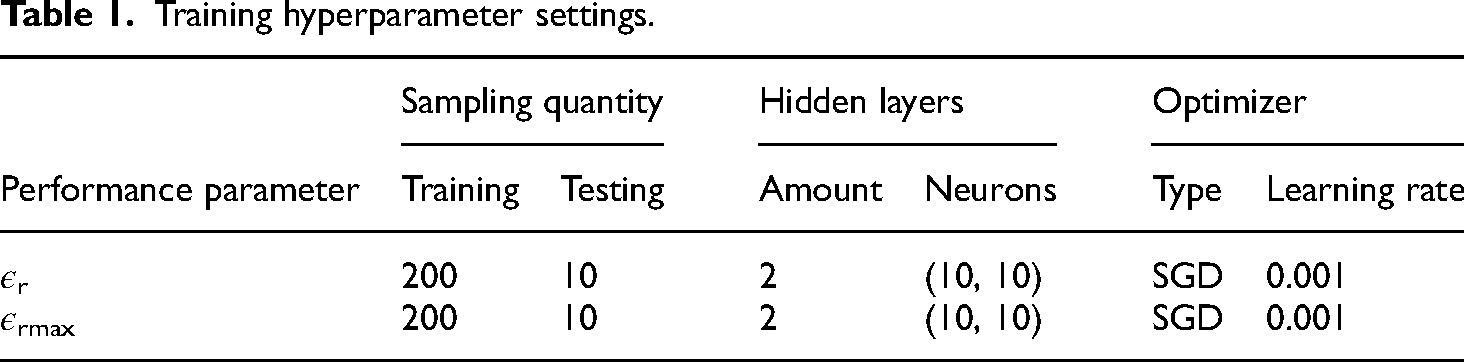
where h is the number of hidden layer nodes, m is the number of input layer nodes, n is the number of output layer nodes, and a is a tuning constant between 1 and 10.
After dividing the dataset, the training set is fed into the DNN model. The input data include the sintering temperature, the content of SrZrO3 in the material, and the corresponding dielectric loss. The output data, which represent the predicted results, include the dielectric peak value and the dielectric constant. Network parameters are established through multiple training sessions, and the evolution of the mean squared error (MSE) is compared across various activation functions and optimizers. The results obtained are illustrated in Figure 8.

Training loss varies with different hyperparameters: (a) different activation functions; (b) different optimizers.
Figure 8(a) illustrates that while the loss value for the Tanh function may initially be high with fewer iterations, it consistently diminishes as the number of iterations increases. This trend indicates that the Tanh function is capable of progressively learning and enhancing the model's predictive capabilities throughout the training process. The relatively steady decline in the loss value for the Tanh function indicates a consistent rate of improvement at each iteration. In contrast to the ReLU algorithm, the Tanh algorithm exhibits faster convergence without the late-stage oscillations observed in the ReLU. Notably, even after a substantial number of iterations, such as 100, the loss value for the ReLU function does not decrease to a significantly low level. Consequently, the Tanh algorithm is more suitable for this dataset, given its superior performance in achieving lower loss values.
Figure 8(b) presents a comparative analysis of the loss values associated with different activation functions over the course of 100 iterations. It is evident that the loss for the SGD optimizer decreases rapidly and achieves convergence, demonstrating superior effectiveness compared to the Adam optimizer. Consequently, the Tanh activation function was selected in conjunction with the SGD optimizer for model training.
Following the establishment of the model's hyperparameter settings, we utilized the dataset generated from the experiment to conduct training predictions. To enhance the clarity of the prediction outcomes, we selected 15 data points from the test set to evaluate the prediction accuracy. Figure 9 presents a partial comparison between the predicted values obtained from the DNNs and the actual values derived from experimentation, using the same inputs.

Comparison between the predicted results and the experimental results of the dielectric constant and dielectric peak value: (a) dielectric constant; (b) dielectric peak value.
The predicted values align closely with the experimental results, with the exception of a few specific test points.
Detailed statistical results of the DNNs prediction evaluation, calculated using formulas (5), (6), and (7), are listed in Table 2. All values were computed after the denormalization of predictions. It is evident from the table that the prediction error dispersion for each model is minimal, and all indicators fall within the acceptable range.
The statistical results of the DNNs forecasts.
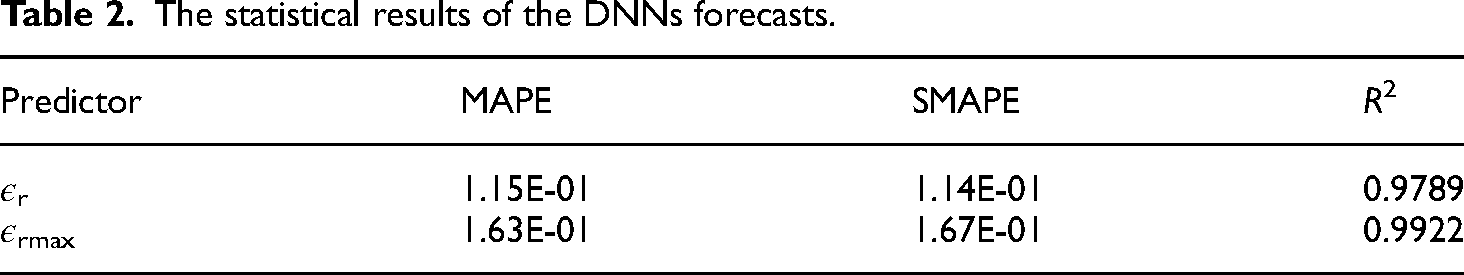
Due to the substantial magnitude of the data, the relative error may appear minor, potentially obscuring the actual discrepancy between the predicted outcome and the true value. Consequently, relying solely on relative errors may not yield an accurate assessment of the model's predictive accuracy.
To achieve a more comprehensive evaluation of the model's performance, it is essential to incorporate absolute error as a complementary metric. Absolute errors provide a clearer representation of the concrete difference between the predicted and actual values, facilitating a more reliable and holistic analysis. We computed both absolute and relative errors for the actual versus predicted values, with the findings shown in Figure 10 and Table 3.

Absolute error between actual and predicted values.
Analysis of the relative error between the actual and predicted values of the dielectric constant and dielectric peak value.

Figure 10 and Table 3 clearly illustrate that the absolute error between the predicted and actual values is within 5, indicating a high level of accuracy. This finding suggests that the model maintains the reliability and accuracy of its predictions during forecasting. Additionally, the favorable relative error further substantiates the model's robustness and reliability. These results demonstrate that the predictive performance of the model has achieved a high standard, as evidenced by both absolute and relative error metrics, thus providing a solid foundation for the subsequent analysis and application of ferroelectric materials, with beneficial implications for various aspects of experimental design.
First and foremost, this degree of precision guarantees the dependability of the predicted outcomes. The minimal absolute error indicates that the prediction model closely aligns with actual conditions, instilling greater confidence in researchers regarding the predictions for their new experimental work. In the context of this research, such accuracy significantly reduces errors arising from operational deviations during experimentation, thereby ensuring the stability and reproducibility of the results. Additionally, it facilitates the anticipation of experimental outcomes for new trials, which can lessen the necessity for preliminary testing, thereby conserving both time and material resources while accelerating the achievement of experimental objectives. This ultimately enhances overall experimental efficiency and optimizes resource allocation.
The results indicate that the well-trained model effectively predicts outcomes under various conditions, confirming that DNNs can serve as robust surrogate models for predicting the dielectric properties of ferroelectric materials. The DNN model not only possesses robust fitting capabilities that effectively address the data fitting challenges presented in this study, but it also excels in processing small sample datasets. In scenarios involving limited sample sizes, DNNs outperform other neural network architectures due to their ability to extract latent patterns and features from the data through deep structures and nonlinear mappings. As the volume of data increases, DNNs are expected to demonstrate even greater potential in future applications.
Conclusion
In summary, the influence of the preparation process on the electrical properties of NBT-xSZ ceramics was demonstrated by varying the sintering temperature and composition. To mitigate the impact of extraneous factors that could affect the performance of ferroelectric materials and introduce interference and uncertainty into the experimental results, we constructed and optimized a deep neural network (DNN) model by collecting and preprocessing experimental data. The effectiveness and accuracy of this model in predicting key electrical properties, such as the dielectric constant and dielectric peak, were subsequently verified. The experimental results indicate that the DNN model effectively captures the complex interactions among the composition, preparation process, and microstructure of ferroelectric materials and their electrical properties. Notably, the combination of the Tanh activation function and stochastic gradient descent (SGD) as the optimizer significantly enhances the model's prediction accuracy. A comparison of the absolute errors between the measured and predicted data reveals that most predicted values align closely with the true values, with the errors of local data points remaining within an acceptable range. This further substantiates the practicality and reliability of the DNNs model in predicting the dielectric properties of ferroelectric materials. The model's strong performance not only expedites the research and development of new materials but also provides robust support for the performance optimization of existing materials. The findings of this research offer new methodologies and insights into the study of ferroelectric materials and highlight the promising application prospects of data-driven DNNs in the field of materials science.
Footnotes
Acknowledgements
The authors thank Yunfei Gao and Gaochao Zhao for critically revising the manuscript for important intellectual content.
Authors’ contribution
Jiachen Wang contributed to writing-original draft, data curation, and prepare figures preparation; Ziyu Cui contributed to data calculation and example analysis; Xin Zhang contributed to experimental test and example analysis; Jikai Zhao contributed to experimental test and methodology; Fan Li contributed to experimental test, prepare figures; Zhongbin Zhou contributed to code support and example analysis; Nathan Saye Teah contributed to prepare figures; Yunfei Gao contributed to writing-original draft and data curation; Gaochao Zhao contributed to writing-original draft and formal analysis; and Yang Yang contributed to methodology.
Data availability
All data generated or analyzed during this study are included in this published article.
Declaration of conflicting interests
The authors declared no potential conflicts of interest with respect to the research, authorship, and/or publication of this article.
Funding
The authors disclosed receipt of the following financial support for the research, authorship, and/or publication of this article: This work was supported by the Henan Provincial Key R&D and Promotion Project under Grant No. 232102220033, the Zhumadian 2023 Major Science and Technology Special Project under Grant No. ZMDSZDZX2023002, the Natural Science Foundation of Henan under Grant No. 222300420498, and the Postgraduate Education Reform and Quality Improvement Project of Henan Province under Grant No. YJS2023JD52.