
Abstract
Objectives
Increasing evidence indicates that the local microbiome can be used to predict host disease states. However, constructing models that obtain better results with fewer features is still challenging.
Methods
In this study, we established a nasal microbiome database consisting of 132 chronic rhinosinusitis patients, 27 nasal inverted papilloma patients, and 45 control patients. 16S rRNA gene sequencing was used to identify the species and abundance of bacteria in each sample, and a nasal microbiome database was generated after low-abundance bacteria were eliminated. The correlation data network of different groups of bacteria was constructed by calculating the correlation coefficient among bacterial genera, and the correlation parameters of the network were calculated based on graph theory. Through the development and application of a machine learning framework to optimize the screening process, combined with microbiome relationship network parameters based on graph theory, basic bacteria with high contributions to classification prediction were selected for the prediction of nasal diseases.
Results
We found that patients with nasal disease have a specific nasal microbiome signature and identified Moraxella, Prevotella, and Rothia as keystone genera that are markers of nasal disease; these markers can be interpreted as key control routes through graph theory analysis of the microbiota. With this strategy, we were able to characterize microbial community changes in nasal disease patients, which could reveal the potential role of the nasal microbiome in nasal disease.
Conclusion
This study can provide a reference for the formulation of disease prevention and control policies. Our framework can be applied to other diseases to identify keystone genera that influence disease states and can be used to predict disease states.
Introduction
The human body has a wide variety of microbiomes. These microbiomes maintain symbiotic relationships with the human body, and the resident microbiome plays an important role in determining human development, nutritional status, and immunity. Although the microbiome maintains a stable coexistence with the body, some of its distortions have been reported to have potentially harmful effects. Although it is not clear whether this microbial association is causal, these findings have contributed to a better understanding of the pathogenesis of various diseases.1–4
In addition, researchers have explored the use of microbes to predict host disease states. In recent years, increasing evidence has suggested that local microorganisms can predict host health in individuals with various diseases, such as inflammatory bowel disease.5–7 These results suggest that microorganisms, as new biomarkers, have broad application prospects for disease prediction.
Nasal diseases include a series of inflammatory and neoplastic conditions, such as chronic rhinosinusitis (CRS) and nasal inverted papilloma (NIP), which significantly reduce patients’ quality of life and work efficiency. Although the onset of nasal disease is inconspicuous, it has placed a serious public health burden on society. 8 Patients often need surgical treatment because of the high degree of lesion involvement, which prevents conservative treatment and results in greater trauma and economic burden to patients. At present, no early, accurate, simple, and economical method for screening for nasal diseases in the general population exists.
The nasal cavity is the first line of defense of the respiratory mucosa against the external environment. Researchers have focused on the vital role of the nasal microbiome in the pathophysiological process of nasal diseases and have preliminarily explored its predictive role.6,9 Identifying microbial community changes in nasal diseases can provide a reference for the formulation of disease control policies. Nasal flora detection is a noninvasive method that is simple, economical, and convenient, but its effectiveness in nasal disease prediction in large cohorts is still uncertain.
Correlation analysis based on networks has become a common method for studying the interactions of microecosystems. At present, researchers can identify keystone genera using the hub nodes in the network.10,11 However, no studies have explored the use of network analysis in disease prediction. In this study, we collected nasal swab samples from 159 patients with nasal diseases and 45 controls for 16S rRNA gene sequencing. We developed and applied a machine learning framework for core bacterial screening combined with the analysis of the microbiota relationship network via graph theory to identify keystone genera and construct dynamic models of microecological core communities (Figure 1). This framework successfully overcomes the high dimensionality, sparsity, and multicollinearity of multi-omics data and focuses on providing greater interpretability. Compared with traditional single machine learning methods, such as support vector machines (SVMs), the proposed framework is more suitable for processing high-dimensional sparse complex ecological data. Compared with deep learning methods, it provides better interpretability and helps more clearly illustrate the interrelationships of components and the nature of ecological processes in microecosystems. With this strategy, we were able to characterize microbial community changes in nasal disease patients, which could reveal the potential role of the nasal microbiome in nasal diseases. This study can provide a reference for the formulation of disease prevention and control policies.

Schematic diagram of the experimental workflow framework. The genera initially selected are based on OTU abundance. This selection is further refined using DWs and BCs within the graph network. Finally, the key group is identified and validated for classification purposes.
Materials and methods
Subject recruitment and sampling
In this study, we performed a cross-sectional study. A total of 159 patients with nasal disease and 45 controls were recruited between June 2021 and July 2022 from the Department of Otorhinolaryngology-Head and Neck Surgery, Tianjin First Central Hospital. Each patient underwent an independent physical examination by two rhinologists to confirm the nasal disease diagnosis, and clinical information such as age, sex, smoking history, medication history, and surgical history was recorded. Patients determined to have CRS met the diagnostic criteria of the European Position Paper on Rhinosinusitis and Nasal Polyps (2020) guidelines. 12 The NIP was determined by postoperative histopathology. Patients with voice disease and thyroid disease were included in the control group, and patients with nasal diseases were excluded by nasal endoscopy. This study was approved by the Ethics Research Committees of the Tianjin First Central Hospital (approval number 2021N037KY) in June 2021. The study was in accordance with the Helsinki Declaration of 1975 as revised in 2013. The study had followed relevant EQUATOR guidelines. 13
The exclusion criteria were as follows: patients with immune-related diseases, genetic disorders, pregnancy, clotting disorders, or cystic fibrosis; with unilateral nasal polyps or infectious or anatomic sinusitis; who had used systemic antibiotics; had undergone immunosuppressive therapy; or had used systemic or local steroid hormones within 12 weeks prior to screening.
Before sampling, the operator disinfected the nasal vestibular skin to reduce contamination. Under the guidance of the nasal endoscope, the sterile cotton swab was placed in the subject's middle nasal canal, gently rotated five times before being placed in the sterile empty tube and immediately stored in a freezer at −80°C for subsequent detection and analysis. In addition, mock samples containing only cotton swabs were collected at each sampling to assess contamination. According to our previous research, the quality and uniformity of the samples collected in this experiment and the method used were feasible. 6 Finally, valid nasal microbiome data were obtained from a total of 132 CRS patients, 27 NIP patients, and 45 control patients. This study was approved by the Ethics Committee of Tianjin First Central Hospital (approval number 2021N037KY). All of the subjects were informed and signed informed consent forms before entering the study.
Microbiome sequencing and analysis
16S rRNA gene sequencing and analyses
Briefly, total DNA was extracted from nasal swabs using an E.Z.N.A.® DNA Kit (Omega Bio-tek, Norcross, GA, USA) according to the manufacturer's protocols. 6 DNA amplification and sequencing were performed on the V3–V4 hypervariable regions of the 16S rRNA gene of bacterial DNA with a PCR system (GeneAmp 9700, ABI, USA). The PCR products were extracted, purified, and quantified following the manufacturer's protocol. The purified amplicons were sequenced (2 × 250 bp) on an Illumina MiSeq platform (Illumina, San Diego, USA) according to standard protocols.
After the DADA2 method was applied, a series of filters were applied to detect and remove contaminants as described previously. The amplicon sequence variant (ASV) was compared with the GREENGENES database and annotated. The ASV with 99% similarity was classified as one operational taxonomic unit (OTU) to obtain the OTU classification information table. The OTUs were classified using the RDP classifier to obtain their numbers at different taxonomic levels.
The number of observed species and the Shannon index values were calculated and used to characterize the species diversity in a community. Principal component analyses (PCAs) of the unweighted UniFrac distance were used to assess the variation among nasal disease patients and controls, revealing the beta diversity. Differential analysis was performed using the Kruskal‒Wallis test. Partial least squares discriminant analysis (PLS-DA) is a supervised analysis method that ignores random differences within groups, highlights systematic differences between groups, and was performed to predict the sample types corresponding to the microbial communities. A receiver operating characteristic (ROC) curve was constructed, and the area under the curve (AUC) was calculated to evaluate the diagnostic performance of the model.
16S rRNA gene sequencing and analyses of negative controls
The negative controls were treated according to the protocol described above. Principle and process of impurity removal: Five negative control samples were sequenced. According to the sequencing results, the genus-level species present in more than 50% of the samples (those present in more than 3 samples with an abundance greater than 0.001%) were identified as contaminating bacteria (or heterobacteria). The contaminating bacteria were removed from the nasal swabs. The removed species were normalized again to obtain the relative abundance of the real species in the sample.
Nasal microbiome extract
The proportions of these genera that exceeded 0.01% were retained as the core nasal microbiome.
Genus correlation and network
Spearman's correlation coefficient for the bacterial community (genus level) was calculated, and the significance of the correlation was tested using the corr.test function in the psych package from R. Significant (p < 0.05) correlations were visualized by network graphs generated with the Fruchterman Reingold layout in Gephi software (version 0.9.2). On the basis of the correlation network constructed using the correlation index, we calculated network parameter metrics, such as degree (D), degree weighted (DW), and betweenness centrality (BC), using graph theory methods for data filtering, as shown in Supplemental Figure 1. D refers to the number of edges connected to that point in the graph, also known as the valence. DW means that the degree of each node (vertex) in the graph is given a weight that reflects the node's importance and connectivity in the graph. BC is a measure of the centrality of a network in graph theory and is used mainly to assess the importance of nodes in a network. It is based on the concept of the shortest path and measures how often a node appears in the shortest path between all pairs of nodes.
Impact of the abundance of nasal genus OTUs on the classification ability of the models
To validate our previous extraction of the nasal microbiome, where we retained genera with proportions exceeding 0.01% as the core nasal microbiome, we conducted classification tests on the microbiota based on the OTU abundance.14,15 This procedure was used to explore the impact of the abundance of OTUs in the nasal microbiome on model classification. We performed several model classification tests in three groups: one with all 780 genera, another with 263 genera with an OTU abundance above 0.01%, and the last with 61 genera with an OTU abundance above 0.1%. The results in Supplemental Figure 2 demonstrate that all of the models with 263 genera outperformed those with 780 genera in the training set. After further validation on the test set, the results, as shown in Supplemental Figures 3 and 4, reveal that 263 genera (0.01% abundance) provided a good balance, maintaining high model performance while avoiding the loss of important biological information due to too few genera. Notably, after the data on feature importance were exported from the random forest (RF) model for all 780 genera, only 370 of these had feature importance above 0.00001. This further validates the necessity of abundance filtering.
Utilizing graph theory for further filtering of the nasal microbiome
In bioinformatics and systems biology, graph theory concepts are often used to analyze regulatory networks of genes or proteins. Specifically, DW and BC are two commonly used network analysis metrics that can be used to assess the importance of nodes in a network. We can use this approach to further select features from nasal sinus microbiome data (263 species) with a proportion exceeding 0.01%.
A microbiome with high DW may play a key regulatory role in the network, as it has direct interactions with many other microbiomes. These microbiomes may be key regulatory points or central members of the network. A microbiome with high BC is one that frequently appears on all of the shortest paths in the network. These microbiomes may act as “bridges” in interactions between microbiomes. BC can help reveal microbiomes that are crucial for maintaining network connectivity. Changes in these microbiomes could have a widespread impact on the entire system. Therefore, according to graph theory, DW and BC are two important parameters for defining key regulatory genera in the overall microecosystem.
After data preprocessing, we found that high BC or DW values did not reflect differences between the two microbiome networks. However, the differences between the DWs or BCs of the two networks revealed that key genera varied, which may be the key to analyzing the two microbiome networks. Therefore, we calculated the changes in all of the parameters to determine the most varied genera.
Using Supplemental Figures 1 and 5 as a basis, we aimed to evaluate the impact of genera selected by BCs and DWs on the classification ability of the models. 16 To this end, we constructed a graph network architecture and analyzed the nasal microbiome with an OTU abundance of at least 0.01%, identifying the 10 genera with the greatest differences between the disease and control groups. The experimental design included five different groups based on DW and BC, and 10 genera whose parameters increased or decreased in the disease group compared with those in the control group were selected. A comparison of the experimental results revealed that the classification ability of the 10 genera selected on the basis of BCs was superior to that of those selected by DWs. To further explore the impact of the number of microbial communities on model performance, we used the RF model to rank the genera by feature importance and gradually increased the number of these features, observing how the quantity of the features affected model performance.
Results
The nasal microbiomes of patients in the nasal disease group and control group substantially differ
In our study, the final nasal disease cohort included nasal swabs obtained from 132 CRS patients, 27 NIP patients, and 45 control patients. The demographic profile of the patients is shown in Supplemental Table 1. The rarefaction curve of each sample tended to flatten, suggesting that the sequencing data of each nasal swab sample were stable at this sequencing depth and that the bacterial diversity data obtained from the sequencing data could effectively represent each sample, as shown in Supplemental Figure 6.
The nasal microbiomes of the nasal disease groups and the control group had different compositions at different species levels, as shown in Figure 2(A). Firmicutes and Proteobacteria were the most dominant phyla in the two groups. Compared with those in the control group, the proportions of Proteobacteria, Bacteroidetes, and Actinobacteria in the nasal disease group were significantly greater, whereas the proportion of Firmicutes was significantly lower, as shown in Supplemental Table 2. At the genus level, compared with those in the control group, the abundances of Anaerococcus, Achromobacter, Streptococcus, and Prevotellaceae Prevotella were significantly greater, whereas those of Alloiococcus and Moraxella were significantly lower, as shown in Supplemental Table 3.

Nasal microbiome data analysis of patients with nasal disease and controls. Relative proportions of bacterial genera (a) in nasal disease patients and controls. The Chao1 index (b) and Shannon index (c) were significantly greater in the nasal disease groups than in the control group. (d) PCoA based on the Bray-Curtis distance index showed that the overall nasal microbiota compositions of the nasal disease group and control group differed (p = 0.001). (e) PLS-DA analysis of OTUs between the nasal disease groups and control group. (f) ROC analysis of the predictive value of the predictive model constructed based on PLS-DA analysis. The AUCs are approximately 1. The boxes represent the 25th–75th percentiles of the distribution; the median is shown as a thick line in the middle of the box; whiskers extend to values of 1.5 times the difference between the 25th and 75th percentiles; and outliers are represented as dots. A: nasal disease; B: control.
To assess the abundance and uniformity of the sample species compositions within the different groups, the α diversity of the different groups was compared. Compared with those in the control group, the patients with nasal diseases had greater α diversities, as measured by the Chao1 index (p < 0.001; Figure 2(B)) and Shannon index (p < 0.001; Figure 2(C)). This result suggested that the species diversity of the nasal microbiome was greater in the nasal disease group.
To assess the overall diversity of the microbial composition in both groups, we performed PCA based on Bray‒Curtis dissimilarity (Figure 2(D)). This analysis revealed that the nasal taxonomic compositions of patients with nasal diseases and those in the control group significantly differed (p = 0.001). These results suggest that the nasal microbiome features of patients with nasal diseases differ from those of control patients. In addition, following the PLS-DA analysis (Figure 2(E)), the nasal microbiome was clearly divided into two independent clusters, indicating that the compositions of the nasal microbiomes of the two groups significantly differed. The AUC was almost 1 (Figure 2(F)), indicating that PLS-DA was able to distinguish nasal diseases effectively on the basis of the different genera detected. These results suggest that the nasal microbiome has good application potential for predicting nasal disease.
Classification results of the nasal microbiome based on OTU abundance
We categorized the nasal microbiome according to three different abundances of OTUs. We selected 70% of the samples as the training set and used StratifiedKFold (10-fold) to analyze the microbiota, 17 reducing the impact of category bias in stratification on the performance estimation. We compared the AUC and accuracy scores of the different classification models under varying abundances. The AUC measures the model’s ability to discriminate between positive and negative categories, with a higher value indicating better model performance. The accuracy represents the proportion of correctly classified samples out of the total number of samples, where a higher value indicates an overall higher correctness of the model. We analyzed the impacts of different OTU abundances (780, 263, 61) on model performance. Furthermore, we compared the performances of different models, such as logistic regression (LR), K-nearest neighbors (KNN), SVM, and RF, on the same feature set to identify the best-performing model and microbiota for specific feature sets. LR is a statistical learning method for solving binary classification problems. It is a classification model in machine learning. KNN is a simple machine learning algorithm mainly used for classification and regression tasks. SVM is a generalized linear classifier for binary classification of data that is based on supervised learning. RF is an ensemble learning method used primarily for classification and regression tasks. By constructing multiple decision trees and summarizing their predicted results, the accuracy and stability of the model can be improved.
As shown in Supplemental Figures 3 and 4, under the condition of 780 genera, our results revealed that the LR and SVM models performed better than the other models did. The KNN algorithm performed worst in this scenario, with an AUC of 0.54, possibly because of its sensitivity to high-dimensional data. 18 RF demonstrated the best performance, with AUC = 0.89, likely because the RF algorithm reduces the impact of dimensionality on high-dimensional data by building trees and training on subsets of features. RF also had a relatively low standard deviation of 0.05, indicating a more stable performance. 19 In the condition with all of the genera included, the inclusion of some less relevant or redundant features might have negatively impacted the performances of some of the models, especially distance-based models such as KNN.
In the case of 263 nasal genera with an abundance above 0.01%, all of the models performed better than they did with 780 genera, and this improvement was particularly strong for KNN (AUC = 0.72) and SVM (AUC = 0.79). Our results indicated that removing low-abundance genera can reduce noise and increase model accuracy. The RF algorithm continued to maintain high performance. With 61 nasal sinus genera with abundance above 0.1%, both KNN and SVM exhibited further AUC and accuracy improvements. The performance of the RF marginally increased (AUC = 0.90), but the extent of improvement was less significant than that in the condition with 263 genera (AUC = 0.88).
Genus selection based on DWs and BCs
We conducted five sets of experiments based on DWs and BCs in the graph network. The experiments involved selecting the 10 genera with the greatest increase or decrease in parameters in the disease group compared with those in the control group based on DW, on BC, and on both DW and BC. In total, five experimental groups were formed for the study.
When we classified patients using the top 10 genera with the greatest DW and BC parameter changes, KNN exhibited a better model classification ability for 263 microbiota (AUC = 0.83), whereas the AUC scores for the SVM, LR, and RF models all more noticeably declined (Supplemental Figure 7). The experiments were subsequently conducted on two groups: those with increased parameters in the disease group compared with those in the control group and those with decreased parameters based on DW filtering (Supplemental Figure 9). The relationship between the number of microbiota and the model’s classification ability was also explored (Supplemental Figure 8). Similarly, experiments were conducted on two groups filtered by BC: one with increased parameters and the other with decreased parameters in the disease group compared with those in the control group (Supplemental Figures 10 and 11). The results revealed that the 10 genera selected on the basis of the increased parameters in the disease group compared with those in the control group filtered by BC achieved the highest AUC scores across all of the models. In particular, the KNN model achieved the highest AUC score of 0.88 among all of the models, as shown in Supplemental Figure 12(C). This finding suggests that genera with high BCs frequently appear on the shortest paths of the microbial network and play a key role in maintaining network connectivity. From a systems biology perspective, genera with high BCs may be important indicators of microbial community stability and functionality. Changes in these genera not only are potential biomarkers of disease states but also may have broad impacts on the overall structure and function of the microbial community.20,21 Additionally, the genera selected based on the graph network all had an abundance of more than 0.1%, which indirectly indicates a correlation between classification and abundance.
We further ranked the genera on the basis of feature importance from the 10 genera selected for their increased parameters in the disease group compared with the control group based on BC and sequentially incorporated these genera into the model according to their rank order in Figure 3. 22 As shown in Figure 4(A), when the number of genus features reached three, both the accuracy and AUC of the RF model peaked. As the number of genera increased further, the model’s performance declined. At this point, the three most important genera were Prevotellaceae Prevotella (importance: 0.263239), Moraxella (importance: 0.136706), and Rothia (importance: 0.102852). We considered these three genera to be the key genera for the classification of the nasal microbiome.

Ten genera were identified considering the higher BC parameters in the disease group than in the control group. (a) Box plot of the AUCs for SVM, RF, LR, and KNN based on the training set, validated with SKfold 10-fold cross-validation. (b) Box plot of the accuracies of SVM, RF, LR, and KNN based on the training set, validated with SKfold 10-fold cross-validation. (c) Feature importance ranking based on the random forest algorithm. (d) ROC curves of the SVM, RF, LR, and KNN models based on the test set with optimal parameter retrieval.
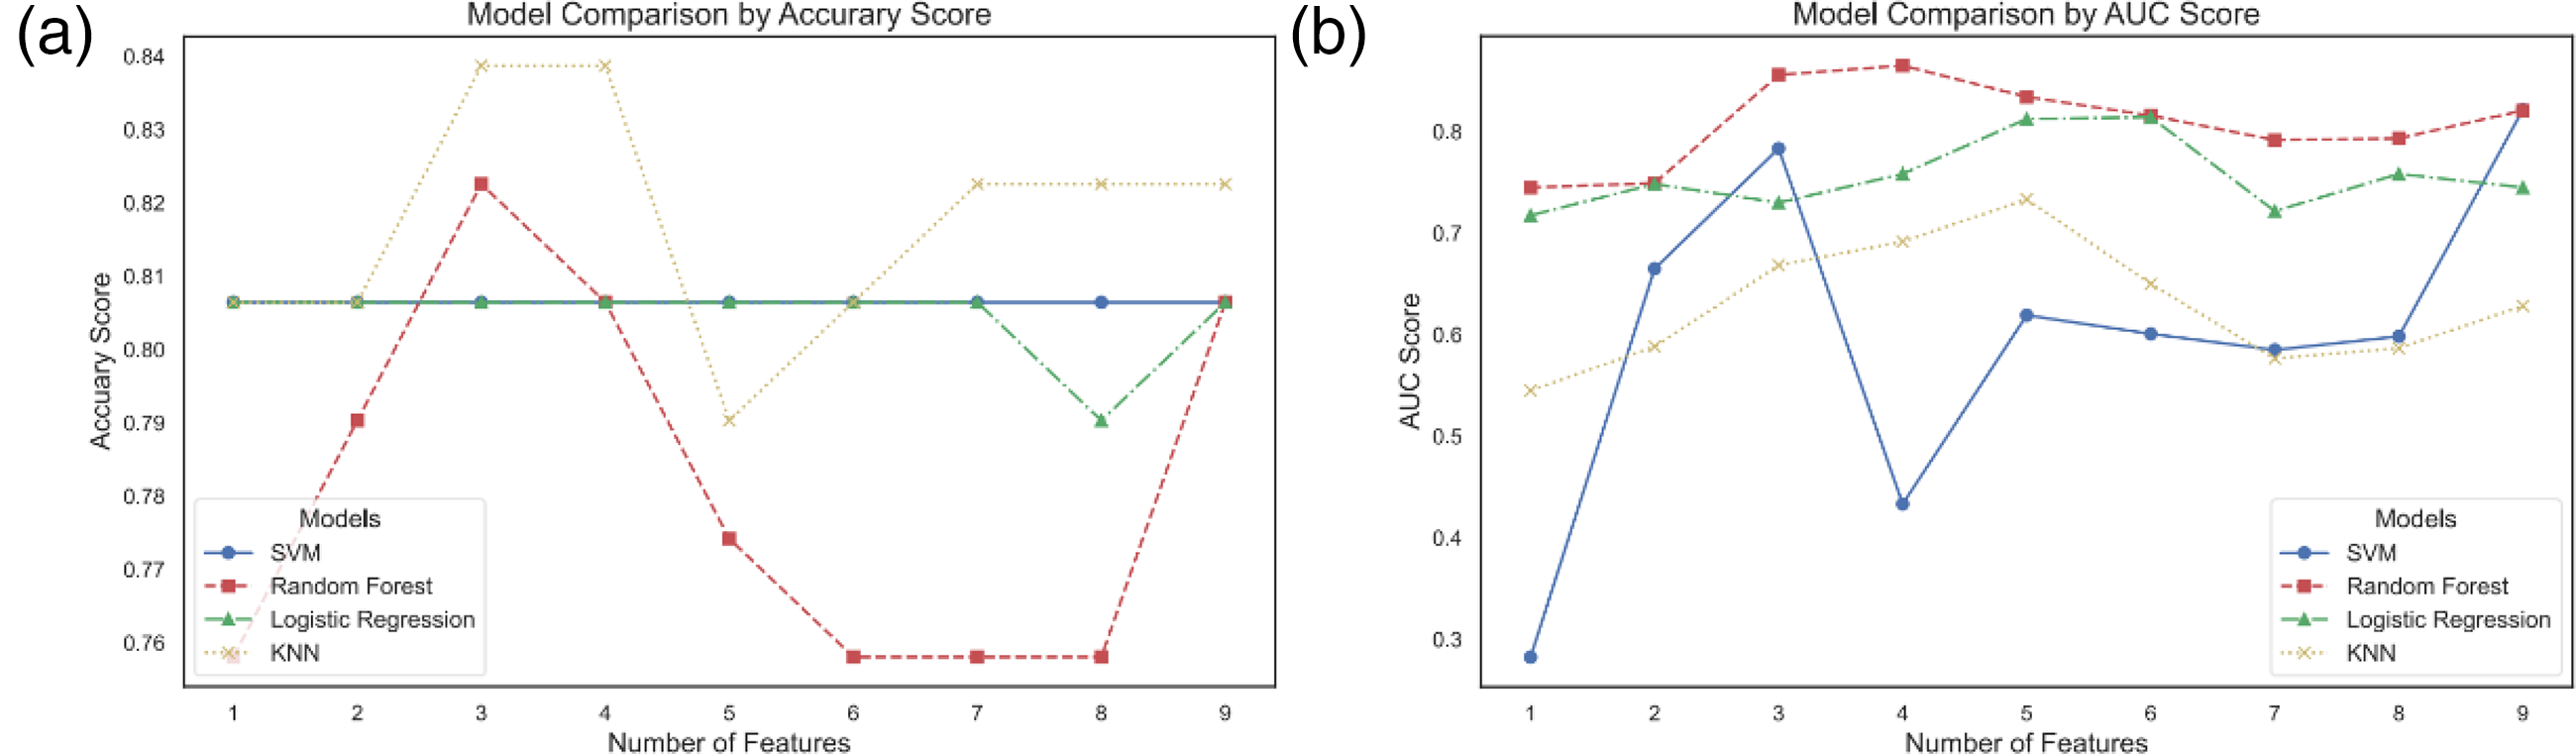
Ten genera were identified considering the higher BC parameters in the disease group than in the control group. (a) The optimal accuracies of the SVM, RF, LR, and KNN classifiers at varying genus population counts (K = 1, 2, 3…10). (b) The optimal AUC performances of the SVM, RF, LR, and KNN classifiers at varying genus population counts (K = 1, 2, 3…10).
Testing the predictive ability of core marker genera for nasal diseases
Using increased BC filtering, we identified Prevotellaceae Prevotella, Moraxella, and Rothia as key genera. We conducted classification tests on the LR, KNN, SVM, and RF models using both the training and test datasets, as shown in Figure 5. The results indicated that these three genera can serve as core genus biomarkers for nasal disease classification and prediction, enabling the RF and KNN models to achieve good performance.

The predictive ability of core marker genera for nasal diseases. (a) Box plot of the AUC scores for SVM, RF, LR, and KNN on the training set, validated through SKfold 10-fold cross-validation. Both the LR and RF models achieved AUC values greater than 0.76. (b) Box plot of the accuracy scores for SVM, RF, LR, and KNN on the training set, validated through SKfold 10-fold cross-validation. All the models achieved accuracy scores greater than 0.75. (c) ROC curves for the SVM, RF, LR, and KNN models based on the test set with an optimal parameter search. RF (AUC = 0.86) and KNN (AUC = 0.84) both achieved AUCs close to the optimal value (AUC = 0.88), with the 10 genera identified based on the increased betweenness centrality parameters in the disease group compared to the control group.
Discussion
In recent years, an increasing number of studies have shown that the nasal microbiome is involved in the occurrence and development of nasal diseases.6,9 In previous studies, the nasal microbiome has been used as a biomarker to establish diagnostic disease models. 6 However, the high abundance of single bacteria is not enough for disease diagnosis, and an excess of bacteria yields complex models, which are difficult to use in clinical applications. Therefore, identifying the core microbiota while maintaining the model’s classification capability has become a key research topic. In this study, we developed a graph theory-based learning framework for identifying keystone genera to predict nasal diseases. We identified keystone genera combinations for nasal diseases, represented by Moraxella, Prevotella, and Rothia, that show optimal potential for predicting nasal diseases.
In recent years, the role of local microorganisms in the occurrence and development of diseases has attracted extensive attention. In many processes, a key set of microbes may act as a “driver,” facilitating some changes and therefore becoming important factors in understanding the microbial basis of disease. Many studies have shown that the nasal flora of patients with nasal diseases differs from that of healthy people; thus, this flora may play a certain role in the occurrence and development of nasal diseases.6,9 In this study, based on the machine learning feature screening model of a graph network, a microbial association network was constructed to screen three kinds of characteristic bacteria closely related to nasal diseases. We found that these three bacterial genera were not highly abundant in the disease group. However, by constructing microbial association networks corresponding to each state, we determined that these genera held important “hub” roles in the microbial association network constructed by the disease group, suggesting that these three bacterial genera play important roles in the occurrence and development of nasal diseases.
Many studies have suggested that Moraxella plays an important role in a variety of airway diseases, such as asthma and pneumonia, and that the abundance of Moraxella is significantly correlated with the severity of the disease, suggesting that Moraxella is pivotal in the occurrence and development of inflammation in airway diseases.23–26 In addition, local concentrations of Prevotella and Rothia have been reported in various airway diseases.27–29
In contrast to the traditional method of identifying key bacterial genera through abundance changes, we constructed a disease status-related microbial network and purposefully screened the key bacterial genera in the “hub” to identify the bacteria whose abundance changes little under different disease states and the bacterial genera that play important connecting roles that may play key roles in the occurrence and development of diseases. In the future, we must further explore how these bacteria impact the development of nasal diseases.
Machine learning and deep learning methods for disease classification and microbiome analysis face challenges related to high-dimensional data and sample imbalance. In this study, traditional algorithms such as LR and SVM were found to be prone to overfitting in high-dimensional datasets. Particularly in the analysis of gene expression data, the limited number of samples (cases) compared with thousands of gene features hinders the ability of the model to learn generalizable patterns. The KNN algorithm, which relies on the distance between data points for classification, may struggle to accurately identify the nearest neighbors in high-dimensional structural spaces. Biomedical data often exhibit sample imbalance, where cases (positive samples) are far less numerous than control groups (negative samples). Traditional algorithms such as LR and SVM are not specifically designed to handle this imbalance, which may lead to bias toward the majority class and poor performance in predicting minority classes. RF, while relatively robust in handling high-dimensional data, faces limitations as the number of features increases, as the required number of trees increases, and the performance becomes constrained by high dimensionality. Although RF provides a certain degree of feature importance interpretation, interpretability remains a challenge when many features are considered. 30 Furthermore, in complex disease analysis, researchers often seek to understand which specific genes or variations are associated with disease risk, and traditional machine learning models may struggle to provide clear biological explanations.
In contrast, within the realms of bioinformatics and systems biology, the concept of graph theory is frequently employed to analyze the regulatory networks of genes or proteins. In this work, we integrated graph theory into the analysis of microbiome data, aiming to identify key bacterial taxa that play central connecting roles in the overall microbial community. We constructed intertaxa correlation networks on the basis of the relationships between various taxa within the healthy and diseased groups and subsequently analyzed the network structure. We computed common network structural parameters, with DW and BC serving as critical indicators of node importance in the structural network. These metrics have significant theoretical implications for understanding changes in network structure and the connectivity properties of nodes within the network. DW indicates the strength of a node's (in this case, a bacterial taxon within the microbiome) connections to a larger number of other nodes, placing it as a central connector within the overall microbial interaction network. A given taxon's strong relational ties with a larger array of taxa within the entire habitat indicate a strong role in mutual regulation, with highly weighted taxa serving as key control points within the microbial network. A high BC suggests that the node appears frequently in all shortest paths within the network, implying that a substantial amount of information passes through this node, thereby granting it greater control over the entire network. This role is akin to a “router” within the entire microbial habitat, and changes in this metric can reveal taxa with significant roles in maintaining network connectivity. These changes can profoundly impact the entire microbial network system.
Therefore, how can keystone genera be screened through the correlation connection network of the microbiome? According to the description of node importance in graph theory, a high connection attribute, especially a strong connection attribute with other nodes, is an important indicator for identifying core nodes. Moreover, the internode connection network is complex, and using the shortest path to evaluate the connection structure yields the highest efficiency and lowest cost. Therefore, the extensive connections of nodes in the network and the high efficiency of information transfer in the system structure are important indicators for measuring the core nodes from the aspects of network structure and function.
We screened the core nodes in the network by the above indicators. We then marked and distinguished the two networks. We further compressed the number and types of features and extracted the optimal core node set that can complete the network grouping; that is, we completely screened the microbiome set that can be used for normal and disease classification in the whole group of bacteria. We introduced machine learning algorithms to achieve this task.
The complexity of microbial interactions in an ecological community can best be characterized by using a network of graphs. The various components of this network constitute nodes representing resident microbial members of the community. By building a network of microbial associations corresponding to each state, we identified keystone genera associated with disease. Therefore, we hypothesized that, unlike the identification of abundant microbes, the identification of keystone genera based on network relationships would be an effective precision strategy for disease prediction. In this study, we further reduced the feature space by selecting genera on the basis of the abundance of nasal microbiome OTUs from data that had already been screened and denoised to eliminate statistically nonrepresentative bacterial groups. Considering the importance of individual bacteria and their structural role in the microcommunity network, we adopted a graph network dimensionality reduction method that incorporated BC and DW. This method effectively reflects the interactions and symbioses between flora. In the final stage of feature selection, we utilized the built-in feature importance measures of the RF model to rank features, identifying the variables that contributed most significantly to the classification task. The robustness of the results was validated by using the SVM, KNN, LR, and RF algorithms on the test set. Through this comprehensive method, Moraxella, Prevotella, and Rothia were identified as potential biological markers for nasal diseases. The results revealed that the prediction accuracy of the RF model for identifying bacterial flora labels was the highest, and the RF model achieved good prediction accuracy in both the internal and external validation sets. These findings illustrate an efficient feature selection and data mining strategy and have potential value for illuminating the microbiological basis of nasal diseases and developing new diagnostic tools.
In our study, several limitations need to be noted. First, our study was limited to single-omics data, while exploring the relationship between the flora and its influence on the host using multi-omics data can be a focus for future research. Second, in our study, we only included CRS and NIP, and further study wound include more types of nasal diseases. Third, this was a single-center study, which may limit the application of the microbiota-based diagnostic model. Multicenter studies including subjects from different regions of the world will be required to generalize these findings. Last, no sample size/power analysis was performed in this study, and further evaluation of sample size/power analysis is required in future studies.
Conclusions
In this study, by establishing a dataset of nasal flora from patients with nasal disease and healthy individuals, we propose that machine learning can be used to develop tests for presence of disease. Moreover, after conducting correlation analysis of the two groups of flora data, we constructed two groups of flora correlation network datasets. After analyzing the data using graph theory concepts, we screened the correlation graph theory parameters as the extraction method of the feature flora so that the feature screening in the subsequent machine learning process could be interpreted. Based on this method, we optimized the machine learning feature extraction method, selected the genera that exhibited the greatest change in network influence, and selected three bacteria, Moraxella, Prevotella, and Rothia, as the characteristic bacteria for nasal disease diagnosis. The classification results were good for data verification and were comparable to the classification results for the whole bacterial group. These findings suggest that our analytical method can be used for noninvasive analysis and prediction of nasal diseases and has broad application prospects for disease prevention and treatment. Moreover, this method can also be extended to the analysis and research of related diseases, providing practical and useful ideas for clinical data analysis.
Supplemental Material
sj-docx-1-sci-10.1177_00368504251320832 - Supplemental material for Predicting nasal diseases based on microbiota relationship network
Supplemental material, sj-docx-1-sci-10.1177_00368504251320832 for Predicting nasal diseases based on microbiota relationship network by Yibo Liang, Jie Mao, Tianlei Qiu, Binghua Li, Chenting Zhang, Kai Zhang, Zhe Sun and Guimin Zhang in Science Progress
Supplemental Material
sj-docx-2-sci-10.1177_00368504251320832 - Supplemental material for Predicting nasal diseases based on microbiota relationship network
Supplemental material, sj-docx-2-sci-10.1177_00368504251320832 for Predicting nasal diseases based on microbiota relationship network by Yibo Liang, Jie Mao, Tianlei Qiu, Binghua Li, Chenting Zhang, Kai Zhang, Zhe Sun and Guimin Zhang in Science Progress
Supplemental Material
sj-docx-3-sci-10.1177_00368504251320832 - Supplemental material for Predicting nasal diseases based on microbiota relationship network
Supplemental material, sj-docx-3-sci-10.1177_00368504251320832 for Predicting nasal diseases based on microbiota relationship network by Yibo Liang, Jie Mao, Tianlei Qiu, Binghua Li, Chenting Zhang, Kai Zhang, Zhe Sun and Guimin Zhang in Science Progress
Supplemental Material
sj-docx-4-sci-10.1177_00368504251320832 - Supplemental material for Predicting nasal diseases based on microbiota relationship network
Supplemental material, sj-docx-4-sci-10.1177_00368504251320832 for Predicting nasal diseases based on microbiota relationship network by Yibo Liang, Jie Mao, Tianlei Qiu, Binghua Li, Chenting Zhang, Kai Zhang, Zhe Sun and Guimin Zhang in Science Progress
Footnotes
Acknowledgements
The authors thank all the subjects who participated in this study.
Author contributions
YL, KZ, ZS, and GZ all developed the study concept and design. YL and CZ collected nasal samples. JM, TQ, and ZS guided statistical analysis and data analysis. YL, JM, and KZ verified the experimental design, visualized the experimental results, and critically reviewed the manuscript. YL, ZS, and KZ recruited patients and collected specimens, collected clinical metadata, interpreted the microbiome data, and were major contributors in writing the manuscript and reviewing it critically. The authors read and approved the final manuscript.
Availability of data and materials
We declare that the main data supporting the finding of this study were available within the paper and its Supplemental material. The clean reads were deposited in the National Center for Biotechnology Information (NCBI) Sequence Read Archive (SRA) database (accession numbers PRJNA1028156 and PRJNA1053666). To ensure the reproducibility of our research and facilitate academic exchange, all source code used in this study has been made publicly available at the following link: ![]() .
.
Declaration of conflicting interests
The authors declared no potential conflicts of interest with respect to the research, authorship, and/or publication of this article.
Funding
The authors disclosed receipt of the following financial support for the research, authorship, and/or publication of this article: The authors thank all the subjects who participated in this study. This work was supported by Tianjin Health Research Project (TJWJ2022XK020); National Natural Science Foundation of China (82401333); and Tianjin Natural Science Foundation (19JCYBJC27200; 24JCQNJC01170). This work was funded by Tianjin Key Medical Discipline Construction Project.
Ethical approval
This study was approved by the Ethics Research Committees of the Tianjin First Central Hospital (approval number 2021N037KY) in June 2021. This study was performed in accordance with the relevant guidelines and regulations.
Informed consent
Written informed consent was obtained from all participants.
Supplemental material
Supplemental material for this article is available online.
References
Supplementary Material
Please find the following supplemental material available below.
For Open Access articles published under a Creative Commons License, all supplemental material carries the same license as the article it is associated with.
For non-Open Access articles published, all supplemental material carries a non-exclusive license, and permission requests for re-use of supplemental material or any part of supplemental material shall be sent directly to the copyright owner as specified in the copyright notice associated with the article.