
Abstract
Objective
This study aims to identify the most suitable machine-learning model for early heart disease risk screening in diabetic populations.
Methods
This retrospective cohort study utilized data from the China Health and Retirement Longitudinal Study, with baseline data from 2011 and follow-up data from 2020. Using features selected by Least Absolute Shrinkage and Selection Operator (LASSO) regression, we systematically constructed 16 distinct machine-learning models. Model performance was evaluated using a comprehensive set of metrics, including the area under the receiver operating characteristic curve, F1-score, sensitivity, specificity, precision, accuracy, and balanced accuracy. To interpret the decision-making process of the best-performing model, we conducted Shapley additive explanations (SHAP) analysis.
Results
After the 9-year follow-up period concluding in 2020, 157 of the 819 patients with diabetes at baseline (2011) developed heart disease. From the available features, LASSO regression selected 19 core features for model construction. Among the models developed, the K-Nearest Neighbors (KNN) model demonstrated optimal performance across key metrics, achieving the highest F1 score, balanced accuracy, and precision. The SHAP analysis identified body mass index, systolic blood pressure, and waist circumference as the three most important predictive features within the diabetic cohort. The contribution patterns of these features in the KNN model align closely with clinical expertise, achieving a strong balance between predictive power and interpretability.
Conclusion
This study developed a machine-learning model to predict heart disease risk in patients with diabetes. Although the model exhibited only modest predictive performance, it provides a valuable empirical foundation and clear direction for constructing more reliable and clinically useful prediction tools in this field.
Introduction
Diabetes has become a major challenge in global public health, with its prevalence continuing to rise. In 2021, the number of people with diabetes worldwide reached 529 million, with an age-standardized total prevalence of 6.1%. 1 It is projected that by 2050, the number of patients will exceed 1.31 billion. 1 This increase is primarily driven by multiple factors such as global population aging, economic growth, rapid urbanization, and nutritional transitions in various countries. 2 Particularly in Asia, the rise in diabetes prevalence in China is significant, 3 where diabetes and its preconditions are widespread among adults aged 45 and above. 4
Diabetes is not merely a disease characterized by abnormal glucose metabolism but it also serves as a major contributor to various cardiovascular conditions, including diabetic cardiomyopathy, atherosclerosis, myocardial infarction, and heart failure. 5 In fact, cardiovascular diseases have become the leading cause of morbidity and mortality among diabetic patients. 6 The risk of major cardiovascular events in individuals with diabetes is twice as high as that in nondiabetic individuals of the same age and gender. 7 Among these cardiovascular complications, heart failure represents one of the most serious prognostic challenges associated with diabetes. The rising prevalence of diabetes, combined with an aging population, further intensifies the epidemic of diabetes-related heart failure. 8 There is a strong bidirectional relationship between diabetes and heart failure: diabetes increases the risk of developing heart failure by two- to fourfold, and the prognosis of heart failure patients with coexisting diabetes is significantly worse.9,10 Given the high disability rate and multiple complications linked to diabetes, developing effective preventive strategies is essential. 2 Importantly, diabetes is largely preventable, and early identification and intervention may even reverse the disease in some cases. 1 Therefore, exploring variations in risk factor profiles and diabetes burden across different populations is crucial for successfully managing diabetes risk factors within a complex and evolving set of drivers. 1
Currently, artificial intelligence and machine learning technologies are revolutionizing the medical field by providing data-driven personalized solutions for managing diabetes and its cardiovascular risks. 11 However, research on long-term heart disease risk prediction for diabetic patients remains relatively scarce, particularly in the development of machine learning models tailored to this population. This gap underscores an urgent need for in-depth exploration. Therefore, constructing a predictive model for heart disease risk in diabetic individuals is of great significance, as it can enable early and accurate identification of high-risk patients, thereby providing a solid basis for implementing personalized interventions and improving patient outcomes. This study aims to offer scientific insights for selecting the optimal model for early screening of heart disease risk in diabetic populations.
Materials and methods
Data source
This was a retrospective cohort study. The data for this study were derived from the China Health and Retirement Longitudinal Study (CHARLS), a high-quality longitudinal cohort study targeting the Chinese population. The baseline data were from 2011, and the follow-up data were from 2020. This study was conducted in strict accordance with the ethical principles set forth in the Declaration of Helsinki, as revised in 2024. As part of this commitment, all personally identifiable information of patients was removed to protect participant confidentiality. The reporting of this study follows the Strengthening the Reporting of Observational Studies in Epidemiology guidelines. 12
The inclusion criteria for the study subjects were: (1) fasting state in 2011; (2) no history of heart disease in 2011; (3) fasting blood glucose ≥126 mg/dL. The exclusion criteria were defined correspondingly: (1) nonfasting state or missing related data in 2011; (2) a history of heart disease or missing such data in 2011; (3) fasting blood glucose <126 mg/dL or missing data in 2011, which directly contrasts with the third inclusion criterion; (4) missing data on heart disease status at the 2020 follow-up. The flowchart depicting the results of the eligibility assessment is shown in Figure 1.

Flowchart of participant eligibility assessment.
In this study, participants with a fasting blood glucose value ≥126 mg/dL in 2011 were defined as having diabetes. Concurrently, within the CHARLS cohort, the occurrence of heart disease was determined through self-reporting, based on the question: “Has a doctor ever diagnosed you with heart disease, angina, coronary heart disease, heart failure, or other heart problems?” Participants who answered “yes” to this question were accordingly classified as having heart disease.
Variable selection
This study analyzed variables collected at baseline, which were categorized into two major groups. Demographic and anthropometric variables included gender, age, systolic blood pressure, diastolic blood pressure, pulse, waist circumference, height, and weight. Blood test indicators comprised white blood cell count (WBC), platelets, hemoglobin (HGB), hematocrit (HCT), blood urea nitrogen (BUN), creatinine (CREA), uric acid (UA), blood glucose (GLU), total cholesterol (CHOL), triglycerides (TG), high-density lipoprotein cholesterol (HDL), low-density lipoprotein cholesterol (LDL), and C-reactive protein (CRP).
Data cleaning
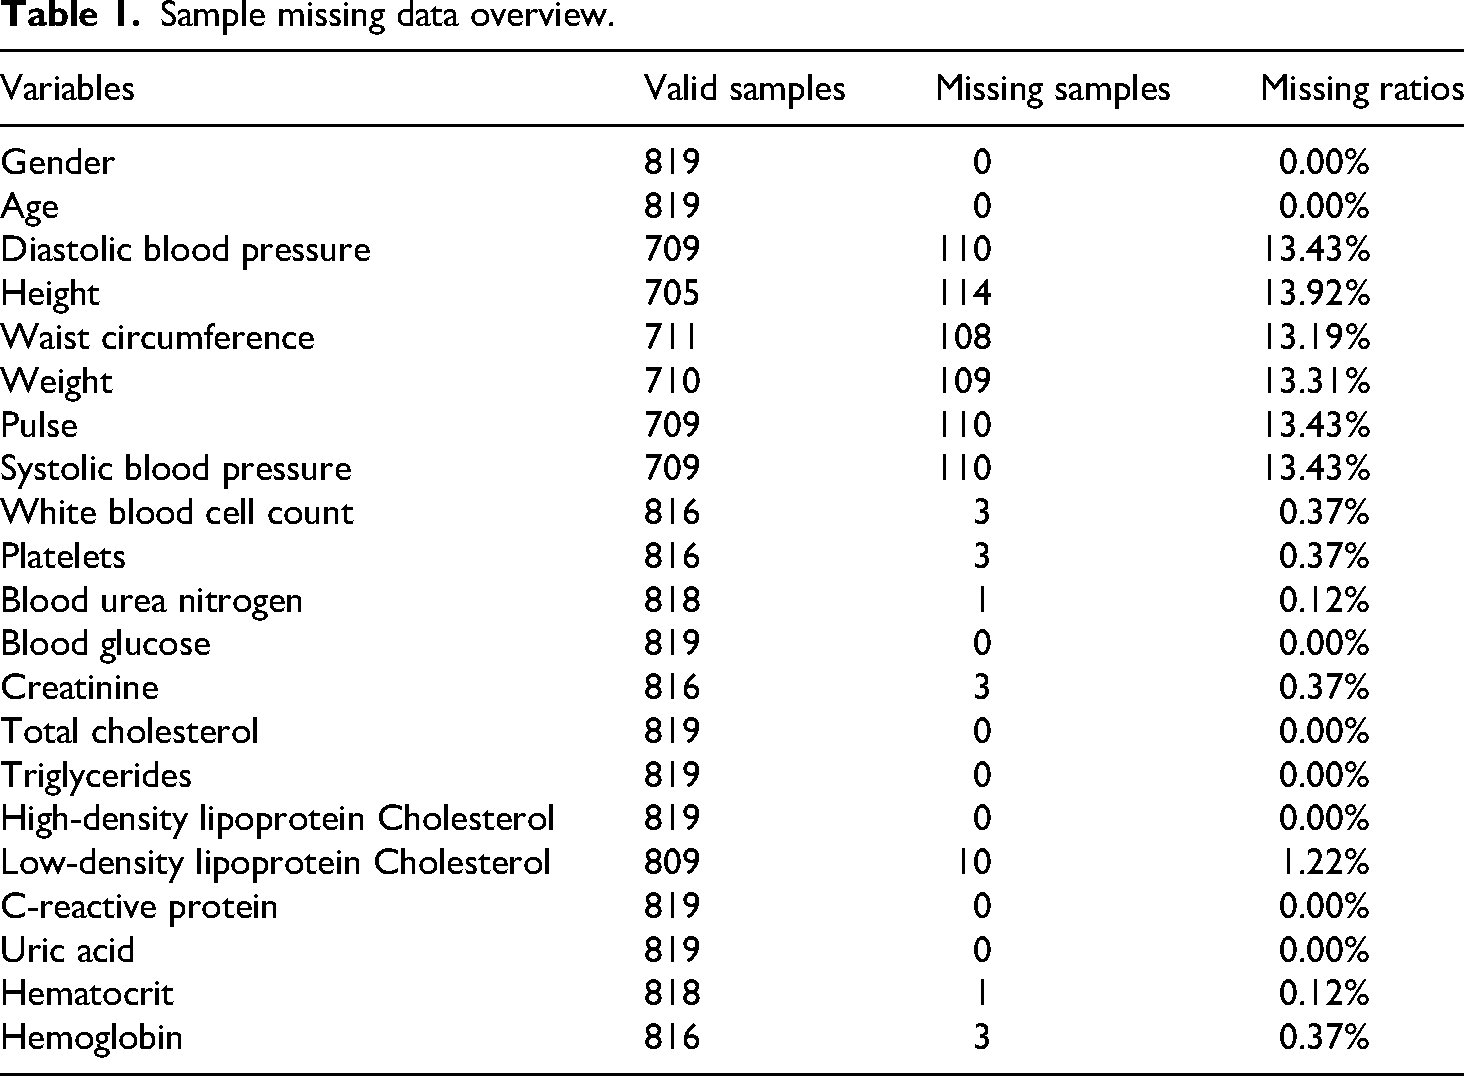
The missing rate for each variable was first calculated, as shown in Table 1. To handle these missing values, a random forest-based nonparametric imputation algorithm was applied (missForest package). The performance of this imputation model was internally validated using the Out-of-Bag error; specifically, the Normalized Root Mean Square Error was used for numeric variables and the Proportion of False Classifications for categorical variables. Prior to imputation, Winsorization was employed on continuous variables to mitigate the influence of extreme outliers. Finally, body mass index (BMI) was calculated from the imputed height and weight data, after which the original height and weight variables were removed from the dataset to prevent multicollinearity in subsequent analyses.
Sample missing data overview.
Dataset partitioning and standardization
The complete, preprocessed dataset was partitioned using a stratified random sampling approach, allocating 70% of the data to a training set and 30% to a test set. To ensure comparability, all numeric variables subsequently underwent Z-score standardization. The success of the partitioning in creating comparable groups was evaluated by comparing baseline characteristics between the training and test sets. Continuous variables were analyzed using Student's t-test or the Wilcoxon rank-sum test, while categorical variables were analyzed using the chi-square test or Fisher's exact test, as appropriate.
Feature selection
A Least Absolute Shrinkage and Selection Operator (LASSO) regression model was constructed on the training set. The optimal regularization parameter (λ) was identified through tenfold cross-validation, and features with non-zero regression coefficients at this optimal lambda.min value were selected. Subsequently, multicollinearity among these selected features was evaluated using the variance inflation factor (VIF).
Machine-learning model construction
Using the feature subset identified by LASSO, 16 distinct machine-learning models were systematically constructed with the caret package. The models included: Logistic Regression, Elastic Net, Linear Discriminant Analysis, Quadratic Discriminant Analysis, Random Forest, Gradient Boosting Machine (GBM), XGBoost, LightGBM, AdaBoost, C5.0 Decision Tree, Bagged CART, Support Vector Machine with radial basis kernel (SVM Radial), K-Nearest Neighbors (KNN), Neural Network (average), Multi-Layer Perceptron (MLP), and Naive Bayes. All models were trained and their hyperparameters were tuned using repeated fivefold cross-validation (with 5 repeats) combined with a grid search. To address class imbalance in the training set, a class-weighting strategy—inversely proportional to class frequency—was implemented to increase the penalty for misclassifying the minority class.
Model performance assessment and validation
The performance of all trained models was evaluated on the independent test set. Prior to this evaluation, an optimal probability cutoff threshold for each model was determined on the training set by maximizing the F1-Score, thereby converting predicted probabilities into binary classifications. A comprehensive set of metrics was then employed for assessment, including the area under the receiver operating characteristic curve (ROC-AUC), F1-Score, sensitivity, specificity, precision, accuracy, and balanced accuracy. To ensure robust estimation, point estimates for all performance metrics, along with their 95% confidence intervals (CIs), were calculated using the bias-corrected and accelerated bootstrap method.
Model interpretability analysis
To elucidate the decision-making process of the best-performing model, a Shapley additive explanations (SHAP) analysis was conducted. This interpretability framework provides in-depth explanations by quantifying the contribution of each feature to individual predictions (local interpretability) and across the entire dataset (global interpretability).
Statistical methods
All statistical analyses and model construction procedures were performed using R software (version 4.4.1). Unless otherwise specified, all statistical tests were two-sided, and a p-value of less than 0.05 was defined as the threshold for statistical significance.
Results
Baseline characteristics of study participants
After a 9-year follow-up period concluding in 2020, 157 of the 819 patients with diabetes at baseline (2011) developed heart disease. A comparison of baseline characteristics between the heart disease group and the nonheart disease group is detailed in Table 2. The results indicated significant differences between the two groups for several variables, including gender, age, waist circumference, systolic blood pressure, platelets, BUN, blood glucose, UA, and BMI. These findings suggest that these factors are associated with the subsequent development of heart disease in this cohort.
Comparison of baseline characteristics.

Feature selection results
The LASSO regression analysis selected 19 core features for subsequent modeling: TG, CHOL, LDL, waist circumference, BMI, HDL, HGB, HCT, UA, CREA, gender, BUN, systolic blood pressure, age, CRP, WBC, platelets, GLU, and pulse. Multicollinearity assessment confirmed that the VIF for all selected features was below the common threshold of 10, indicating no significant multicollinearity concerns. These 19 features were therefore retained for the construction and evaluation of all machine learning models.
Performance validation of machine learning models
The optimal hyperparameter configurations for the sixteen machine learning models are provided in Supplemental Table 1. All models were evaluated using a comprehensive set of performance metrics, including ROC-AUC, F1-Score, sensitivity, specificity, precision, accuracy, and balanced accuracy. A heatmap visualizing these performance metrics across all datasets is presented in Figure 2, and a comprehensive performance comparison is shown in Figure 3. The 95% CIs for the test set performance metrics are presented in Table 3.The performance of the KNN model on the independent test set was as follows: ROC-AUC (95% CI) = 0.613 (0.505–0.707), balanced accuracy (95% CI) = 0.606 (0.524–0.686), accuracy (95% CI) = 0.678 (0.596–0.722), F1-score (95% CI) = 0.368 (0.255–0.476), sensitivity (95% CI) = 0.489 (0.354–0.667), specificity (95% CI) = 0.722 (0.648–0.772), and precision (95% CI) = 0.295 (0.189–0.400).
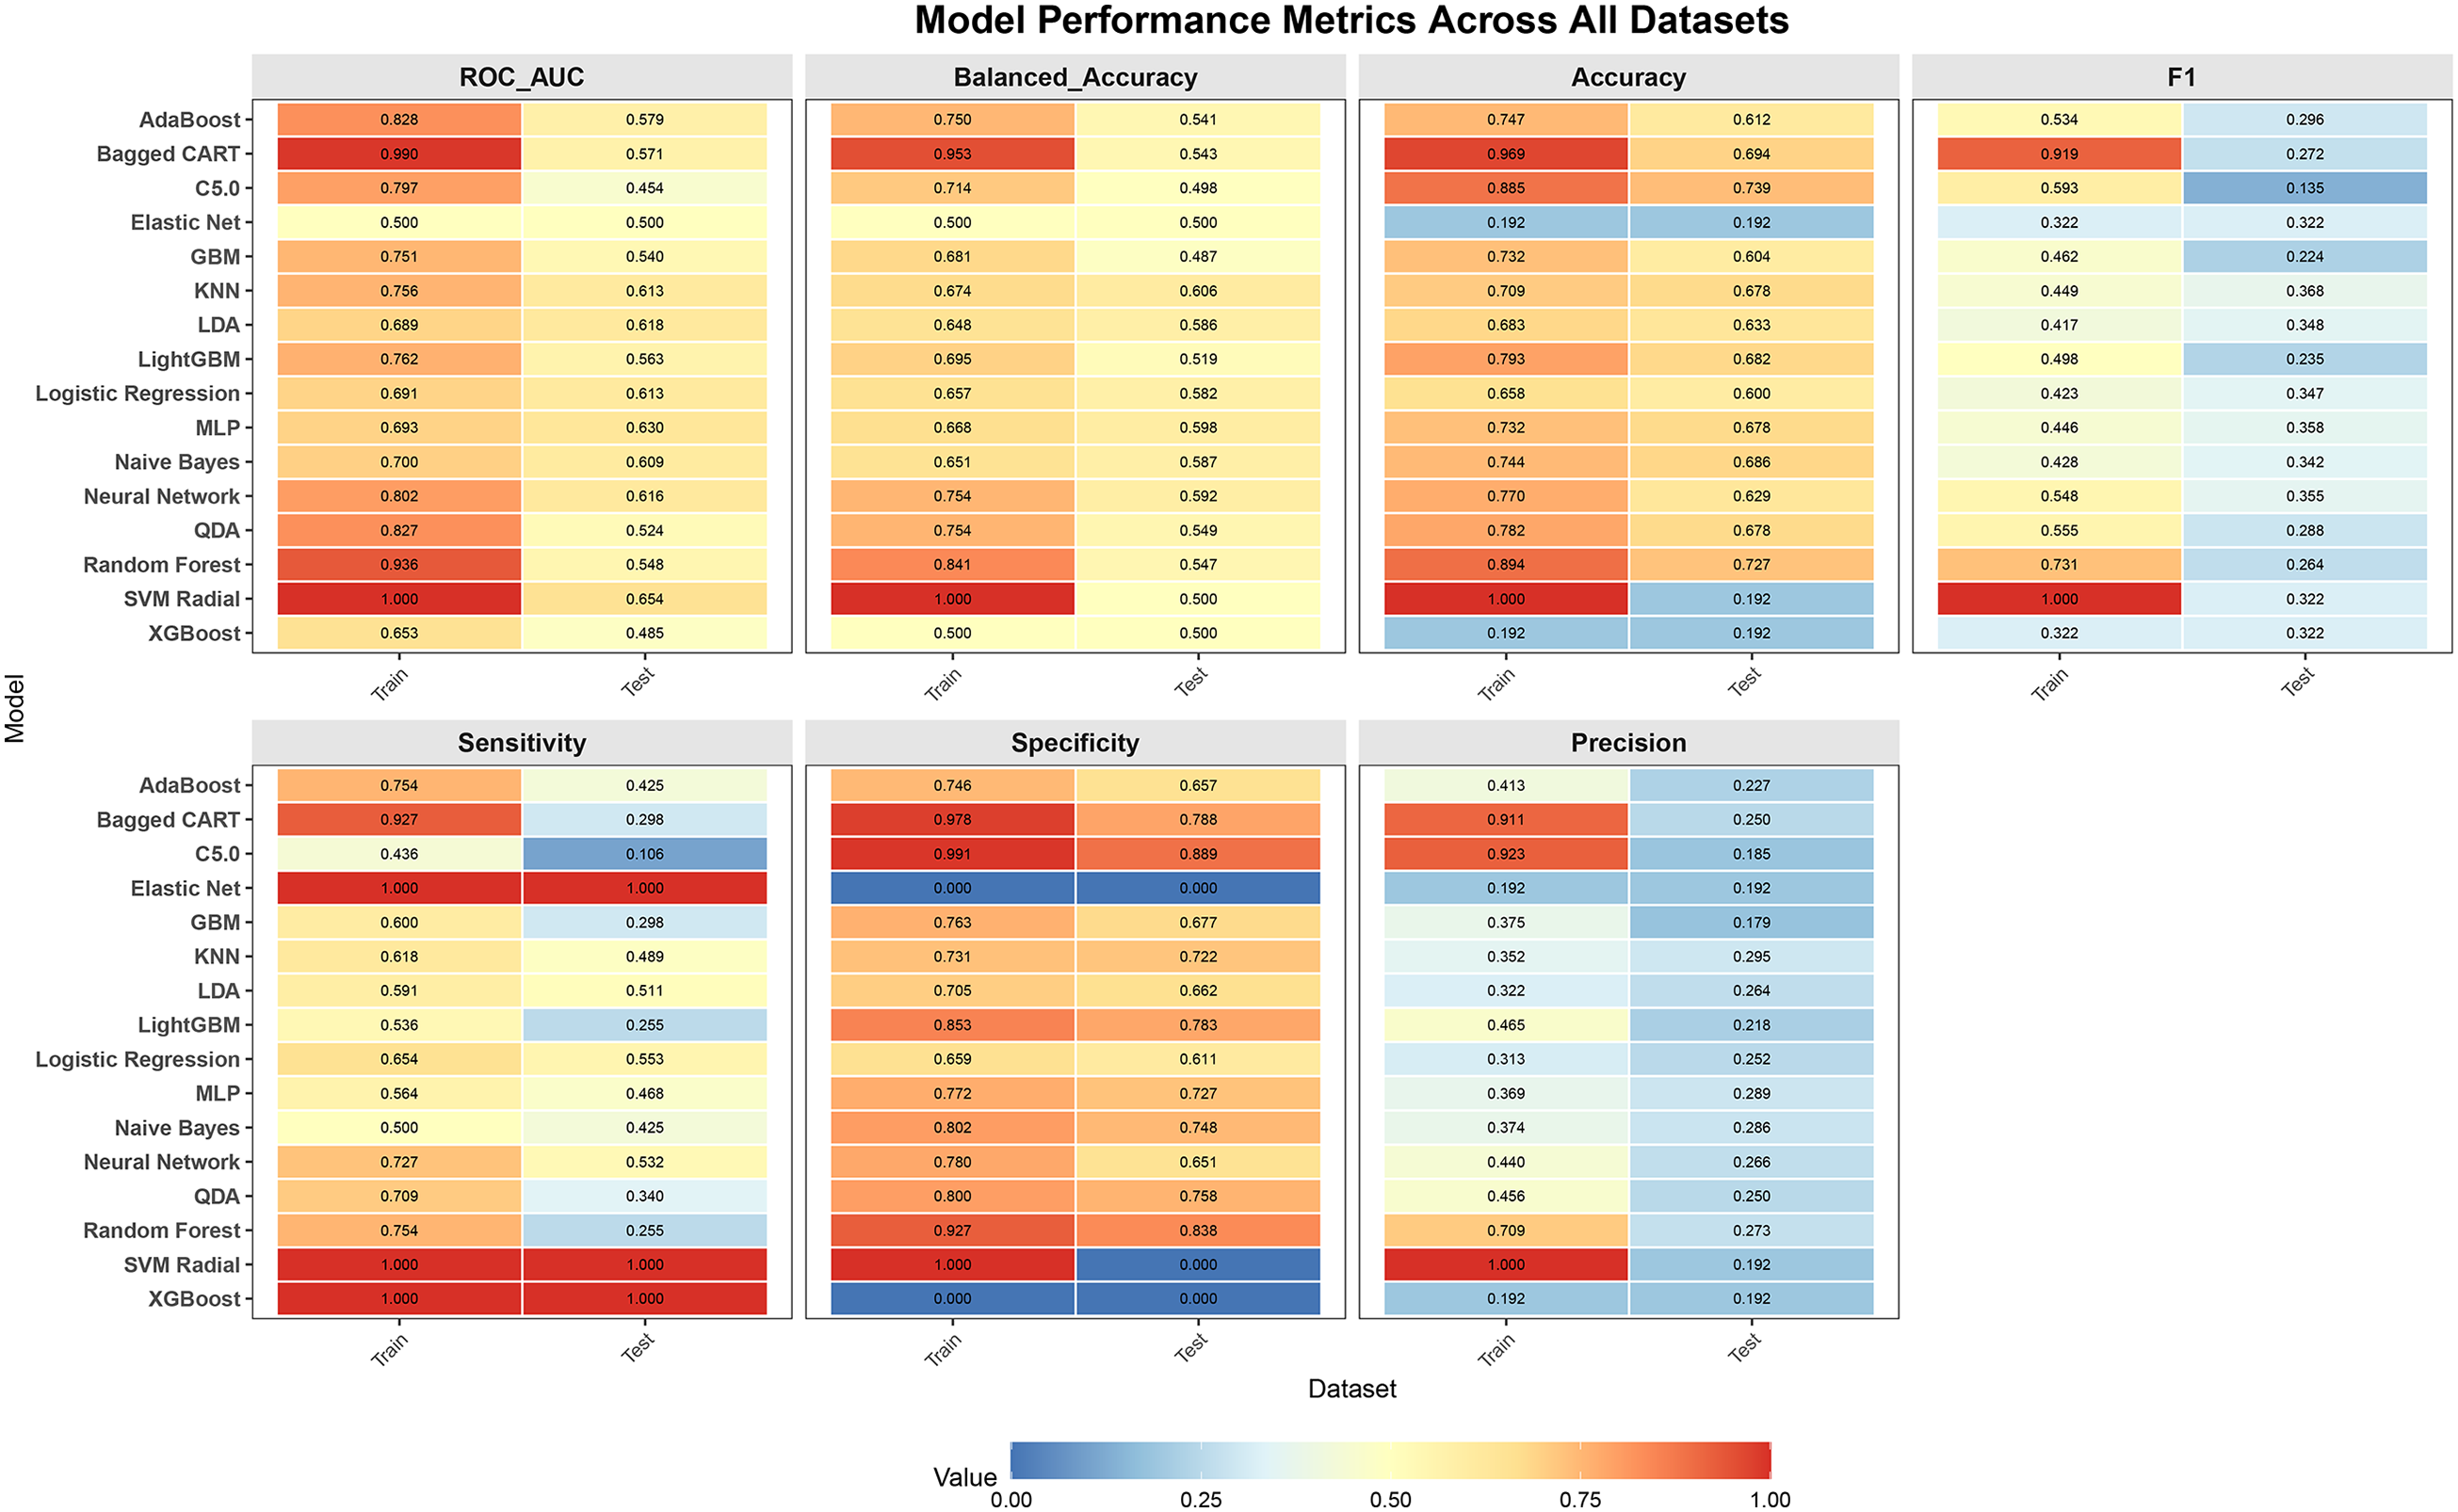
Performance metrics of the 16 machine-learning models evaluated. C5.0, C5.0 Decision Tree; GBM, Gradient Boosting Machine; KNN, K-Nearest Neighbors; LDA, Linear Discriminant Analysis; MLP, Multi-Layer Perceptron; QDA, Quadratic Discriminant Analysis; SVM Radial, Support Vector Machine with radial basis kernel.

Comprehensive performance comparison. C5.0, C5.0 Decision Tree; GBM, Gradient Boosting Machine; KNN, K-Nearest Neighbors; LDA, Linear Discriminant Analysis; MLP, Multi-Layer Perceptron; QDA, Quadratic Discriminant Analysis; SVM Radial, Support Vector Machine with radial basis kernel.
Performance of 16 machine learning models in the test set.

Shapley additive explanation interpretability analysis
To interpret the predictions of the KNN model, the SHAP framework was applied. The analysis identified BMI, systolic blood pressure, and waist circumference as the three most important predictive features, as shown in Figure 4. This ranking is visualized in the SHAP summary plot (Figure 5), where features are ordered by importance on the Y-axis and the corresponding SHAP values on the X-axis represent their impact on the model's output. The plot demonstrates that higher values of BMI, systolic blood pressure, and waist circumference are associated with increased SHAP values, meaning they significantly elevate the model's predicted probability of heart disease. The SHAP dependence plots for the top three most important features (Figure 6) reveal consistent positive trends in their contributions to the model's prediction beyond specific thresholds. Once BMI exceeds 25 kg/m², its influence turns positive and increases with further elevation. Similarly, systolic blood pressure exerts a consistently positive effect after surpassing 125 mmHg. Waist circumference also demonstrates an almost linear upward trend, generating a systematically positive contribution once it exceeds 90 cm.

Feature importance ranking based on SHAP analysis. BMI, body mass index; CREA, creatinine; BUN, blood urea nitrogen; WBC, white blood cell count; UA, uric acid; CRP, C-reactive protein; CHOL, total cholesterol; HCT, hematocrit; HDL, high-density lipoprotein cholesterol; TG, triglycerides; HGB, hemoglobin; LDL, low-density lipoprotein cholesterol; SHAP, Shapley additive explanation.

Shapley additive explanation (SHAP) summary plot. BMI, body mass index; CREA, creatinine; BUN, blood urea nitrogen; WBC, white blood cell count; UA, uric acid; CRP, C-reactive protein; CHOL, total cholesterol; HCT, hematocrit; HDL, high-density lipoprotein cholesterol; TG, triglycerides; HGB, hemoglobin; LDL, low-density lipoprotein cholesterol.

Shapley additive explanation (SHAP) dependence plots for the top three predictive features: (A) BMI, (B) systolic blood pressure, and (C) waist circumference. BMI, body mass index.
The KNN model demonstrates optimal performance across key metrics, including F1 score, balanced accuracy, and precision. Moreover, SHAP analysis confirms that its feature contribution patterns align closely with clinical expertise, achieving a strong balance between predictive power and interpretability. Therefore, the KNN model stands out as the best candidate for further application.
Discussion
In recent years, machine-learning models have been widely applied to heart-disease prediction. For example, several studies have utilized the diabetes complications screening research initiative (DiScRi) dataset to build models for predicting the co-occurrence of diabetes and cardiovascular disease 13 ; another proposed an artificial intelligence model to assess coronary heart disease risk specifically in patients with type 2 diabetes. 14 Additionally, an XGBoost model was constructed and validated for its predictive value in elderly patients with both diabetes and coronary heart disease, 15 while other researchers used U.S. National Health and Nutrition Examination Survey data to build models for cardiovascular risk prediction in individuals with type 2 diabetes. 16 Although these models have demonstrated relatively good performance, they all rely on cross-sectional data, where exposure factors and outcomes were collected simultaneously. This design lacks long-term follow-up, consequently limiting their ability to predict long-term heart-disease risk—a pronounced limitation. In contrast, some studies based on the CHARLS cohort have employed machine learning to effectively identify heart-disease risk among elderly hypertensive patients. 17 Further research utilizing CHARLS follow-up data has analyzed the 9-year incidence of cardiovascular disease among middle-aged and older adults in China and constructed corresponding prediction models. 18 These studies benefit from long-term follow-up information but do not specifically target populations with diabetes.
This study aims to develop a machine-learning model that utilizes baseline characteristics to predict the long-term risk of heart disease in a diabetic population. The distinctive feature of this research, compared with the aforementioned studies, is its specific focus on patients with diabetes and its use of follow-up data spanning up to 9 years, thereby providing evidence for early risk identification. Furthermore, the study is designed to be cost-effective, as it relies on easily obtainable, objective, and reliable measures—including routine variables and hematological indicators—while avoiding potential biases associated with subjective data such as self-reports.
During the study, of the 16 machine-learning prediction models built upon 19 variables selected by the LASSO method, the KNN model demonstrated the best performance. The SHAP analysis identified BMI, systolic blood pressure, and waist circumference as the three most important predictive features. The SHAP dependence plots revealed that all three features were positively associated with SHAP values, indicating that higher BMI, elevated systolic blood pressure, and larger waist circumference all correspond to increased heart-disease risk—a finding fully consistent with established clinical knowledge.
This alignment is well-supported by existing literature. Previous studies have shown that obesity in early adulthood significantly increases cardiovascular disease risk, 19 while elevated systolic blood pressure variability is associated with higher cardiovascular risk.20,21 Interventions targeting hypertension may mitigate the coronary heart disease risk associated with high BMI, 22 and maintaining systolic blood pressure below 130 mmHg can substantially reduce the risk of major cardiovascular events and all-cause mortality. 23 Furthermore, central obesity has been positively correlated with cardiovascular disease events, 24 with waist circumference serving as a cardiovascular risk marker independent of BMI 25 —a relationship confirmed across multiple studies. 26 In diabetic populations, where cardiovascular risk factors such as obesity, hypertension, and dyslipidemia frequently coexist, 6 these associations become particularly relevant. Blood pressure changes represent a shared risk factor for both diabetes and cardiovascular disease, 13 while hypertension significantly influences diabetes prevalence. 3 Therefore, the positive association between these anthropometric and hemodynamic measures and heart disease risk in diabetic patients underscores the clinical importance of early intervention and ongoing management of these modifiable risk factors.
This study has many limitations. Firstly, we strictly adopted “fasting blood glucose ≥126 mg/dL” as the sole criterion for defining diabetes, whereas other studies often employ additional methods.18,27 We acknowledge that this approach may lead to an underestimation of the overall diabetes prevalence. However, this trade-off was necessary to prioritize definitional purity for the purpose of this study. The decision to rely on a single biomarker, rather than integrating multiple indicators as is common in other studies, was primarily driven by the need to adhere to international authoritative guidelines from the World Health Organization and American Diabetes Association, thereby maximizing diagnostic accuracy and ensuring the international comparability of our findings. This approach also safeguards objectivity and comparability, as the use of a standardized fasting blood glucose test effectively avoids the subjective influences—such as recall bias and diagnostic variation—inherent in self-reported data, ensuring all cases are identified by a single, objective criterion. Furthermore, this specific definition enables a precise focus on undiagnosed diabetes, allowing for the accurate identification of cases not yet clinically diagnosed, which constitutes a central aim of this research. Secondly, this study could not distinguish between type 1 and type 2 diabetes. This limitation stems from the absence of key clinical indicators in the CHARLS database, such as islet autoantibodies and C-peptide levels, which are necessary for a definitive differentiation. However, given that the study participants were a community-based population aged 45 years and above—a demographic in which type 2 diabetes constitutes the vast majority—this lack of classification is expected to have a limited impact on the overall results. Nevertheless, the distinct pathophysiological mechanisms of the two diabetes types remain a consideration that should be acknowledged when interpreting the study's findings. Thirdly, the assessment of heart disease events in this study relied on participants’ self-report of a prior physician diagnosis within the CHARLS cohort. While this method is operationally feasible and commonly employed in large epidemiological studies,18,28 it is subject to several important limitations. Self-reported data are susceptible to recall bias, as participants may inaccurately report their disease history due to memory lapses or misunderstandings of complex medical terminology. Furthermore, the broad diagnostic category of “heart disease” amalgamates several heterogeneous conditions—including angina, heart failure, and coronary heart disease—which differ substantially in their severity, diagnostic criteria, and clinical implications. The inability to distinguish between these specific cardiovascular outcomes in our analysis may thus introduce heterogeneity into the results. An additional constraint is that this approach cannot identify cases of heart disease that remain undiagnosed in the community, potentially leading to an underestimation of the true prevalence. Despite these limitations, the use of physician-based self-report remains a practical necessity for large-scale cohort studies like CHARLS, as it provides a standardized ascertainment method that balances feasibility with a degree of clinical validity, largely avoiding mere subjective speculation. Fourth, we acknowledge the limitations of the feature-selection method employed in this study. During the feature-selection stage, we utilized LASSO regression. While this method offers efficiency and stability for high-dimensional data reduction and handles multicollinearity well, it is based on a linear assumption and may therefore fail to fully capture complex nonlinear relationships between predictors and the outcome. Given these considerations, we applied LASSO as a preliminary screening tool. To evaluate the appropriateness of this choice, we conducted a sensitivity analysis using a wrapper-style cumulative-feature approach, progressively adding features based on importance ranking from the optimal KNN model and computing the corresponding cumulative ROC-AUC. The results demonstrated that the feature subset selected by LASSO was highly consistent with that obtained from the wrapper method (Supplemental Figures 1 and 2). This indicates that, despite its theoretical limitations, LASSO provided a robust and effective feature subset within the specific data context of this study, supporting its reasonableness for dimensionality reduction. Nevertheless, future work could adopt more sophisticated nonlinear feature-selection techniques to further optimize the model. Fifth, the predictive power of the model is limited. Although the KNN model was identified as the best-performing model in this study, its key performance indicators remain modest. Specifically, the ROC-AUC value—the core evaluation metric—was only 0.613, reflecting a relatively limited overall predictive ability. This performance constraint likely stems from a combination of factors related to data and methodology, rather than any single cause. One contributing factor is the sample size limitation, as this study was based on the CHARLS database and included 819 patients, among whom only 157 experienced a positive heart disease event. The relatively small sample size, particularly of positive cases, restricts the ability of machine-learning algorithms to fully leverage their potential with high-dimensional data. A second interrelated issue is the significant class imbalance problem. In the 9-year follow-up data, the ratio of positive to negative cases was less than 1:4, and this imbalance was even more pronounced in the 2-year follow-up data where only 33 of 1001 diabetic patients developed heart disease. Although we applied class weighting inversely proportional to class frequency and conducted an exhaustive search of classification thresholds from 0.01 to 0.99 to maximize the F1 score, the underlying data distribution imbalance persisted, constraining further improvement in model performance. Challenges inherent to long-term follow-up also present a complex set of constraints. As with most longitudinal studies, this research is subject to selection bias since the cohort consisted of individuals with no baseline heart disease in 2011, elevated fasting glucose (≥126 mg/dL), and completed endpoint follow-up in 2020. The exclusion of individuals lost to follow-up may have introduced this selection bias and potentially led to an underestimation of heart disease incidence. Consequently, the findings primarily apply to this specific subpopulation—those without baseline heart disease, with elevated fasting glucose, and who completed long-term follow-up. Furthermore, over such an extended period, numerous unmeasured confounders such as lifestyle changes, treatment adjustments, or other complications could influence outcomes. The presence of these complex factors inherently increases prediction difficulty and inevitably affects model accuracy. Another consideration is the potential for threshold-selection overfitting. Although optimizing the F1-score in small, imbalanced datasets may yield unstable thresholds, 29 this approach demonstrated satisfactory applicability in our empirical analysis. We systematically compared multiple threshold-determination strategies, including the default 0.5 cutoff, Youden's index, and a high-sensitivity guarantee (Supplemental Table 2). We found that models preselected by these methods, such as MLP or SVM Radial, consistently exhibited notable drawbacks. Some showed conspicuous overfitting on the training set, while others produced SHAP-based feature-importance rankings that sharply contradicted established clinical knowledge, thereby undermining their clinical credibility. In contrast, the KNN model, whose threshold was set by F1-maximisation, not only ranked first on key metrics such as F1-score, balanced accuracy, and precision but also yielded a SHAP-derived feature-contribution pattern that aligned closely with clinical experience. This approach unified predictive performance with interpretability. As the harmonic mean of precision and recall, F1-maximization intrinsically seeks a clinically acceptable compromise between detecting target cases, which requires high recall, and controlling false alarms, which requires high precision. This makes it especially suitable for imbalanced scenarios like ours, where the costs of both types of error must be weighed. Taken together, through comprehensive performance comparisons and interpretability verification, we conclude that, within the present study context, adopting the F1-maximization strategy and selecting the KNN model represents a methodologically prudent and clinically logical decision. Sixth, the study lacks external validation: while internal validation was performed, the model has not yet been evaluated in an independent cohort or broader population. This limitation affects the generalizability and robustness of the findings. Consequently, future research should prioritize obtaining larger, multicenter samples to verify the model's effectiveness and pursue prospective independent validation.
In summary, this study developed a machine-learning model to predict heart disease risk in patients with diabetes. Although the model exhibited only modest predictive performance, it provides a valuable empirical foundation and clear direction for constructing more reliable and clinically useful prediction tools in this field.
Supplemental Material
sj-pdf-1-sci-10.1177_00368504261424391 - Supplemental material for A study on the risk prediction of heart disease in diabetes patients based on machine learning
Supplemental material, sj-pdf-1-sci-10.1177_00368504261424391 for A study on the risk prediction of heart disease in diabetes patients based on machine learning by Tinghua Zhang and Huan Liu in Science Progress
Supplemental Material
sj-pdf-2-sci-10.1177_00368504261424391 - Supplemental material for A study on the risk prediction of heart disease in diabetes patients based on machine learning
Supplemental material, sj-pdf-2-sci-10.1177_00368504261424391 for A study on the risk prediction of heart disease in diabetes patients based on machine learning by Tinghua Zhang and Huan Liu in Science Progress
Supplemental Material
sj-docx-3-sci-10.1177_00368504261424391 - Supplemental material for A study on the risk prediction of heart disease in diabetes patients based on machine learning
Supplemental material, sj-docx-3-sci-10.1177_00368504261424391 for A study on the risk prediction of heart disease in diabetes patients based on machine learning by Tinghua Zhang and Huan Liu in Science Progress
Supplemental Material
sj-docx-4-sci-10.1177_00368504261424391 - Supplemental material for A study on the risk prediction of heart disease in diabetes patients based on machine learning
Supplemental material, sj-docx-4-sci-10.1177_00368504261424391 for A study on the risk prediction of heart disease in diabetes patients based on machine learning by Tinghua Zhang and Huan Liu in Science Progress
Footnotes
Acknowledgements
The authors have reviewed and edited the content as needed and take full responsibility for the content of the publication. The authors acknowledge the use of an AI language model (DeepSeek V3.2-Exp) to assist in improving the English language and clarity of the manuscript during the writing process.
Ethics approval and consent to participate
The study was approved by the Biomedical Ethics Committee of Peking University (Approval No: IRB00001052-11015; IRB00001052-11014) and strictly adhered to the ethical principles outlined in the Declaration of Helsinki. All participants provided written informed consent, ensuring the ethical compliance of the data collection process and the protection of participants’ rights. Therefore, the Ethics Committee of the Central Hospital of Huaihua City exempted this study from ethical review. The data used in this study came from the CHARLS database between 2011 and 2020.
Author contributions
Conceptualization: Tinghua Zhang and Huan Liu; Methodology: Tinghua Zhang; Formal analysis and investigation: Tinghua Zhang; Writing—original draft, review, and editing: Tinghua Zhang and Huan Liu.
Funding
The author(s) received no financial support for the research, authorship, and/or publication of this article.
Declaration of conflicting interests
The author(s) declared no potential conflicts of interest with respect to the research, authorship, and/or publication of this article.
Data availability statement
Clinical trial number
This study was completed based on the publicly available longitudinal survey database, the CHARLS, and is not a clinical trial, therefore, no clinical trial registration number was obtained.
Supplemental material
Supplemental material for this article is available online.
References
Supplementary Material
Please find the following supplemental material available below.
For Open Access articles published under a Creative Commons License, all supplemental material carries the same license as the article it is associated with.
For non-Open Access articles published, all supplemental material carries a non-exclusive license, and permission requests for re-use of supplemental material or any part of supplemental material shall be sent directly to the copyright owner as specified in the copyright notice associated with the article.