
Abstract
With substantial progress in advanced manufacturing, industries now require effective means to detect, classify, and determine the topological parameters of micro-features imprinted on workpieces at the micro-scale. In this study, a novel piezo texture device was developed to generate micro-textures using vibrations. The tool comprises of an ultrasonic concentrator that amplifies vibrations, piezo-actuated sensors that convert electrical energy into microscale vibrations, and the corresponding electronic components needed to generate the required signal. The primary objective was to perform micro-texturing through turning with a device that creates vibrations using this setup. Micro-textures, often referred to as dimples, were successfully imprinted onto surfaces. Since it is impossible to check the micro-textures using traditional quality control techniques, artificial intelligence offers a powerful alternative by enabling real-time monitoring and defect detection based on pattern recognition. Indeed, Convolutional Neural Networks (CNNs), specifically GoogleNet and ResNet-50, were employed for dimple classification and further analysis, such as evaluating the similarity ratio of dimples on a workpiece.
1. Literature review
1.1. Piezo texturing
A significant proportion of mechanical failures, estimated between 60 and 80 percent, can be attributed to friction and wear. 1 Manufacturing companies have consistently made efforts to address this issue by adopting improved materials and lubricants. Nonetheless, one of the most effective approaches to influence the manufacturing process and reduce friction is through surface texture. Surface texturing has been shown to mitigate friction and wear by increasing dynamic pressure, retaining lubricants, and supporting the development of protective films. This technique is now utilized across a wide range of industries and engineering applications. For example, in biomedical applications, surface textures are employed to minimize friction between components, particularly in joint prosthetics and implants. 2 In manufacturing, applying textures on tools can significantly extend tool life, reduce wear, and improve cutting efficiency. Within the automotive sector, surface texturing plays a key role in enhancing lubricant retention, which is essential for tribological performance, especially in engines, transmissions, and braking systems. 3
The literature describes a range of designs that employ both vibration modes in turning operations, which are classified as either resonant or non-resonant. Early research focused primarily on the use of piezoelectric materials to generate vibrations, along with mechanical systems designed to amplify the relatively low displacement output of piezoelectric actuators. 4 On the other hand, other studies have proposed systems for monitoring vibration amplitude in real time. This is typically achieved by interpreting voltage signals from a strain gauge, with further surface inspection carried out through scanning electron microscopy (SEM). 5 While these approaches improved understanding of vibration behavior and surface formation mechanisms, texture evaluation remained largely qualitative and dependent on traditional inspection methods.
To address these limitations, research on vibration-assisted machining provided insights into controlled tool–workpiece interactions and laid the groundwork for more precise surface texturing techniques. Vibration-assisted surface texturing originates from early research on vibration-assisted and ultrasonic cutting, in which controlled mechanical oscillations were superimposed onto conventional machining processes to modify tool–workpiece interactions. It was first demonstrated that ultrasonic vibration applied in the cutting direction produces intermittent cutting conditions, resulting in significant reductions in cutting forces, improved chip breakability, and enhanced surface finish. 6
Building on these foundational observations, vibration-assisted machining was systematically investigated across a broader range of frequencies and vibration modes. A comprehensive synthesis of these developments was provided, explaining the underlying mechanisms of vibration-assisted machining, including periodic tool disengagement, reduced friction, and improved thermal conditions, while also highlighting the potential for surface modification through controlled vibration. 7
Further advancements focused specifically on ultrasonic vibration-assisted machining and demonstrated its effectiveness in machining hard and brittle materials, as well as its influence on surface integrity and micro-scale surface features. 8
Building on these findings, vibrations were subsequently introduced into conventional turning processes to actively modify surface characteristics and improve workpiece performance. The resulting surface modifications and microstructures depend on both the direction of the tool movement and the orientation of the applied vibration. The concept of “vibro-impact cutting” was previously applied to optical slugs, where the introduction of vibrations along with the condition of periodic separation was shown to contribute to reduced surface roughness and improved machining conditions. 9 Over time, many studies have integrated texturing tools into turning processes to generate surface microstructures that support lubrication and reduce friction. These studies have employed a wide range of experimental configurations, tools, materials, and approaches. Another study investigated the machining of aluminum alloy AA2017 in the cutting, feed, and radial directions. Distinct microstructures were observed in each direction: rectangular patterns in the cutting direction, dimples in the radial direction, and sinusoidal ridges in the feed direction. Each of these patterns offered specific functional advantages. The process also led to a reduction in average cutting force, which contributed to longer tool life and an improved surface finish. While that work focused on machining in different directions, it lacked an in-depth analysis of the textures produced in the radial direction, especially in terms of dimple shapes, repeatability, and how different parameters influence the formation of optimal textures. 10
The influence of these vibrations on residual stress and void formation in the three directions was also studied. A notable outcome was the significant reduction of voids in the radial direction, which was associated with increased compressive residual stresses. However, the focus remained on surface roughness values and general morphology rather than specific microtextural patterns. 11 Another study examined radial high-speed ultrasonic vibration cutting (R-HUVC) of hardened steel under intermittent cutting conditions, where the cutting depth was less than twice the vibration amplitude. The findings revealed that increasing the depth of cut and the feed rate resulted in higher cutting forces, which can accelerate tool wear. However, increasing the cutting speed initially caused a rise in force, followed by a decrease likely due to heat softening the material and making it easier to cut. Moreover, additional studies are necessary to evaluate machining performance with respect to surface integrity. The adoption of diamond tools has also been suggested to further expand these applications into ultra-precision machining. 12
Additional experiments involved continuous turning of copper 1100 using diamond tool inserts, where the effects of clearance angle and nose radius on the geometry of the resulting dimples were investigated. 13 While some studies suggest that larger circular micro-textures provide certain advantages, Wang et al. reported that smaller elliptical textures, produced at lower spindle speeds, allowed for higher texture density, which enhanced coating adhesion. As a result, Si-P substrates exhibited thicker coatings, better wettability, fewer cracks, and increased bending strength. 14 While they examined the effects of changing parameters and crack formation, this work, in addition to the previously mentioned studies, did not incorporate software tools or neural networks to assess and classify the quality of textures or to demonstrate their uniformity.
Kinematic relations were established between the cutting parameters and dimple geometries based on their theoretical models without considering the complexity of elastoplastic deformations of each material. The width, length, and spacing of dimples, as well as their phase shift, depend on input parameters such as speed, feed, depth of cut, workpiece diameter, tool properties, frequency, and amplitude. Understanding the effects of these parameters enables their manipulation to achieve the desired micro-textures. 15
In this work, these parameters were adjusted using the equations designed to generate ideal textures with uniform and repeatable shapes. Figure 1. Shows the dimples’ arrangement and geometry where “w” is the dimple’s width, “l” is its length, “d” is the distance between each dimple vertically, “S” is the spacing between each dimple horizontally, and “δ” is the phase shift. Micro-textures geometry.
The cutting speed is given by:

The distance “d” between adjacent dimples, also equal to their length “l”, is:

The dimple width “w” depends on the tool nose radius “Rc” and vibration amplitude “A”:

The development of a specialized tool was required to generate micro-textures on the surface of a workpiece through the application of controlled vibrations during lathe machining. The tool was designed, and the vibration parameters were adjusted to effectively achieve the formation of micro-textures on the workpiece surface.
1.2. Convolutional neural networks
To enhance the detection of generated micro-textures, the transition toward a “Smart Factory” becomes essential in order to streamline traditional quality control methods and integrate Artificial Intelligence (AI). By incorporating AI and the Internet of Things (IoT), improvements in performance, production efficiency, and mechanical system longevity can be achieved. AI enables predictive maintenance, real-time monitoring, and adaptive inference, thereby providing the adaptability and accuracy needed to address limitations associated with conventional monitoring techniques.16,17
The semiconductor manufacturing process presents challenges due to the time-dependent nature of its parameters. Identifying wafer defects with high precision has been approached using various machine learning methods. Among these, Long Short-Term Memory (LSTM), a form of recurrent neural network that selectively retains relevant information over time, has proven effective for modeling time-series data. It has been compared with standard convolutional neural networks (CNNs) and ResNet. While LSTM struggled with encoding long-term sequences, CNNs suffered from vanishing gradients. ResNet, on the other hand, achieved superior performance with the highest fault detection accuracy, reaching approximately 97%. 18 In a related study, several deep learning architectures such as VGGNet, ResNet, DenseNet, and GoogleNet were trained to assess electric wire quality by classifying four types of defects. DenseNet yielded the best performance, followed by GoogleNet. The effectiveness of all pre-trained networks improved through the extraction of the region of interest (ROI) using image processing techniques. 19
Another experiment focused on detecting sandblasting defects in investment casting using CNNs. Models such as AlexNet, VGG-16, GoogleNet, and ResNet-34 were utilized, with an emphasis on varying the image pixel size and mini-batch size during training to develop fast and flexible computational models. 20
In the present study, two CNN architectures, GoogleNet and ResNet-50, are trained to classify surfaces with different micro-textures, produced by the piezo texturing device, that can be used for real-time monitoring of the manufacturing process. Given their previously demonstrated accuracy and robustness in defect detection, these models are selected for this research.
Convolutional Neural Networks (CNNs) belong to the family of deep learning algorithms. They are particularly known for their ability to classify images based on dominant features and for their adaptive learning of spatial characteristics from input images. The primary layers that form the structure of CNNs include the following: - Convolutional Layers function by sliding a kernel with trainable weights across the image. At each position, an element-wise matrix multiplication is performed between the filter and the corresponding pixel values. The resulting values for each feature are summed and stored in a feature map. High output values indicate that a strong feature has been detected, while low values suggest that the feature is either weak or not present. - Rectified Linear Unit (ReLU) functions improve the network’s capacity to learn complex patterns by replacing all negative values in the feature map with zero. This step helps the network focus on the most significant features and plays a role in reducing the risk of overfitting. - Pooling Layers serve to reduce the dimensionality of the feature maps. By downscaling the data, they retain the most critical information while lowering computational demands. This also helps maintain key features and provides regularization against overfitting. - Softmax Layers are responsible for assigning a probability distribution over the output categories. Based on the input image, each category is given a probability score, and the one with the highest score is selected as the final classification.
21
1.2.1. GoogleNet
GoogleNet is a deep convolutional neural network that was first introduced by Google in 2014. It is widely recognized for its inception module, which allows the network to process features at multiple scales by combining convolutional layers of different kernel sizes (1×1, 3×3, and 5×5) along with pooling layers, all operating in parallel. Comprising a total of 22 layers, GoogleNet enhances computational efficiency by using 1×1 convolutions. These layers help optimize performance while significantly reducing the number of parameters. In comparison to AlexNet and other custom CNN architectures, GoogleNet has shown superior accuracy, reaching 0.95 for grayscale images and 0.96 for RGB images. 22
Figure 2 shows its architecture known for these inception layers. GoogleNet architecture.
The most distinctive equation that depicts the multi-branch architecture that processes different filter sizes in parallel and concatenates them is reflected through this symbolic equation:

1.2.2. ResNet-50
ResNet represents a distinct type of convolutional neural network that is well known for addressing the problem of vanishing gradients, a common issue in other deep networks. Gradients are values used to update the network’s weights during training. In order to adjust these weights, the error is propagated backward from the output layer through the preceding layers. When the gradients become too small, earlier layers receive minimal updates, which slows learning significantly or halts it altogether. This challenge becomes particularly critical in networks with a large number of layers, as gradients continue to diminish while passing through each layer. To resolve this issue, ResNet introduces a variable referred to as ‘x’, which acts as a shortcut connection to bypass the weight layers and ensure that essential gradient information is preserved. 23
For training, ResNet-50 was selected due to its balanced depth. This choice was based on understanding the relationship between training errors and test errors. Training errors occur within the dataset used for learning, whereas test errors reflect the model’s performance on new, unseen data. Ideally, both types of errors should be close in value. If they are not, the model may be overfitting. Although increasing the number of layers can lead to higher error rates, deeper architectures also allow for improved feature extraction and more accurate image analysis. ResNet-50, with its moderate depth, offers an effective trade-off by reducing error while maintaining high-quality feature detection. Figure 3 illustrates the ResNet architecture and highlights the presence of the bypass connection. ResNet architecture.
The following equation illustrates the most distinct feature of ResNet-50, namely the residual connection, which enables the gradients to flow more easily during training to guarantee deeper networks:

2. Experimental setup
2.1. Ultrasonic horn & transducer design
The designed piezoelectric device aims to generate micro-dimples on metallic surfaces through high-frequency mechanical vibrations. To achieve this function, the device employs piezo-actuated sensors that convert electrical signals into mechanical vibrations. A horn is integrated into the system to transmit these vibrations effectively from the piezo-actuated sensors to the tool tip and ultimately to the workpiece surface. The horn functions as a mechanical amplifier, concentrating and directing the ultrasonic vibrations toward the cutting interface. Achieving efficient vibration amplification largely depends on the horn’s geometry, which is commonly cylindrical, conical, exponential, and stepped profiles. Each design provides distinct advantages in terms of amplitude amplification, stress distribution, and frequency response.
A comparative study was conducted to evaluate the vibrational behavior of four horn geometries—cylindrical, conical, exponential, and stepped—through displacement tests with results indicating that the step-horn exhibited the highest theoretical displacement among all profiles. 24 However, experimental testing revealed discrepancies, as the stepped horn underperformed relative to expectations. The cylindrical horn produced the lowest displacement in both theoretical and experimental analyses. The conical and exponential horns yielded similar results and demonstrated superior overall performance. Based on these findings, the exponential horn geometry was selected for this study, and all related calculations were performed using this profile.
To achieve a magnification factor of two at the horn tip, the diameter at the narrow end must be half of the diameter at the end coupled with the piezo-actuated sensors, as defined by the following relation:

To determine the appropriate resonant length of the ultrasonic horn, several key parameters must be considered. The horn length

The wavelength

The speed of sound

Using the material properties of Aluminum 6061, these key parameters were used to determine corresponding horn length.
These calculations serve as the foundational design parameters for tuning the system to operate at resonance at its intended ultrasonic frequency. Figure 4 presents the sketch of the exponential curve used to manufacture the horn. The exponential curve of the horn.
2.2. Tool tip properties and material
The tool tip plays a critical role in transferring ultrasonic vibrations and enabling precise micro-feature generation. In this study, a single diamond tool was employed owing to its exceptional hardness, high wear resistance, and favorable acoustic properties. The ultra-high stiffness of diamond allows accurate transmission of high-frequency vibrations with minimal deformation, while its durability ensures extended tool life under continuous ultrasonic loading. These attributes render diamond highly suitable for micro-machining applications that demand extreme precision and consistency.
2.3. Amplifier & signal generator
To operate the piezoelectric actuator, a signal generator and a high-voltage power amplifier were utilized. An HDG3000B-series arbitrary waveform generator was selected for this purpose. It supports frequencies ranging from 1 μHz to 100 MHz, offers a 250 MSa/s sampling rate with 16-bit vertical resolution, and provides dual independent programmable channels. The generator can deliver various waveform outputs with amplitudes up to 200 mV peak-to-peak.
The generated signal was then directed to a PZD350A high-voltage amplifier. This amplifier has a fixed voltage gain of 100 and can supply bipolar outputs up to ±350 V peak or unipolar outputs up to ±700 V peak. These values are maintained across the appropriate bandwidth required for capacitive piezoelectric loads. Throughout the experiments, an oscilloscope was used to continuously monitor both the input and the amplified output signals to verify signal integrity and ensure stable operation. The electrical components can be seen in Figure 5. Electrical components connections: 1) Signal generator, 2) Power amplifier, 3) Oscilloscope, and 4) Piezoelectric device.
2.4. Frequency range & voltage values
By using the previously described signal generator and power amplifier, it became possible to precisely control both the frequency range and voltage levels. These parameters were monitored with the Hantek DSO2000 Series Digital Storage Oscilloscope, which offers a typical bandwidth of up to 150 MHz, a sampling rate of 1 GSa/s, and multiple input channels to enable accurate signal analysis. The amplifier RMS was 350 V. Reaching such high voltages, particularly during the positive cycle, was necessary to achieve a higher vibration amplitude. This level of amplitude ensures that the tool’s vibrations remain strong and are not suppressed by the cutting forces encountered during the turning operation. As a result, the tool can effectively imprint micro-textures onto the surface of the workpiece. Regarding frequency, both sonic and ultrasonic ranges were examined. The most consistent and well-formed dimples, when matched with the selected spindle speed, were obtained at a frequency of 10 kHz. This frequency was therefore selected and fixed for the experimental phase.
2.5. Electrical connection & lathe integration
The electrical system, in combination with the piezoelectric device, was integrated into a CNC lathe setup with careful attention to both performance and safety. The amplified output from the power amplifier was transmitted to the piezoelectric actuator through shielded cables, which served to prevent signal degradation and protect against electromagnetic interference from surrounding equipment. The piezoelectric device was installed in place of the standard cutting tool on the lathe’s tool post, enabling direct interaction with the rotating workpiece.
From a mechanical standpoint, the piezoelectric tool was mounted horizontally on the lathe using a rigid steel holder specifically designed to reduce vibration loss and maintain precise alignment of the tool. This horizontal configuration allowed the axial vibrations—generated by the piezo-actuated sensors and transmitted through the exponential horn—to be applied perpendicularly to the surface of the rotating workpiece. Directing the vibration horizontally was essential to ensure that each impact of the tool tip produced a well-defined micro-dimple on the surface. The custom holder not only offered structural stability under high frequency oscillations but also preserved the consistency of the vibration direction throughout the machining process, which was vital for achieving uniform surface patterning. Figure 6 shows the device integrated within the lathe along with its cutting direction. Device integration within the lathe.
2.6. Camera system
To capture the textures formed at the micro-scale, specialized imaging systems were necessary. A MER2-630-60U3C VA Imaging camera was employed, offering a frame rate of 60 frames per second and a resolution of 3088 by 2064 pixels. The camera was paired with an LCM Macro Lens that provides a 12-megapixel resolution and a distortion level of less than 0.7 percent. To achieve the required focal length, appropriate C-mount extension rings were used. Additionally, ring lights were integrated into the setup to enhance the visibility and clarity of the micro-textures during observation.
3. Experimentation
Figure 7 represents the workflow of the process described in detail in this section, starting from parameter setup to similarity ratio evaluation. To ensure controlled workpiece texturing, the workflow begins with the careful selection of electrical and machining parameters to induce stable and controlled vibrational responses. The textured surfaces are then captured through optical micrographs, which serve as inputs to the CNN for classification of the dimples as either ideal or defective. Subsequently, a similarity ratio is computed from the extracted feature vectors to evaluate conformity and geometric consistency. The closed-loop control system illustrated in Figure 7 represents ongoing work, aiming to provide real-time feedback that enables dynamic adjustment of process parameters. In parallel, a higher-performance workstation is being integrated to support faster processing and real-time implementation. Process workflow.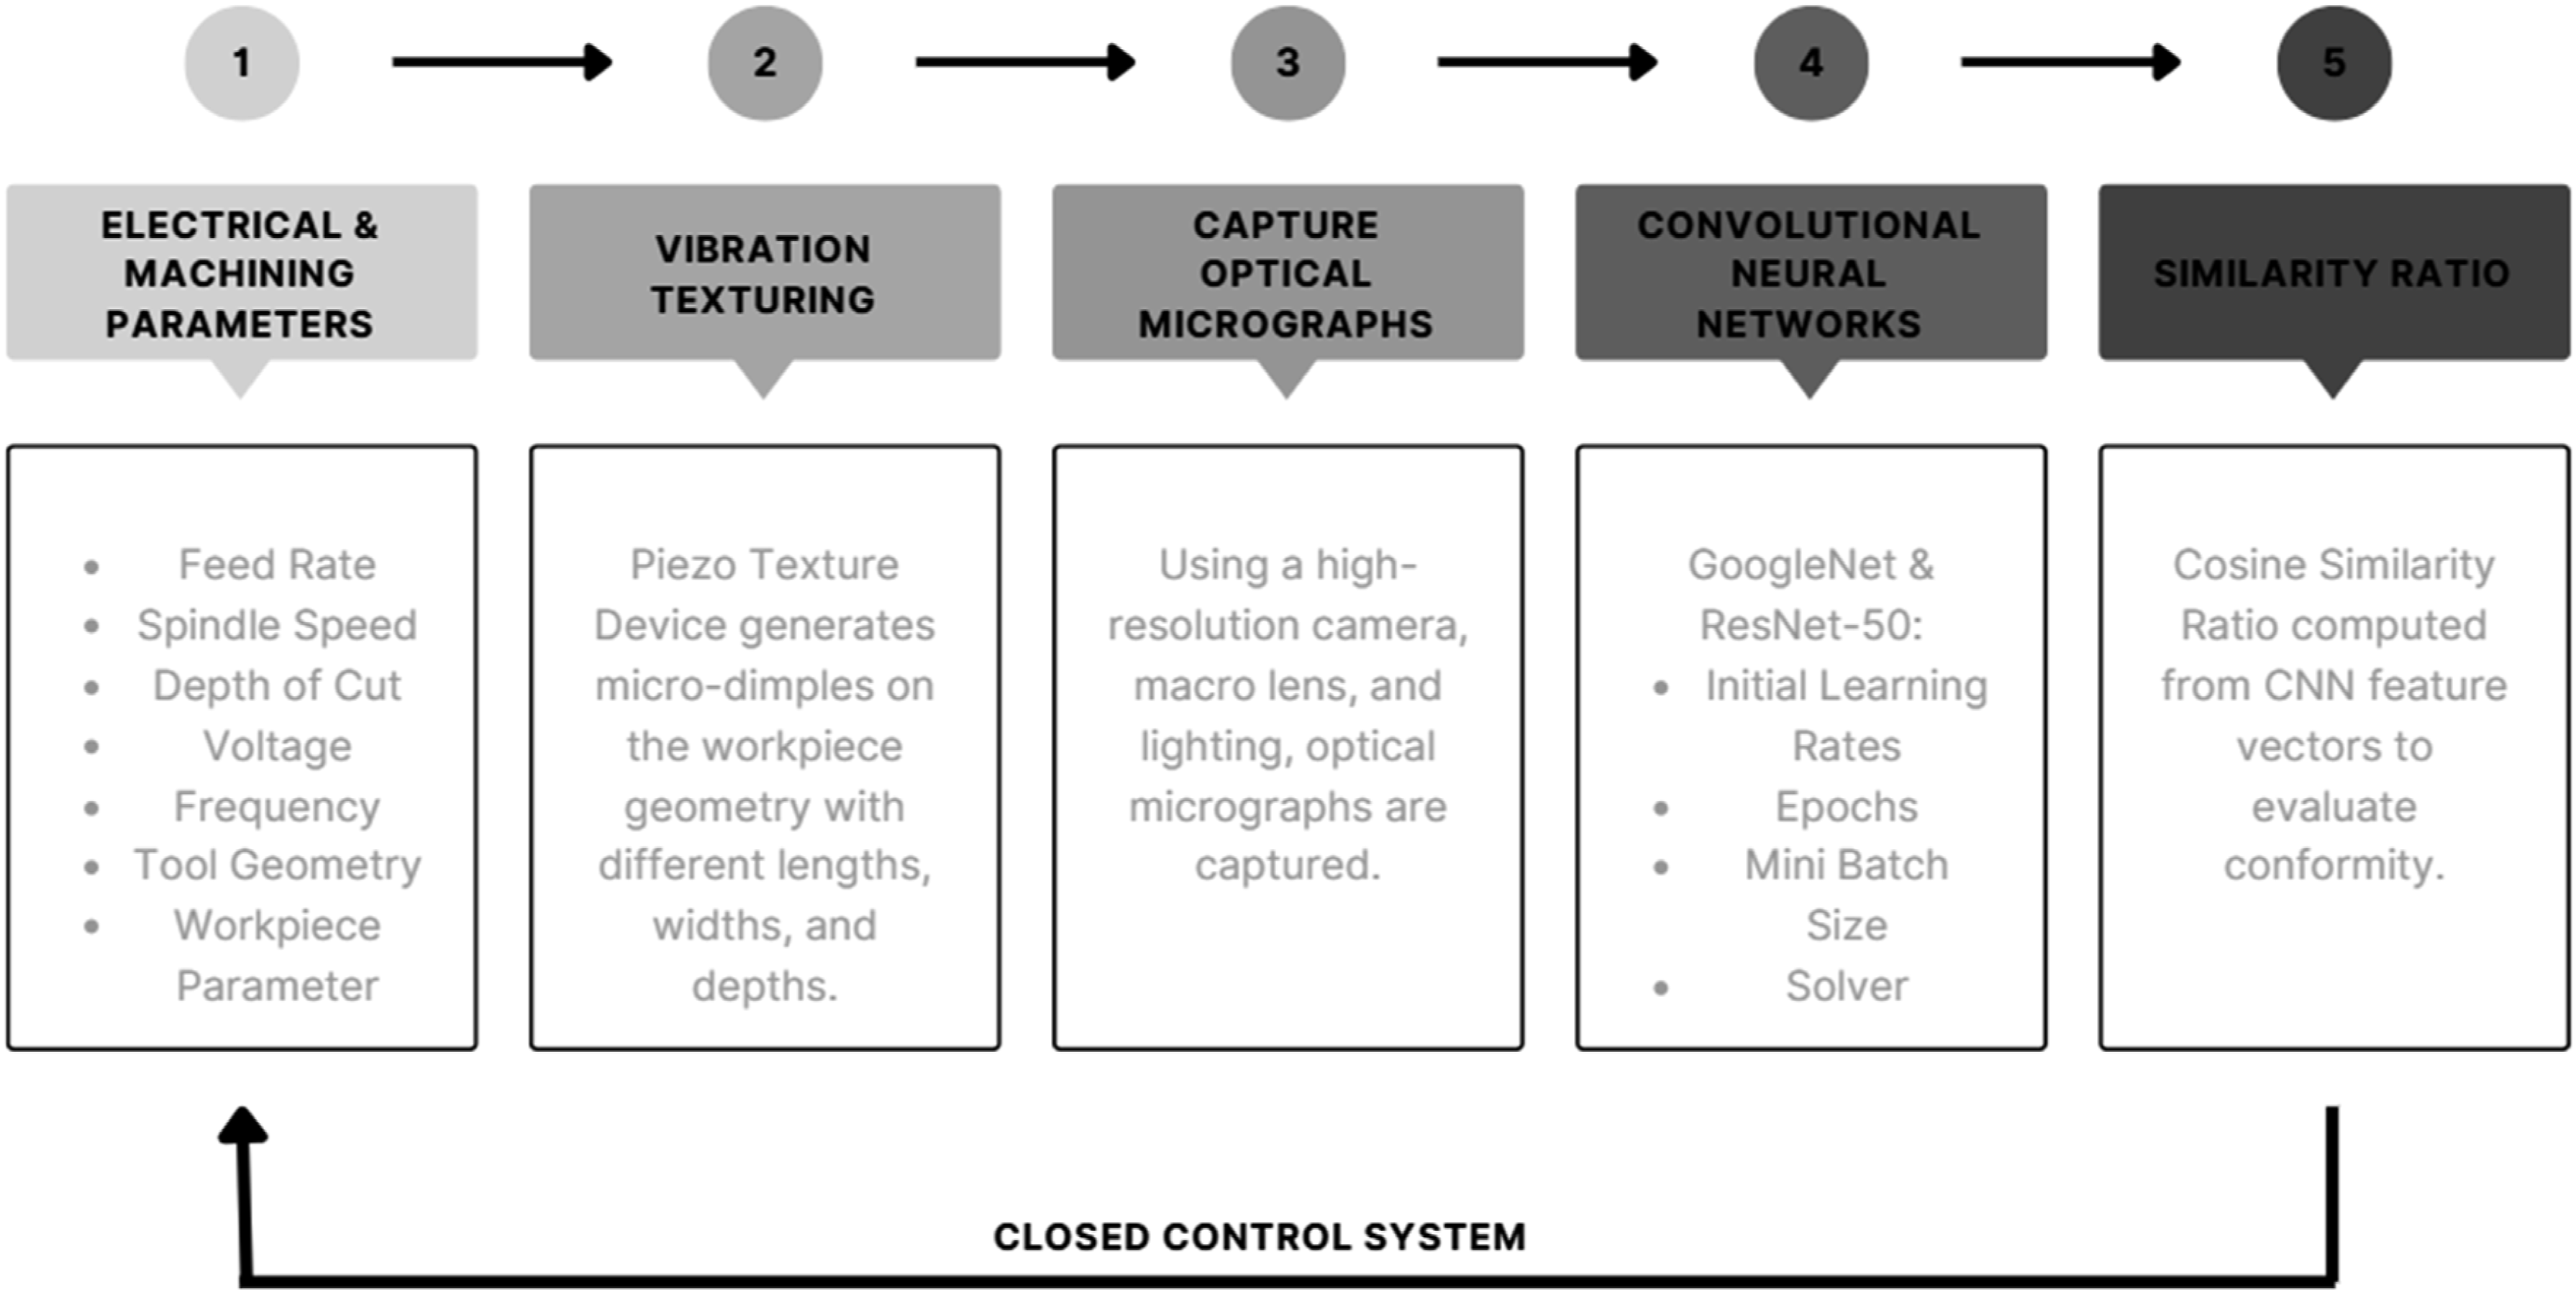
3.1. Device implementation
Since micro-textures have gained significant importance in the field of micro-manufacturing, a device was developed to imprint textures consistently and ensure repeatability.
The experimental setup is defined by a set of machining, vibration, tool, and material parameters. The machining configuration includes the machine tool type and key machining parameters such as feed rate, spindle speed, and depth of cut. The vibration system is characterized by the actuation method, excitation frequency, input voltage, phase duty cycle, and square waveform. The workpiece is described in terms of material type, mechanical properties, and initial surface condition.
The workpiece is a 6061-aluminum alloy. The CNC parameters included a feed rate of 0.1 mm per revolution, a spindle speed of 300 revolutions per minute, and a shallow depth of cut limited to 10 - 15 microns to promote intermittent cutting. The frequency was fixed at 10 kHz, with a voltage of 350 V, and a phase duty cycle of 100%.
The vibration tool consisted of a series of piezoelectric components responsible for converting the supplied electrical power into microscale vibrations. These vibrations were transmitted through a horn, whose design and calculation methodology were described previously. To support the formation of smaller and more precise dimples, a diamond-tipped cutting tool was selected. The turning operation was then conducted.
Experiment parameters.

The dimensions of the micro-dimples produced through vibration turning were analyzed to assess the effectiveness and precision of the piezo texture tool. The resulting surface textures were characterized by evenly spaced; rounded dimples distributed across the machined surface. Optical microscopy was used to capture high-resolution images of these micro-dimples and to measure their geometrical properties, including diameter and spacing.
To minimize overlap between adjacent dimples, proper spacing must be carefully calculated. The spacing is primarily influenced by the vibration frequency of the tool, the diameter of the workpiece, and the spindle speed. For a fixed frequency and workpiece diameter, adjusting the spindle speed directly alters the distance between consecutive dimples. The surface speed of workpiece V is determined by the spindle speed N and the diameter D, and is calculated using the relation:
The distance moved by the surface during one vibration cycle is given by:
By carefully selecting the spindle speed, the spacing between dimples can be optimized to avoid overlapping and maintain consistent pattern quality.
A representative micrograph of the produced surface texture, together with the measured geometrical dimensions, is presented in Figure 8. Dimensions of the generated dimples.
Using Equations (10) and (11), the analytical model yields a theoretical dimple length of 62.83 µm. To evaluate the repeatability of the texturing process and quantify the difference between analytical and experimental results, a total of 50 dimple-length measurements were extracted from optical micrographs. The measured dimple length shows a mean value of 66 µm with a standard deviation of 3 µm, indicating stable process behavior and good repeatability. The absolute deviation between the measured mean and the analytical value is 3.17 µm, corresponding to a percent error of 5.0%.
This discrepancy is attributed to tool–workpiece interaction effects, such as elastoplastic deformation, which are not considered in the analytical model. In addition, the impact-type contact between the vibrating tool and the workpiece introduces dynamic effects influenced by contact conditions, damping, and energy transfer during each vibration cycle. Nevertheless, the observed deviation remains within acceptable industrial machining tolerances while maintaining consistent texture geometry.
3.2. Convolutional neural networks
Using pre-trained networks on Matlab, the performance of GoogleNet and ResNet in categorizing and identifying the micro-textures when compared to a normal polished turned surface will take place. All experiments and neural network training were performed using MATLAB R2022b on a Windows 11 Pro system, equipped with an Intel Core i7-10510U processor (4 cores, 8 threads, 1.8 GHz base frequency) and 20 GB of RAM.
The input dataset for each category consists of 100 images, acquired using the optical camera system described previously. For each experiment, 10 percent of the images are first reserved as an independent test set. From the remaining 90 images, approximately 13 images (around 15 percent) are allocated for validation during training, while the rest are used for network training.
The CNN was trained to differentiate between acceptable and defective micro-textures based on geometric features of the micro-dimples, including edge definition, periphery regularity, and overall geometric consistency. These features were learned through the convolutional layers by capturing variations in dimple shape, boundary sharpness, and uniformity across the textured surface.
During training, several parameters directly influence the validation outcome and the overall accuracy of the study. The first is the solver, where SGDM (Stochastic Gradient Descent with Momentum) is selected. This solver updates the model’s parameters using a gradient loss function applied to a mini batch, which is the subset of images selected in each epoch. The SGDM extends traditional SGD by incorporating a momentum term that helps accelerate convergence and reduce oscillations.
Another critical parameter is the Initial Learning Rate, which controls how significantly the model’s weights are adjusted after each iteration, based on the error estimation. Validation frequency defines how often the model’s performance is evaluated using the validation set during the training process. The maximum number of epochs indicates how many complete passes the CNN makes through the entire training dataset. Finally, the mini-batch size specifies how many images are processed in a single iteration.
All six experimental rounds employed the same optimization strategy, using the SGDM solver, a validation frequency of 5 iterations, and a maximum of 8 training epochs, in order to ensure consistent training conditions across all experiments. Keeping these parameters fixed allowed the observed performance variations to be attributed solely to the selected training settings, rather than to changes in the optimization procedure itself.
Solver input parameters.

Model evaluation is based on several accuracy indicators, including validation accuracy, precision, recall, and F1-scores. These metrics are computed using the following equations:


3.2.1. Training with and without dimples
To ensure the parameters were optimal for producing dimples, the first step was to monitor the workpiece. The training process involved comparing micro-scale textures – dimpled surfaces versus simply polished surface – as demonstrated in Figure 9. This comparison was carried out because, without the correct electrical parameters, the tool cannot form any dimples. Consequently, this approach helps manufacturers monitor the process in real time to ensure that an ideal surface is achieved. Trained surfaces: (a) With dimples (b) Without dimples.
Training results.
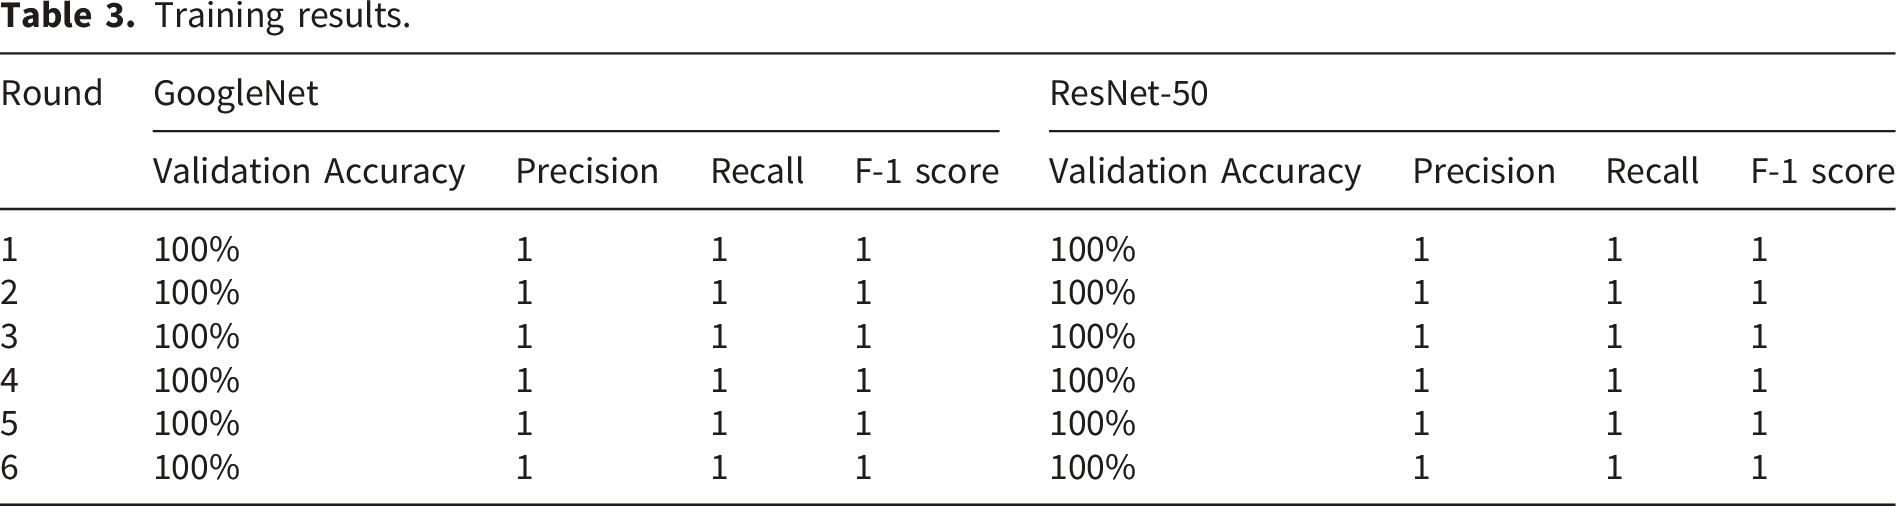
While both networks demonstrated high performance, each reaching a validation accuracy of 100 percent and achieving precision, recall, and F1-scores of 1, GoogleNet showed certain advantages in terms of training efficiency. It was able to converge in fewer epochs compared to ResNet-50, indicating a faster learning process. Additionally, GoogleNet consumed less computational power and required less GPU usage. In terms of training time, GoogleNet completed its training in about 5 minutes, while ResNet-50 took nearly double the time—around 10 minutes. This clearly highlights GoogleNet’s superiority in classifying the two surface categories: those with imprinted dimples and those with only linear textures resulting from standard turning and polishing operations.
When looking at the results across the different training rounds, it becomes clear that smaller mini-batch sizes led to quicker convergence. This is likely due to the fact that using fewer samples per iteration allows the model to adjust more responsively to each update, which contributes to better generalization and overall performance. As for the influence of the initial learning rate, lower values consistently led to faster and smoother convergence. A smaller initial learning rate helps avoid overshooting the minimum during gradient descent and promotes more stable learning throughout the epochs.
Overall, these results not only confirm the robustness of both networks but also underline the practical advantages of GoogleNet in scenarios where training time, efficiency, and resource usage are critical. The effect of training parameters like mini-batch size and learning rate further emphasizes how sensitive deep learning models are to tuning, especially when working with high-resolution micro-texture classification tasks.
3.2.2. Training with repeatable and defective dimples
Regarding the defective dimples, their formation was primarily influenced by variations in both the applied frequency and the depth of cut. When a frequency of 10 kHz was used with the same parameters as the repeatable dimples but with a shallower depth of cut, the resulting dimples appeared inconsistent, as shown in the Figure 10. The dimples lacked repeatability, and the tool was not perfectly aligned. In some regions, the tool engaged the surface, while in others it did not. As a result, the dimples were poorly defined, incomplete, and irregular. This indicates that even with an optimal frequency, insufficient tool penetration (which indicates low cutting depths) limits the vibration amplitude transmitted to the surface, compromising the imprinting process. Example of defective dimples at 10kHz.
In the surface shown in Figure 11, another effect is evident. A frequency of 20 kHz was applied here, which may have coincided with the system’s resonant frequency. This introduced additional harmonic vibrations due to machining vibrations of the workpiece relative to the tool. Besides the lack of repeatability, the dimples also shifted irregularly from one row to another. Since the spindle speed was not adjusted relative to the control experiment, it appears that a higher speed was needed to produce clearer, well-spaced dimples and to avoid overlapping and distortion. Example of defective dimples at 20kHz.
Both GoogleNet and ResNet-50 were trained to differentiate between the ideal dimples and the defective dimples. The training process was similar to that done for the surfaces with and without dimples with two samples divided into images of surfaces used for training and others used for testing. The results can be visualized in Figure 12. Training results.
The comparison clearly shows that GoogleNet outperformed ResNet in classifying repeatable versus defective dimples in almost all rounds. As observed in the plots, GoogleNet achieved very high validation accuracy, reaching or approaching 100% in most cases, while ResNet had more variation and lower values, especially in the first three rounds. For precision, recall, and F1-score, GoogleNet maintained stable and high metrics across all experiments. ResNet, on the other hand, showed some noticeable drops, particularly in Round 3 where all metrics went below 0.96. One important point is that GoogleNet was also faster to converge. This highlights that it required less computational power and time to achieve better results.
As for the input parameters used, round 1 used a mini-batch size of 11 with a small initial learning rate of 0.0001, while Round 3 reduced the mini-batch size to 4, which resulted in faster convergence and better performance for both networks, though GoogleNet still remained ahead. In Rounds 5 and 6, the initial learning rate was increased to 0.001, which helped ResNet improve. The results also show that a smaller mini-batch size in Rounds 3 and 6 led to higher accuracy and stability, probably because fewer samples per iteration allowed the networks to learn more effectively. Overall, GoogleNet consistently achieved better performance and trained faster, proving to be more reliable for distinguishing between ideal and defective dimples.
3.2.3. Similarity ratio
Since GoogleNet showed better training results, it was chosen for feature extraction to compare images. Beyond their typical use in classification, CNNs can also serve as powerful tools for extracting features, which is particularly valuable in manufacturing, where achieving consistent and repeatable micro-textures is critical. Using CNNs for feature extraction allows the analysis of the uniformity of surface textures, supporting quality control and reliability in production.
The CNN was thus applied as a feature extractor to convert each surface image into a high-dimensional feature vector. These vectors were taken from the activations of the pooling layers, which capture detailed spatial and semantic information about the images while keeping the important features of the micro-textures.
To compare the similarity between pairs of images, the cosine similarity ratio was chosen. Cosine similarity calculates the cosine of the angle between two vectors in multi-dimensional space and is mathematically defined as the dot product of the vectors divided by the product of their magnitudes. It is defined based on the following equation:
To demonstrate the role of this ratio, two tests were conducted. A comparison was made between different images: the first set consists of repeatable dimples produced at 10 kHz, while the second set shows defective dimples at 20 kHz from the same workpiece. This comparison is used to evaluate the surface texture consistency of the specific workpiece.
Starting with the first set, the images in Figure 13 will be tested. They will pass through the trained neural network for image extraction, and from the obtained vectors the similarity ratio will be calculated. Repeatable dimples at 10kHz.
The following is the image similarity matrix which proves the repeatability and similarity between these dimples. Indeed, the average similarity of each image to the others is 0.9033, 0.9381, and 0.9045 respectively. In Figure 14, the diagonal identity in the matrix has a ratio of one because it is the comparison of each image with itself. As for the other rows and columns, they portray the similarity ratio of each input image relative to the other. Repeatable dimples similarity ratio matrix.
Now for the second set, the three images in Figure 15 will be tested. Example of defective dimples at 20kHz.
The image similarity matrix can be observed in Figure 16. The ratio ranges between 0.41 and 0.54 proving the discrepancies between the images and the changes in the surface texture. Defective dimples similarity ratio matrix.
The textures produced by this process are critically important in modern industrial applications, from reducing friction and improving surface roughness to creating pores for functions such as oil retention. This is particularly relevant in sectors like automotive, aerospace, and biomedical manufacturing, where the contact between mating parts directly affects performance and reliability. By combining this process with AI, it becomes possible to classify textures as either repeatable or defective while also quantifying their similarity. Integrating such neural networks adds a dynamic layer of quality control that supports a smooth transition to Industry 4.0. Ultimately, the use of AI for real-time monitoring and assessment ensures higher production efficiency, enhanced performance, and greater longevity of mechanical systems. In this work, the AI model was able to detect various surface types and defects, including those caused by excessive tool penetration and harmonic vibrations.
While the similarity ratio provides a global measure of surface repeatability at the workpiece level, it does not explicitly localize individual features such as defective dimples or surface scratches. In the present study, this metric is therefore employed as an initial-stage indicator of process stability and overall texture uniformity rather than a tool for localized defect identification. From a manufacturing perspective, such a global assessment is valuable, as persistent deviations in similarity values can signal unstable operating conditions. For instance, low similarity ratios may indicate improper vibration transmission, insufficient tool penetration, or resonance-related disturbances, thereby guiding corrective adjustments to parameters such as spindle speed, excitation frequency, or depth of cut.
These results highlight the potential of the proposed framework as a foundational step toward intelligent, adaptive manufacturing systems capable of achieving repeatable micro-scale texturing with integrated AI-driven monitoring and process optimization.
In the current implementation, surface textures are captured immediately after the turning process and evaluated offline. Nevertheless, the proposed vision-based framework establishes a strong foundation for more advanced monitoring strategies. Ongoing work is focusing on extending the methodology toward a closed-loop control system by integrating high-speed imaging for real-time texture acquisition. In such a system, neural network outputs could be used to automatically adjust machining and excitation parameters during processing.
4. Conclusion
Micro-textures have become extremely important in today’s manufacturing industries due to their role in reducing friction, improving oil retention, and enhancing material performance. A device was developed consisting of piezo-actuated sensors and a horn, allowing micro-scale textures to be imprinted on a conventional lathe machine using the vibrations generated. This was made possible by carefully adjusting both mechanical and electrical input parameters, including feed rate, spindle speed, frequency, and voltage.
Previous literature focused on varying process parameters and analyzing the resulting textures in different directions; however, these studies often lacked an in-depth investigation of the surface topography and tended to keep the process static. Our work filled key gaps in literature by producing ideal micro-textures and classifying them using neural networks. The outcomes of this work include the production of repeatable micro-textures that, based on comparative assessment, demonstrated a level of consistency potentially exceeding what has been reported in previous studies. By integrating this dynamic layer of intelligent analysis, we advanced the process to a higher level, making improved quality control and more consistent outcomes significantly more attainable. This piezo texture device holds significant potential across multiple industries, with the generated textures serving as oil reservoirs in the automotive sector and enhancing performance in aerospace systems.
Since such textures cannot be seen with conventional inspection methods, AI-based visualization tools were created to enable process monitoring. And so, convolutional neural networks were introduced for both classification and feature extraction: • GoogleNet and ResNet were trained to classify surface images containing dimples versus traditional turned surfaces. • Additional training was performed to distinguish between repeatable and defective dimples. • GoogleNet achieved better performance, showing higher validation accuracy, precision, recall, and F1 scores while also requiring less computational power and training time.
Building on this, the trained GoogleNet model was used to construct a similarity ratio matrix, which provided a quantitative measure of texture consistency across the surface of the workpiece. This served as a robust and interpretable method for validating the uniformity of the manufacturing process.
The ability to generate highly repeatable micro-textures while integrating AI-based monitoring represents a significant advancement toward intelligent precision manufacturing. Such a system holds strong potential for large-scale implementation across automotive, aerospace, and sensor industries, where controlled surface functionality directly influences lubrication efficiency, wear resistance, aerodynamic behavior, and component reliability.
Footnotes
Acknowledgments
The authors acknowledge the Lebanese American University (LAU) for providing the laboratory facilities and technical resources that made this research possible.
Ethical considerations
This study did not involve human participants, human data, or animal experiments; therefore, ethical approval was not required.
Funding
The authors disclosed receipt of the following financial support for the research, authorship, and/or publication of this article: This research received no external funding.
Declaration of conflicting interests
The authors declared the following potential conflicts of interest with respect to the research, authorship, and/or publication of this article: R.B., C.L., and C.A. declare no potential conflicts of interest with respect to the research, authorship, and/or publication of this article.
Data Availability Statement
The data supporting the findings of this study are available from the corresponding author upon reasonable request.