
Abstract
Extracting buildings from images is crucial for urban management, urban planning, and post-disaster change detection. Over the years, various approaches have been tried, but the recent application of deep learning has greatly improved the success of such studies. In this study, the Inria dataset was used, consisting of 180 high-resolution aerial images.
The study compared the performance of various architectures. DeepLabv3+ emerged as the most successful, with Accuracy, IoU, and F1 Scores of 96.77%, 89.85%, and 94.53%, respectively. Attention U-Net followed, scoring 95.31%, 85.49%, and 91.95%. U-Net, tested with different encoders, achieved average results of 97.22%, 84.78%, and 90.79%. SE-ResNeXt-50 was the best-performing encoder, followed by SE-ResNet-50, ResNeXt-50, and ResNet-50. UNet++ achieved 94.48% Accuracy, 83.09% IoU, and 90.45% F1 Score, while U2Net obtained 94.09%, 82.26%, and 89.88%, making them less successful.
When examining the models under challenging conditions, SE-ResNeXt-50 was the most robust, successfully handling scenarios like occlusion by trees and complex indoor gardens. Conversely, Attention U-Net and UNet++ were more prone to errors, particularly when vehicles were parked near buildings or in the presence of shipping containers, where false positives were common. ResNet-50 struggled with concrete gardens, while U2Net showed better results in scenarios involving indoor gardens.
These results, compared to other studies using the same dataset with different pixel sizes, show that eliminating erroneous data and resizing images can enhance the performance of deep learning networks. Therefore, by refining the data and adjusting the image sizes, models can make more accurate and efficient building detections.
Introduction
Building extraction from images is critically important for numerous applications, including urban planning and management, disaster management, 3D city modeling, navigation, and change detection. 1 In this context, satellite and aerial images are widely used.2,3 Attempting to manually detect buildings from images is disadvantageous in terms of both time and effort. Consequently, numerous studies focus on performing this task automatically or semi-automatically. 4 However, despite many successful studies in the literature, this task remains challenging and complex due to several factors that can create problems in the images. For instance, these challenges include varying roof materials in different colors and structures, diverse building designs, shadows, and other challenging environmental elements. 5 Additionally, considering the significant variations in urban structures even within a relatively small area, it is difficult to generalize many successful approaches. 6 This necessitates the application of various approaches and methods to address similar or vastly different urban scenarios.
Current approaches can be categorized into two groups: (a) traditional image processing and (b) machine or deep learning-based approaches. Tavakoli and Rosenfeld 7 used edge detection filters to extract line segments from images for road and building extraction. Kim and Muller 8 adopted a graph-based approach for building extraction by considering mathematical and geometric relationships between lines. After extracting lines using edge filters, they applied steps for line-relationship graph formation, building hypothesis generation, and verification. The study achieved accuracy rates of 84%, 65.7%, 92.3%, and 62.5% for various test images.
Shackelford, Davis, and Wang 9 focused on identifying buildings and shadows from high-resolution satellite imagery using differential morphological profiles. This technique, based on morphological opening and closing operators, was relatively new at the time. Buildings were detected from the opening differential profile, and shadows from the closing differential profile, achieving object-level accuracy of 89.1% and completeness of 64.7%, as well as pixel-level accuracy of 78.8% and completeness of 38.6%.
Acar and Bayram 10 applied morphological opening and closing operators, derived from erosion and dilation, separately to the bands of color images split into red-green-blue (RGB) bands, and then reconstructed the color image. Structural elements, pre-defined pixel groups, were used to examine overlaps by moving across the image. The building recognition rate in the satellite image used was 85%, with a false positive rate of 1%.
Prakash, Soumya, and Bharath 11 used Indian Remote Sensing (IRS) satellite images and a supervised machine learning method, the Support Vector Machine (SVM) classifier, for building extraction. The classifier's performance was evaluated using different kernel functions, with the Radial Basis Function (RBF) achieving the highest performance with 96% accuracy, 91% Kappa, 97% precision, and 95% recall.
Kabadayı and Uysal 12 utilized 235 drone images and nine Ground Control Points (GCPs) to produce a Digital Elevation Model (DEM), Digital Surface Model (DSM), and orthophoto. Segmentation, the first step of object-based classification, was performed using scale, shape, and density parameters. Object-based rules were then defined to classify objects in the image as buildings or non-buildings, achieving an accuracy of 89% by identifying 17 out of 19 buildings in the selected area.
Maltezos, Doulamis, Doulamis, and Ioannidis 13 stated that raw image data is fed as input to deep neural networks in deep learning approaches. However, in this study, height information was utilized as an additional feature derived from the application of a dense image-matching algorithm. Protopapadakis, Doulamis, Doulamis, and Maltezos 14 proposed a Stack Autoencoder (SAE)-Driven and Semi-Supervised (SSL)-Based Deep Neural Network (DNN) to extract buildings from relatively low-cost satellite near-infrared images.
Bakırman, Kömürcü, and Sertel 15 employed their custom Istanbul dataset, as well as the Inria and Massachusetts datasets, for building detection. Popular architectures such as U-Net, U-Net++, DeepLabv3+, FPN, and PSPNet, along with approximately 30 encoders pre-trained on the ImageNet dataset and various hyperparameters, were tested. U-Net++ and U-Net, combined with the pre-trained SE-ResNeXt-101 encoder, provided the best results. This architecture-encoder combination was tested on the Istanbul dataset using parameters like accuracy, IoU, F1 score, precision, and recall, with U-Net++ achieving 95.5%, 93.8%, 96.5%, 96%, and 97.5% respectively.
Prakash and Bharath 6 used high-resolution images obtained by the TripleSat satellite in India. In addition to well-known models such as U-Net, Res-Net, VGGNet, and SegNet, they proposed a “Modified U-Net” model. These trained models were tested on various urban areas using IoU, accuracy, precision, and recall parameters. The “Modified U-Net” model proposed by the authors showed the best performance, achieving values of 88%, 90%, 97%, and 91% respectively in a complex urban area.
Wang et al. 16 proposed a convolutional network called Adaptive Feature Fusion UNet (AFF-UNet) to optimize semantic segmentation performance. Compared to DeepLabv3+, they achieved a 1.09% improvement in the average F1 score and a 0.99% increase in overall accuracy. Dabove et al. 17 address several complex challenges arising from the integration of deep learning and data fusion in Earth Observed imagery through their proposed innovative solution. Their study, conducted over a 21 km² area containing building footprints, demonstrates how the proposed approach leads to superior accuracy levels and improved delineation of building boundaries. As part of their study, Amirgan and Erener, 18 developed the Istanbul-Turkiye building dataset using very high-resolution Pleiades satellite imagery, including examples from five different building type classes. The segmentation results yielded accuracy scores ranging from 0.91 to 0.61 depending on the building types. Khan et al. 19 proposed an encoder-decoder framework for the automatic extraction of building footprints from satellite imagery. Their method demonstrated superior performance compared to other approaches on challenging datasets.
With the use of artificial intelligence in building extraction studies, there have been significant improvements in both the evaluation metrics used and the results obtained. The introduction of new methods and experiments utilizing deep learning has positively impacted the success of these studies, making it a widely preferred approach today. Consequently, this study decided to employ the deep learning method, which has gained popularity and demonstrated success in recent years, for building extraction.
At this stage, various versions of the U-Net architecture (U-Net, U-Net++, U2Net, Attention U-Net), known for performing high-quality pixel-level segmentation, were used alongside the DeepLabv3 + architecture. To enhance accuracy during model training, different versions of the ResNet50 architecture (SE-ResNet50, ResNeXt-50, SE-ResNeXt-50), previously trained on the ImageNet dataset, were planned to be used as encoders in the architectures through transfer learning. This approach aimed to compare the architectures and encoders and identify the most successful ones.
Among the datasets, the Inria dataset was chosen due to its easy accessibility, high image resolution, and the provision of scenes from five different urban structures. The reference data for test images in the Inria dataset, i.e. the mask images, are not directly accessible. Therefore, without using the test dataset, only the training dataset was split into parts. To increase the number of images and facilitate easier model predictions, the images were divided into smaller images of 512 × 512 pixels. Additionally, by examining the images and masks, those with discrepancies were removed from the dataset.
Thus, this study aimed to compare the results obtained with other studies using the same dataset to investigate how eliminating incorrect labels and reducing image size affects the success of the deep learning network. Finally, when evaluating model performance on test images, the performance in low-density, high-density, and industrial-type residential areas was examined, and a spatial analysis was conducted.
Materials and methods
In this study, aimed at building extraction from images, the U-Net architecture was chosen as the primary model, and the Inria aerial images were used as the dataset. The original Inria training dataset contains 180 images, each with a resolution of 5000 × 5000 pixels. This number is insufficient for training a deep learning architecture. Therefore, a dataset shared by a user on the Kaggle platform, containing downsampled versions of the images with a resolution of 1024 × 1024 pixels, was obtained, increasing the total number of images to 2880. 20 Each of these images and their corresponding masks were examined individually, and 155 images were removed from the dataset to enhance accuracy due to discrepancies. To facilitate easier model predictions, the remaining 2725 images were further divided into 512 × 512 pixel sub-images, resulting in a total of 10,900 images.
Subsequently, 1090 images, representing 10% of the total image count, were selected for the testing phase, ensuring an approximately equal number of images from the five different scenes. After excluding the images set aside for testing, 7630 images (70% of the total) were randomly assigned for training, and 2180 images (20% of the total) for validation. The necessary hyperparameters and evaluation metrics for conducting the training and validation processes were determined by reviewing the literature. The commonly used metrics for evaluation, which facilitate high-quality inferences, include accuracy, recall, precision, F1 score, Jaccard index (IoU), dice coefficient, and dice loss. Hyperparameters such as learning rate, batch size, and optimization algorithm were determined through various trials.
After training and validating the U-Net model, to further improve the obtained metric results, eight different deep learning architectures previously trained on a traditional image set were used in the encoder part of the U-Net architecture via transfer learning. The ResNet-50 architecture was taken as the base for this process, and additional structures were integrated into it to create SE-ResNet, ResNeXt, SE-ResNeXt, Attention U-Net, DeepLabv3+, UNet++, and U2Net models, yielding various results.
The results were evaluated using metrics critical for accurate inferences in building extraction studies: IoU, F1 score, and the traditional accuracy metric. Model results were presented both numerically and visually, showing scenes where successful and unsuccessful predictions were made. Finally, the model results were compared with each other, and the overall performance of the study was compared with similar studies, followed by a discussion of the results.
Inria dataset
Public orthophotos and cadastral information from numerous US and Austrian regions were used to create the Inria dataset. Photos with a resolution of 30 cm were converted to include three RGB spectral bands and used this way. Buildings and non-buildings were considered when constructing photo masks using cadastral data. The Inria dataset has 180 training, and 180 testing images equally obtained from of these five cities. Three US cities and two Austrian cities. The 180 images encompass 1500 × 1500 m with 5000 × 5000 pixels and 30 cm resolution. 21
In the training dataset, (i) Chicago has low-density suburban and industrial structures. (ii) Austin includes high-rise business centers, low-density residential districts, and other buildings typical of a well-developed urban area. (iii) Kitsap County represents low-density suburbs. (iv) Vienna illustrates complex, densely populated, and interrelated urban structures, and (v)West Tyrol has industrial and low-population areas.
Before training, when examining the sub-images of 1024 × 1024 pixels, the most common issue encountered was that the buildings present in the mask images did not appear in the aerial images. Following this, other issues identified, as illustrated in Figure 1 and Figure 2, include: (i) buildings in the aerial images not being present in the mask images, (ii) buildings being inaccurately drawn in the mask images, and (iii) significant mismatches between the aerial images and the mask images.

Incorrect mask annotations (ellipse), buildings present in aerial photos but not in mask images (rectangle), buildings present in mask images but absent in aerial photos (triangle).

An example of discrepancy between aerial images and mask images.
Additionally, Figure 3 provides further examples of buildings that are either entirely missing or inaccurately annotated as buildings in the absence of actual structures.

Examples of discrepancy between aerial images and mask images.
U-Net architecture
Ronneberger et al. 22 built the U-Net model utilizing biomedical image datasets and versions of the “fully convolutional network” introduced by Long et al. 23 It can segment smaller datasets better. The model's main idea is to replace pooling operations with upsampling operators in each layer of a contracting network to improve output image resolution. The contracting path's high-resolution features and upsampled output are merged for pixel-wise label assignment. After each convolution, the U-Net design uses just some sections of the image because it lacks fully connected layers. Simply said, segmentation output contains only the whole context of input picture pixels. This method uses overlapping and tiling to segment big photos without problems. The input image is mirrored to estimate the missing context and anticipate edge pixels. Without this tiling approach, GPU RAM would restrict network resolution on large images. 22
The U-Net architecture has shrinking and expansive paths. The left side shows the convolutional network structure. The contracting path uses two convolution operations, a ReLU activation function, and a 2-step stride max-pooling operator. The expanding path upsamples the feature map by up-convolution. The cropped feature map from the contracting path is included. This combination undergoes two convolution operations and a ReLU activation function like the contracting path. The last layer’s 64-component feature map is convolutioned 1 × 1 to get the desired class outputs from the architecture. The input image’s x and y dimensions should be powers of 2 to account for 2 × 2 max-pooling operations and pooling frequency. 22
Residual network architecture
With a 3.6% error rate, the 152-layer ResNet architecture won the 2015 ImageNet competition and, for the first time in a convolutional neural network, outperformed human performance. The derivatives of errors at every layer in neural networks are computed during backpropagation, which leads to the correction values gradually approaching zero. Due to this problem, the network's later layers become insensitive to corrections, almost completely stopping the learning process. ResNet adds links from previous layers to later ones in the network to solve the vanishing gradient issue. The construction of deeper architectures is made possible by this solution. Remaining blocks are the term for these linkages. 24
There are multiple iterations of the ResNet design with varying layer counts. While the 50, 101, and 152-layer versions share a different but similar structure, the architectures of the 18 and 34-layer versions are similar to each other. 24
SE(squeeze-and-excitation)-ResNet
Convolutional neural networks use equal channel weights for feature maps. In Squeeze-and-Excitation Networks (SENet), a mechanism adjusts channel importance. The Squeeze-and-Excitation block is computational. This block is added to SENet’s convolutional layers to highlight useful features and dim less useful ones in later stages.
SENet processes a convolution block and its channels first. An average pooling procedure “squeezes” each channel's value to create a single output value. This is followed by a fully linked layer with ReLU activation function to add non-linearity. A completely linked layer and sigmoid activation function gate each channel after these processes. Thus, each convolution block feature is weighted by its dependence on auxiliary network outputs. 25
ResNeXt
ResNeXt uses the “split-transform-merge” algorithm to repeat layers like VGG and ResNet in a simple and scalable way. A network block aggregates outputs from transformations with the same topology. This method extends many transformations without new designs. The ResNeXt architecture suggests that increasing cardinality (the size of the transformation set) may be more important than increasing depth or width for network accuracy. The ResNeXt-50 architecture has the same width and filter size as ResNet-50 except subsampling of feature maps and multiplying convolutional block widths by 2. 26
SE-ResNeXt
The ResNeXt model’s block structure was modified to include a Squeeze-and-Excitation (SE) block, resulting in the SE-ResNeXt model. The Squeeze-and-Excitation block is incorporated into the 50-layer ResNet architecture to make the SE-ResNet, and the SE block is incorporated into the ResNeXt block structure to generate the SE-ResNeXt architecture, as shown in Table 1. 25
The setup of the conducted trainings.

Attention UNET
The U-Net model equipped with an Attention mechanism 27 features five convolutional layers where the number of filters increases in the encoder path and decreases in the decoder path. The number of filters starts at 64 in the initial layer and increases up to 1024 in the final layer. While ReLU activation functions are used in the convolutional layers, the final output layer employs a Softmax activation function to produce probability distributions over class labels. This model is capable of segmenting small targets in complex scenes with minimal data requirements and has achieved successful results in biomedical image segmentation. Compared to conventional convolutional approaches, U-Net's soft-hard attention mechanism significantly enhances the model's detection and segmentation performance. Additionally, attention maps are added to the input feature maps before the activation function, and batch normalization is utilized in the architecture.28,29
DeepLabV3+
The DeepLabV3 + semantic segmentation network utilizes contextual features of multi-scale targets to accurately detect different particle size ranges of raw coal. This network expands the receptive field by using dilated convolutions and incorporates a broad range of information in each convolutional output. The encoder reduces feature maps and captures semantic information through multi-scale semantic information processing modules, while the decoder module restores spatial information to produce clearer segmentation features. The atrous spatial pyramid pooling (ASPP) mechanism used in the encoder includes dilated convolution operations at different rates and an image pooling layer. However, the model exhibits high computational complexity and requires improvements in image processing speed. Additionally, its capacity to capture detailed semantic information for densely distributed multi-scale coal and gangue is limited. Consequently, it may encounter issues such as insufficiently detailed edge segmentation and weak anti-interference capabilities.29,30
U2Net
U2Net 31 introduces a novel Residual U-Block (RSU) to effectively leverage both local and global contextual information, which is crucial for salient object detection and segmentation tasks. Inspired by U-Net, the RSU block uses small convolutional filters to expand the receptive field and capture multi-scale information efficiently. Unlike traditional residual blocks, the RSU block incorporates multi-scale feature extraction directly within each block. This structure includes an input convolutional layer for local feature mapping and a U-Net-like encoder-decoder architecture for processing multi-scale contextual information. 31 The two-level nested U structure of U2Net facilitates complex multi-scale and multi-level feature extraction and aggregation. The architecture features an 11-stage main U structure, comprising a six-stage encoder, a five-stage decoder, and a saliency map fusion module, with an RSU block at each stage. This module upsamples, merges, and transforms the intermediate saliency maps produced by sigmoid and convolution functions into a final saliency probability map. The design of U2Net ensures the preservation of a complex, feature-rich architecture while efficiently managing memory and computational resources. 31
UNet++
UNet++ introduces three significant enhancements to the original U-Net architecture.32,33 (1) Convolutional layers have been added to the skip connections to connect encoder and decoder feature maps and enhance their semantic understanding. (2) The gradient flow of the model has been improved with the inclusion of dense skip connections. (3) Deep supervision is employed to increase the model's operational versatility. The encoder and decoder subnetworks constitute the architecture of UNet++. The newly introduced dense skip connections, which enable deep supervision and dense convolutions, are among its distinguishing features. UNet++ utilizes dense convolution blocks at each pyramidal level to improve the alignment of encoder and decoder feature.29,34 Strategically placed dense convolution blocks along the skip paths intelligently combine feature maps from each preceding level before reaching the decoder. This method enhances the details and semantic consistency of the feature maps. UNet++ allows two different operational modes using deep supervision. The “fast mode” selects a single branch for segmentation, while the “accurate mode” focuses on maximizing performance by averaging outputs from all branches. This approach enables UNet++ to generate high-resolution feature maps at different semantic levels by incorporating stacked skip connections.32,33
Evaluation metrics
In the context of the study conducted, the metrics’ formulas are defined as follows:
True Positives (TP) refer to structures that are correctly identified as buildings among the extracted structures. True Negatives (TN) denote areas identified as non-buildings that are indeed non-buildings. False Positives (FP) indicate structures incorrectly identified as buildings that are actually not buildings. False Negatives (FN) refer to areas that are actually buildings but are misclassified as non-buildings.
Accuracy is obtained by dividing the total number of correct predictions by the total number of predictions, both correct and incorrect.
35


Results
In this study, as discussed in previous sections, the U-Net architecture was selected as the base model, and accuracy improvements were achieved by incorporating various pretrained ResNet-50 variants (SE-ResNet-50, ResNeXt-50, and SE-ResNeXt-50) into the encoder part of the U-Net model using transfer learning techniques. 41 The Attention U-Net model, DeepLabv3+, U2Net, and U-Net++ also used the default ResNet-50 architecture as their backbone. To ensure an objective evaluation, all models were trained and validated using the hyperparameters listed in Table 1. The model training was conducted on the Kaggle platform using a Tesla P100 GPU with 16 GB of memory.
For an effective and speedy learning process, it is advisable to start with a high learning rate and gradually reduce it over time. 42 The assessment measures showed that the learning rate was 0.001 after testing extensively used values, including 0.1, 0.01, 0.001, and 0.0001. Moreover, as stated, the learning rate is set to drop by 10% if the loss (Dice loss) does not show improvement after three phases.
The model trained using the SE-ResNeXt-50 architecture was the slowest to learn. Considering this, along with Kaggle’s 12-hour maximum notebook use restriction, it was found that a maximum of 50–53 epochs could be completed. Although certain ResNet architectures allowed for more epochs within the 12-h period, all models were limited to 50 epochs to ensure a fair comparison.
The error function used in this study was Dice loss, an effective method to address class imbalance by directly focusing on overlap without weight assignment. Many loss functions, such as weighted cross-entropy, attempt to find solutions by assigning varying weights to image classes. 43 This error function was optimized using the Adam algorithm, developed by Kingma and Ba. 43 The Adam algorithm is well-known for its efficient performance on high-dimensional datasets and large parameter values, as well as its minimal memory demands, even in conditions with noisy or sparse gradients. 43
Following the assessment, it was observed that certain images achieved 100% results for every evaluation criterion. Further investigation revealed that about 140 images lacked any obvious structures. As a result, the models generated outstanding performance even in the absence of building detection. Since the main objective of this study is to consistently identify buildings, it was decided to eliminate these 140 images devoid of any building constructions from the test data. Using the remaining 950 images, an examination was conducted to generate more accurate findings, which is the most time-consuming part of the process.

Example of a non-building image removed from the test dataset (left-image, center-reference mask, right-predicted mask).
The models performed detections on each of the 950 images individually and generated results for each. The arithmetic mean of the results obtained by each model across the 950 images was calculated to present the model-based test results.
Comparison of model results on the test dataset.
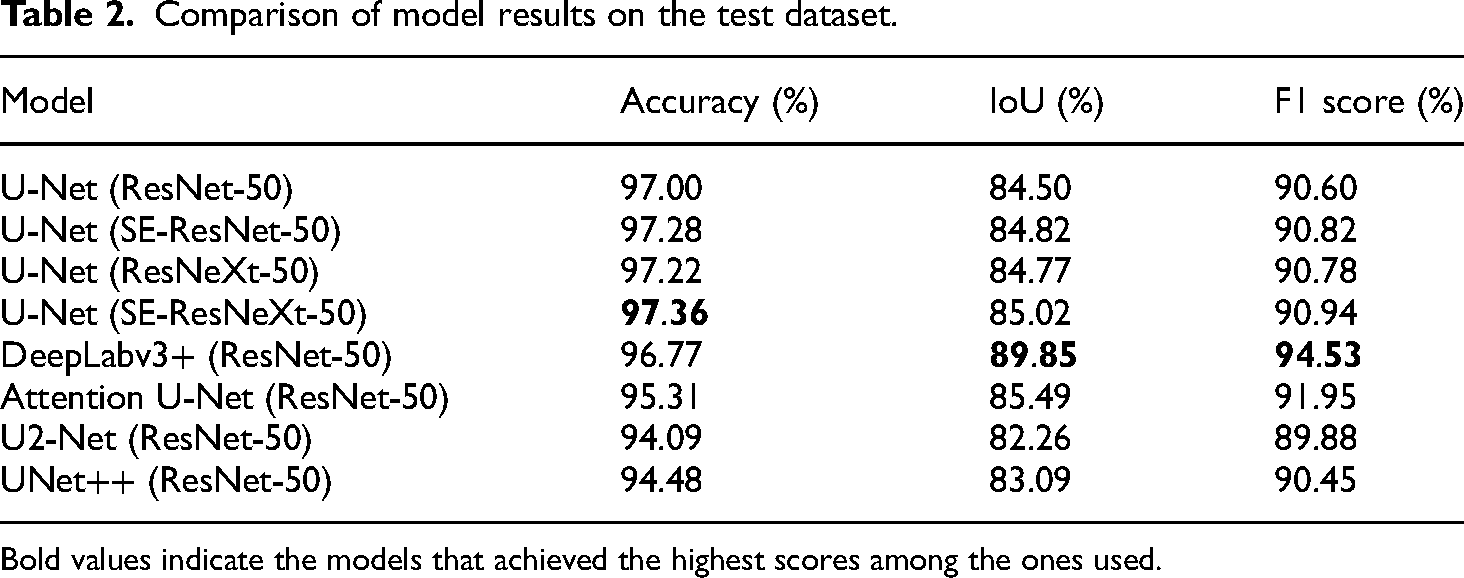
Bold values indicate the models that achieved the highest scores among the ones used.
Upon examining the assessment outcomes of the test dataset, it was found that the DeepLabv3 + model, which utilizes a ResNet-50 encoder, demonstrated exceptional performance in both the IoU and F1 score metrics. Later on, the Attention U-Net model was developed. Meanwhile, the U-Net model, which used several versions of the ResNet-50 architecture, showed better performance when combined with the SE-ResNeXt-50 encoder. The U2-Net and UNet++ models yielded less satisfactory outcomes compared to the other models.
The various strategies evaluated in these models, which are essentially similar, can have both advantageous and disadvantageous impacts on the research results. This work demonstrates that the DeepLabv3 + model significantly improves the extraction of buildings from images by emphasizing the capture of semantic information through the ASPP mechanism. Furthermore, the Attention U-Net model, which enhances extraction capabilities through the utilization of a soft-hard attention mechanism, and the SE-ResNeXt model, which integrates cardinality as a vital parameter and features a squeeze-and-excitation block, have exhibited positive results. U2Net and UNet++ have shown more significant negative effects when compared to each other. U2Net uses RSU blocks and a fusion model at each stage, whereas UNet++ offers two different modes with deep supervision.
Discussion
During the analysis of the models’ responses to different images, several issues were identified. The challenges encompassed various aspects, such as the diverse architectural styles and roof color variations of industrial buildings and office centers, potential obstructions caused by trees blocking buildings, the impact of shadow effects on images, and the difficulty in identifying regions that may resemble buildings but are not actual structures (Figure 5).

Performance of models under challenging conditions.
The model, particularly struggled with detections in various scenes due to designs featuring nested structures with internal voids and roofs resembling the ground surface, resulting in lower performance. Additionally, some scenes were affected by the fact that the images were captured from an oblique angle (Figures 6–8).

Performance of models on oblique, complex, and deceptive scenes.

Successful predictions by models in Austin and Chicago cities.

Successful predictions by models in Kitsap County and Vienna cities.
Regarding the successful predictions made by the models, relatively higher classification scores were achieved in industrial areas with similar architectural layouts and more clearly delineated boundaries.
The model was observed to perform more successfully in scenes consisting primarily of sparse settlement areas (such as West Tyrol and Kitsap County).
The following IoU results were found when comparing the findings of this study with those of other studies that also used the Inria dataset: Using 512 × 512 pixel images, Bakırman et al. 19 obtained an IoU of 75.39%, whereas an IoU of 76.27% was attained by Milosavljević 44 using 384 × 384 pixel images, and Xie et al. 45 used 256 × 256 pixel images to achieve an IoU of 79.35%. Ultimately, the greatest IoU of 80.50% was attained by Kang et al. 46 During the training phase, resizing the original image to smaller dimensions can aid model training and increase the amount of data. However, the study's IoU result of 85.02% shows that the model performs significantly better when erroneous data is removed before the training phase.
Challenging conditions on model performance
In certain specific cases, models demonstrate lower performance. Examples and explanations for these challenging conditions are provided below:
Tree: Trees obscure buildings, blocking the view of their rooftops. Vehicle: When cars, trucks, etc. are close to buildings, they may be interpreted as part of the building. Car Park: Painted parking areas and the cars on them create reflections that resemble buildings. Concrete Garden: Due to material and geometric similarities, concrete gardens are sometimes confused with buildings. Indoor Garden: Labeling errors exist; in some buildings, these areas are labeled as part of the building, while in others, they are not. Closely Spaced Buildings: Buildings that are very close together may appear as a single structure. The gap between them may be too small to create contrast. Rooftop Parking: Parking areas on rooftops may have the same gray values as the building itself, and cars are sometimes mistaken for building elements like chimneys or cooling equipment. Shadows: Shadows sometimes fall across buildings, affecting the detected building boundaries. Shipping Containers: Containers resemble buildings in size, shape, and color, which makes them challenging for models to detect accurately. Concrete Road: Concrete roads near buildings have gray values similar to the buildings, affecting the delineation of building boundaries. High-Rise Building + Pool: Rooftop pools, while part of the building, may not be detected as such. Roof Color Similarity: Regions that do not match the building's color and have gray values closer to roads or similar elements may not be distinguished as part of the building.
When examining the performance of the models in these challenging conditions, SE-ResNeXt-50 has proven to handle these conditions most effectively according to visual interpretation, aligning with its model outcomes. Conversely, the models that struggle the most with these challenging scenarios, as indicated by visual assessments, are Attention U-Net and UNet++. However, performance can vary on a case-by-case basis. For instance, occlusion by trees poses issues for all models. Vehicles parked near buildings primarily impact UNet++ and Attention U-Net, producing incorrect results, while other models remain unaffected. Concrete gardens only affect ResNet-50, whereas indoor gardens yield favorable results for SE-ResNeXt-50 when assessed by manual inspection and for U2Net in visual interpretation. In cases involving shipping containers, UNet++ and Attention U-Net tend to produce false positives. Results for other scenarios align with general performance statistics. Examples of these challenging cases and corresponding model results are presented in Figure 9.

Examples of challenging conditions in model performance and model results.
Although enhancing the dataset can help reduce the errors outlined in Figure 3, many image processing challenges cannot be resolved solely by a trained AI model. 47 Therefore, various post-processing image processing algorithms can be employed to address the issues encountered in Figure 3
Comparison of model approaches on semantic segmentation performance
As seen in Table 3, the DeepLabv3 + network, utilizing Atrous Convolution, achieved the best performance. The Attention UNet follows in second place, highlighting the effectiveness of the attention mechanism. When examining the performance of U-Net models with SE-ResNext-50, SE-ResNet-50, ResNext-50, and ResNet-50 (Table 2), it is evident that the scores among these networks are relatively similar. However, the SE + ABC mechanism outperforms the SE + Residual Blocks strategy. In the U-Net networks without the SE mechanism, specifically U-Net with ResNext-50 and ResNet-50, a similar trend was observed, demonstrating that the ABC mechanism yields better performance than typical residual blocks. Among these four methods, the integration of SE and ABC blocks (U-Net with SE-ResNext-50) achieved the highest score. On the other hand, the U-Net++ architecture, which employs Nested Convolution, ranked seventh among all methods, and the U2Net architecture, incorporating residual blocks, came in last. This indicates that conventional block modifications within the U-Net architecture did not effectively enhance performance.
Training approaches and overall rankings of the semantic segmentation models.

Conclusion
Creating segmentation, a task marked by significant difficulty and complexity, has been approached through various methodologies and datasets over time. For the purpose of this study, the Inria dataset was employed, and the use of multiple architectures within the model’s encoder was analyzed to improve the results. Additionally, to prevent incorrect training and minimize the risk of negatively affecting the outcomes, erroneous data containing image-mask mismatches were removed prior to training the model. This step was crucial to ensure that the results were not adversely influenced. Considering the results of several studies that utilized the same dataset, it is reasonable to assert that the removal of inaccurate labels positively impacted the study's performance. Moreover, the findings from previous research, along with the experiments conducted during model training, revealed that the models performed more efficiently and successfully when the image size was reduced.
During the course of the project, four distinct encoder variations were considered for testing with U-Net: ResNet-50, SE-ResNet-50, ResNeXt-50, and SE-ResNeXt-50. The ResNet-50 encoder was used in conjunction with the DeepLabv3+, Attention U-Net, U2Net, and UNet++ models, resulting in a total of eight different models being tested. This approach ensured precision and accuracy. Through the utilization of transfer learning, this objective was successfully achieved. A wide range of standard metrics, derived from previous research, were used to evaluate the results of both the training exercises and the assessment phase. The DeepLabv3 + model achieved the highest performance using the ResNet-50 encoder. The Attention U-Net model, which achieved the second-highest performance, came in second place. In contrast to models using SE-ResNet-50, ResNeXt-50, and ResNet-50 encoders, the U-Net model with the SE-ResNeXt-50 encoder demonstrated higher efficiency in achieving the desired results. On the other hand, the U2Net and UNet++ models performed somewhat less successfully compared to the other models.
The models performed well in situations characterized by the absence of populated areas, buildings with simple shapes, industrial zones, images with significant forest coverage, and environments where buildings had generally similar shapes. In these cases, the models generally showed good performance. However, their performance was significantly hindered by the presence of various challenges, including diverse architectural designs in industrial, office, and residential areas, structures with internal voids, roofs with colors resembling the ground, trees obstructing building views, images taken from oblique angles, and common issues such as shadow and reflection effects. While there were some successful detections in these challenging images, the classification results were generally unsatisfactory due to numerous false inferences that negatively affected the outcomes.
The presented study focuses on aerial images acquired by a specific sensor, with the dataset also provided by the same sensor. Generalization challenges may arise when using images captured by different sensors due to variations in radiometric and/or geometric resolution. Additionally, the dataset consists of images of buildings located in urban and industrial areas in Europe and America. The performance of the study may be limited to buildings with architectural characteristics distinct from those in these regions. However, incorporating buildings from such regions into the training process could enhance the study’s performance for these areas. Furthermore, employing domain adaptation methods can ensure compatibility between newly added data and the existing dataset.
In order to provide useful results, a future study needs to take into account the dataset, which is one of the most significant aspects that must be taken into consideration. There should be a significant number of images included in the dataset, and also, the images should be of a high quality. In addition to that, the collection must to encompass a variety of metropolitan environments. To get the results that are wanted, it is necessary to ensure that the masks and reference photos are perfectly aligned. The model that is chosen and the hyperparameters that are set during the process are two additional essential aspects that are taken into consideration. Either by conducting several different experiments or by doing an analysis of earlier cases that are comparable, the model ought to be selected with great care.
This study examines the generalization performance of trained models across different datasets, recognizing that limitations in generalization are inevitable due to variations in the geometric, spectral, and radiometric resolutions of sensors/cameras, as well as differences in building types across study areas. From a geometric resolution perspective, adapting building segmentation datasets derived from aerial images with resolutions ranging from 0.07 to 0.50 m to satellite-based datasets with resolutions ranging from 0.3 to 4.0 m presents a significant challenge. In addition to resolution, generalizing datasets that include rural areas, such as LandCover and OpenAI, to those featuring complex urban structures, like INRIA and SpaceNet-7, adds another layer of difficulty.
It is possible that future research will be able to provide significant assistance to post-disaster search and rescue operations by incorporating the recognition of structures from photos and the identification of building IDs. It is possible that this help will contribute to the ascertainment of the number of buildings that have been destroyed or other data that is considered relevant.
Additionally, to enhance system performance, it would be beneficial to include images obtained from different sensors in the training data and incorporate buildings with diverse architectural styles from various geographic regions.
Footnotes
Authors’ contributions
Serdar Ekiz contributed to conceptualization, software, and data curation. Ugur Acar contributed to formal analysis, investigation, writing‒review and editing, methodology, supervision, and visualization.
Data availability and access
The authors confirm that the data supporting the findings of this study are available within the article.
Declaration of conflicting interests
The authors declared no potential conflicts of interest with respect to the research, authorship, and/or publication of this article.
Funding
The authors received no financial support for the research, authorship, and/or publication of this article.
Ethical approval
Data usage should not cause harm to individuals or communities.
Informed consent
Clear and open communication regarding data collection, storage and usage practices is essential to establish trust and accountability.