Bacterial meningitis is a severe infection affecting the protective membranes of the brain and spinal cord, with rapidly worsening symptoms that can lead to life-threatening complications. This study presents an autonomous deterministic epidemic model, , to explore the dynamics of bacterial meningitis in a community implementing control strategies like media coverage, early diagnosis, isolation, and treatment. We adjust the transmission probability based on media coverage and calculate the effective reproduction number, , which includes contributions from asymptomatic and symptomatic individuals . We derive the basic reproduction number, , to characterize initial infection spread and analyze the local stability of infection-free and endemic equilibria, using the Routh-Hurwitz criteria. For global stability, we apply Castillo-Chavez method for the infection-free equilibrium and the Lyapunov functional technique for the endemic equilibrium, after a uniform persistence study. A local sensitivity analysis evaluates the impact of each parameter on the threshold dynamical parameters and . We also explore an optimal control problem using Pontryagin's maximum principle. The paper concludes with numerical simulations that bridge theoretical and numerical findings.
The exploration of bacterial meningitis has gained notable attention in the field of mathematical epidemiology, driven by its severity and the rapid transmission dynamics within populations.
Meningitis, also known as cerebrospinal meningitis, is a serious infection marked by the inflammation of the meninges (the protective membranes surrounding the brain and spinal cord). Key symptoms include heightened sensitivity to light, intense headaches, neck stiffness, difficulty in feeding, elevated fever, lethargy, persistent crying in infants, and nausea. The impact of meningitis remains a major public health challenge, even though there have been a considerable effort in reducing the spread, through vaccination and treatment. Meningitis and sepsis are estimated to cause more deaths in children under the age of five than malaria.1 The annual global disease induced deaths due to meningitis is about 380,000.1,2 Recovered individuals can present severe abnormalities with appreciable social and economic cost, these sequelae may occur in 10% to 20% of survivors.1,2 The types of infectious meningitis are: Fungal, Parasitic, Amebic, Bacterial, and Viral. The most severe forms are bacterial and viral meningitis. Viral meningitis is serious but mostly self-limiting, whereas bacterial meningitis usually requires prompt medical attention.2
Bacterial meningitis can be transmitted from one individual to another, although certain pathogens, such as Listeria monocytogenes, may also spread through contaminated food sources. If not treated promptly, this infection can be fatal, with mortality rates ranging from 5% to 10%, often occurring within one to two days of symptoms onset. Without appropriate treatment, the death rate can reach up to 50%. Between 1991 and 2010, nearly one million suspected cases were reported, predominantly in countries within the African Meningitis Belt, resulting in approximately 100, 000 deaths, of which 79, 292 of these cases occurred in 2009 with 4, 288 deaths in 14 African countries under the enhanced surveillance.2,3 During the 2014 and 2013 epidemiological season there were 14, 317 suspected cases with, 1, 304 deaths in 19 African countries, 12, 464 cases with 1, 131 deaths in 18 African countries, this is relatively considered as a mild meningitis epidemic period, since 2005 (see1–3 for a brief report). The most common forms of bacterial meningitis are meningococcal meningitis and Haemophilus influenzae type b (Hib). Hib is responsible for large outbreaks in sub-Saharan Africa and primarily affects people between the ages of 1 and 30..1,4 An outbreak of meningococcal meningitis resulted in 11, 000 deaths in the slums of Brazil, during the period of 1974−1978, and left about 75, 000 persons with permanent neurological complications.4,5 In the Sahel region of West Africa, an outbreak resulted in 25, 000 deaths during the 1996−1997 epidemic season.1,6 Also, there are about 1400–3000 annually reported cases of invasive meningococcal disease in U.S..2,4,7 Meningococcal meningitis is caused by the bacterium Neisseria meningitidis. Twelve types of Neisseria meningitidis have been identified and called serogroups. Of these 12 serogroups, six (A, B, C, W, X, and Y) can cause an epidemic.1 There are some vaccines available against the three main bacterial meningitis (Nerisseria meningitidis, Haemophilus influenzae type b and Streptococcus pneumoniae).18–10 However, there is no vaccine yet against group B streptococcus (Streptococcus agalactiae).1,4,9,10 In May 2018, the WHO launched the “Defeating Meningitis by 2030” initiative, outlining a strategic framework to combat meningitis outbreaks. This framework focuses on prevention and epidemic control, improved diagnosis and treatment including the development of rapid diagnostic tests-disease surveillance, advocacy and information dissemination, as well as support and aftercare for survivors.1,11,12 Also, studies on meningococcal disease control, including the WHO's 2019 guidelines on meningitis outbreaks (reporting 60−85% transmission reduction via droplet precautions and 24-h isolation post-antibiotics) and Borrow et al.'s 2017 retrospective analysis (showing 75% efficacy in preventing UK secondary cases through chemoprophylaxis and isolation compliance), highlight the strong impact of these interventions.13 Furthermore, media coverage plays a vital role in the fight against epidemic or pandemic of communicable diseases, especially in the earliest moments of the outbreak.11,12,14,15 It plays an educational role helping to raise the level of awareness by broadcasting information about the epidemic spreading mechanism and how to behave properly. Therefore, various researchers have developed mathematical models to assess how media coverage influences the transmission dynamics of infectious diseases, utilizing different media functions based on available data. In the context of modeling the impact of media coverage on disease transmission dynamics, two primary approaches are prevalent.16–18 One method involves treating the transmission term or effective contact rate as a variable function rather than a constant, allowing feedback to adjust transmission likelihood based on the number of infected individuals. For example, Liu et al.12 utilized a complex network model in their EIH framework, where H represents hospitalized individuals, and defined the transmission coefficient as . Additionally, G. P. Sahu et al.19 explored the dynamics of an SEQIHRS epidemic model incorporating media coverage, quarantine, and isolation measures within a community. In their proposed model, they have used a media-induced transmission rate of the form , where is the contact rate between susceptible and infectious persons and the coefficients and represent the non-pharmaceutical interventions of media coverage targeting infectious and isolated individuals respectively. Furthermore, P. Song and Y. Xiao11 investigated the impact of media on an epidemic model by incorporating the following media function , I representing infected individuals and m a positive constant. The other approach of considering the feedback effect from social media is to treat it as an independent state variable within the model as in Ref.20, where M denotes the magnitude of media coverage, in Ref.21 or proposed by AK Misra et al.,15A denoting the awareness of the population. In light of these previous works, we propose an optimal control model for bacterial meningitis which is treatable to study the impact of the media coverage, early diagnosis, isolation and treatment in both the carrier and infected stages of the disease herein represented by and , respectively, and the impact of the disease dynamics within hospitals. We utilize the media function defined as and in this expression, denotes the effective contact rate between susceptible S and symptomatic infectious , while the non-negative parameter m quantifies the psychological effects of media coverage on symptomatic individuals . This formulation captures how media reporting can shape public perception and behavior in response to disease prevalence.
As part of efforts to combat bacterial meningitis, Asamoah et al.4 proposed an SCIRS model of bacterial meningitis transmission incorporating a standard incidence function and a nonlinear recovery rate. Their study focused on the impact of antibiotic efficacy and vaccine use. They further conducted an optimal control analysis under endemic conditions in resource-limited settings characterized by a limited supply of antibiotics and hospital beds by investigating the effects of inoculation. Similarly, Peter et al.22 developed a mathematical model of the SVEIQRS type using ordinary differential equations (ODEs), which they extended to fractional order to explore the dynamics of meningitis. Their work examined how vaccination and treatment influence transmission dynamics as functions of various fractional parameter values.
Belay et al.23 introduced a deterministic -type model to perform an optimal control study of bacterial meningitis dynamics, focusing on the cost-effectiveness of three control measures: prevention, treatment, and screening. They evaluated different combined control strategies to assess their impact on disease spread and associated costs. Simulation results indicated that maximizing prevention and screening efforts constitutes the most effective strategy. In addition, Sahar et al.24 addressed the optimal control of meningococcal meningitis transmission using an -type model with a linear incidence function. They employed two control measures (vaccination and treatment) to minimize infections, and performed numerical simulations to demonstrate the implementation of these strategies.
Moreover, Amar et al.25 studied a deterministic SCITRS-type model of meningitis transmission, considering vaccination and screening as intervention methods. Using the fourth-order Runge-Kutta method, they confirmed the steady-state stability results and showed that vaccination and screening significantly affect meningitis transmission dynamics. Other mathematical studies have also been conducted within this framework, addressing various objectives (e.g. Refs.21,26).
Using the first approach of integrating media coverage so that the force of infection induced by asymptomatic carriers is given by and taking into account most of the mechanisms involved in the current dynamics of meningitis, this study introduces a novel compartmental structure to advance meningitis transmission modeling. This allows us to assess the impact of large-scale awareness-raising efforts through media coverage, early diagnosis, isolation of asymptomatic carriers and symptomatic infectious individuals for treatment, self-medication, and recovery through hospital treatment on the dynamics of the disease. Our optimal control model takes into account early diagnosis and treatment administered after isolation in order to highlight the impact of good monitoring of the disease dynamics by health structures, in order to limit its spread. Furthermore, as mathematical modeling can provide insight into certain measures using qualitative analyses and numerical simulations, we hereby aim to evaluate the effectiveness of WHO-recommended interventions1,8 in controlling meningitis spread and meet the target of eradication by 2030. Hence, we believe that this research will give some further insight on how to effectively control the disease, using the media, early diagnosis and treatment.
Model development
In this study, we consider the disease dynamics in a homogeneous population that is structured in five compartments: Susceptible , Asymptomatic carriers , Symptomatic infectious individuals , group of individuals receiving medical care in isolation denoted by and Recovered (self-medication or hospital based treatment) individuals. Therefore, represents the total population at any time t. We assume that, early diagnosed carrier and ill individuals enter into the hospitalized group at the rate and is the effective diagnosis rate at the asymptomatic stage, is the treatment efficacy. Individuals in the isolated for treatment (self-medication or hospital-based prescriptions) are treated at the rate and are assumed to move to the recovery stage, is the rate of natural recovery at the carrier state, and is the rate at which carrier individual progress to the ill compartment. The assumed rate of natural death in all the compartments is denoted by and, and are the disease induced death rate at the symptomatic infectious and hospitalized compartments, respectively. It is known that recovered individuals do not attain permanent immunity against bacterial meningitis after recovery from infection,22–25,27 hence we assume as the rate of regaining susceptibility after recovery. The influx of individuals into the population is assumed to join the susceptible compartment at a rate , which represents the recruitment rate that includes both new births and immigrants. We also assume that the hospitalized individuals are perfectly isolated so they have no chance to infect people. The parameters and represent the effective contact rate of susceptible population with asymptotic carriers and symptomatic infected people, respectively. However, the coefficient m represents the impact of media coverage to the contact for symptomatic infectious individuals. The proposed model is illustrated by the schematic flow chart presented in Figure 1.
Schematic flow chart of the proposed model for bacterial meningitis with the incidence function given by .
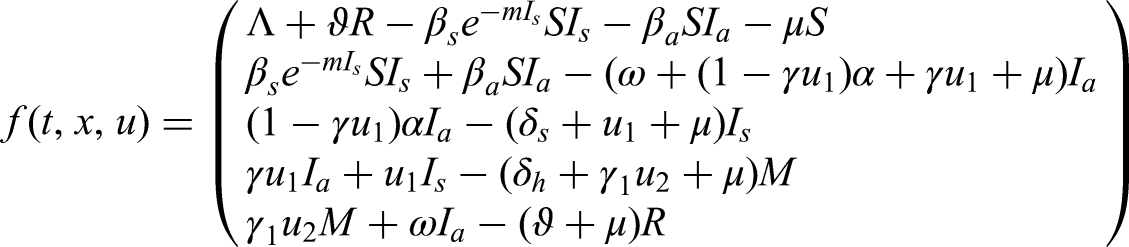
Using the aforementioned descriptions and assumptions, and by applying the input–output balance from the flow chart of Figure 1, the dynamics of the disease are described by the following system of ODEs:
with initial conditions
Descriptions of all the parameters of the model are subscribed in Table 1.
Model parameter description.
Parameter
Description
Unit
Recruitment rate (births and immigrants)
humans/day
Rate of effective contact between susceptible and symptomatic ()
day−1
Rate of effective contact between susceptible and asymptomatic ()
day−1
Rate of natural mortality
day−1
Disease death rate of symptomatic infectious ()
day−1
Disease death rate among hospitalized patients ()
day−1
Early diagnosis control parameter
day−1
Early diagnosis efficacy parameter of asymptomatic carriers
day−1
Treatment rate of hospitalized
day−1
Treatment efficacy
day−1
Natural recovery rate of symptomatic carriers
day−1
Transition rate from the compartment () to compartment ()
day−1
Immunity loss rate
day−1
Average waning period of disease-induced immunity
day
Influence of media coverage on symptomatic infection contact
day−1
Mathematical analysis of the model
Results on positivity invariance and boundedness
Note that
This study focuses solely on solutions with initial conditions within the following biologically viable set, ensuring the existence, uniqueness, and continuation of solutions:
Furthermore, it is easy to show the boundedness and the positively invariant of the region Γ with respect to system (1).
(1) that begin within the set will either approach, enter, or remain within the interior of .
Let denotes the non-negative cone in the Euclidean space of dimension 5. From system (1),
and are continuous functions of t. Therefore, the vector field on each bounding hyperplane of directs inward, ensuring that all solution trajectories starting in will remain within it at all time. As a result, is positively invariant for system (1). Moreover, from equation (2), we have and then have By applying Birkhoff's and Rota's theorem on differential inequalities,15 we find that as the inequality holds. This indicates that the solution of system (1) is bounded, ensuring that any solution originating from will remain within .16–18
Local stability analysis of the disease-free equilibrium
In this section, we calculate the disease-free equilibrium and the effective reproduction number We also examine the local stability of the The non-negative matrix , representing the new infection terms, and the matrix , which encompasses the remaining terms, are defined as follows:
Linearizing both matrices at the leads to the following matrices:
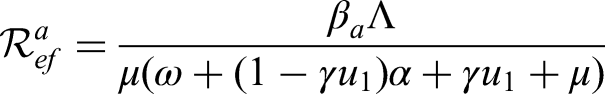
The effective reproduction number is the largest eigenvalue of the next generation matrix. Therefore,
where
and
From equation (3), it is clear that the threshold quantity for our proposed model system consists of two parts, which means that there are two different transmissions routes; one from the asymptomatic carriers and the other from the symptomatic infectious individuals . In the realm of infectious disease epidemiology, the concepts of basic and effective reproduction numbers are fundamental to understanding the dynamics of disease transmission. While often used interchangeably, these two metrics have distinct implications for public health policy and control intervention strategies.
The basic reproduction number represents the average number of secondary cases generated by a single infected individual in a completely susceptible population, absent any immunity from past exposures or vaccination. This metric provides a measure of the intrinsic transmissibility of a pathogen, reflecting its ability to spread in a population with no prior immunity.
In contrast, the effective reproduction number represents the average number of secondary cases generated by a single infected individual in a population with some level of immunity, either from past exposures or vaccination, and in the presence of intervention measures including contact tracing, quarantine, or vaccination campaigns. This metric takes into account the impact of these interventions on the transmission dynamics of the disease.
Therefore, setting which means there is no isolation, no early diagnosis, no treatment within the community, one can drop the expression of the basic reproduction number as follows:
where
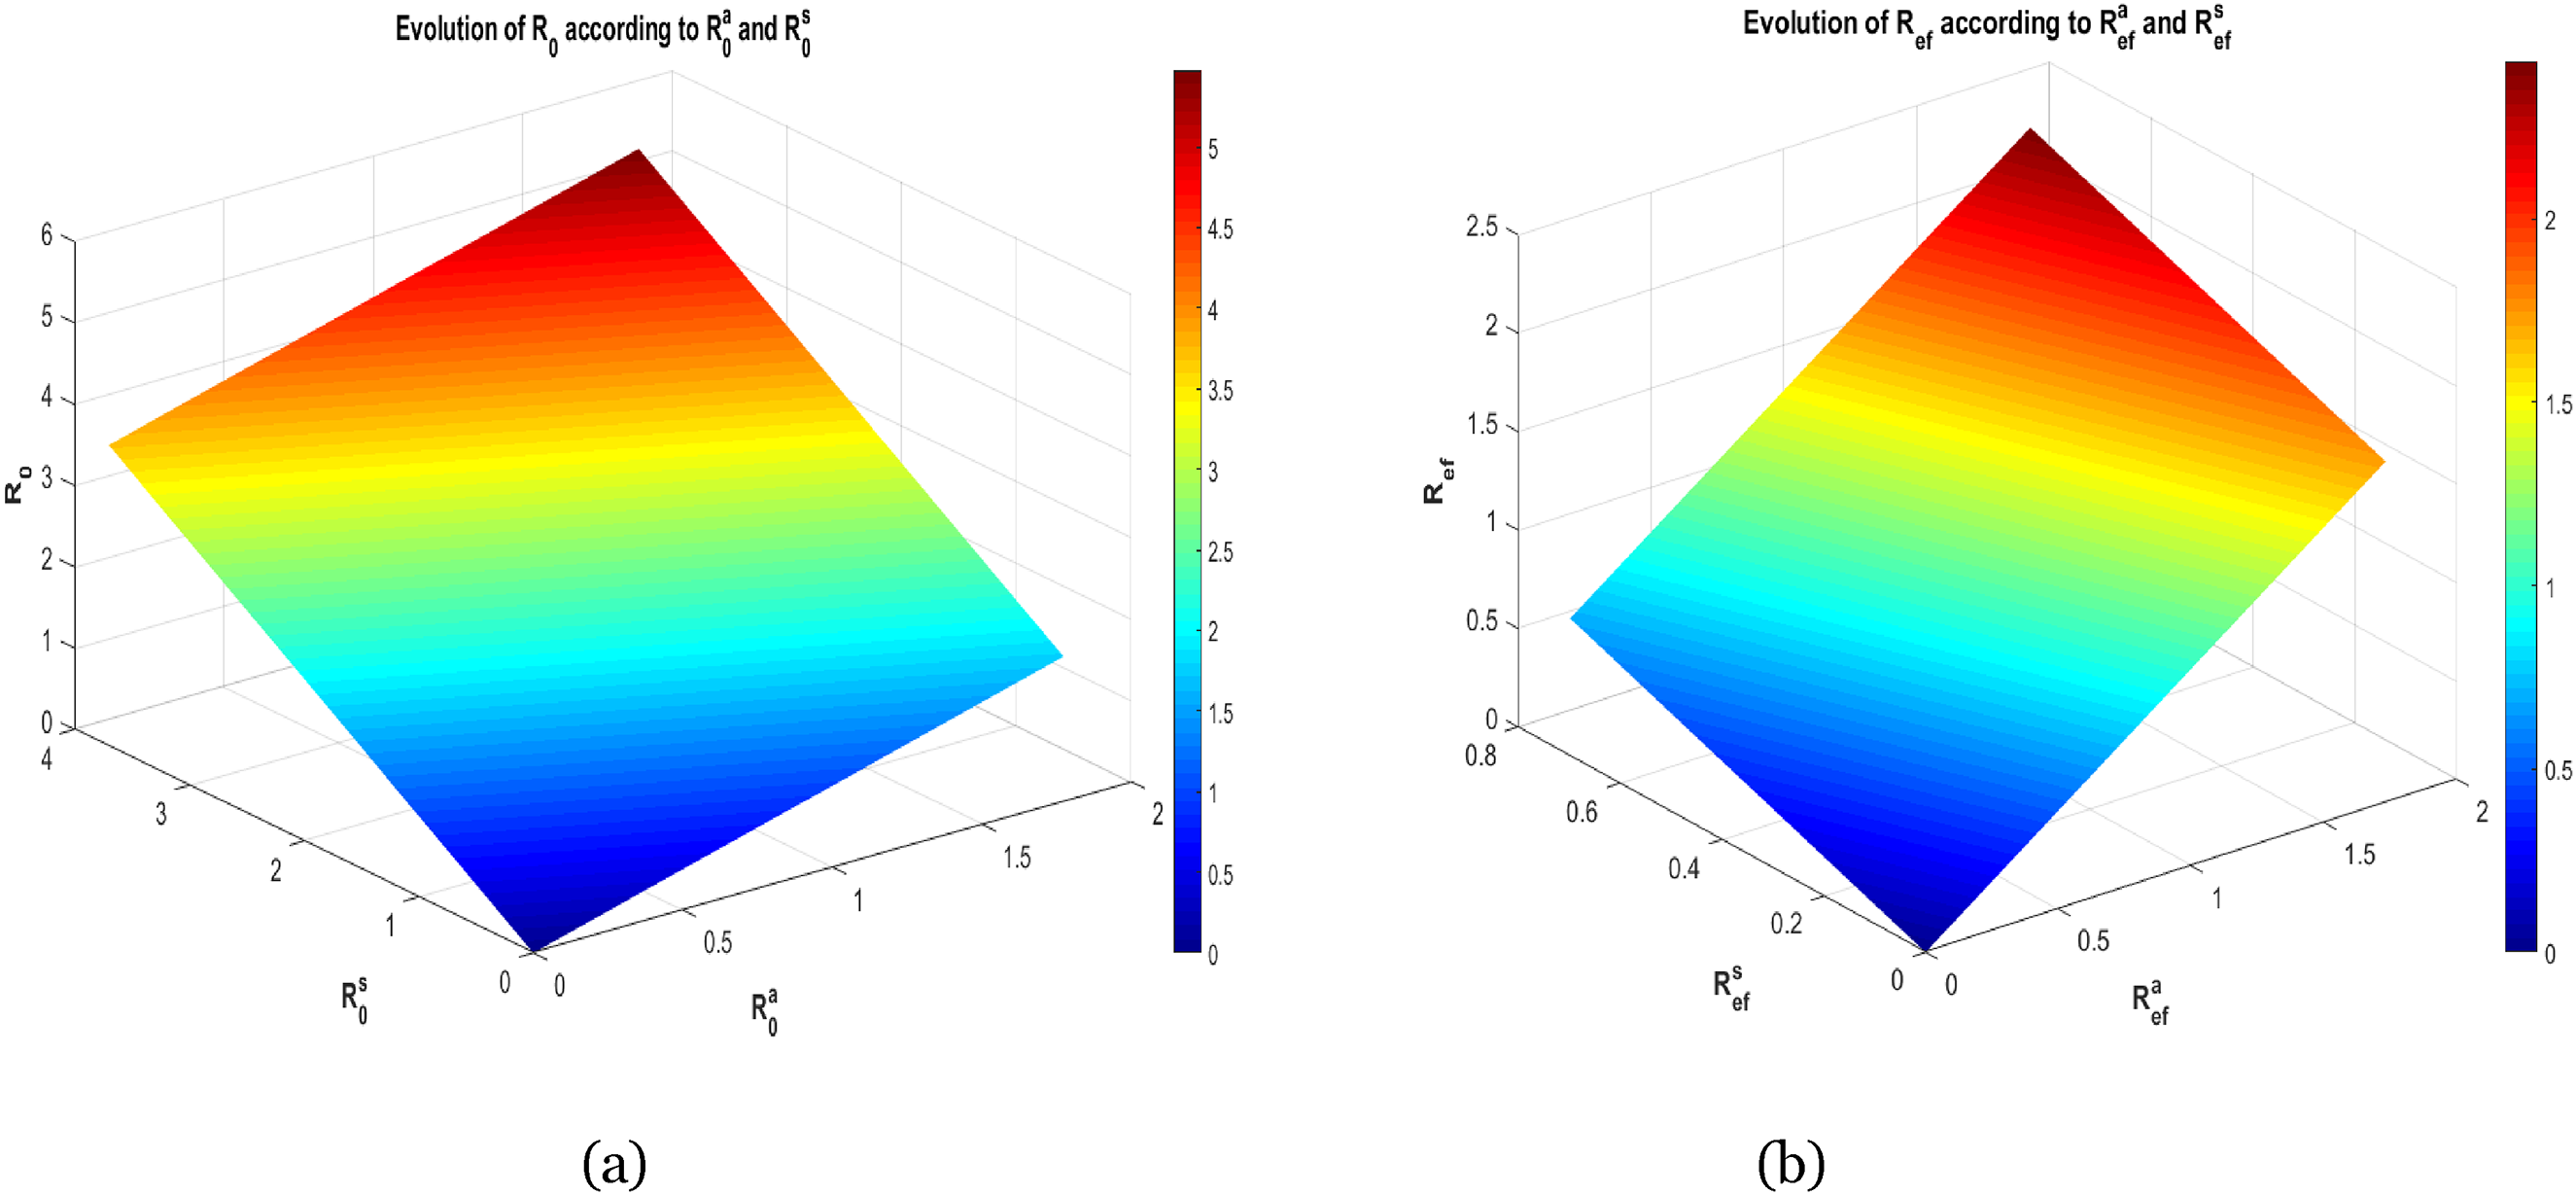
In Figure 2, we show the evolution of and as a function of multivariable.
(a) Variation of as a function of and , (b) variation of as a function of and .
From Theorem 2 in Ref.,28 the following result holds:
meningitis-free equilibrium of system (1) exhibits local asymptotic stability when < 1, while it transitions to instability when > 1.
In the sense of epidemiology, this result means that if the effective reproduction number , then the influx of a few infected individuals will not generate large outbreaks (and the disease will die out) whereas the disease outbreak will occur if
The global stability analysis
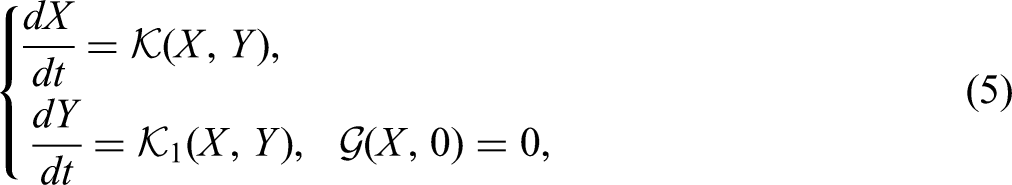
To establish the global stability of the disease-free steady state, we use the method developed by Castillo-Chavez et al.29 For that, we rewrite the system (1) in the following form:
where represents the number of uninfected individuals and denotes the number of infected individuals that comprises asymptomatic carriers, symptomatic infectious and people isolated with medical care. The disease-free equilibrium hereby denoted by is globally asymptotically stable if the following conditions are satisfied:
(H1) for is globally asymptotically stable,
(H2) for ,
and is Metzler stable. Whenever our model system (1) of differential equations describing the disease spreading dynamics within the population obeys hypothesis (H1) and (H2), then the infection-free point is a globally asymptotically stable steady state of the mathematical model provided when .
This is better expressed by the forthcoming result:
, then the disease-free equilibrium point is globally asymptotically stable.
Thus, for any value of the initial condition , it follows that as
Therefore, is globally asymptotically stable. Hence, condition (H1) is satisfied.
Now, let us consider the infected compartment of the meningitis given by
where,
and
Since , it is easy to see that the matrix is Metzler stable. Furthermore, for all and , therefore
This proves that the condition (H2) is satisfied. Hence, the disease-free equilibrium is globally asymptotically stable whenever .
Presence of the endemic steady state and its local stability
Setting the right-hand side of the system (1) to zero, we obtain the endemic equilibrium point as so that
where satisfies the following equation:
Indeed,
for
Besides,
with
Furthermore, we make the following assumption:
(H3)
Therefore, is a continuous function with and Thus, admits a zero within the interval . However, thanks to the assumption (H3), equation (11) gives which shows the concavity of the function on Consequently, we have the uniqueness of the zero of on and then the model has a unique endemic equilibrium.
And the following result holds:
(H3) is satisfied and if , then model (1) has a unique positive endemic equilibrium
is locally asymptotically stable whenever under the condition thatand the Routh-Hurwitz determinantsare positive.
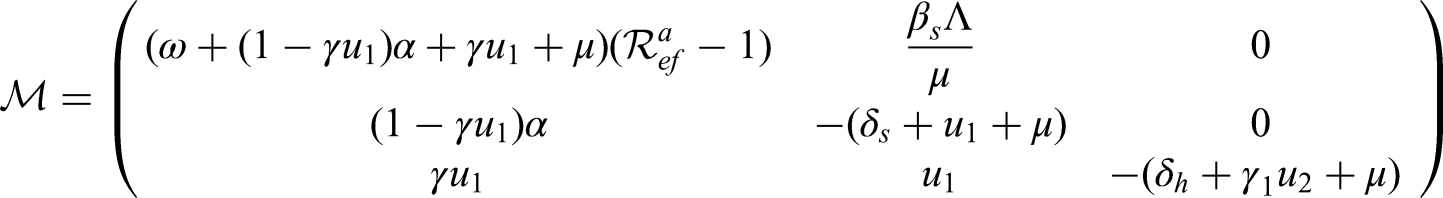
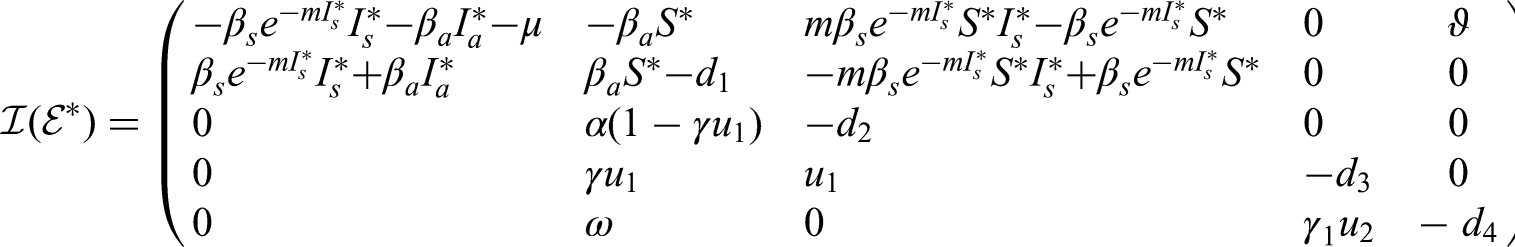
Let and . The Jacobian matrix of System (1) at endemic equilibrium is given by
and its eigenvalues are the roots of the following polynomial equation:
where
Now, applying Routh-Hurwitz criterion one can see that the following conditions are necessary for the existence of negative roots or negative real parts of the roots of the polynomial equation (12)
Consequently, the endemic equilibrium is locally asymptotically stable whenever
Uniform persistence
For the proposed model, the meningitis disease endemicity occurs if asymptomatic carriers, symptomatic infected and people undergoing medication fraction of the population persists above a certain positive level for sufficiently large time. This phenomenon can be well captured and analyzed through the notion of uniform persistence. And, system (1) is said to be uniformly persistent if there exists a constant such that any solution with initial conditions satisfies
Consider the subsystem of the infected states of system (1) as follows:
and
where the boundary of Let be the flow on generated by the solution of model (14) with the initial condition
If, then the flowonis uniformly persistent for any Solutionswith the initial condition
Proof. We stated in Theorem 3.1 that the disease-free equilibrium is unstable when Besides, one previously established that , then there exists such that
Consequently, from model (14) we deduce the following auxiliary system:
Let
where
with
and
One can see that is the maximal invariant set of the flow on . By analyzing the model system (1), we obtain that consists of a unique equilibrium on the boundary Hence, the infection-free represents an acyclic covering of the set
Now, let us analyze the behavior of any solution of model (1) close to the disease-free point For that, we classify the initial conditions in two cases:
If then Therefore, from System (16), we can see that any solution of model (1) tends to
If and then by Proposition 3.1 and If the solution is close to , according to system (1), there exists such that
However, the largest eigenvalue of the matrix B is positive since .4,15,28 Hence, the solutions of the quasi-monotonic linear system
with positive initial conditions are exponentially increasing as By applying the comparison principle, we can see that diverges from when
Therefore, is an isolated invariant set of the flow Thanks to the Theorem 4.3 in the work by Freedman et al.,30 model (1) is uniformly persistent if . This completes the proof.
Global stability analysis of endemic equilibrium point
In this subsection, we investigate the global stability of the endemic equilibrium point.
of model (1) is globally asymptotically stable when.
Let us make use of the following Lyapunov candidate:
It is clear that for all and at the endemic equilibrium point,
Now, by differentiating with respect to time t alongside the solution path of the model (1), we obtain:
However, one can easily notice that is semi-negative definite. Thus, is a Lyapunov Function. Consequently, with equality only at It then follows by LaSalle's invariance principle that the largest invariant set , such that is the singleton , this implies that the unique endemic equilibrium point is globally asymptotically stable.
Numerical results and sensitivity analysis
This section of the manuscript is devoted to the numerical simulation of model system (1) for both disease eradication (when and ) and its persistence (when and ) and local sensitivity analysis of the threshold parameter and that compose . In Table 2, we give the values of the parameters used to illustrate the cases of disease extinction and persistence. To begin, we will first examine the scenario in which no control measures are implemented, specifically when (see Figures 3 and 4). Next, we analyzed the case where control measures are applied at fixed levels, with and (see Figures 5 and 6).
Simulations of model (1) in the case of disease extinction and without control measures ; when
Simulations of model (1) in the case of disease persistence and without control measures ; when
Simulations of model (1) in the case of disease extinction, with control measures and ; when
Simulations of model (1) in the case of disease persistence, with control measures and and
Figures 3 and 5 display the evolution of the susceptible individuals, asymptomatic individuals, symptomatic infectious, hospitalized people and recovered ones when and , respectively. One can observe that in both cases susceptible population tends to while all the remaining state variables die out. This corroborates Theorem 3.2. However, when control measures are being implemented (Figure 5) the compartments , , M, and R populations will rapidly die out compared to the case where there is no control (Figure 3).
Figures 4 and 6 show the bacterial meningitis disease persistence within the population for and , respectively. By considering the time-level up to 60 units (days), both susceptible individuals, asymptomatic individuals, symptomatic infectious and recovered persist within the population which corroborates Theorem 3.6. Moreover, Figures 5(d) and 6(d) represent two interesting situations: Figure 6(d) shows that in absence of rapid diagnosis and treatment, the hospitalized population will decrease to zero as time goes. However in the scenario (Figure 6(d)), where rapid diagnosis and treatment are both implemented up to 55% and 45%, respectively, the population of hospitalized patients will grow and reach some stability, which is well in keeping with Theorem 3.6.
Figure 7 displays the dynamics of asymptomatic people , symptomatic infectious , and isolated people M, for and Clearly, the psychological impact of media coverage on people has an important impact in terms of slowing down the propagation of the disease transmission dynamics.
Simulations of model (1) in the case of disease persistence and use of control measures and ; with and without media coverage influence on contacts of symptomatic infectious persons.
Sensitivity analysis of and
The sensitivity analysis examines how variations in model inputs influence the model's outputs. Typically, two types of sensitivity analyses are conducted: local and global sensitivity analysis.
In this subsection, we focus on local sensitivity analysis, specifically through the lens of the effective reproduction number. For a parameter (p) that appears in both and , we compute the sensitivity index using Chitnis's normalized forward sensitivity index4 as
Figure 8 represents the local sensitivity indices from Tables 3 and 4 of the threshold parameters and that are the contribution of asymptomatic and symptomatic infected individuals, respectively. One can see that the parameters that appear within and differently impact the disease dynamics. Therefore, increasing or will speed the disease spreading while an increase in and values will slow down the disease progression.
Local sensitivity diagram of (case (a)) and (case (b)).
Elasticity of with respect to various parameters.
Parameter
Symbol
Formula
Sensitivity index
1
1
Elasticity of with respect to various parameters.
Parameter
Symbol
Formula
Sensitivity index
1
1
with
By computing the sensitivity indices, we get for instance and that is increase in leads to a 0.4580% decrease in and a 1.1375% decrease in Also, and mean that a increase in leads to a decrease in and a decrease in . Similarly , which means that a increase in only leads to a increase in , and means that a increase in only leads to a increase in Similar interpretation can be done for the other parameters appearing in the expression of and
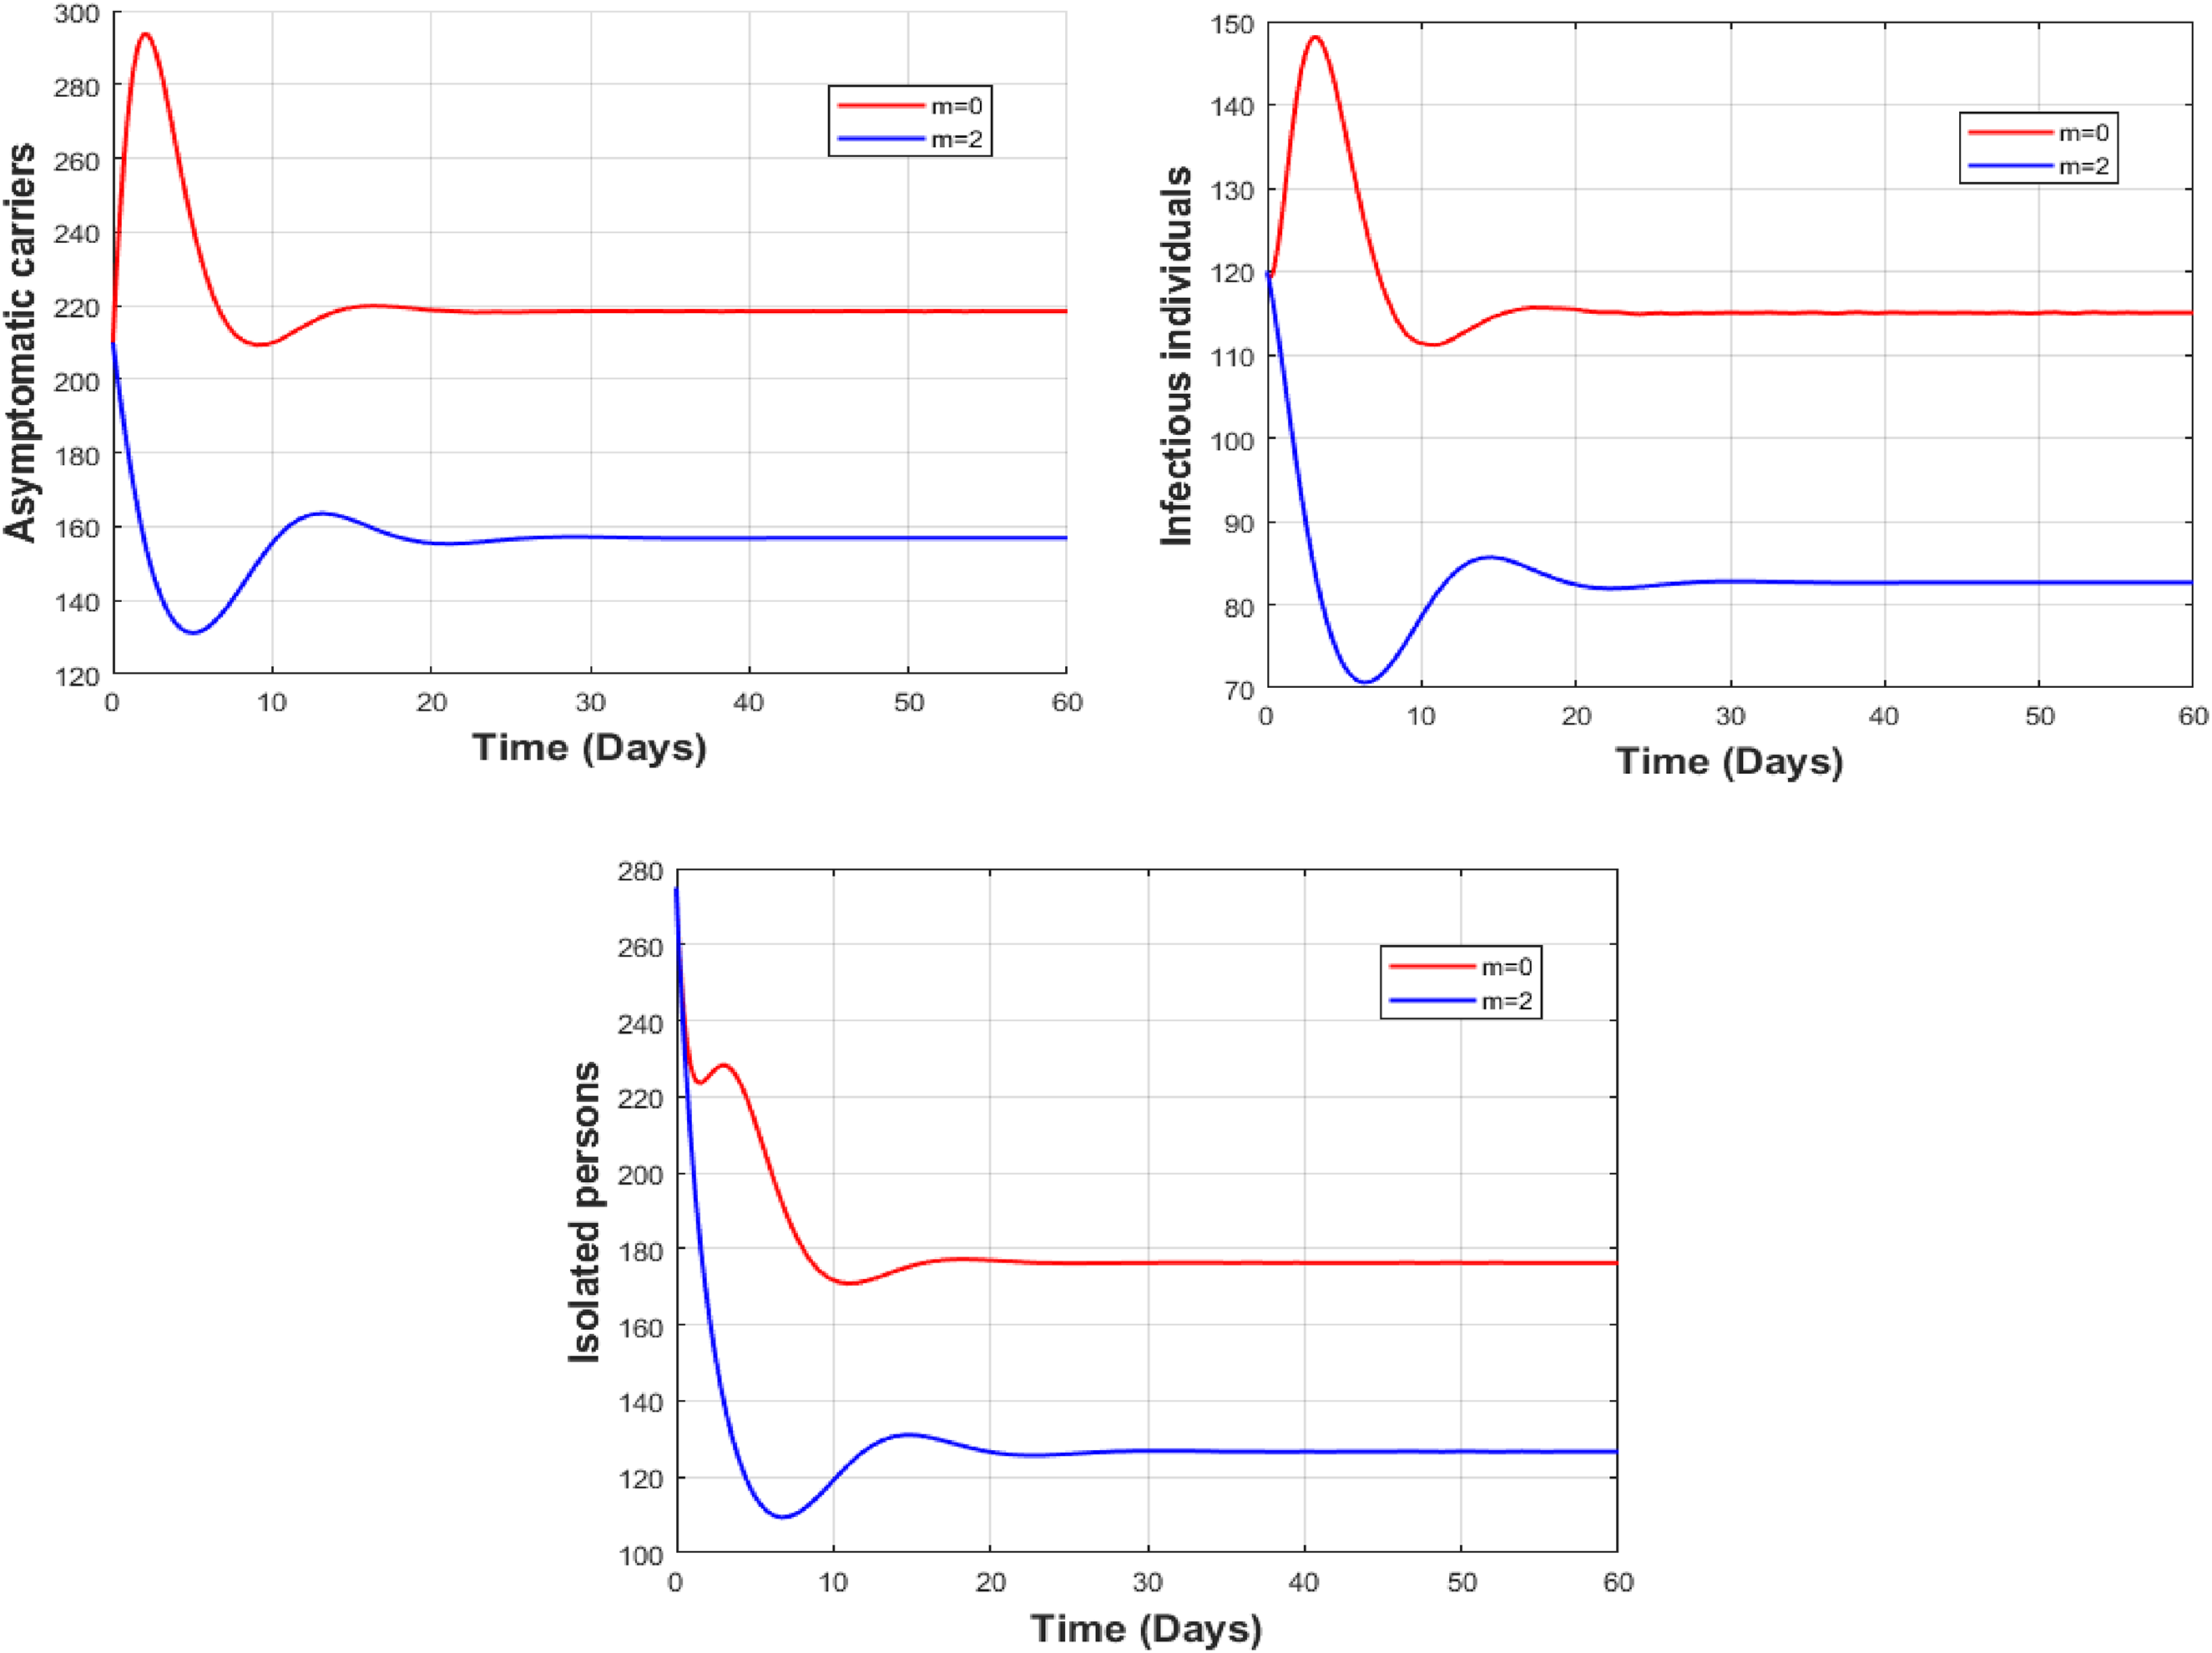
Figures 9 and 10 show the results of numerical simulations of model (1) for different values of and respectively, in situations where the disease persists. We observe that the higher the value of , the more asymptomatic carriers and symptomatic infectious populations decrease and the number of hospitalized individuals increases. Also, the higher the value of ω, the lower the number of asymptomatic carriers, symptomatic infectious individuals, and hospitalized individuals.
Simulations of model (1) in the case of disease persistence, with and varying the value of .
Simulations of model (1) in the case of disease persistence, with and varying the value of .
Optimal control analysis of the model when
In this section, our purpose is to investigate the dynamical behavior of the proposed model (1) using Pontryagin's maximum principle32 with a view to stemming the infectious population and keeping the requested cost of implementing early diagnosis and treatment of hospitalized people to the best bearable minimum. Otherwise, given that is the state variable of model (1) and are the control variables at any time t such that , then an optimal control problem consists of finding a piecewise continuous control and its corresponding state
Furthermore, the Lagrangian of the system (1) is given by
and the objective functional required to achieving this aim reads as
where are the balancing weight constant for the infectious individuals, are the weight constants for applying the control, and is the extent time frame for the control implementation. Further, the quantity represents the cumulative cost due to the disease and the quantity is the cumulative cost due to both early diagnosis and treatment of the infected people.
Therefore, using Pontryagin's Maximum Principle32,33 this optimizes the functional Then, we seek optimal controls and that minimize the functional as follows:
where Ωu represents the Lebesgue measurable control set defined as
It is important to note that, the condition implies that no control effort is being implemented while the condition is the maximal control effort that is needed to successfully curtain the disease dynamics. These two cases could somewhat be too idealistic to implement.
Existence of the optimal control
Assuming the existence of a non-trivial vector of adjoint or co-state variables satisfying the following conditions:
we achieve our goal by considering the Hamiltonian H for the control problem (1) expressed as
Now, by using equation (25) we derive the necessary conditions to the Hamiltonian H that our control functions and the corresponding state variables must satisfy.
(22) defined on the control set subject to the optimal control system (1) with non-negative initial data at , there exists an optimal control satisfying equation (23).
Given the control set and
be the right-hand side of our meningitis model (1).
Thanks to Fleming and Rishel Theorem,34 Theorem 5.1 hold if the following properties are preserved: The set of control is closed and convex, The model system (1) is bounded by a linear function in both the state and control variables, The Lagrangian of the objective functional (22) with respect to the control is convex and There exists constants and such that the Lagrangian is bounded below by
To establish the above properties we proceed as follows:
Looking at the definition of the set of permissible controls, it is obvious to see that it is a closed set. Now, consider two arbitrary points such that and Thanks to the definition of the convex set ex-rayed,34 given by
Consequently, implying that the control set is convex. Thereafter, property holds.
The proposed non-autonomous model (1) can be rewritten as a linear function of double control with respect to time and the coefficients of the dependent variables of the state system. This can only be achieved by using the explicit approach designed in Refs.33,35 coupled with the boundedness of the solutions of the state system as stated by Proposition 3.1. Consequently, the expression on the right-hand side of the model (1) is bounded above by a sum of bounded state and control.
Here, we investigate the convexity of the Lagrangian of the objective functional (22) given by equation (21) with respect to the controls. It is given as
where ,and . Therefore, for all , and , it then follows that,
and
Consequently, that leads to
Thus,
And thereafter the Lagrangian is convex.
This property can easily be checked throughout the expression of the Lagrangian given by equation (21) by letting and
This completes the proof of the existence of an optimal control with respect to our optimal control problem.
Characterization of the optimal control
In this subsection, we derive the necessary conditions for the characterization needed to minimizing the objective functional (22) using Pontryagin's maximal principle.32 Considering the Hamiltonian of the model (1), the following result yields
Given an optimal control measuresand the steady statesof the corresponding state system (1), there exists adjoint variablespreserving the co-state system given by
with the transversality conditions and the optimal control characterized as follows:
Proof. Indeed, differentiating the Hamiltonian of the system (1) with respect to the variables of the state system leads to
Moreover, to characterize the optimal control one solves through the following optimality conditions for
In addition, each control satisfies these standard control arguments involving the limits of the controls
for and with
Optimal control simulation
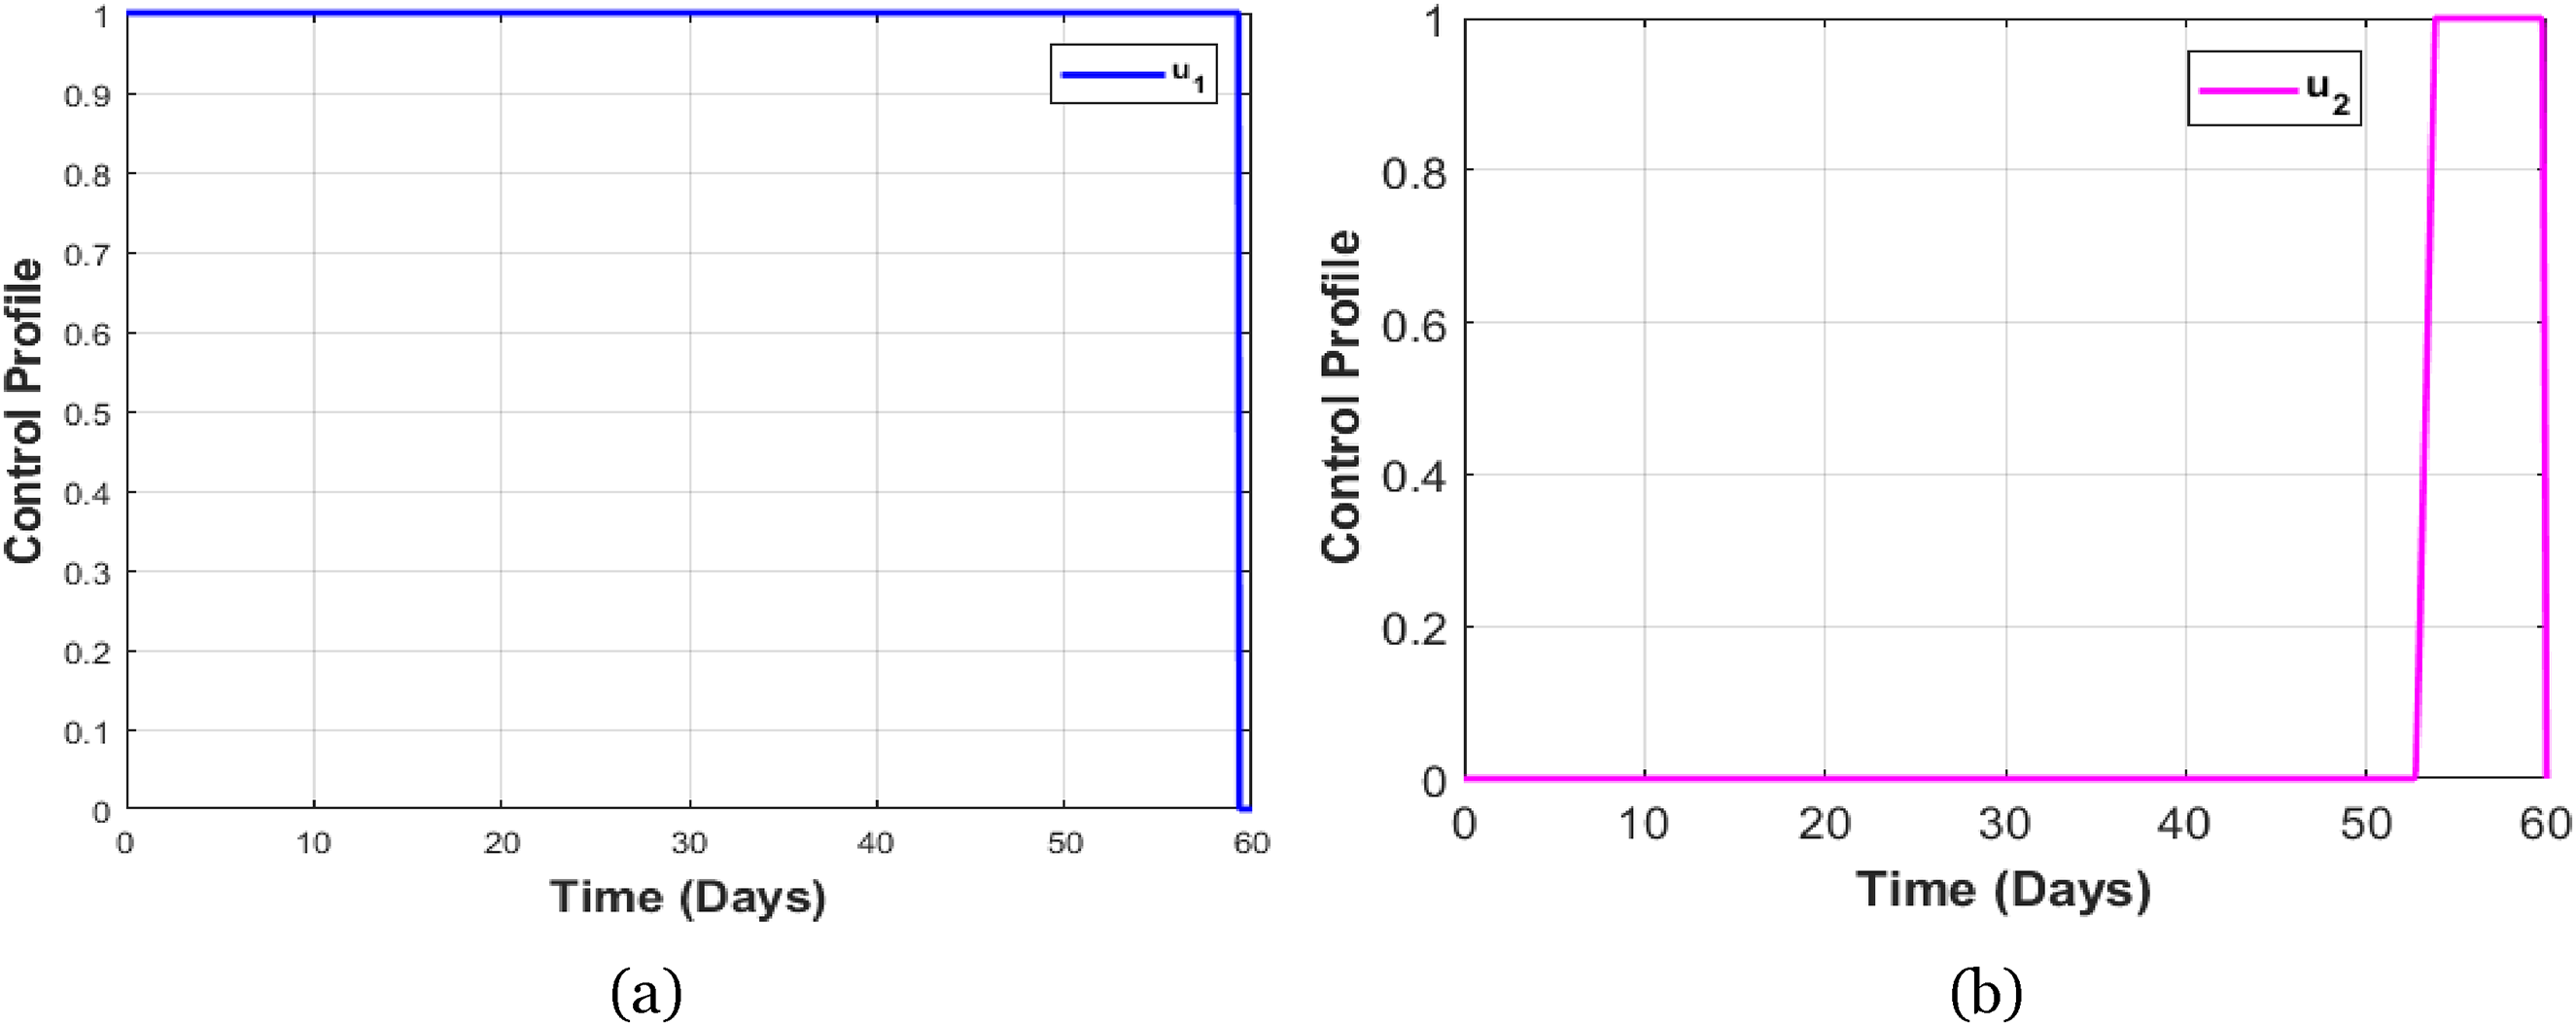
Here, we perform the numerical simulation of the optimal control model by employing the forward-backward iterative method. Besides, we consider a situation where the disease is persistent that is And, the weight values of the objective function (22) are given by and the initial conditions are given as follows: We also used the disease persistence parameter values given in Table 2. As stated before, two control measures are considered namely the control for early diagnosis and patients management in hospitals. Considering the importance of both of these two control strategies and their complementary effects, we display the impact of implementing them both together. We used the software MATLAB and the fourth-order Runge-Kutta iterative scheme to solve the optimal system (1)–(22) and the equations satisfied by the adjoint variables, in order to obtain the optimal control solution. First, the forward difference approximation is applied to solve the optimal system (1), then the backward difference approximation is used to solve the system (28), of equations satisfied by the adjoint variables, using the solutions of the current iterations of the state equations and considering the transversality conditions. Then, at each iteration, we update the control functions using the optimality conditions given in (29) and (30), then the iterations continue until convergence.23,24,33–36 For the readers convenience, we remind that we marked the dynamical behavior of the model without control by red lines and the dynamics with control are marked by blue lines. Figure 11 clearly shows that implementing some control strategies can slow the disease spreading. For instance, by the early diagnosis, asymptomatic and symptomatic infectious can be isolated for medication and prevent them sharing the disease (see Figures 11(b) to (d)). Moreover, the adjoint variables and the optimal control profiles are given in Figures 12 and 13, respectively.
Simulations of model (1) in the case of application of optimal control strategies ( and ) to a situation of disease persistence .
Adjoints variables.
Control profiles.
Discussion and conclusion
In conclusion, this comprehensive mathematical analysis highlights the critical role of various factors, including media coverage, early diagnosis, isolation, and treatment, in preventing the bacterial meningitis epidemic. Through the application of sophisticated methodologies such as the next-generation method to computing the effective reproduction number, the Castillo- Chavez theorem for the global stability of the infection-free point when , the Lyapunov functional technique for the global stability if , and the maximum Pontryagin principle to investigate the optimal problem, we have developed a robust and multifaceted framework that enhances our understanding of the complex dynamics involved in meningitis disease transmission and control.4,6,28,33
Our results reveal that timely and effective communication strategies are paramount to raise public awareness and encourage proactive health-seeking behaviors. The role of the media in disseminating accurate information cannot be overemphasized, as they help inform the public about the symptoms of bacterial meningitis, the importance of early diagnosis, and the steps to take in case of suspected infection. In parallel, rapid implementation of medical interventions, including isolation of affected individuals and appropriate treatment protocols, is essential to curb the spread of this serious infection.11,12,14
In addition, the local sensitivity analysis shows that the parameters whose variations induce more change in the value of are: the recruitment rate , the contact rate between susceptible individuals and asymptomatic carriers (resp. symptomatic individuals) (resp. ), the natural recovery rate of asymptomatic carriers , the rate at which asymptomatic carriers become symptomatic infectious individuals, followed by the early diagnosis rate . For this constructed model, the local sensitivity study then suggests that measures to combat bacterial meningitis should aim to reduce the values of the parameters and increase those of the parameters , and . Figures 9 and 10 are perfect illustrations of these conclusions. We also illustrated (Figure 7) that information relayed by the media can contribute to reducing bacterial meningitis infections if followed by the population. The study of optimal control and its numerical simulation reveal the possibility of curbing the spread of bacterial meningitis through early diagnosis and patient care, while minimizing the cost of implementation. However, to achieve these results, a synergy of actions would be required so that well-informed populations can be diagnosed as early as possible and infectious individuals can be isolated and treated for the benefit of all. This study provides a better understanding of the factors that influence the epidemic dynamics of meningitis. By modeling the interactions between the different components of disease spread, we can identify critical thresholds and optimal intervention strategies that public health decision-makers can employ. This analysis not only contributes to our theoretical understanding of bacterial meningitis epidemics, but also serves as a practical guide for developing targeted strategies to preserve community health.4,6
In summary, our study emphasizes the interdependence of media influence, healthcare accessibility, and rapid intervention in the fight against bacterial meningitis. By leveraging mathematical frameworks, we can better equip public health officials with the knowledge and tools needed to prevent future outbreaks, ultimately leading to better health outcomes and increased community resilience to infectious diseases.15,20,21
Looking ahead, this model can serve as a foundation for developing a bacterial meningitis model tailored to any specific country, situated within the meningitis belt incorporating factors like seasonality, spatial dynamics, vaccination, and age-structured. Using real data, it will enable to perform accurate simulations to inform recommendations that support refining the national strategy and achieving the target meningitis eradication by 2030.
Footnotes
Acknowledgements
The authors would like to thank their respective institutions and both the journal editor and the anonymous reviewers for their valuable comments, which contributed to strengthen the first version of the manuscript.
ORCID iD
Ousmane Koutou
Author contributions
Conceptualization: OK, KA, and ABD. Modification: OK, WO, and HO. Formal analysis: OK, KA, and WO. Investigation: OK and ABD. Writing—original draft: OK, KA, and HO. Numerical simulations: OK and ABD. Editing: OK, KA, and ABD. Optimal control: ABD, OK, and KA. All authors agreed on the final version of the manuscript.
Funding
The authors received no financial support for the research, authorship, and/or publication of this article.
Declaration of conflicting interests
The authors declared no potential conflicts of interest with respect to the research, authorship, and/or publication of this article.
AsamoahJKKNyabadzaFJinJ, et al.Backward bifurcation and sensitivity analysis for bacterial meningitis transmission dynamics with a nonlinear recovery rate. Chaos, Solitons Fractals2020; 140: 110237.
5.
GreenwoodB. Priorities for research on meningococcal disease and the impact of serogroup A vaccination in the African meningitis belt. Vaccine2013; 31: 1453–1457.
6.
BorrowR, et al.Meningococcal disease in the Middle East and Africa: findings and updates from the Global Meningococcal Initiative. J Infect2017; 75: 1–11.
7.
MartchevaMCrispino-O’ConnellG. The transmission of meningococcal infection: a mathematical study. J Math Anal Appl2003; 283: 251–275.
PontryaginLSBoltyanskiiVGGamkrelidzeRV. The Mathematical Theory of Optimal Processes. New York: Macmillan Company, 1964.
12.
LiTXiaoY. Complex dynamics of an epidemic model with saturated media coverage and recovery. Nonlinear Dynam2022; 107: 2995–3023.
13.
AsamoahJKKNyabadzaFSeiduB, et al.Mathematical modelling of bacterial meningitis transmission dynamics with control measures. Comput Math Methods Med2018; 2018: 2657461.
14.
LiuRWuJZhuH. Media/psychological impact on multiple outbreaks of emerging infectious diseases. Comput Math Methods Med2007; 8: 153–164.
15.
MisraAKRaiRKTakeuchiY. Modeling the control of infectious diseases: effects of TV and social media advertisements. Math Biosci Eng2018; 15: 1315–1343.
16.
LanlegeDIFadugbaSEAliN, et al.Mathematical model of the social pathogen of HIV/AIDS stigma. Commun Math Biol Neurosci2025; 2025: 1–20.
17.
MahdyAMS. Stability, existence, and uniqueness for solving fractional glioblastoma multiforme using a Caputo–Fabrizio derivative. Math Met Appl Sci2023; 48: 7360–7377.Article
18.
OlayiwolaMOOluwafemiEA. Hereditary and antimicrobial factor shaping extracellular bacteria dynamics in an in-host mathematical model of tuberculosis for disease control. Tuberculosis2025; 154: 102668. ISSN 1472-9792.
19.
MusaSSZhaoSHussainiN, et al.Mathematical modeling and analysis of meningococcal meningitis transmission dynamics. Int J of Biomath2020; 2050006: 23.
20.
KoutouODiabatéABSangaréB. Mathematical analysis of the impact of the media coverage in mitigating the outbreak of COVID-19. Math Comput Simulat2023; 205: 600C618.
21.
LiuYCuiJ. The impact of media coverage on the dynamics of infectious disease. Int J Biomath2008; 1: 65 −674.
22.
PeterOJYusufAOjoMM, et al.A mathematical model analysis of meningitis with treatment and vaccination in fractional derivatives. Int J Appl Comput Math2022; 8.
23.
BelayMAAbonyoJOAlemnehHT, et al.Optimal control and cost-effectiveness analysis for bacterial meningitis disease. Front Appl Math Stat2024; 10: 1–13.
24.
SaharAMHasimAOEihabBMB, et al.Optimal control strategies applied to a mathematical model of meningitis. Eur J Pure Appl Math2025; 18: Article Number 6129.
25.
AmarMNisardiMNurahmadM. A Deterministic mathematical model of meningitis transmission dynamics with vaccination and screening. Jurnal Matematika UNAND2025; 14: 1–17.
26.
KotolaBSMekonnenTT. Mathematical model analysis and numerical simulation for codynamics of meningitis and pneumonia infection with intervention. Sci Rep2022; 12: 2639.
27.
SahuGPDharJ. Dynamics of an SEQIHRS epidemic model with media coverage, quarantine and isolation in a community with pre-existing immunity. J Math Anal Appl2015; 421: 1651–1672.
28.
van den DriesschePWatmoughJ. Reproduction numbers and sub-threshold endemic equilibria for compartmental models of disease transmission. Math Biosci2002; 180: 29–48.
29.
Castillo-ChavezCSongB. Dynamical models of tuberculosis and their applications. Math Biosci Eng2004; 1: 361–404.
30.
DiabatéABSangaréBKoutouO. Optimal control analysis of a mathematical model of malaria and COVID-19 co-infection dynamics. J Biol Dyn2025; 19: 2568392.
31.
GoswamiNKOlaniyiSAbimbadeSF, et al.A mathematical model for investigating the effect of media awareness programs on the spread of COVID-19 with optimal control. Healthcare Analytics2024; 5: 100300.
32.
IrvingTBlyussKColijnC, et al.Modelling meningococcal meningitis in the African meningitis belt. Epidemiol Infect2012; 140: 897–905.
33.
KoutouOTraoréBSangaréB. Mathematical modeling of malaria transmission global dynamics: taking into account the immature stages of the vectors. Adv Differ Eq2018; 2018 : 1–34.
34.
YodaYOuedraogoHOuedraogoD, et al.Mathematical analysis and optimal control of Dengue fever epidemic model. Adv Cont Discr Mod2024; 11: 1–33.
35.
FlemingWHRishelRW. Deterministic and Stochastic Optimal Control. New York: Springer- Verlag, 2005.
36.
DiabatéABSangaréBKoutouO. Optimal control analysis of a COVID-19 and Tuberculosis (TB) co-infection model with an imperfect vaccine for COVID-19. SeMA J2023; 81: 429–456.