
Abstract
Aiming to address the current problems in the industrial cleaning field, including water waste, blind spots, and poor equipment compatibility, this study proposes a three-dimensional vision-based cleaning robot design. The proposed design is primarily developed for cleaning workpieces in the manufacturing of rail transit equipment. It integrates both high-flow, low-pressure cleaning and low-flow, high-pressure cleaning, using the proportional-integral-derivative (PID) control technology to precisely adjust the cleaning pressure and water temperature, allowing robots to automatically adapt to the characteristics of various materials and stains. The proposed design employs a template matching algorithm and an improved CIoU-YOLOv7 object recognition algorithm to achieve rapid workpiece recognition, stain detection, and accurate positioning. Compared to the baseline algorithm, the proposed method increases the detection accuracy by 5–10%, reaching 62.34%. The genetic algorithm optimizes the cleaning path, reducing the total path by 64.7% compared to the original path while increasing efficiency by 10.5% over the basic genetic algorithm. These improvements enable efficient automatic cleaning of various workpieces, enhancing both cleaning efficiency and quality. The proposed method not only saves water but also significantly enhances the intelligence level of cleaning systems by reducing the number of generations required to achieve an optimal solution by 95%. Thus, the proposed design can effectively address the problems of low efficiency in traditional cleaning methods.
Introduction
With recent advancements in industry automation, robot technology has emerged as a key driver in the development of the modern manufacturing industry. The application of cleaning robots in industrial cleaning simultaneously improves both cleaning efficiency and quality. Due to the widespread application and rapid development of advanced technologies, such as computer vision, intelligent control, and artificial intelligence, an increasing number of jobs have been replaced by robots. This transition trend has also been evident in the cleaning of stators and rotors of high-power electric locomotive motors and their components during the manufacturing process. Traditional cleaning methods involve cleaning workpieces with a fixed high-pressure water gun, which face some shortcomings, such as incomplete cleaning, poor equipment compatibility, and poor adaptability to changes in workpiece shape and size. Therefore, manual inspection and cleaning are required after each automatic cleaning cycle to remove any remaining stains. However, due to the limitations of manual cleaning, some areas may remain uncleaned. In addition to the problem of incomplete cleaning, the fixed high-pressure water gun has the disadvantages of low efficiency, water waste, and the inability to clean key areas. The primary reason for these difficulties is the lack of efficient target detection technology, which hinders the achievement of precise cleaning.
Object detection technology, as the foundation of robot perception, has recently evolved from traditional algorithms to deep learning-based algorithms. Currently, most object detection algorithms rely on manually designed features and sliding window methods. For instance, the method proposed by Paul et al. uses Harr features 1 and the Adaboost classifier 2 to recognize faces. Dalal et al. proposed a method that combines the histogram of oriented gradients features 3 and the support vector machine (SVM) classifier 4 to detect pedestrians. Although these methods can achieve good results in some scenarios, they face limitations in complex scenes and applications with high real-time requirements. However, the advent of deep learning has introduced revolutionary changes in this field. In 2014, Girshick et al. 5 developed the region-based convolutional neural network (R-CNN) model to apply deep learning to object detection. This model performs candidate box generation, image scaling, feature extraction, and SVM classification. This work laid the foundation for subsequent research in the field. Later, He et al. 6 proposed an innovative network structure by adding a spatial pyramid layer to the network, which effectively addressed the problem of inconsistent input image sizes and improved feature scale invariance, thereby significantly reducing overfitting. Based on this model, the Fast R-CNN 7 and Faster R-CNN 8 models were designed, which both improved and accelerated detection accuracy. In addition, regression-based object detection models, such as YOLO 9 and SSD series algorithms, 10 have attracted widespread attention in recent years. Currently, the most recent YOLO series algorithm is the YOLOv12 model, 11 but this study uses YOLOv7 for research due to the equipment limitations and stability concerns. These algorithms can achieve high speed and good accuracy because they directly regress target categories and border information rather than generating candidate regions in advance. The rapid development of advanced technologies has provided the necessary technical support for the development of intelligent cleaning robots.
Recent studies have aimed to address the current problems in the cleaning process of electric multiple unit (EMU) bogies, including low cleaning efficiency and poor cleaning quality. To this end, an innovative cleaning method based on a water pump was proposed.12,13 After detecting that a bogie is in place, this method controls the water pump to clean the whole bogie with maximum water flow. Although the cleaning process in this method is automated, there is a problem of waste of resources. Therefore, a refined cleaning method consisting of three stages, namely water jet cleaning, spray cleaning, and vibration cleaning, has been introduced to increase cleaning efficiency. 14 He 15 has introduced some innovative ideas for improving the existing cleaning equipment. However, achieving accurate detection and targeted cleaning of stains remains a challenge. In contrast, the cleaning solution using a robotic arm has the advantages of high efficiency, precision, and resource conservation. In addition, the latest planning techniques employ diffusion models16–18 and visual-language-action (VLA) technologies19–21 have been broadly used in practical applications. Nevertheless, these methods typically require a significant number of computational resources, which necessitate making trade-offs according to specific scenarios in practical applications. Aiming to overcome these limitations, this study introduces a planning method based on genetic algorithms.
In recent years, generative models have demonstrated great results in robotic planning. In addition, diffusion models gradually generate trajectories through a denoising process and exhibit strong flexibility in handling multimodal targets and complex constraints. 22 The VLA models, which integrate visual perception, natural language instructions, and motion control into the same space, offer an enhanced approach for achieving highly generalized instruction following and control. 23 These advanced technologies offer innovative approaches for addressing the uncertainty problem in practical applications.
However, despite the significant advantages of modern technologies, such as diffusion models and VLAs, they generally suffer from high computational cost, strong reliance on massive training data, and relatively weak interpretability in the decision-making process, which makes them potentially nonoptimal solutions for highly structured industrial cleaning scenarios with strong determinism. Therefore, the primary objective of this study is to determine an efficient cleaning path that adheres to constraints of strict obstacle avoidance and dynamics in a known environment with limited variations, which represents a typical combinatorial optimization problem.
Optimization-based methods, including genetic algorithms, have unique advantages in solving the above-mentioned problems. First, optimization objectives, such as the shortest path and maximum coverage, can be clearly defined and embedded in the algorithm. Second, complex environmental constraints, including collision detection and joint angle limits, can be easily expressed explicitly and handled during the solution process. Third, the solution process is stable, and the trade-off between the solution quality and computational cost is controllable. Therefore, for the specific scenario considered in this study, which is characterized by a structured environment, clear constraints, and extremely high reliability requirements, this study employs an improved genetic algorithm (IGA), aiming to achieve higher planning efficiency and reliability while ensuring solution quality.
Finally, to address the demand for improving traditional cleaning methods, this study proposes a three-dimensional (3D) vision-based cleaning robot system that can replace traditional cleaning equipment. The proposed system employs a six-degree-of-freedom robot to hold a water gun and applies a clean method that combines high-flow low-pressure cleaning with low-flow high-pressure cleaning, thereby simultaneously enhancing cleaning efficiency and intelligence. In addition to the advantage of saving water, the proposed system can remove stains effectively, offering significant benefits when cleaning key areas and blind spots. The proposed system integrates advanced control techniques, such as proportional-integral-derivative (PID) control, to dynamically adjust cleaning parameters, thereby ensuring optimal cleaning performance for various materials and stain types. Furthermore, the integration of 3D vision and advanced object recognition algorithms further enhances the proposed system’s ability to precisely detect and clean stains, making it a robust solution for modern industrial cleaning challenges.
3D vision-based EMU bogie recognition
Bogie stain identification using the YOLOv7 model
The overall structure and the training and detection methods of the YOLOv7 model 24 are presented in Figure 1. First, the input images are adjusted to the same size, and the backbone network is employed to extract multiscale features, which are further enhanced using the path aggregation feature pyramid network. Next, in the enhanced feature layer, objects are recognized and categorized before adjusting the prior boxes to produce accurate predictions.

Training and prediction framework of the YOLOv7 model.
Based on the YOLOv7 framework, this study achieves accurate recognition of EMU bogies. The specific recognition process is as follows. First, the system acquires the red–green–blue (RGB) images and depth information on the bogie area using a 3D camera. Then, the CIoU-YOLOv7 model is employed to perform inference on the acquired RGB images, identifying the two-dimensional (2D) bounding boxes and categories of stains. Finally, the 2D detection results are fused with the depth point cloud using the camera calibration parameters, and the precise position and pose of the stains in a 3D space are calculated. This provides accurate pose input for the subsequent cleaning path planning process, which is performed by a robotic arm. This 3D visual recognition process serves as a core prerequisite for realizing automated cleaning.
Dataset construction
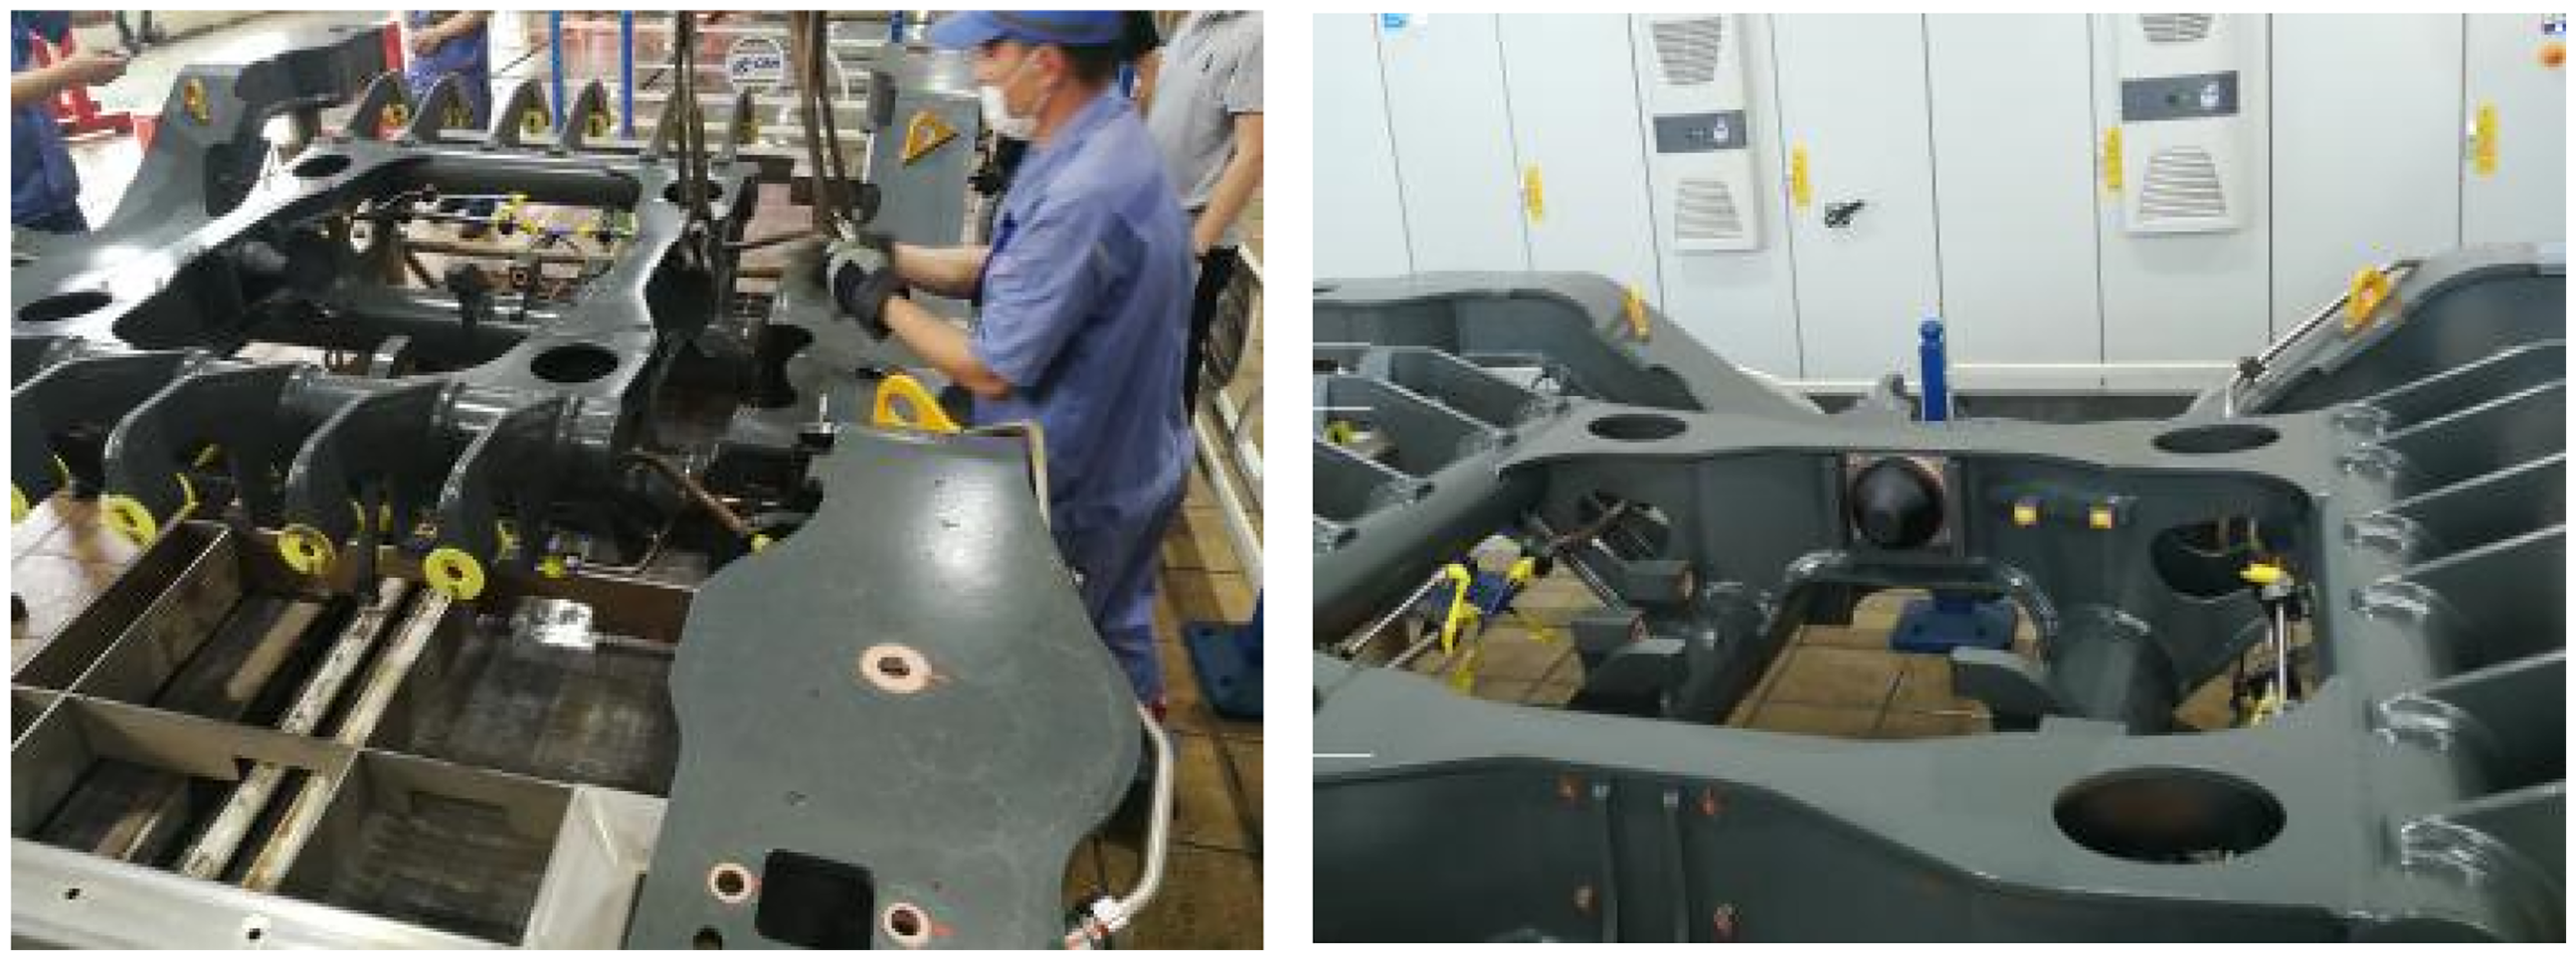
The stains on the bogie surface can be roughly classified into four types: (1) organic stains (e.g. bird feathers or droppings and mosquitoes), (2) sand and dust from train operation, (3) fine iron powder mixture and rust from wheel-rail friction and braking, and (4) mineral and plant oil stains and dust attached to them. Since the cleaning process for the four types of stains is similar, all stains are collectively labeled as dirt in the dataset used in this study. The four sample images with marked stains are depicted in Figure 2.

The four sample images containing bogies with marked stains.
Improved Yolov7 algorithm
The calculation process of the loss function and nonmaximum suppression (NMS) is performed at the output part of the Yolov7 model to obtain the final position and category of the prediction box.
The specific steps are as follows:
(1) Bounding box loss function
The loss function of the object detection algorithm includes two components: a bounding box loss function and a classification loss function. The bounding box loss function has evolved from the IOU, GIOU, DIOU, and complete intersection over union (CIoU) losses. 25 The concept of the IOU loss was introduced previously, and the above loss functions are analyzed and compared in this section, beginning with the widely used IOU loss.

The calculation process of the IOU loss.

The calculation process of the GIOU loss.
(2) Nonmaximum suppression

The calculation process of the DIOU and CIoU losses.
Typically, NMS is performed at the output of an object detection model. During detection, multiple overlapping candidate boxes with different levels of confidence can be present in the detected area. Figure 6 illustrates how NMS is used to select the most likely option from these candidate boxes.
(3) CIoU-Yolov7 algorithm with CIoU loss

Illustration of the NMS effect.
The workflow of the NMS algorithm, performed at the output end of the Yolov7 model, includes the following steps:
The methods used to calculate the IOU, GIOU, DIOU, and CIoU losses, as described earlier, show that the IOU calculation methods have certain limitations. Therefore, if conventional NMS is used in the detection process to filter out other prediction boxes using the IOU value as a threshold, prediction boxes may be incorrectly removed. For instance, if two objects to be detected are very close to each other, it is very likely that the prediction box of one of them will be filtered out incorrectly, having a negative effect on model training. It has been shown in the source code of the Yolov7 model that the model directly calls the API (i.e. the non_max_suppression function) of the Pytorch official NMS of the deep learning framework, which implements only conventional NMS algorithms.
Therefore, this study implements the NMS algorithm at the output end of the Yolov7 model. Specifically, the IOU calculation is replaced by the CIoU calculation, which provides better results and considers more variables without altering the algorithm flow. Although the CIoU has been widely used as a loss function in object detection tasks, the core innovation of this study lies in the creative migration of its geometric measurement concept to the NMS post-processing stage. This innovation effectively addresses the problem of geometric matching inaccuracy in traditional IOU-NMS methods for the specific scenario of industrial stain detection. In industrial scenarios, stains often feature irregular shapes, dense distribution, and mutual overlap. However, traditional IOU methods consider only the overlapping area and are insensitive to the center distance and aspect ratio of bounding boxes, which can easily lead to the false suppression of prediction boxes with higher IOU but more accurate actual positioning during the NMS stage. In theory, this enhancement can prevent the problem of erroneous suppression, which can occur when objects being detected are very close to each other, thereby increasing the recall rate during model training. For ease of reading, the improved Yolov7 model is referred to as CIoU-Yolov7 in this paper.
Workpiece recognition method based on contour features
In addition to cleaning the stains on a bogie, the motor must also be cleaned. To automate the motor cleaning process and reduce human intervention, this study employs an object recognition method based on contour features to identify motors of various models and shapes, as well as their components. This method uses the template matching approach to determine the degree of similarity of contour features between the image under consideration and the template image, determining the target object's category. The recognition process of a workpiece includes three stages: image feature extraction, similarity range selection, and result analysis. A variety of target objects can be accurately identified by examining shape descriptors and contour moment features, thus paving the way for intelligent cleaning.
Contour descriptors
Shape descriptors provide a useful means to evaluate the similarity with the template by quantitatively describing the feature information of the object to be recognized. The object recognition ability of shape descriptors remains unaffected even after affine transformations, such as rotation and scaling, suggesting that shape recognition is insensitive to changes in the object’s position and scale. This is the most significant characteristic of shape descriptors.
The Fourier shape descriptor has been widely used in recent work due to its high efficiency and stability. It describes closed curves using a Fourier series expansion, where curves must be continuous and uniform. Specifically, a coordinate system is established with the shape center serving as the origin, and each point on the curve has a specific location. Thus, the curve’s shape features can be captured, as shown in Figure 7. This method can effectively reduce the amount of data while maintaining shape recognition accuracy.

Illustration of the collision detection process.
The curve under polar coordinates is expressed as follows:

Due to the discrete nature of digital images, each point on the curve must be sampled separately. Assuming the total number of pixels on the curve is N, each point can be expressed as a complex number as follows:

In addition, to improve the accuracy, allowing for recognizing the areas with unclear features in an image, this study performs the Fourier transform on r(i) to obtain the Fourier coefficient R(k), which is defined as follows:

Contour moment feature-based matching
Contour moment features, which are rotation-, translation-, and scale-invariant, have been widely used in object classification to ensure high accuracy and stability. Among them, the Hu moment is created by linearly changing the normalized central moment. Owing to affine, translation, and mirror invariances, it can uniformly describe the same target object in different orientations. The Hu moment is a seven-dimensional vector consisting of seven features. In the object recognition process, the edge feature moments of the image to be recognized are compared to those of the template image, and a decision is made based on the degree of similarity between them. The degree of similarity depends on the threshold value, with the lower threshold value indicating a greater degree of similarity. The specific mathematical expressions are as follows:


The flowchart of the process for identifying a target object’s contour using a structured approach is presented in Figure 8. This process begins by extracting object contours from images and generating a template object contour. The template is then used to calculate the Hu moment eigenvalues, which are shape descriptors that are insensitive to translation, scaling, and rotation.
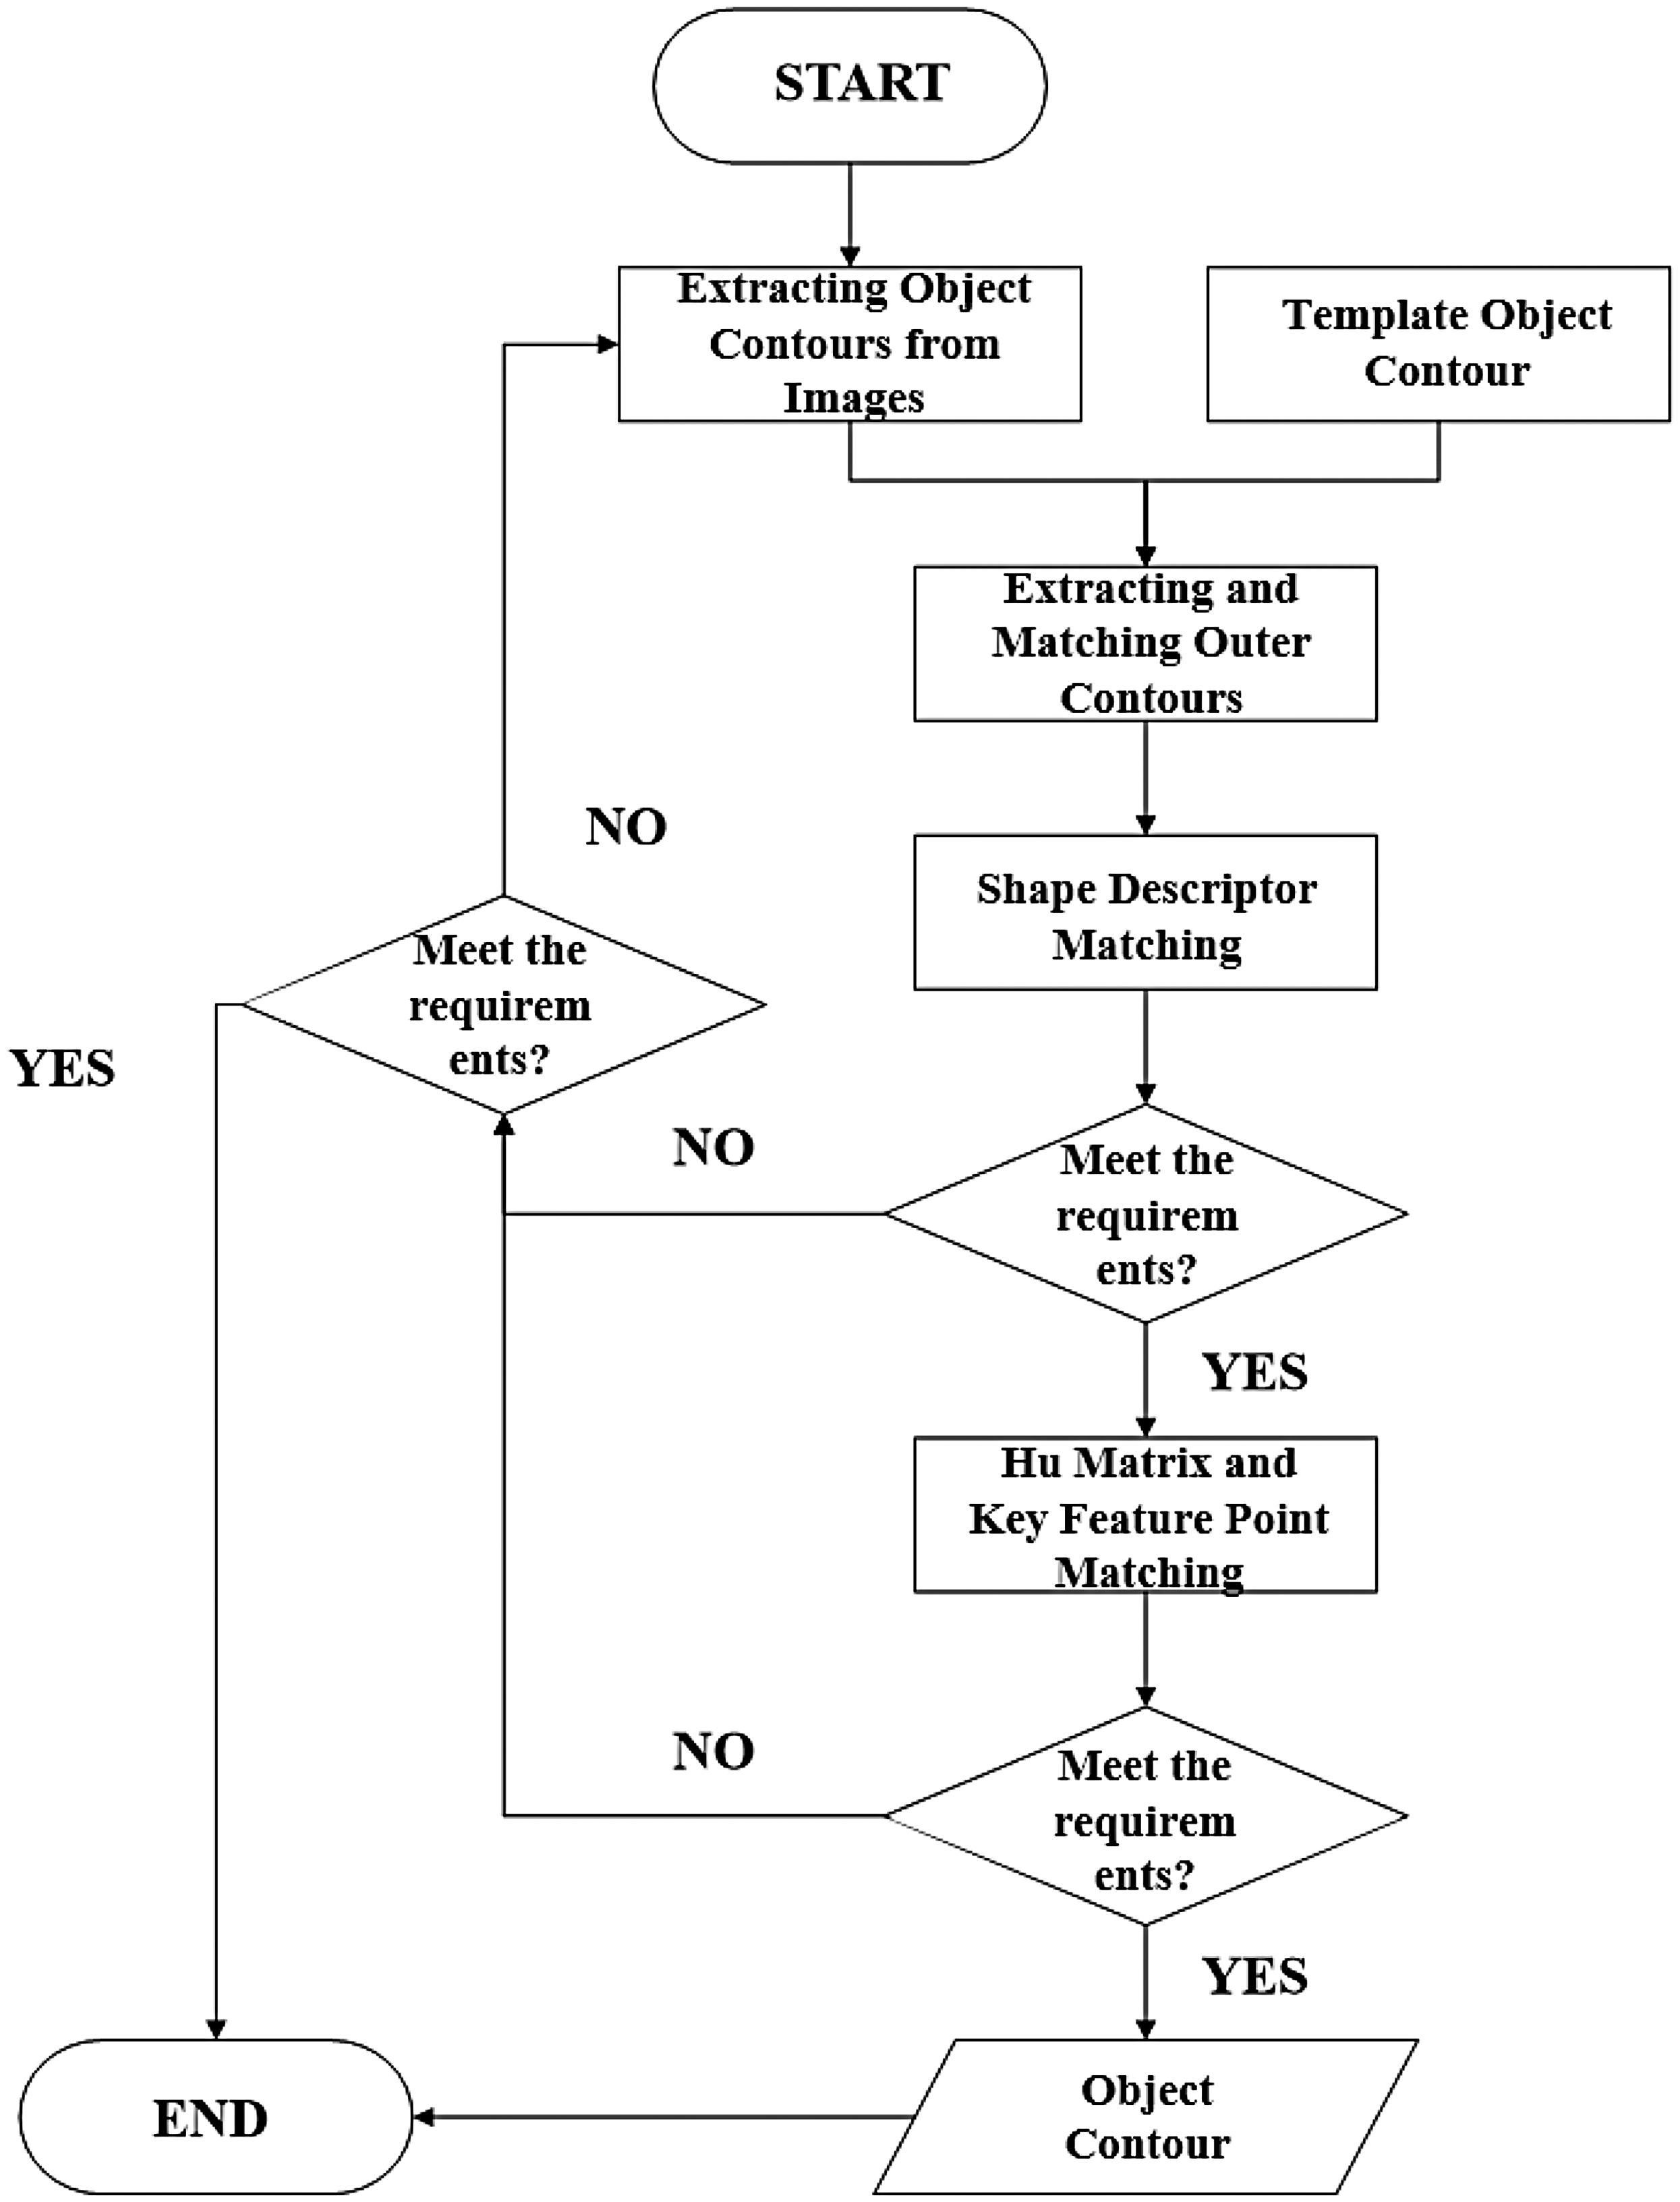
The flowchart of the target recognition process.
Next, the image undergoes preprocessing to enhance its quality, followed by the threshold segmentation and binarization processes, performed to separate the object from the background. Then, the outer contour of the object in the image is extracted and matched with the template, and shape descriptor matching is conducted to compare the extracted contour with the template based on the calculated Hu moment eigenvalues.
Afterward, the algorithm determines whether the contour matching requirement is met. If not, it adjusts the parameters or tries alternative methods, but if the match is successful, the process proceeds to the hit matrix and key feature point matching to refine the identification result. Finally, the algorithm determines whether the key feature point matching requirement is met. If the requirement is satisfied, the object contour is confirmed, completing the identification process; otherwise, the process may loop back for additional adjustments. This method offers a reliable approach for identifying objects in images, while considering variations in positioning and scale.
3D scene reconstruction and target localization
After identifying the workpiece type, the position and orientation of the workpiece relative to the robotic arm are calculated and reported to the control system. The control system corrects and compensates the robotic arm’s cleaning trajectory based on information on the workpiece’s position and orientation.
To achieve workpiece localization, the base coordinate system of the robotic arm is defined as the world coordinate system

First, a set of depth images
The specific processing of the 3D reconstruction algorithm used in this study includes the following steps:
Define input data, including a set of depth images A rectangular bounding box is established that can encompass the object to be reconstructed; The bounding box is divided into Based on the size and number of voxels, each voxel g is converted to obtain a 3D spatial point After every voxel g is traversed, the mapping point v of point If the depth value at point x is The truncation distance is set to u. If The weight of point Finally, the current frame is fused with the global fusion result; The post-fusion point cloud
The 3D reconstruction algorithm uses the point cloud data fusion method described above to take multiview depth images and the corresponding camera poses as inputs and then outputs the workpiece’s complete point cloud and surface normal vector. To obtain an accurate point cloud surface normal vector, the Marching Cubes algorithm is employed to calculate the triangular face of the fusion point cloud, followed by the surface normal vector estimation process at each vertex. In the cleaning scene, the working plane runs parallel to the robotic arm’s base plane. As a result, the complete point cloud of the cleaning scene and the corresponding surface normal vector of the cleaning target can be easily obtained using simple segmentation based on the coordinate information of the point cloud obtained from fusion in the direction perpendicular to the working plane.
After workpiece recognition and 3D point cloud reconstruction for the cleaning scene are completed, the RGB positions of the workpiece are matched with the point cloud to obtain the workpiece’s pose geometry information in relation to the robotic arm in the scene. The pose geometry information is then used to compensate for position along the cleaning trajectory.
Improved TSDF fusion algorithm
To enhance the efficiency and accuracy of 3D reconstruction and meet the real-time requirements of cleaning scenarios, this study introduces two improvements to the traditional TSDF algorithm: voxel hash-based dynamic memory management and GPU-based parallel computing.
First, the voxel hash-based dynamic memory management designed in this study is as follows. The traditional TSDF algorithm requires pre-allocating a massive 3D grid array, with a memory complexity of O(n³), which significantly limits the scope of scenes that can be reconstructed. Therefore, this study adopts a Voxel hashing strategy 16 for improvement. The main idea of this strategy is to use a hash table to dynamically manage the memory blocks (i.e. Blocks) that store voxel data.
For a voxel coordinate in the world coordinate system

This operation maps the 3D coordinates to a one-dimensional (1D) hash table. In addition, a linear probing strategy is employed to address the problem of hash collisions. When a collision occurs, the algorithm sequentially searches for the next empty slot in the hash table, which reduces memory consumption from O(n³) to O(n²) and only allocates and updates memory for the surface area within the camera frustum, thereby enabling the system to reconstruct a larger range of cleaning scenarios.
The GPU-based parallel fusion is introduced, which significantly accelerates the reconstruction process. The steps of voxel update, SDF value calculation, and weight fusion (i.e. steps d–i presented above) are all completed in parallel on the GPU. For each frame of a depth image, a ray is cast for each of its pixels, and an independent GPU thread is assigned to each voxel on each ray for calculation. Specifically, for a depth map with a resolution of 640 × 480, a grid containing 640 × 480 thread blocks is used, where each thread block is responsible for processing all voxels on a ray from the camera origin to the maximum truncation distance. During the parallel fusion calculation process, each thread independently executes steps d–i, including world coordinate transformation, projection, SDF value calculation, truncation, and weight fusion. The global TSDF values, TSDF(p), and weights W(p), are stored in the global memory managed by voxel hashing and updated through atomic operations to ensure thread safety. The flowchart of the improved TSDF fusion algorithm is shown in Figure 9.

The flowchart of the improved TSDF fusion algorithm.
Robot motion planning for cleaning EMU bogies
Path planning and trajectory planning are essential tasks of the motion planning process, which is essential for guiding robotic arms efficiently. The schematic diagram of the motion planning for a robotic arm is shown in Figure 10, where it can be seen that the path planning and trajectory planning processes are interconnected. The upper right section of Figure 10 depicts a simplified illustration of the trajectory planning process in the Cartesian space. The motion planning process for a robotic arm begins with using visual detection systems to identify stain locations. Then, an enhanced genetic algorithm is employed to navigate the path among the stains, which is followed by the trajectory planning process that includes determining the robot’s movement to the initial point on the path, selecting appropriate cleaning strategies based on the stain characteristics, and planning the trajectory to subsequent poses.

The schematic diagram of the motion planning for a robotic arm.
The specific process involves calculating joint angles using inverse kinematics to achieve the desired poses and inputting these angles into the robot’s control system to ensure precise movement. Meanwhile, the system determines whether the robot has reached the end of the designated path, ensuring thorough cleaning. This iterative approach allows the robotic arm to systematically clean all identified stains, offering a structured method for motion planning that optimizes cleaning operations.
Cleaning path planning
When cleaning a bogie using a robotic arm, real number encoding replaces binary encoding, and each solution is represented by a real number vector. The dirt point parameters are directly encoded to reduce errors, improve the accuracy, and simplify crossover and mutation operations. For instance, if there are ten stain points, they are numbered by 1–10, with real number codes corresponding directly to the parameters of each point.
The specific steps are as follows:
First, a random number sequence (e.g. sequence “7 3 1 6 4 9 8 0 2 5 or 2 7 4 6 3 0 8 1 5 9”) is generated to serve as a gene code; The shorter the path length covered by the end of the robotic arm is, the higher the corresponding fitness value will be, indicating a greater advantage of the individual in the survival and reproduction process; The selection is made using the roulette wheel method. First, a number r, with a value between zero and the sum of fitness values, is randomly generated. Then, the fitness value of the current individual is subtracted from the r value after traversing the entire population. If the r value is less than or equal to zero, the algorithm returns the current individual. Individuals with high fitness values are selected through multiple selection rounds and added to the offspring population until it reaches the desired size; Crossover: Two chromosomes are selected randomly for a crossover operation, which involves exchanging a gene segment of the chromosome to create two new individuals. The two new individuals are then introduced to the offspring population. For bogie cleaning, a crossover point can be established between the sixth and seventh gene positions, and the gene segments at the seventh, eighth, and ninth positions can be exchanged. After the crossover operation, some locations have been visited twice, as shown in Figure 11, which indicates the need to eliminate interference. The results are sequences “7 3 2 6 4 0 8 1 5 9” and “9 7 4 6 3 1 8 0 2 5.” Mutation: The chromosome changes in specific segments of gene code with a predetermined probability. Mutation is the process of randomly modifying selected gene points, such as gene swapping, gene flipping, and other operations, as illustrated in Figure 12.

The schematic diagram of the crossover operation of the genetic algorithm.

The schematic diagram of the mutation operation of the genetic algorithm.
After the evolution of multiple generations, the population remains stable, indicating no significant change in total distance. In this case, an optimal coding scheme is selected to find the shortest cleaning path. Considering that traditional genetic algorithms are time-consuming and do not guarantee optimal results when handling the problems related to bogie stain cleaning, this study proposes an improvement method, adding a near-optimal individual to the first-generation population to influence population characteristics. The nearest neighbor (NN) algorithm is employed to determine the individual that is the closest to the optimal individual. The specific procedure is as follows. Sort the point codes based on the stain point distance, and then select the nearest point codes in sequence until all stain points have been covered. This method can accelerate the algorithm's convergence speed and provide better solutions.
Cleaning trajectory planning
Robot arm trajectory planning represents the process of designing a suitable motion trajectory based on a robot arm’s starting and ending points, allowing the robot arm to reach the target position at the expected speed and posture. The trajectory planning methods of robotic arms can be roughly classified into two types based on the order of interpolation: joint space trajectory planning methods and Cartesian space trajectory planning methods. In joint space trajectory planning methods, the inverse kinematics solution is applied before interpolation, whereas in Cartesian space trajectory planning methods, interpolation occurs before the inverse kinematics solution is applied. This paper investigates trajectory planning methods in two different spaces. In addition, the fifth-degree polynomials are used for interpolation operations in trajectory planning in both the joint and Cartesian spaces to ensure they can be compared.
Finally, interpolation is used in both trajectory planning methods, albeit in different ways. In joint space trajectory planning, the joint angle is interpolated. In contrast, in Cartesian space trajectory planning, interpolation is used to determine the location of a robotic arm's end. The selection of the interpolation method has a direct effect on the quality of trajectory planning, so it is necessary to identify a suitable interpolation method for the proposed system’s trajectory planning method.
Design of fuzzy PID controller for cleaning pressure
In the industrial cleaning process, the characteristics of stains on the surface of workpieces made of different materials can vary significantly. Moreover, the water pressure of the cleaning system is susceptible to the influence of flow fluctuations and response delays of the actuator. Therefore, it is challenging for a PID controller with fixed parameters to simultaneously ensure response rapidity and system stability. Aiming to achieve accurate and adaptive control of cleaning pressure, this study designs a dual-input, triple-output fuzzy PID controller, which uses the pressure error and its rate of change as inputs. The PID controller's parameters are adjusted in real-time online according to fuzzy rules formulated based on expert experience. In this way, the controller can adapt to different dirt characteristics and changes in working conditions, ensuring more robust intelligent cleaning pressure control.
The classic dual-input, triple-output structure of the controller adopted in this study is as follows:
The integral coefficient adjustment amount, ΔKi, is used to dynamically adjust the controller’s ability to eliminate the steady-state error, and its basic range of discourse is [−0.1, 0.1];
The derivative coefficient adjustment amount, ΔKd, is used to dynamically adjust the controller’s antidisturbance and prediction capabilities, and its basic range of discourse is [−0.05, 0.05].
The final values of the PID parameters are determined by superimposing their initial values and the adjustment amounts obtained through fuzzy reasoning as follows:


The first step of the fuzzy reasoning process involves converting the precise values of the input and output variables into fuzzy linguistic values. The rules for membership functions and fuzzification are as follows. The fuzzy subsets of all input and output variables are divided into five levels: Negative Big (NB), Negative Medium (NM), Zero (ZO), Positive Medium (PM), and Positive Big (PB). To simplify the calculation process and enhance the real-time performance, all membership functions adopt computationally efficient triangular functions. The parameters of the membership functions are determined for each variable after multiple simulations and experimental tuning based on the discourse range, and specific definitions are listed in Tables 1 and 2.
Parameters of the membership functions for fuzzy subsets of the input variables.

Parameters of the membership functions for fuzzy subsets of the output variables.
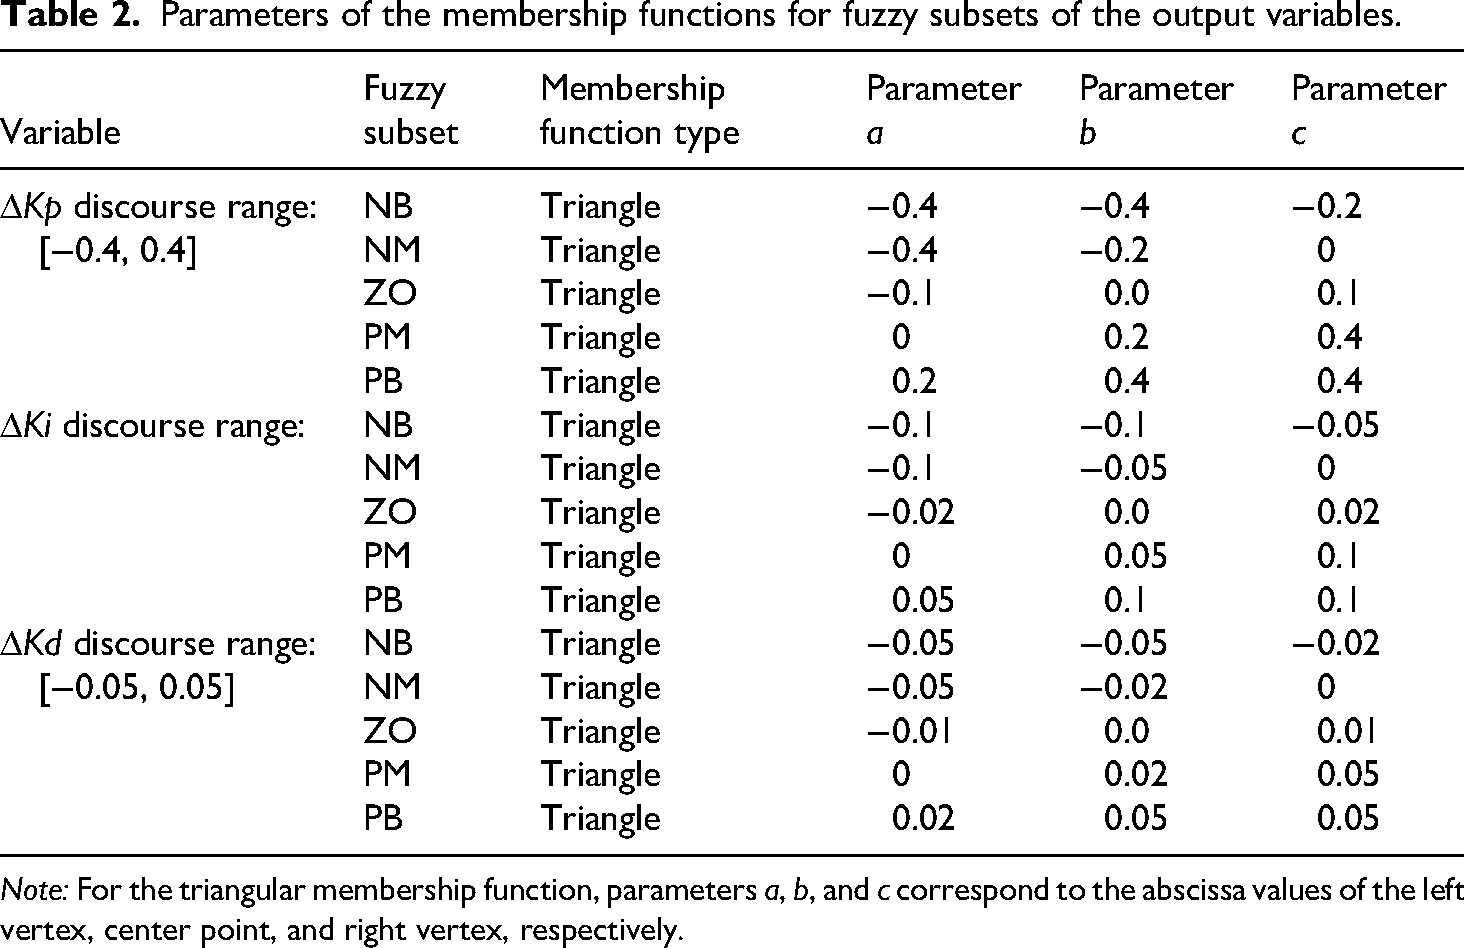
Note: For the triangular membership function, parameters a, b, and c correspond to the abscissa values of the left vertex, center point, and right vertex, respectively.
This study uses the Mamdani-type fuzzy inference system, which conforms to human thinking patterns and can easily express expert knowledge. During the inference process, the fuzzy implication uses the Min (minimum) operator, and the fuzzy aggregation uses the Max (maximum) operator. To achieve precise input values e₀ and ec₀ at each sampling moment, this study performs the fuzzy inference by querying the above rule base and applying the Min operation, resulting in fuzzy sets for the three output variables: ΔKp, ΔKi, and ΔKd. Finally, to convert the fuzzy output sets into precise values that can be used for control execution, the centroid method is employed for defuzzification. This method calculates the centroid of the area enclosed by the membership function of the output fuzzy set and the abscissa and uses the abscissa value of the centroid as an output value. Moreover, this method comprehensively considers the influence of all possible outputs and has the advantages of good smoothness and high accuracy. Its calculation formula is defined as follows:
The fuzzy rule base represents the core of the controller, which is established based on expert experience and in-depth understanding of the PID parameter adjustment laws. The rule form is as follows: IF e is A AND ec is B, THEN ΔKp is C, ΔKi is D, and ΔKd is E.
The design principles are defined as follows:
When |e| is large: Kp should be increased to speed up the system response, and smaller Ki and Kd should be adopted to avoid integral saturation and overshoot; When |e| is medium: A moderate Kp value should be used, and the Ki and Kd values should be adjusted appropriately to stabilize the system response; When |e| is small: The Ki and Kp values should be increased to reduce the steady-state error, and a moderate Kd value should be used to improve the antiinterference ability of the system; When ec is large: It indicates that the deviation tends to increase, so the Kd value should be increased to suppress overshoot.
Based on the above principles, this study establishes a fuzzy rule base containing 25 rules, as shown in Table 2. For brevity, the output fuzzy subsets in Table 2 are denoted by abbreviations, and their full-name correspondences are as follows: N = Negative, P = Positive, B = Big, M = Medium, S = Small, and ZO = Zero (Table 3).
The fuzzy PID control rule table.

System integration and experimental verification
System integration
The system composition is depicted in Figure 13, where it can be seen that the system consisted of three main modules: a water pressure fuzzy PID control module, a target workpiece recognition and positioning module, and a robot collision detection and path planning module.
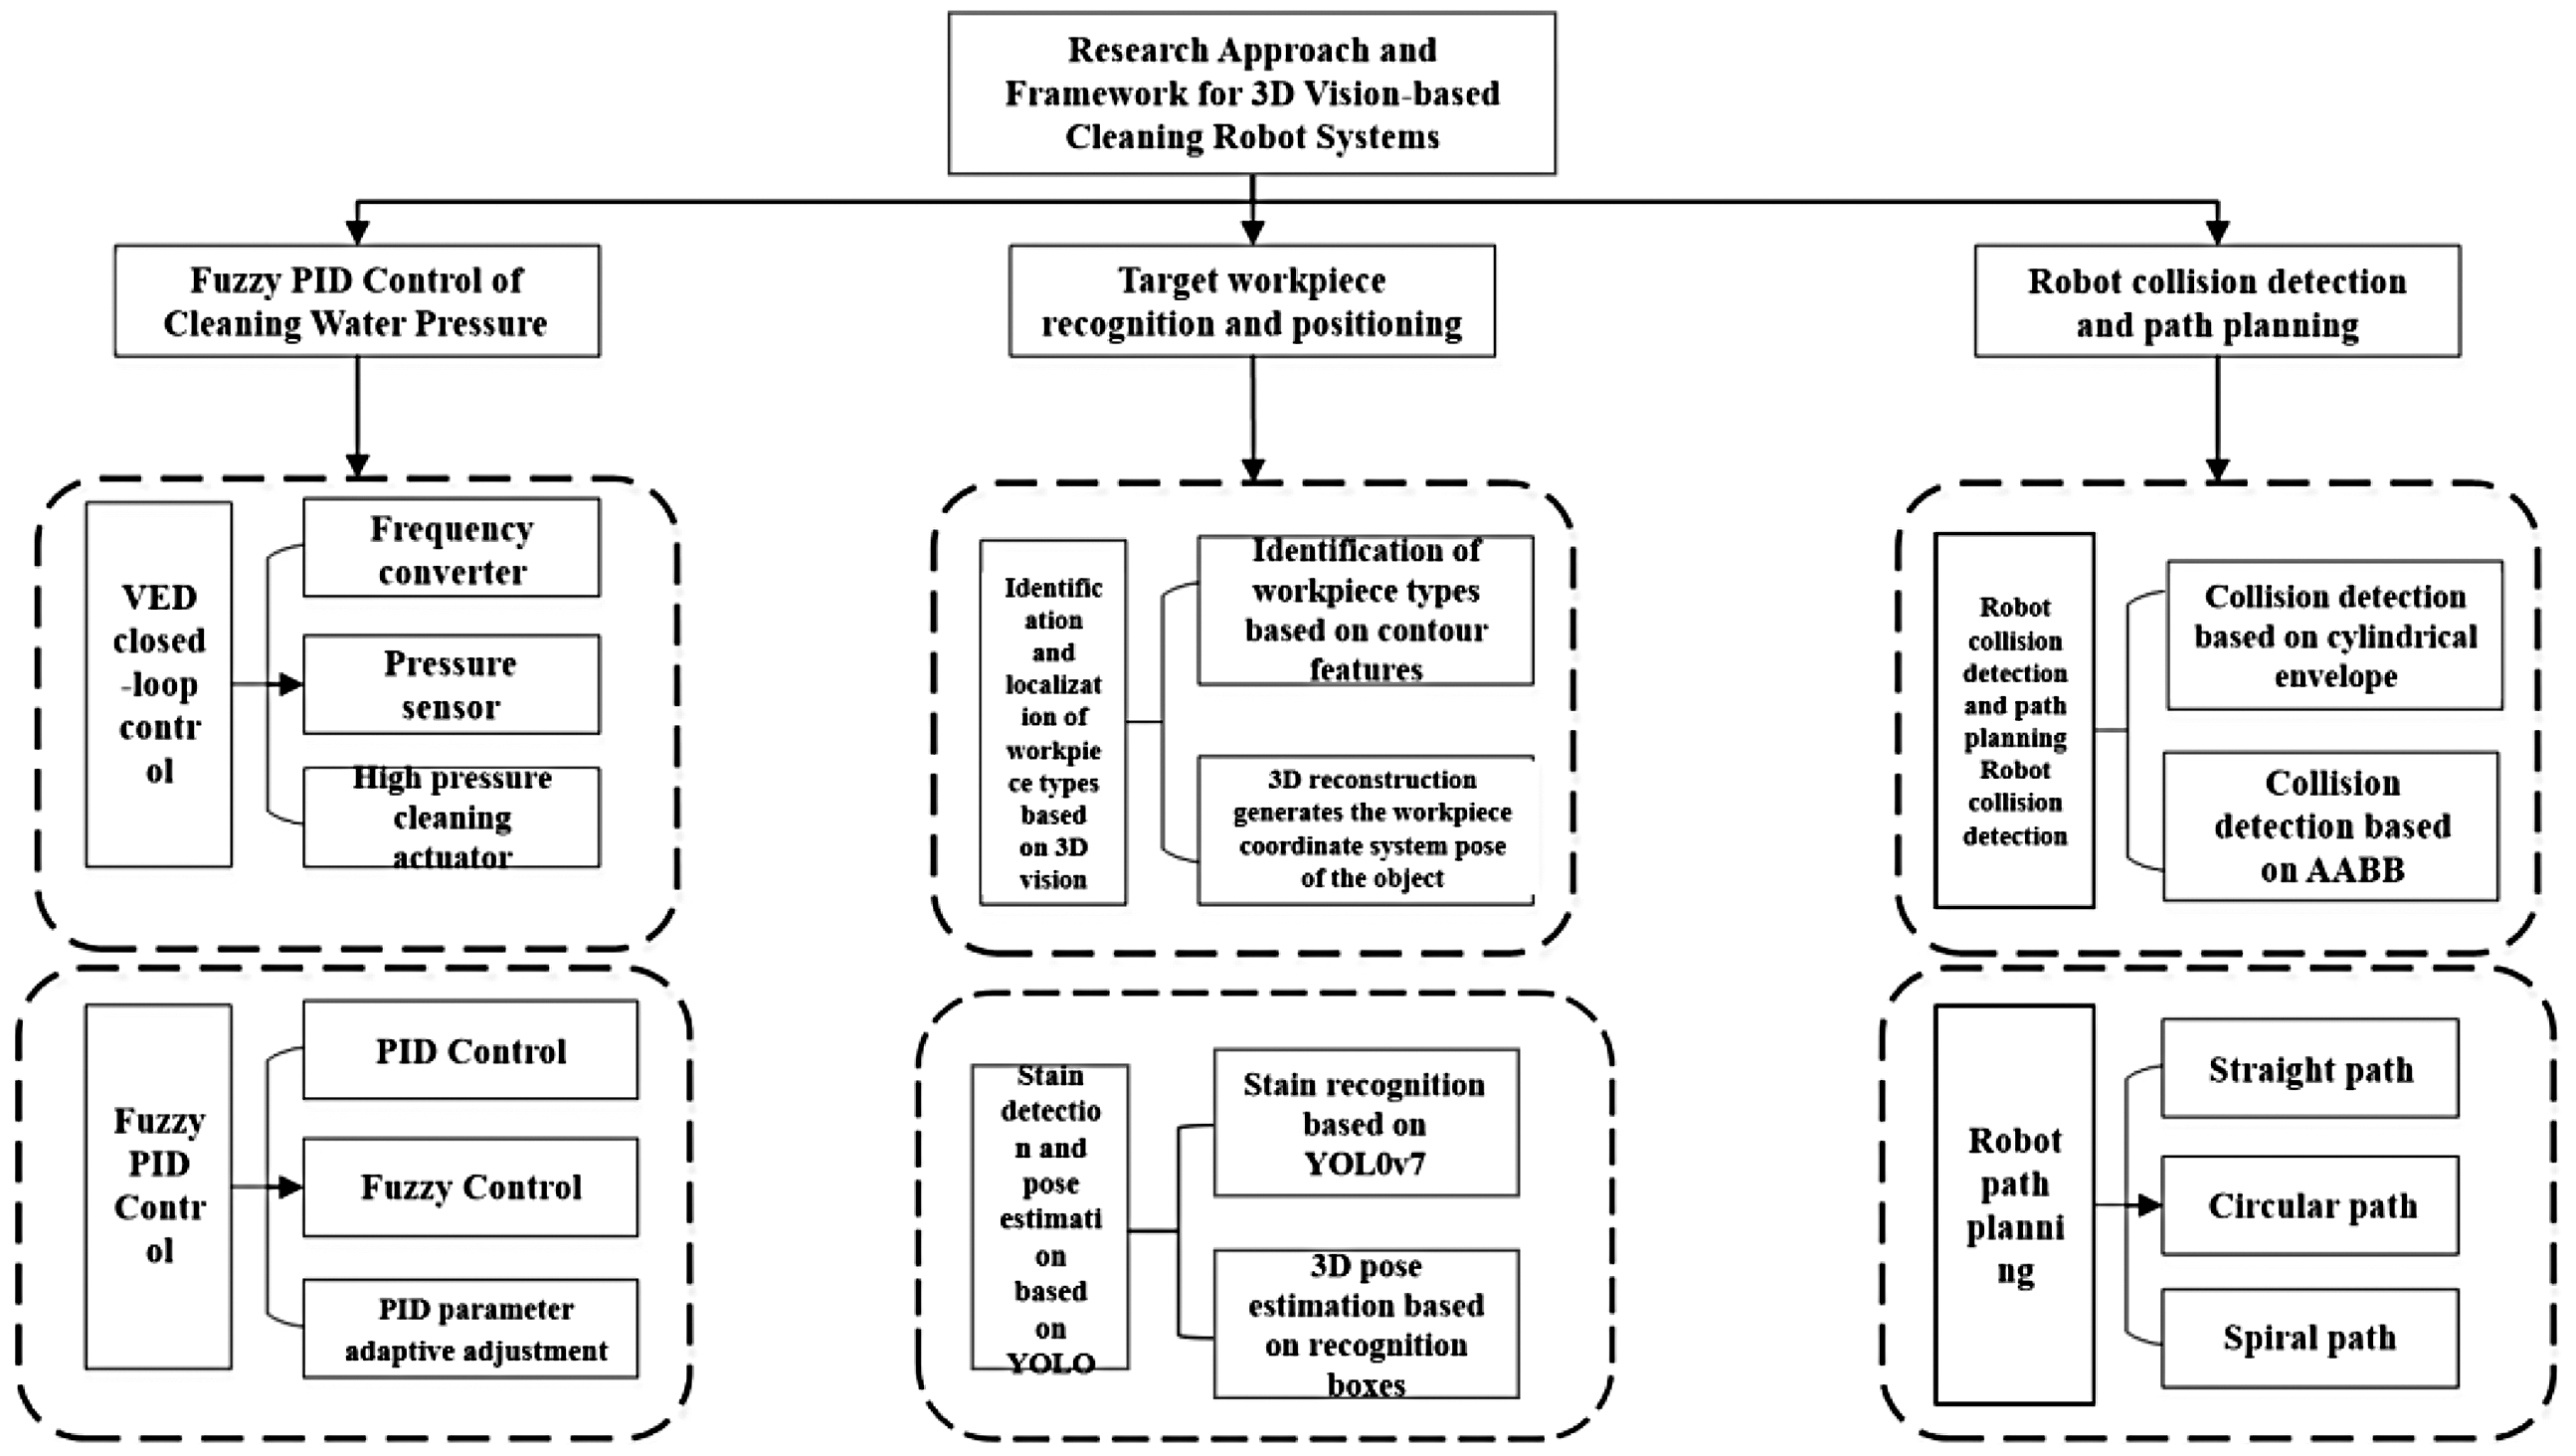
The block diagram of the system composition.
The cleaning robot system consisted of a frequency converter, a high-pressure cleaning actuator, and a pressure sensor. The high-pressure spray gun was attached to the end of the robotic arm, and the robotic arm controlled its movement. During the cleaning process, the cleaning pressure was monitored in real-time and precisely controlled to suit different workpieces and cleaning areas. This ensured the effectiveness of cleaning operations and prevented damage to structurally fragile parts. The fuzzy PID control method allowed for adaptive adjustment of the cleaning pressure PID control parameters, ensuring cleaning pressure control stability and reliability.
Before cleaning began, the system created a cleaning trajectory. First, a 3D camera captured RGB and depth images of the target workpiece in the cleaning scene. Next, real-time stain recognition was performed based on the RGB image using an object detection algorithm. Then, the depth images were used to calculate the camera pose for each image frame, yielding a set of camera poses. After that, the improved TSDF algorithm was employed to obtain the entire point cloud of the cleaning scene, and the robotic arm’s end pose corresponding to the target workpiece was calculated. Finally, the cleaning trajectory (i.e. the straight line, arc, or spiral) was determined. After the cleaning process was completed, it was necessary to evaluate the results of the finished cleaning operation. First, the YOLO algorithm, which has a high success rate in stain detection, was used to identify stains, and the area and color of each stain were quantified to determine a cleaning quality score.
To ensure cleaning quality, the robotic arm often needed to enter the workpiece cavity and approach the workpiece surface to clean the blind spots. To avoid collisions during the cleaning process and maintain a sufficient safety distance between the robotic arm and the target workpiece, collision detection on the robotic arm’s planned motion trajectory was performed during the motion trajectory planning process. In addition, to enable collision detection, the robotic arm’s and workpiece's envelope surfaces were created using the cylindrical envelope method and the AABB algorithm. In the trajectory planning process, the minimum distance between the robotic arm and the workpiece was tracked in real time. When the distance was less than the safe distance, the system issued a warning and prompted the user to change the intended motion trajectory.
Target recognition
During the model’s training process, the training loss and validation loss decreased rapidly in the early stages, as shown in Figure 14, which indicated that the model could rapidly learn some basic features and patterns. However, in the later stage of training, the convergence speed of the model decreased. This could be because the model had already learned most of the features and patterns, and future improvement necessitated more detailed optimization. Finally, both the training and validation losses tend to converge and essentially overlap, indicating that there was no significant overfitting during the model training process and that the model had good generalization ability.

The training and validation loss curves of the CIoU-YOLOv7 model.
As shown in Figure 15, after model training, the mean average accuracy (mAP) of the detection model gradually improved and eventually stabilized at around 62.34%. This suggested that the training method and parameter settings used in this study were relatively effective, and the trained model achieved a high level of accuracy.
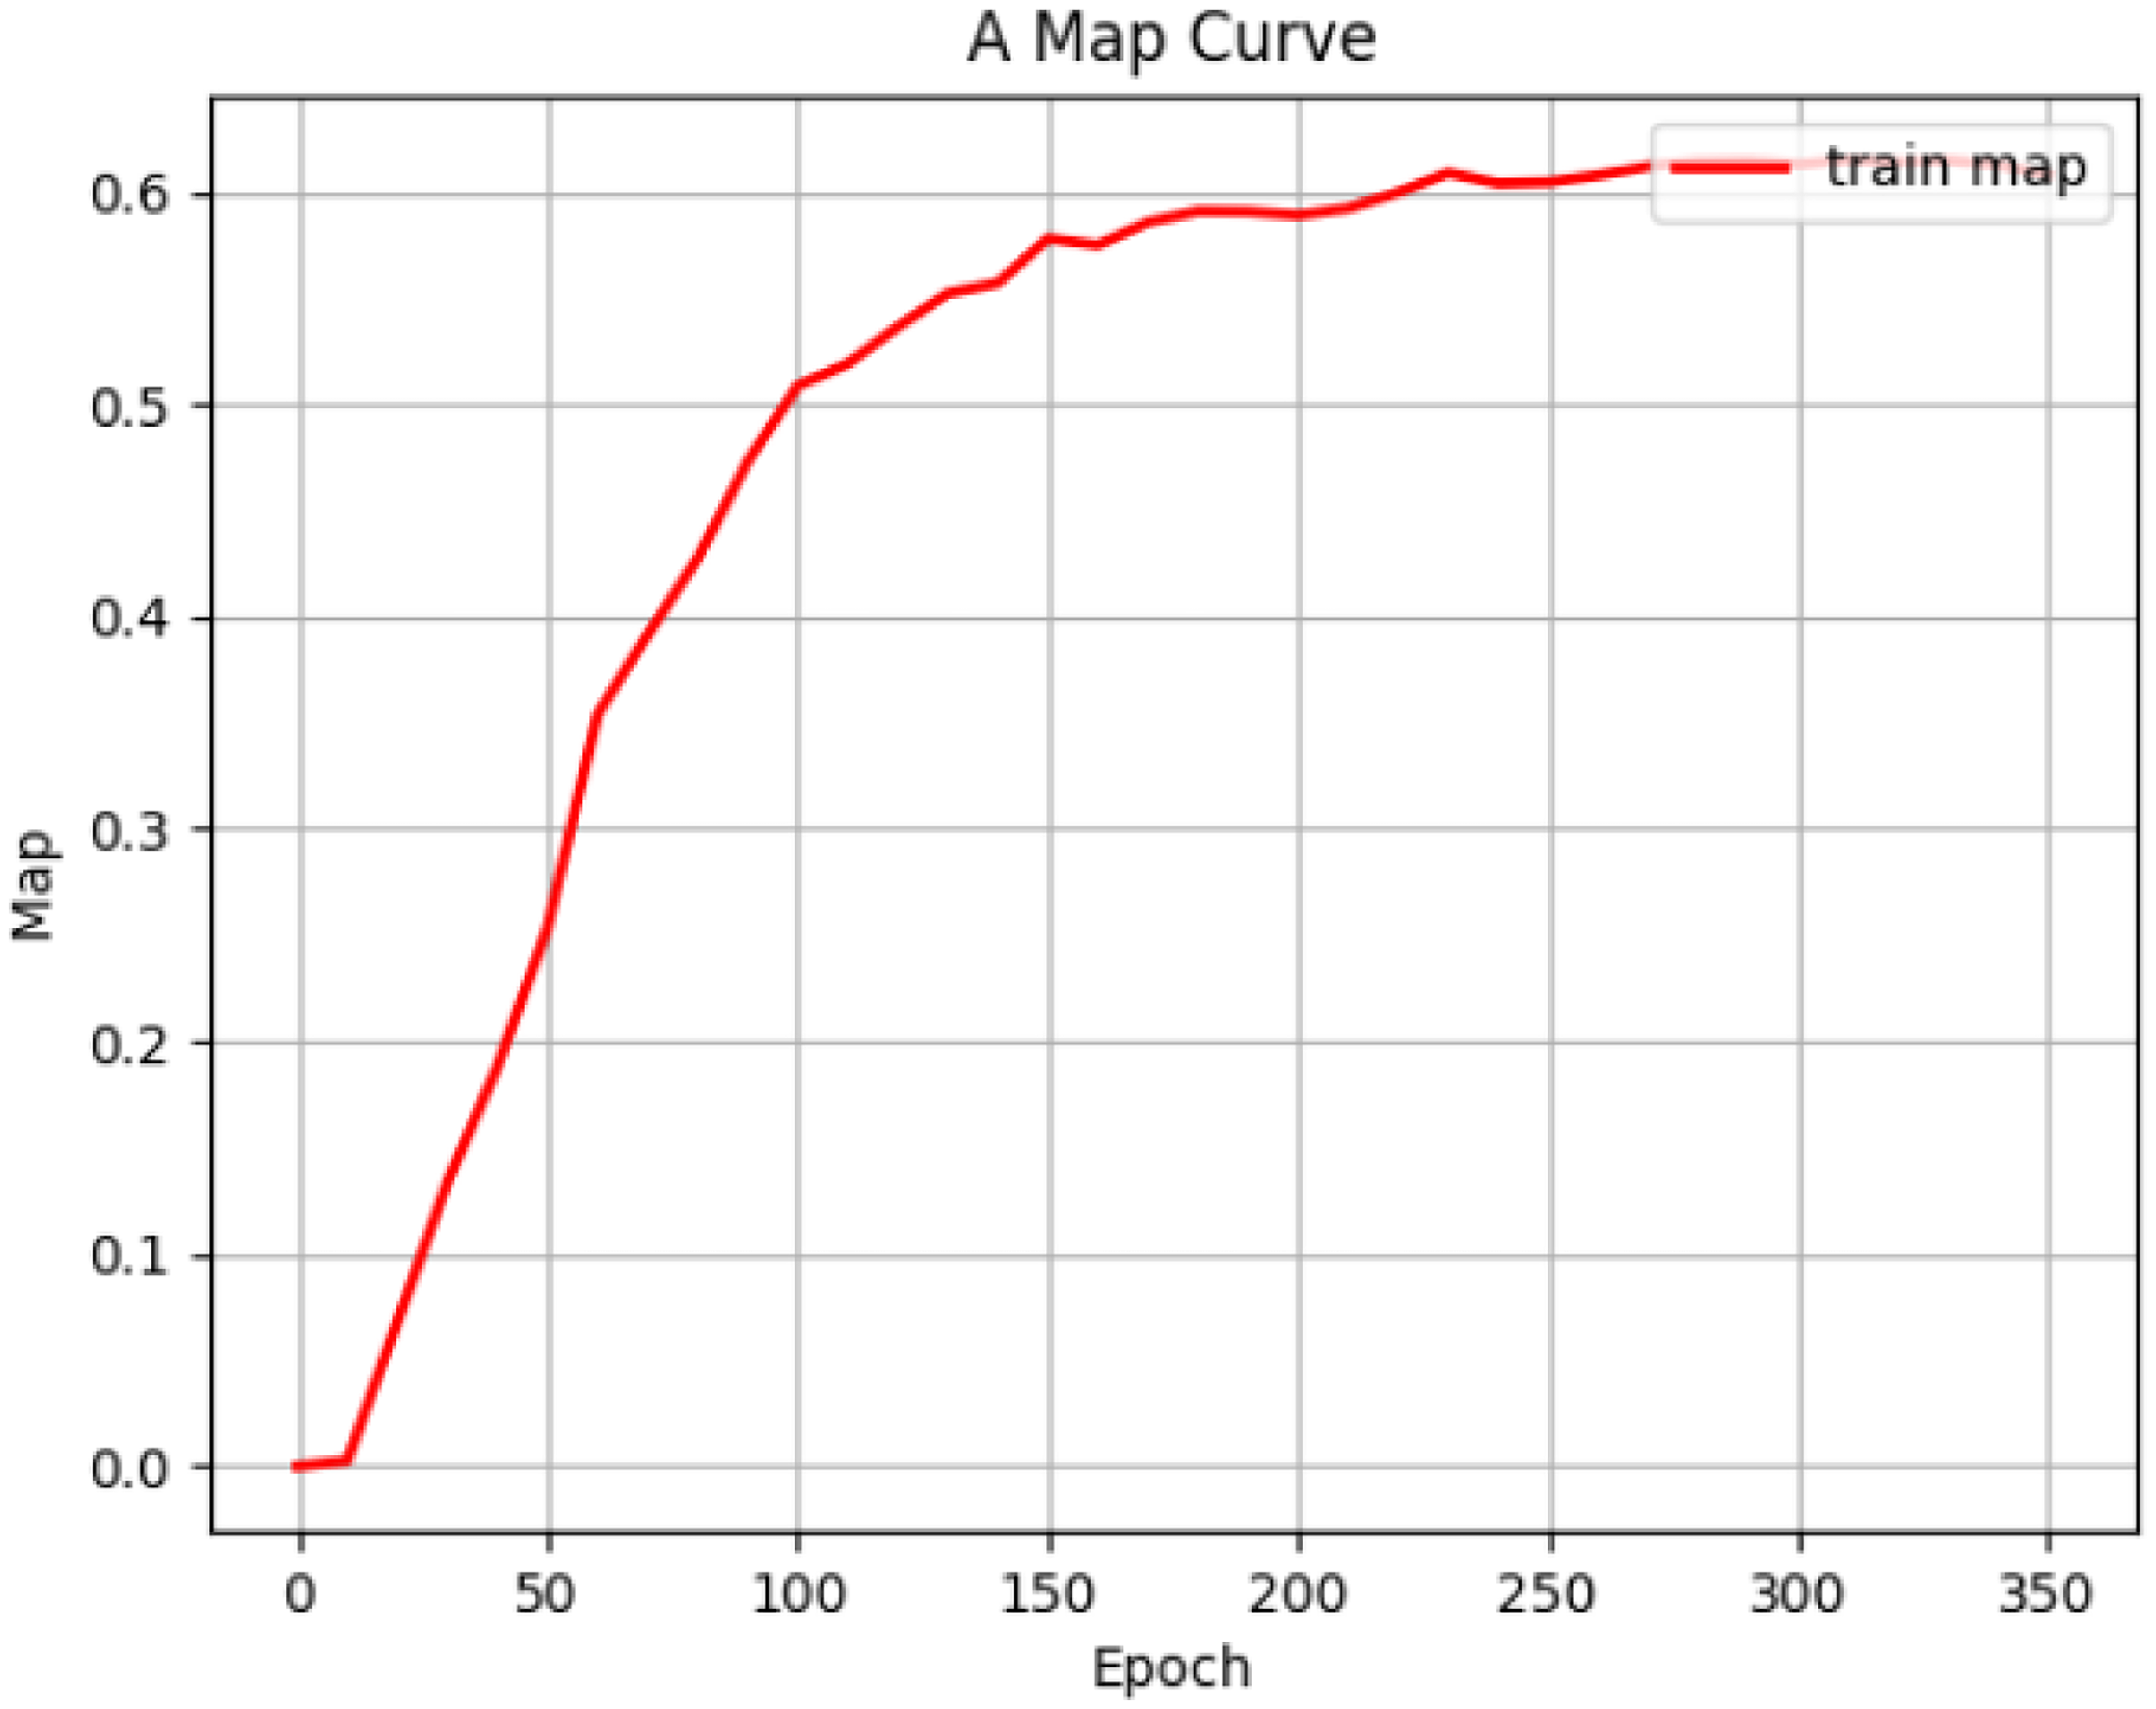
The mAP variation during the CIoU-YOLOv7 training process.
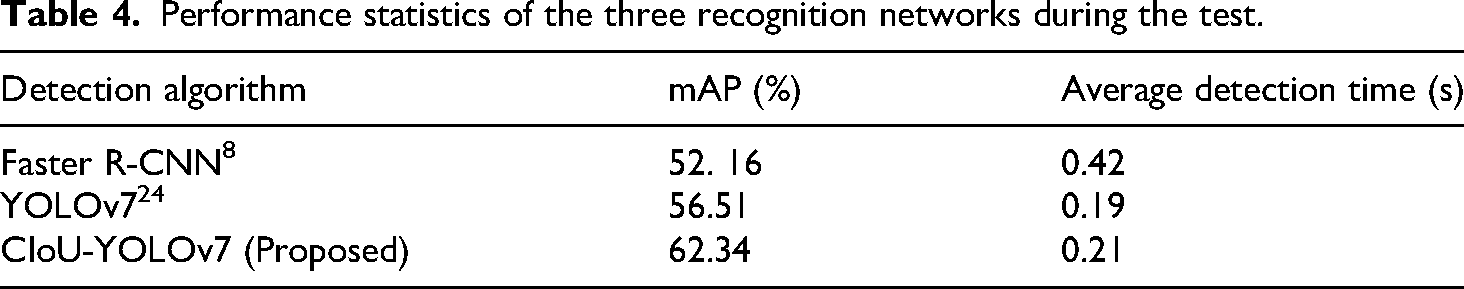
This study trained three recognition algorithm networks and used them to recognize stains: Faster R-CNN, 8 YOLOv7, 24 and improved CIoU-YOLOv7. The stain test set was conducted using all three models, and the results are presented in Table 1. As shown in Table 1, the three algorithms could accurately detect stains but showed a noticeable difference in the accuracy and speed of stain recognition. According to the test results in Table 4,8,24 the mAP of the CIoU-YOLOv7 model was 62.34%, which was 10.18% and 5.83% higher than the mAPs of the Faster R-CNN (52.16%) and YOLOv7 (56.51%) models. This demonstrated that the CIoU-YOLOv7 model significantly improved the accuracy of stain detection. Therefore, the CIoU-YOLOv7 was finally selected as a stain detection algorithm. This model not only achieved a significant improvement in accuracy compared to the other two models but also maintained an acceptable range of detection time, which could meet the requirements of practical applications.
Performance statistics of the three recognition networks during the test.
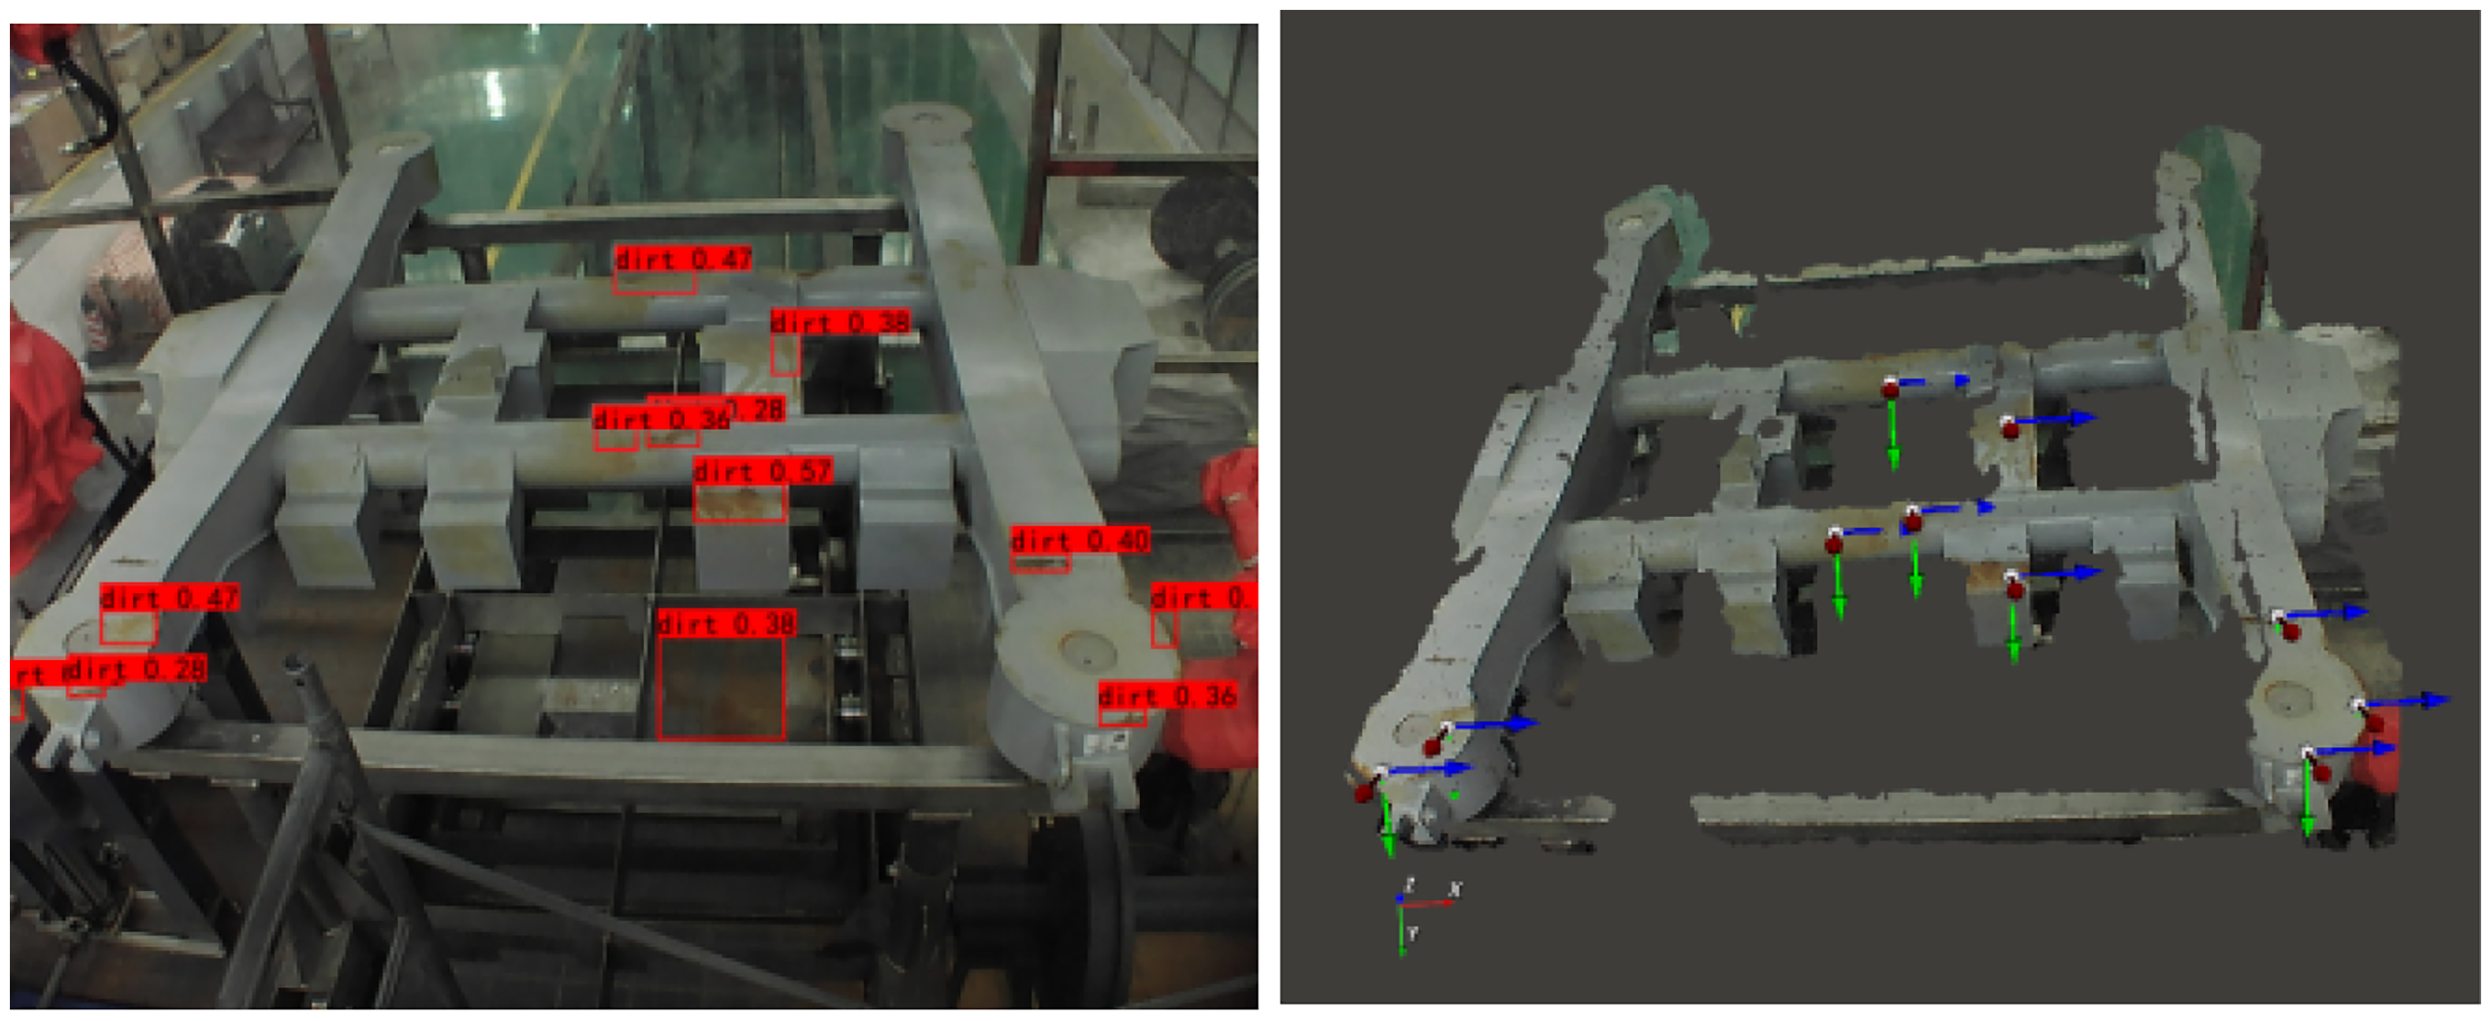
The visualized inference performance of the CIoU-YOLOv7 model is presented in Figure 16, where it can be seen that some basic stains on the bogie could be identified, with a recognition rate of over 80% for some stains.

The visualized inference performance of the CIoU-YOLOv7 model.
Although the CIoU-YOLOv7 model achieved a mAP value of 62.34% in the bogie stain detection task, there remained a performance gap compared to the state-of-the-art results on general datasets. However, it should be noted that this performance needs to be comprehensively analyzed, considering the specific characteristics of industrial detection scenarios.
In terms of dataset construction and division, the dedicated stain dataset for high-speed train bogies constructed in this study contained a total of 4526 high-resolution images, with a resolution of 2048 × 1536 pixels. All data were collected at actual operation and maintenance sites, which ensured the authenticity and diversity of the dataset. The dataset was divided according to the 7:2:1 ratio into training, validation, and test sets consisting of 3,168, 905, and 453 images, respectively.
Following the definition of stain categories and considering actual characteristics of industrial inspection, this study classified stains into the following four types:
Oily Attachments: These stains mainly included liquid contaminants, such as lubricating oil and grease, presenting a dark and viscous state with blurred boundaries and low contrast against the metal background; Rust and Oxide Deposits: These stains denoted reddish-brown or dark-colored deposits formed by the oxidation of metal surfaces, featuring diverse morphologies and rough surfaces; Particulate Mixtures: These stains represented mixtures of fine particles, such as sand and iron powder, and were characterized by uneven distribution and diffuse edges; Organic stains: These stains included organic substances, such as bird droppings and insect residues, with irregular shapes and variable colors.
In the aspect of detection difficulty, stain detection in industrial scenarios faces the following inherent challenges. First, the contrast between the stains and the background is low, with blurred boundaries. Second, there is a large morphological diversity, ranging from large-area oil stains to fine metal dust. Third, occlusion is severe, and adhesion is uneven.
According to the statistics, approximately 35% of the instances in the test set denoted challenging samples with low contrast, which fundamentally affected the upper limit of the detection performance. In terms of model selection, considering the real-time requirement in actual deployment (the inference time shorter than 0.25 s), this study selected the YOLOv7 model as a baseline model instead of using architectures with high computational complexity. This ensured a necessary trade-off between detection accuracy and inference efficiency.
Moreover, the imbalanced distribution among the four categories might also have a certain impact on the overall detection performance. In addition, there was a significant imbalance in the number distribution of annotation boxes between the four stain types, with a roughly ratio of 5:3:2:1. Although the improved CIoU-NMS strategy effectively addressed the missed detection problem of dense targets to a certain extent, how to handle minority categories required further research.
Furthermore, to achieve precise cleaning, it was essential to convert the 2D stain coordinate positions identified from RGB images by the YOLOv7 model into 3D point cloud coordinate positions operable by the robotic arm. This conversion process relied on accurate camera calibration and point cloud data processing, and its specific workflow was as follows.
First, the original point cloud data were preprocessed, which was crucial for ensuring the accuracy and efficiency of subsequent calculations. The original point cloud data directly collected by the 3D camera are depicted in the left image of Figure 17, where it can be seen that it contained background interference, such as the workbench, in addition to the target bogie, and had an extremely high point cloud density. Therefore, to achieve precise identification and efficient calculation, this study performed two point cloud cropping operations and one downsampling operation in sequence. The first cropping was conducted to remove irrelevant point clouds, such as the background and workbench; the second cropping was performed to accurately separate the key components of the bogie; lastly, the final voxel grid downsampling significantly reduced the total amount of data while maximizing the retention of the geometric features of the point cloud. The processed point cloud was purer and more compact compared to the unprocessed one, as shown in the right image of Figure 17, laying a foundation for subsequent precise matching.

Comparison of the point cloud before and after processing.
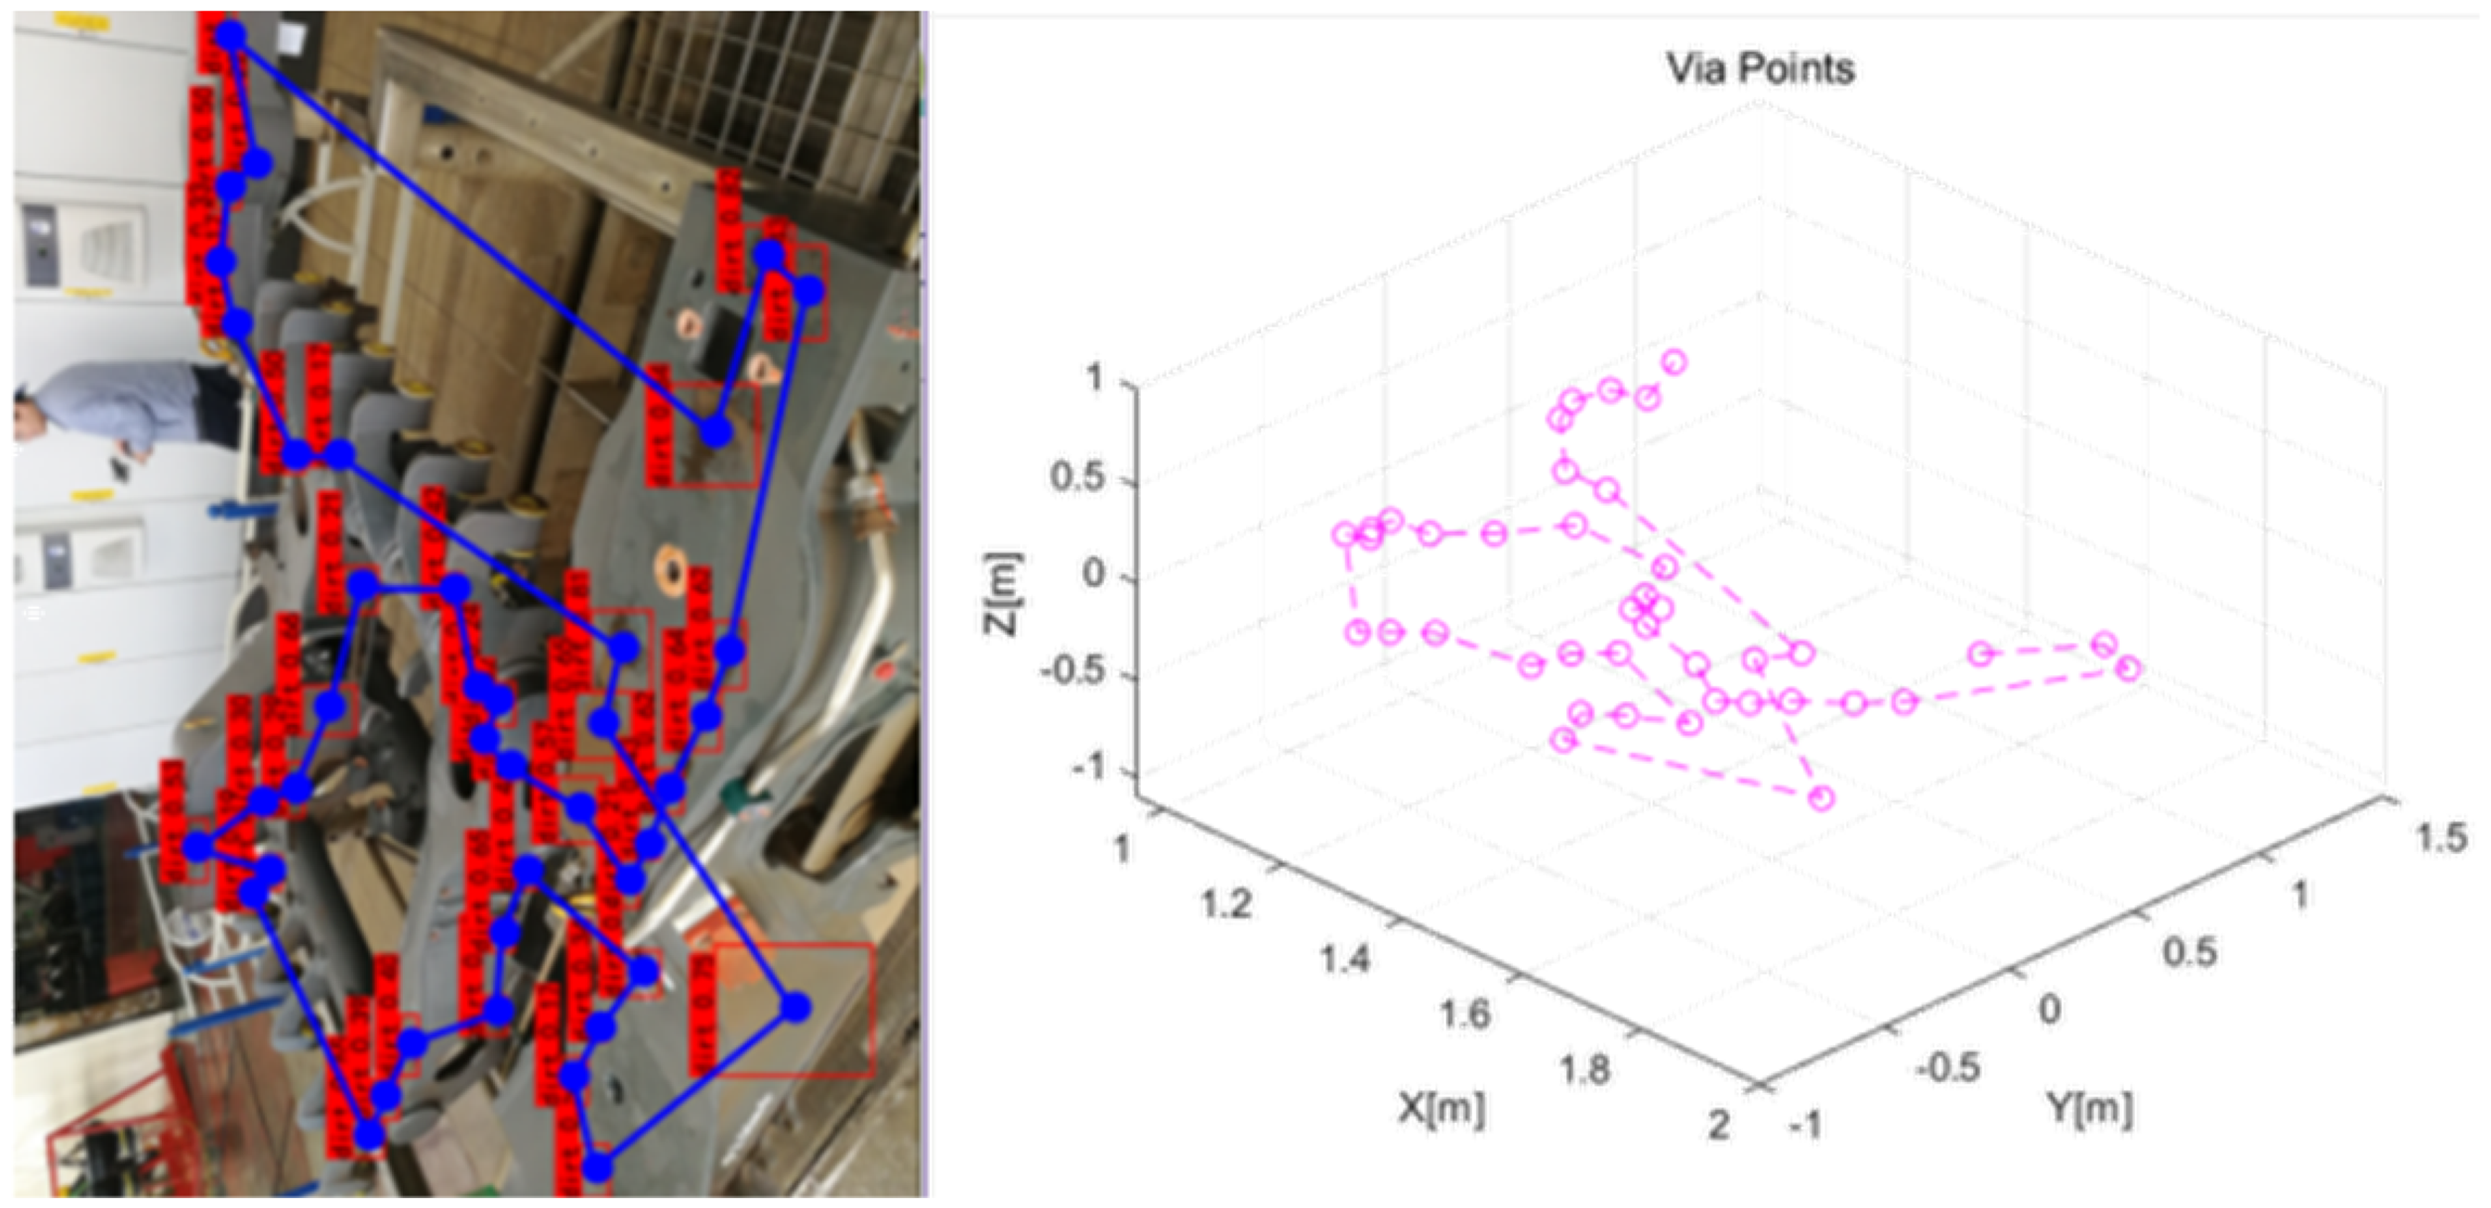
Figure 18 depicts the mapping process of the RGB pixel positions of the stains to point cloud positions; the left image depicts the stain processing procedure. The 2D coordinate positions of the stains were input as a list to the model to generate the corresponding 3D point cloud coordinates, as shown in the right image of Figure 18.
The mapping process of 2D coordinates to 3D point cloud coordinates.
The core coordinate mapping and conversion processes were performed, as illustrated in Figure 18. Mathematically, the essence of this procedure lies in establishing a mapping relationship between the pixel coordinate system (u, v) and the 3D camera coordinate system (X, Y, Z) based on the internal parameters (focal length, principal point) and external parameters obtained from camera calibration. Specifically, for each 2D stain bounding box identified by the YOLOv7 model, the pixel coordinates [u, v] of the bottom edge of its center were extracted. Then, combining these coordinates with the corresponding depth value Z of this point in the depth map, its 3D coordinates were inversely calculated using the formula below. In addition, by aggregating all calculated 3D points, the pink point cloud cluster was obtained, as shown in the right image of Figure 18, which hovered above the bogie point cloud's surface. This point cloud cluster represented the precise 3D spatial positions of the stains and was directly used to guide the robotic arm in subsequent cleaning operations.
The conversion process integrated computer vision, photogrammetric geometry, and point cloud processing technologies, serving as a crucial bridge connecting perception and execution and ultimately providing cleaning robots with precise targets for operation.
Cleaning path planning
To comprehensively evaluate the performance of the IGA proposed in this paper, this study constructs a multilevel and representative baseline algorithm pool for comprehensive comparison. The selected comparison algorithms cover three major categories of mainstream path planning methods: search-based, sampling-based, and meta-heuristic methods, so as to ensure the breadth and depth of the comparison.
Comparison algorithms
Search-based planning algorithms are represented by the A* (A-Star) algorithm. As a classic method for path planning, this algorithm guarantees finding the optimal solution and has often been used as a benchmark method in performance evaluation of various algorithms. 17 In this study, the cleaning scenario was discretized into a grid map, the stain points to be cleaned were regarded as nodes to be visited, and a complete graph model was constructed for them. The A* algorithm was employed to search for the shortest path that starts from the initial point, traverses all stain points, and finally returns to the end point. This algorithm can achieve high solution quality, but its computational cost increases sharply with the expansion of problem scale, making it suitable for use as a reference benchmark for optimal solutions.
Sampling-based planning algorithms are represented by the rapidly-exploring random tree star (RRT*) algorithm. As one of the most advanced algorithms in the motion planning field, the RRT* algorithm is particularly suitable for path planning in high-dimensional spaces, such as the configuration space of robotic arms. 18 In this study, the RRT* algorithm was used in the workspace of the robotic arm, allowing for exploration under obstacle avoidance constraints and optimization of the path starting from the initial point, reaching the end point, and covering all stain points. The RRT* algorithm is a probabilistically complete and asymptotically optimal algorithm. Since both the RRT* algorithm and the IGA algorithm belong to random optimization algorithms, the comparison results were more convincing.
In terms of meta-heuristic algorithms, this study selected the particle swarm optimization (PSO) algorithm and the simulated annealing (SA) algorithm for comparison. The PSO algorithm simulates the social behavior of bird flocks and updates the search direction based on historical data on optimal positions of individuals and the swarm. 19 In contrast, the SA algorithm simulates the solid annealing process and avoids falling into local optimal solutions through probabilistic jump characteristics. 19 The two algorithms, together with the IGA algorithm, belong to bionic optimization algorithms. The PSO and SA algorithms adopt the same real-number coding scheme (i.e. the path sequence) and fitness function (i.e. the total path length) as the IGA algorithm, so the comparison can highlight the unique advantages of the IGA algorithm in solving traveling salesman problems, such as convergence speed and solution quality.
The parameters of all comparison algorithms were carefully tuned to ensure the fairness of the comparison. The basic genetic algorithm (Basic GA) and IGA had the same parameters, such as crossover rate and mutation rate, while the parameter settings of the PSO and SA algorithms followed the empirical values provided in the literature and were determined through preliminary experiments.
Comprehensive evaluation index system
To overcome the limitations of single-index evaluation, this study established a comprehensive evaluation index system from three dimensions, including solution quality, algorithm efficiency, and stability, to characterize algorithm performance from multiple perspectives.
Solution quality represents the main metric in evaluating planning algorithms’ performance. This study used the final path length, 
Algorithm efficiency is crucial for evaluating the real-time performance of industrial cleaning applications. This study employed two indicators, convergence speed and running time, to evaluate algorithm efficiency. The convergence speed was intuitively demonstrated by recording the change curve of the optimal fitness value during the algorithm’s iteration process, which reflected how fast the algorithm could find high-quality solutions. The CPU running time (Tcpu) was the CPU time required for each algorithm to output a stable solution from the start under the same hardware environment. It directly measured the computational efficiency of the algorithm and was a key indicator for evaluating its engineering practicality.
Stability reflects the performance fluctuation of an algorithm across different runs and is commonly used to evaluate the algorithm’s robustness. For random algorithms such as genetic algorithms, PSO, SA, and RRT*, this study conducted 30 independent runs and recorded the mean value (μ) and standard deviation (σ) of their final path lengths. A smaller standard deviation (σ) value indicated better stability of the algorithm and less influence from initial random conditions.
Comparative experimental results and analysis
By using the established evaluation system, the performance of all algorithms was evaluated in the same test environment, and their results were compared.
The performance comparison results of the algorithms are presented in Table 5. In terms of solution quality, the A algorithm served as an optimal reference with a relative gap rate of zero. The final path length of the IGA algorithm was the closest to the optimal solution, with a relative gap rate of only 3%, which was significantly better than that of the PSO, RRT*, and basic GA algorithms. It is worth noting that although the RRT* algorithm could also find a relatively optimal solution (G = 5.5%), but its computation time was far longer than that of the other meta-heuristic algorithms.
Comprehensive performance comparison of various algorithms (mean ± standard deviation).

As shown in Figure 19, the curve of Algorithm A (cyan solid line) was a horizontal line parallel to the horizontal axis, lying at the lowest position of the vertical axis. This indicated that, as a deterministic algorithm, the A algorithm could obtain the global optimal solution of 14,210 mm at the very beginning of calculation, and its result remained stable in each run. Its convergence curve confirmed the rationality of using it as a reference benchmark for the optimal solution. However, it is worth noting that its computation time of 85.2 s (refer to Table 5) was much longer than that of the other algorithms.

Convergence curves of the six algorithms.
In contrast, the curve of the NN algorithm (yellow solid line in Figure 19) exhibited the characteristic of one-step convergence; namely, it dropped rapidly after the first iteration and then remained a horizontal line. This reflected the NN algorithm's essence as a greedy constructive algorithm that could rapidly generate a feasible solution of 16,276 mm by selecting the NN point at each moment. Although the quality of its solution was relatively poor, its ultra-short computation time of less than 0.1 s made it highly suitable for serving as a high-quality initial solution for optimization algorithms, such as the IGA algorithm.
The curve of the RRT* algorithm (purple dotted line in Figure 19) showed a smooth and continuous downward trend, which denoted a typical manifestation of the asymptotic optimality characteristic. The slope of the curve gradually flattened, indicating that as the number of sampling points increased, the marginal benefit of path optimization decreased. Eventually, this algorithm could find a relatively good solution of 14,985 mm, but it required a considerable amount of computation time (35.4 s) to achieve asymptotic optimization.
Regarding the meta-heuristic algorithm group, including the IGA, PSO, and basic GA algorithms, all algorithms performed an obvious iterative optimization process, but their convergence patterns differed. The PSO algorithm (green dash-dot line in Figure 19) demonstrated the characteristic of fast convergence in the early stage. Specifically, it rapidly approached a relatively optimal solution within 20 generations. However, in the later stage, it fell into a local optimum, causing the curve to flatten prematurely, which limited the quality of the final solution of 15,173 mm. The basic GA algorithm (blue dashed line in Figure 19) had a significantly slower convergence speed than the other meta-heuristic algorithms, and its optimization effect was limited in the first 100 generations. It could not find a stable solution until after 150 generations. Moreover, it achieved the worst-quality final solution of 16,357 mm among all the algorithms, indicating its low search efficiency.
The proposed IGA algorithm (red solid line in Figure 19) demonstrated the convergence characteristic of comprehensive optimality. It inherited the advantage of the PSO algorithm's fast convergence in the early stage, overcame the defect of premature convergence, and continued optimization until reaching the final solution of 14,642 mm. The convergence process was stable with small fluctuations and strong robustness.
This study also conducted a comparison between the genetic algorithms’ performance before and after improvement, using the NN-based algorithm and the proposed IGA algorithm. Figure 20 illustrates the paths before and after optimization. The original paths, shown in the left image of Figure 20, had a total distance of 46,116.5 units. The optimized paths, obtained using the NN algorithm, had a reduced total distance of 16,276.1 units, demonstrating a 64.7% reduction in the total distance. Further optimization was achieved using the IGA. This algorithm introduced a high-fitness individual, known as a super individual, into the first-generation population. The offspring of this individual had significant genetic advantages, and the optimization process was centered around it. Compared to the NN algorithm, the IGA could significantly reduce the number of iterations, decreasing the number of generations required to achieve a similar or better solution from 2000 to 200.

The iteration results of the basic genetic algorithm (NN-based) (left) and the IGN algorithm (right).
The comparison results of the basic and IGA algorithms after 10,000 iterations are presented in Figure 21. The results indicated that the basic genetic algorithm had a final total distance of 16,357 units, and the IGA achieved a total distance of 14,642 units, showing a 10.5% reduction in the total distance compared to the basic genetic algorithm.

The iteration results of the basic genetic algorithm (left) and the IGA (right).
Figure 22 shows the iteration results of the two genetic algorithms. The IGA achieved better results within 200 generations than the basic genetic algorithm, reaching a total distance of 14,642 units. In contrast, the basic genetic algorithm required 4000 generations to converge, resulting in a total distance of 16,357 units. The intervention of the NN algorithm significantly enhanced the population’s genetic advantage, reducing the time required to obtain the optimal solution by 95% while improving iteration efficiency. This arrangement could meet the requirements of the bogie cleaning process, significantly reducing computational time and improving solution quality.
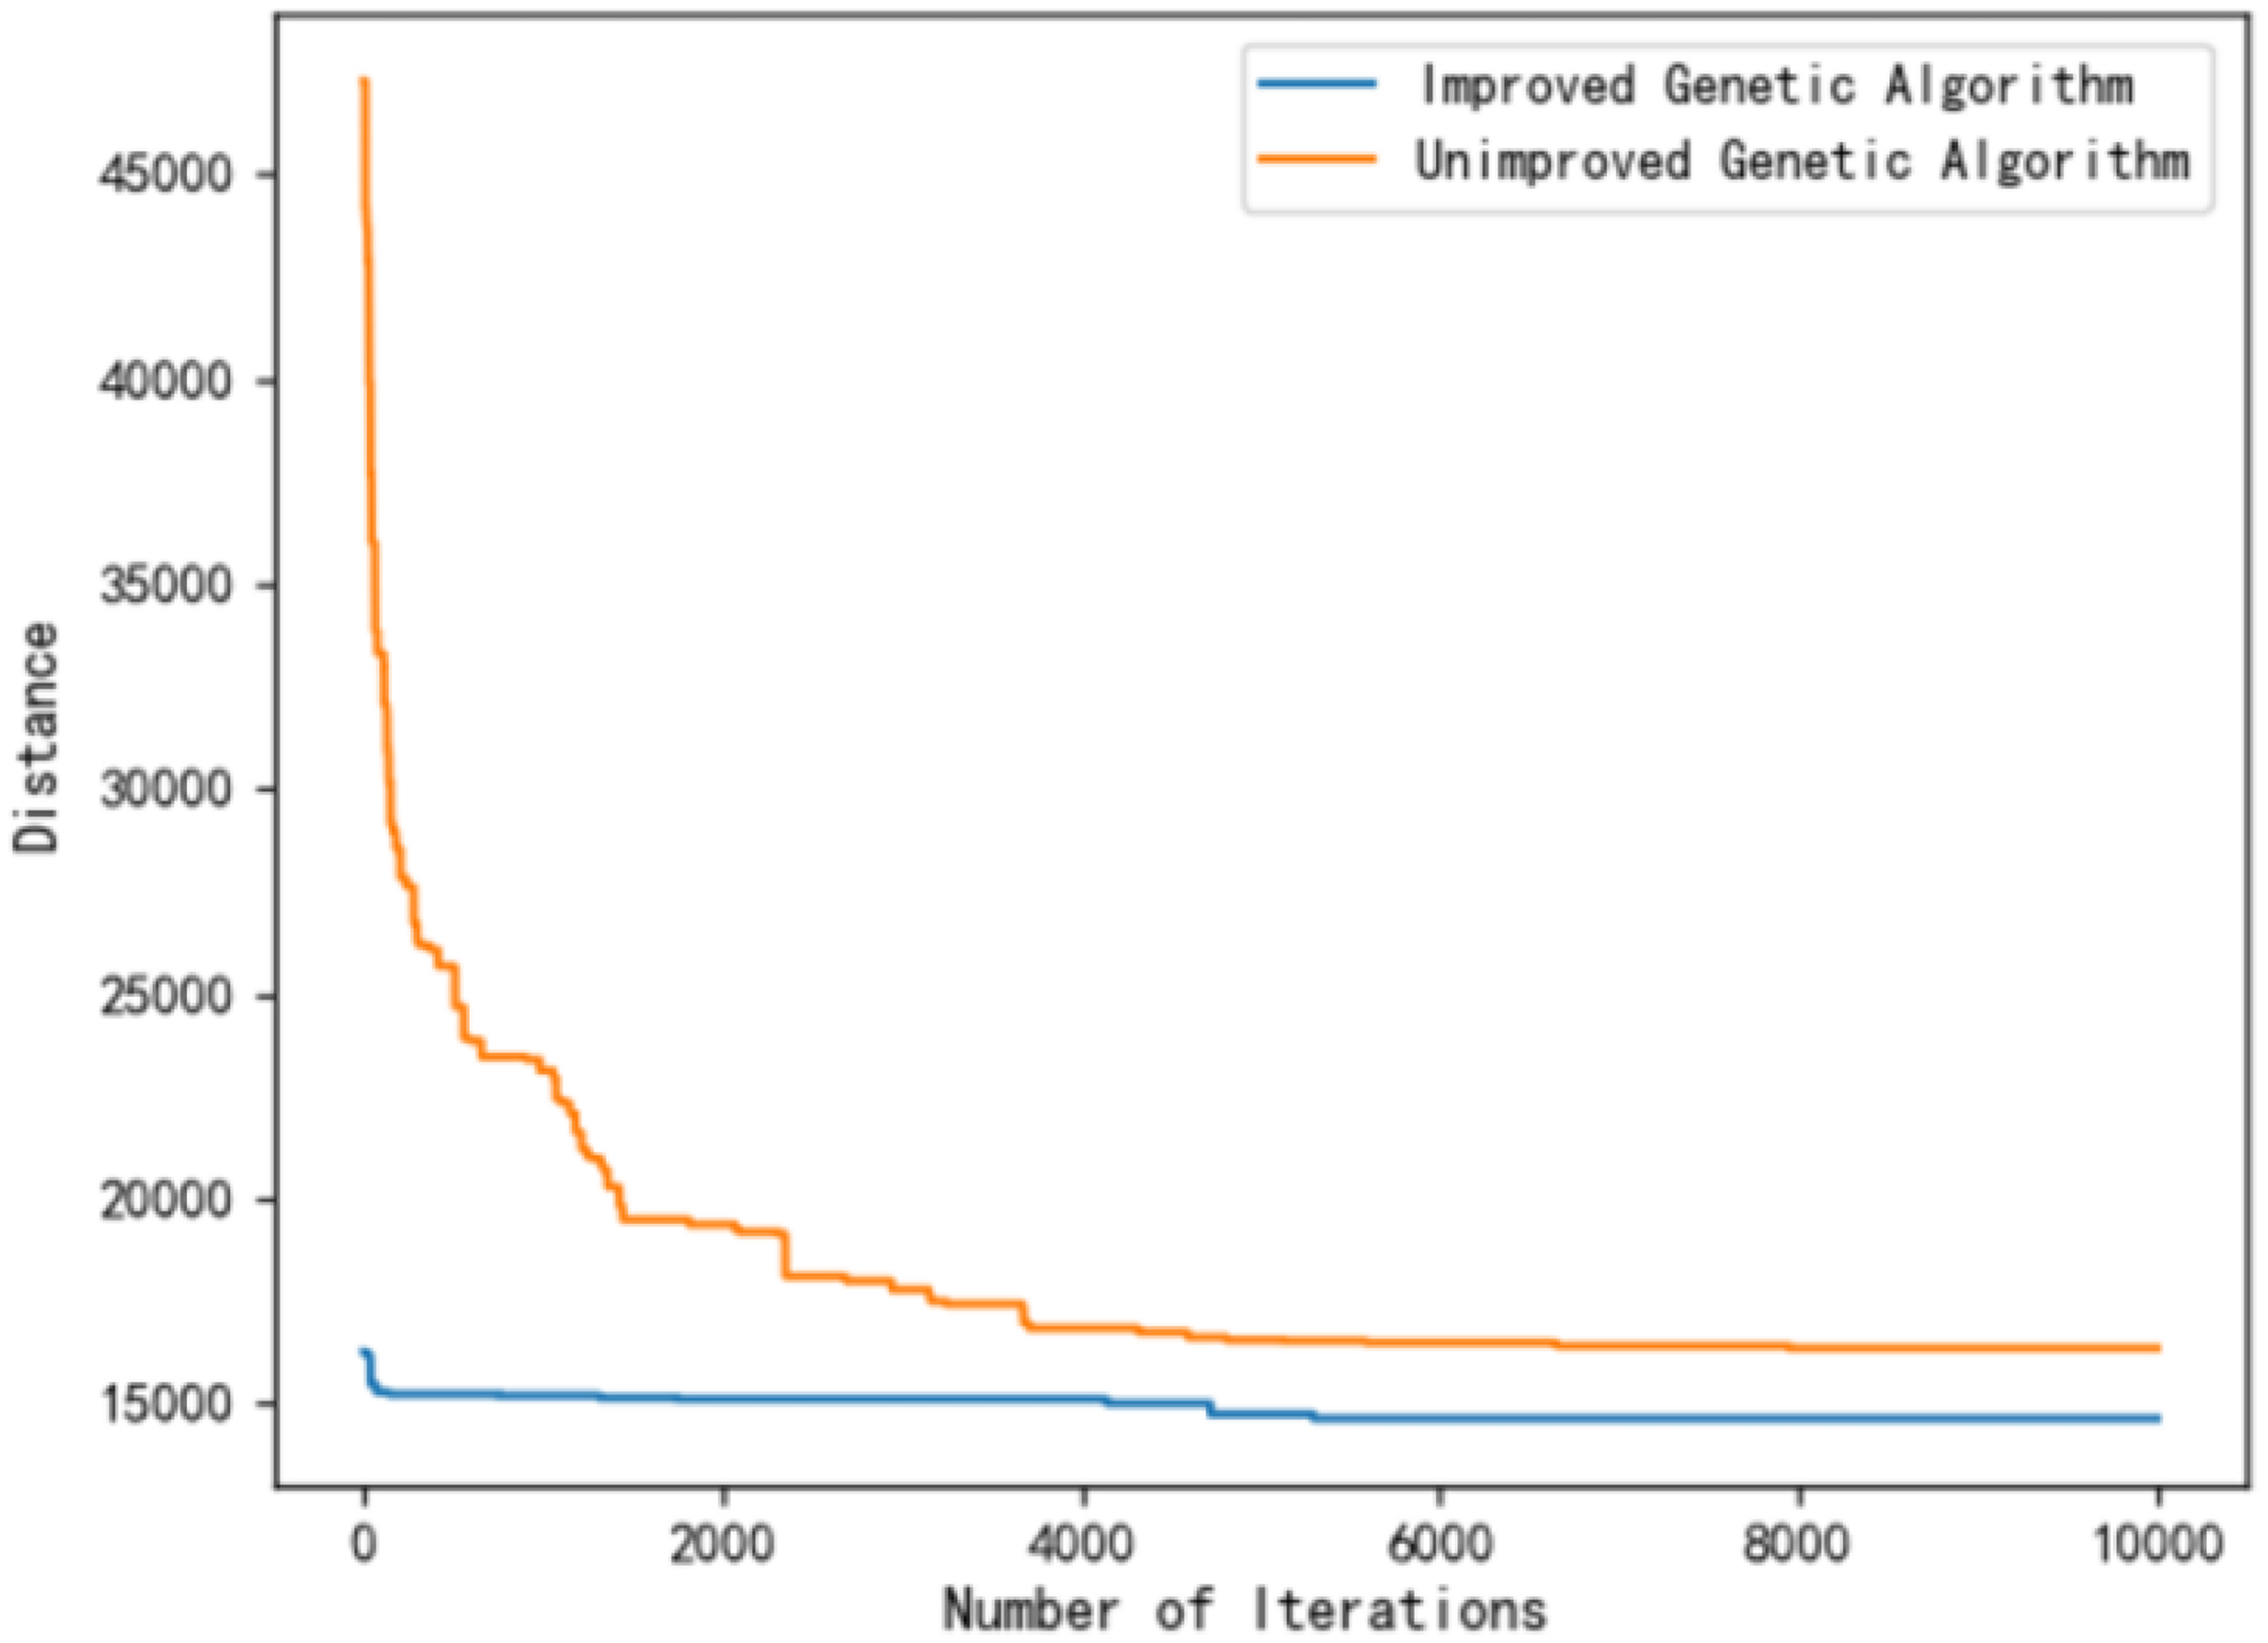
Comparison of the iteration results of the two genetic algorithms.
Cleaning trajectory planning
The obtained path planning sequence points were further investigated. The right diagram in Figure 23 depicts the spatial coordinate point sequence of the stains displayed in MATLAB. The next step was to use different trajectory planning methods to obtain joint variable values for controlling the motion of the robotic arm, allowing the robotic arm's end to traverse the upper end of each stain in sequence.
The diagram after the path planning result was input into MATLAB.
Joint space trajectory planning enables easy control of force and torque while avoiding singularities and collisions. However, it is challenging to ensure the accuracy of the end actuator’s path and the successful implementation of complex paths. In addition, Cartesian space trajectory planning allows for direct control of the end actuator’s path, as well as the implementation of complex paths. Still, it requires solving inverse kinematics questions, which may result in singularities and collisions. Figure 24 depicts a schematic diagram of the joint angle positions obtained during trajectory planning in two different spaces. The joint angle was directly used as a variable to control the robotic arm.

Changes in the angles of the six joints in two different spaces.
Considering that the cleaning site was equipped with a computer system with sufficient computing power and that the cleaning task did not require high real-time performance, this study opted for Cartesian space trajectory planning based on fifth-degree polynomial interpolation to ensure high cleaning quality at the cost of computational complexity and time. Finally, the cleaning quality effect is presented in Figure 25, where it can be seen that it met the requirements.
Demonstration of the achieved cleaning quality.
Conclusion
This study introduces a cleaning robot system integrated with 3D vision technology. Equipped with a water gun on a six-degree-of-freedom robotic arm, the proposed system combines the low-pressure, high-flow cleaning process with the high-pressure, low-flow cleaning process, thereby reducing cleaning path distance by 64.7% while improving cleaning efficiency by 10.5% compared to the basic genetic algorithm. In addition, the stain detection accuracy is enhanced by 5–10%, reaching 62.34%. Moreover, through the closed-loop integration of visual perception and motion control, the proposed system achieves full automation of the entire cleaning process, including the identification, localization, and autonomous cleaning of stains on workpiece surfaces. While saving water resources, the proposed system enhances cleaning effectiveness and demonstrates distinct advantages, particularly in cleaning key areas and hard-to-reach dead corners.
This study thoroughly explores the trajectory planning technology of cleaning robots based on 3D vision. By applying an improved template matching algorithm and an optimized YOLOv7 target detection algorithm, the proposed system can rapidly identify workpieces and detect stains, accurately calculate the positions of workpieces and stains, and provide a precise coordinate system for a robot. In addition, by optimizing the cleaning path using the IGA, the proposed system can automatically clean a variety of different workpieces, further improving the efficiency and quality of cleaning operations. Compared to the advanced baseline algorithms, the proposed IGA shortens the path length by an average of 10.5% and increases the convergence speed by approximately 64.7%. Furthermore, the proposed system reduces the number of generations required for an optimal solution by 95%, demonstrating improved cleaning efficiency and practicality.
This study aims to provide an innovative intelligent solution for the industrial cleaning industry to achieve efficient and precise cleaning operations, reduce manual operations, and enhance the reliability and stability of cleaning processes. The proposed system has broad application prospects in the fields of rail transit, aerospace, and automobile manufacturing, and is particularly suitable for regular maintenance and cleaning operations of large-scale complex structural components.
Future work could focus on exploring more advanced lightweight detection structures, developing feature enhancement modules for small targets and low-contrast targets to further improve detection accuracy in complex environments. In addition, advanced generative data augmentation technologies, such as semantics-guided synthesis based on stable diffusion, could be adopted to solve the problem of insufficient training samples in industrial scenarios. Moreover, targeted hard sample mining strategies could be developed to enhance the robustness of the proposed system under extreme working conditions. Finally, multirobot collaborative cleaning mechanisms could be further explored to improve the efficiency of large-scale cleaning operations through task assignment and path coordination.
Through technological breakthroughs, future work could continue to promote the development of industrial cleaning toward intelligence, digitalization, and greenization, providing more comprehensive solutions for industrial intelligent manufacturing.
Footnotes
Acknowledgements
The authors acknowledge the support from the China Railway Eryuan Engineering Group Co., Ltd Science and Technology Development Program Project (KSWQ247012).
Author contributions
Conceptualization: Lifeng Wang and Wenming Cheng; methodology: Chaoze Wang; software: Chaoze Wang; validation: Zhiqiang Jin, Lifeng Wang, and Wenming Cheng; formal analysis: Lifeng Wang; investigation: Lifeng Wang and Wenming Cheng; writing—original draft preparation: Gang Peng; writing—review and editing: Gang Peng; supervision: Xinbin Xiong; funding acquisition: Xinbin Xiong and Lifeng Wang.
Funding
The authors disclosed receipt of the following financial support for the research, authorship, and/or publication of this article: This work was supported by the China Railway Eryuan Engineering Group Co., Ltd Science and Technology Development Program Project (KSWQ247012).
Declaration of conflicting interests
The authors declared no potential conflicts of interest with respect to the research, authorship, and/or publication of this article.
Data availability
The datasets used and/or analyzed during the current study available from the corresponding author on reasonable request.