
Abstract
Obstacle distance measurement is one of the key technologies for cable inspection robots on high-voltage transmission lines. This article develops a novel method based on binocular vision for extracting the feature points of images and reconstructing 3D scenes. The proposed method seamlessly incorporates camera calibration, dense stereo matching, and 3D reconstruction. We apply a novel calibration method to acquire intrinsic and extrinsic parameters and use an improved Semi-Global Matching (SGM) algorithm based on the least squares fitting interpolation to refine the basic disparity map. Based on the depth information of the optimized disparity map and the principle of binocular vision measurement, a model is established to estimate the distance of an obstacle from the cable inspection robot. Extensive experiments show that the proposed method achieves an estimation accuracy of less than 5% from 0.5 m to 5.0 m, offering extremely high distance estimation accuracy and robustness. The study improves the autonomy and intelligence of inspection robots used in the power industry.
Keywords
Introduction
The power grid is the infrastructure of a country. The safe and stable operation of the power grid guarantees industrial development and people’s livelihood. In a power transmission network, transmission lines play an important role in transmitting electric energy. 1 High-voltage overhead lines often cross complex terrain, such as mountains, rivers, and forests.2–6 High-voltage transmission lines are also often subjected to bad weather, which causes great damage to power facilities and disables large areas of the power grid. 7 Because these adverse effects threaten the safe operation of the power system, methods for maintaining the security and reliability of power systems and for protecting the lives of power inspectors are urgently needed. Currently, inspection methods are divided mainly into three categories: manual inspection, 8 unmanned aerial vehicle (UAV) inspection, 9 and robot inspection. 10 In manual inspection, the naked eye and a telescope are used to carry out inspection tasks. This method is time consuming and inaccurate. UAV inspection is highly influenced by adverse environmental conditions. Robot inspection has a strong load capacity, which is suitable for an intelligent power grid.
During the inspection of high-voltage transmission lines, inspection robots encounter various metal obstacles (such as counterweights, suspension clamps, and insulator strings) running along the transmission line; these obstacles prevent robots from operating on transmission lines quickly and for prolonged periods and greatly reduce the inspection efficiency of cable inspection robots (CIRs).11–13 Obstacle detection is one of the most active and promising technologies in robot vision research. To achieve navigation, the relative distance between obstacles and CIRs must be detected before crossing an obstacle. At present, common methods include ultrasonic ranging, 14 lidar ranging,15,16 infrared ranging, and optical ranging.17,18 Although the principles of the ultrasonic, lidar, and infrared ranging methods are simple and the amount of computation required is small, the equipment is expensive, the image contrast is low, and the ability to distinguish details is poor. Optical detection, which comprises monocular ranging and binocular ranging, plays an increasingly important role in achieving obstacle detection because of the rich information and high resolution. Monocular ranging requires the use of artificial markers or the geometric characteristics of a target to conduct distance measurements; in addition, the corresponding measurement accuracy is low. Binocular ranging technology can measure the distance of a front target without the need for establishing large-scale data in advance for many targets. In addition, because of its simple structure, low cost, and high reliability in outdoor environments, 19 binocular vision is a suitable method for recovering the 3D information of transmission line corridors using the image information provided by the left and right cameras.
With respect to stereoscopic systems, camera calibration and stereo matching algorithms have consistently been popular topics in binocular vision research. Camera calibration is the process of calculating intrinsic and extrinsic parameters. Camera calibration methods can generally be categorized into traditional calibration methods and self-calibration methods. Traditional methods include the direct linear transformation (DLT) method 20 and the two-step method. 21 Abdel-Aziz and Karara first described the DLT method. This camera calibration method does not consider nonlinear lens distortion; therefore, the calibration accuracy of this method is not high. Tsai proposed the two-step method, which takes into account distortion factors and improves the calibration accuracy of a camera by using an optimization algorithm. Zhang 22 presented a method that efficiently calculates the intrinsic and extrinsic parameters of a camera by collecting several groups of chessboard images with different angles and distances; however, the distortion model features only radial distortion, which may lead to a large error. With respect to self-calibration methods, Faugeras and colleagues23,24 and Hartley 25 proposed a camera self-calibration method; however, the technique requires extremely accurate calculation and does not appear to be suitable for routine applications. To achieve more robust calibration results, Guan et al. 26 focused on stereo calibration using a planar scene, but one limitation of the method is that the calibration accuracy is influenced by outdoor environments. After studying these calibration methods, we determined that the calibration accuracy of traditional methods was superior to that of self-calibration methods. In this article, a novel calibration method based on the error of the reconstruction results is applied; this method offers simple operation, excellent practicality, and high calibration accuracy.
The results of stereo matching greatly affect the accuracy of binocular stereo vision; that is, the results of three-dimensional reconstruction depend directly on the results of stereo matching. Therefore, stereo matching is not only a crucial research topic but also a difficult issue in stereo vision. Stereo matching methods include global, local, and semi-global approaches. Although global approaches such as graph cut and belief propagation yield satisfactory stereo matching results, both are computationally expensive, making it difficult to achieve high real-time performance.27,28 A real-time global optimization stereo matching algorithm can produce very high quality, but there is still room for improvement in addressing discontinuous regions in images. 29 The computational complexity of local algorithm is lower than that of global algorithm because they only estimate the corresponding relationship of pixels within a small window. The local stereo methods roughly concentrate on either selecting an optimal support window among multiple predefined windows, 30 or finding the best window size and shape point by point adaptively. 31 This local algorithm can improve the disparity accuracy in difficult matching regions, but because the window shape is fixed and not flexible enough, and matching error rate is still high. Semi-global matching (SGM) algorithm as proposed by Hirschmuller32,33 combines the advantages of high accuracy depth estimation of the global matching algorithm and lower computational complexity of the local matching algorithm. In this article, to reduce mismatch of the SGM algorithm, an improved SGM algorithm is proposed in order to achieve higher accuracy disparity map while maintaining real-time performance.
In summary, by analyzing inspection methods and the real-time requirements of CIR inspections, we propose a self-localization and fault detection method for transmission line corridors based on binocular vision. The main innovations are as follows:
The greatest contribution and innovation of this article is adopting a new calibration method and an improved SGM algorithm. A new calibration method based on reconstruction result error was proposed to remove the strong coupling between parameters. The improved SGM algorithm used the least square fitting interpolation to remove mismatched points, which improves the matching accuracy.
Binocular vision system can not only measure the distance between the robot and obstacles but also identify faults on multi-split wires (such as broken strands, scattered strands, or damage on line fittings).
The remainder of this article is organized as follows. In section “CIR inspection environment and structure,” we describe the transmission line environment and mechanical structure of the proposed CIR. In section “Method,” calibration, matching, refinement, and 3D reconstruction methods are proposed in detail. Section “Experiments” describes several experiments conducted to verify the performance of the proposed method. Section “Conclusions” concludes this article.
CIR inspection environment and structure
Transmission line environment
High-voltage overhead transmission lines are composed of routing wires, line fittings, towers, and foundation installations. Figure 1 is a schematic diagram of a transmission line structure. The tower and the transmission line are connected by insulator strings and suspension clamps, and one or more counterweights on the wires between the two towers restrain the vibration of the transmission line. Common line fittings include counterweights, suspension clamps, and insulator strings.

Schematic diagram of high-voltage transmission lines.
Power lines cut through a wide coverage area, complex terrain, and adverse environmental conditions. Power lines and pole towers are exposed to variable natural conditions for a long duration. Under the combined effects of the natural environment, machinery, and electricity, power transmission networks are easily damaged, for example, by strand breakage, slipping and even dropping of counterweights, breakage of insulator strings, loss of opening pins, loosening of bolts or nut shedding, material corrosion, foundation damage, tilting of towers, and changes in the safe distance. To ensure the safe and stable operation of the power system, the abovementioned problems must be solved in time by inspection and maintenance.
CIR structure
The complex environment surrounding transmission lines includes various line fittings, such as counterweights, suspension clamps, and insulator strings. Therefore, the body structure of the CIR must be highly reliable and flexible to carry out the following functions: walking along a line, multi-joint collaboration and obstacle crossing, autonomous control and navigation, wireless communication and remote monitoring, climbing, incorporation of downhill movement and braking capabilities, incorporation of a security mechanism for fault self-diagnosis, weathering of harsh natural conditions (rainproof, dustproof), manual/auto switching, and ease of operation.
The structure of the CIR includes mainly a walking wheel mechanism (a), a telescoping mechanism (b), a pressing mechanism (c), clamping jaws (d), a pitching mechanism (e), a rotary mechanism (f), a staggered arms mechanism (g), two hand-eye micro cameras (h), two robot arms (I and II), a moving rail (III), a control box (IV), two network PTZ cameras (V), voltage equalizing rings (VI), and a binocular camera (VII), which can be quickly installed and disassembled to facilitate the maintenance of the CIR. 34 Figure 2 shows the CIR.

CIR.
Binocular vision system
As shown in Figure 3, the binocular vision system consists of a binocular camera, a ground base station, and a software system. A binocular camera (MYNT S1030-IR) is mounted on upper side of the voltage equalizing rings. A binocular camera and a ground base station communicate wirelessly. The ground base station provides an intuitive, simple data display and obstacle distance measurement interface for robot navigation. The software system is programmed by C++ and OpenCV3.1, which run in the ground base station.
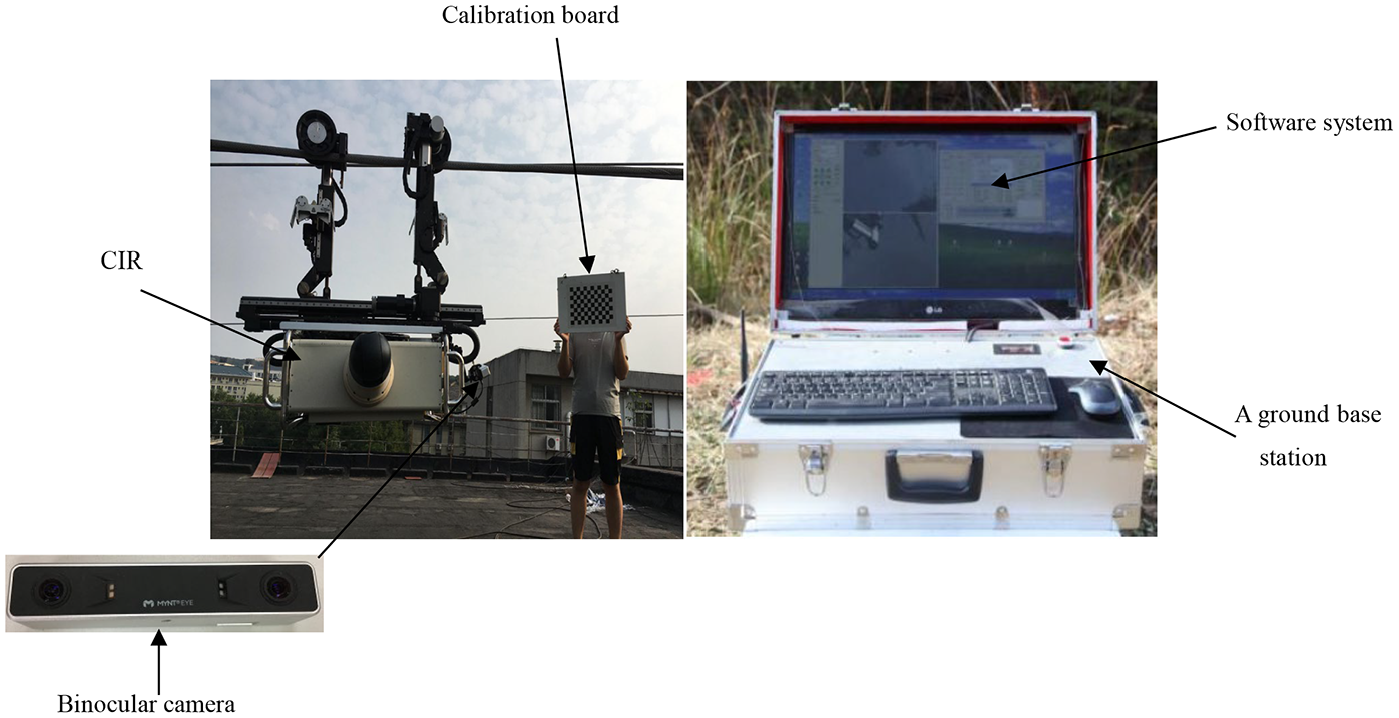
The binocular vision system.
Method
System framework
The designed binocular vision system consists of five modules dedicated to different tasks: image acquisition, camera calibration, image rectification, stereo matching, and depth calculation. This system can be described by the flow diagram shown in Figure 4.

System flowchart.
Camera calibration
Classic calibration method
The process of calibration is actually the process of solving the internal and external parameters of the camera. The basic task of computer vision is to get the image information from the camera and calculate the three-dimensional geometry of the object in space. 35 Abdel-Aziz et al. 20 introduced a classical DLT method to realize calibration of camera parameters; however, DLT method relies on accurate 3-D measurement based on external 3D calibration object. Zhang’s 22 camera calibration method is the most popular camera calibration method that is intermediate between traditional calibration and self-calibration, which not only helps avoid the high demand for traditional equipment but also eliminates the requirement for an expensive calibration board. The method requires only the camera to shoot the same calibration board from different angles. The intrinsic and extrinsic parameters of the camera are obtained by the correspondence between the points on the calibration board and the points on the image plane. Assuming that the point on the calibration board is M = [X, Y, Z, 1]T, the corresponding pixel coordinates are m = (u, v, 1)T. That is, the homography relationship between the corner point of the chess grid on the calibration board and the image plane is

In equation (1), the plane of the calibration board is assumed to be in the plane of the world coordinate Z = 0, where

Equation (2) indicates that each homography matrix can provide two equations. The camera-intrinsic parameter matrix K contains five parameters. For example, three homography matrices are needed to solve the problem; that is, at least three checkerboard images must be calibrated. At the same time, the extrinsic parameters of the camera can be obtained as follows

Zhang’s calibration method considers only radial distortion. Suppose that we select n checkerboard images (i = 1,2,…, w). There are m calibration points on the checkerboard (j = 1,2,…, m). The optimization function is given as follows

where (Ri, Ti) are the rotation matrix and translation vector of the ith checkerboard image.
A novel calibration method
Zhang’s calibration method uses the evaluation value of 2D pixel coordinates to assess the calibration quality.
36
However, these errors are obtained by a single camera and image points, rather than the reconstruction results of 3D points. The proposed calibration method is based on the error of reconstruction results and eliminates the strong coupling between parameters. For any point P in a 3D world coordinate system, there will be one coordinate

In equation (5),

where the rotation matrix

Relationship of the coordinate systems.
When the calibration board is placed in different positions, we take w pairs of images (i = 1,2,…, w). Assuming that there are m calibration points in the calibration board (j = 1,2,…, m),

The centroids of point sets
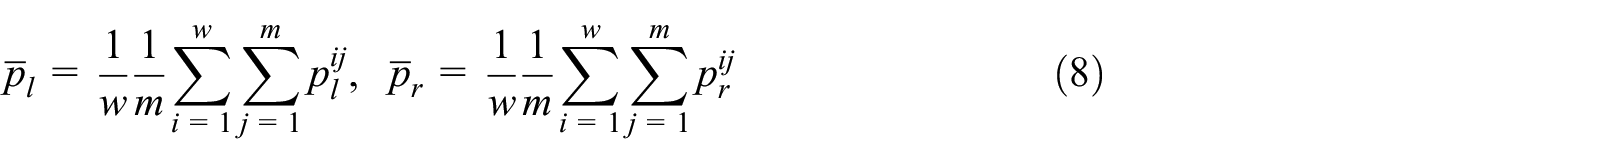
where

Based on equations (5) and (8), we have

The function valuing the minimum re-projection error is expressed as follows

In equation (11), we can obtain the rotation matrix R. The translation matrix T can be calculated by the following equation

After the rotation matrix R and the translation matrix T are obtained, the relationship between a 3D point M and the corresponding image projection point can be established according to the linear model of the camera. Taking the left camera coordinate system as an example, the pixel coordinate of the theoretical image point of a 3D point M can be obtained from equation (13)
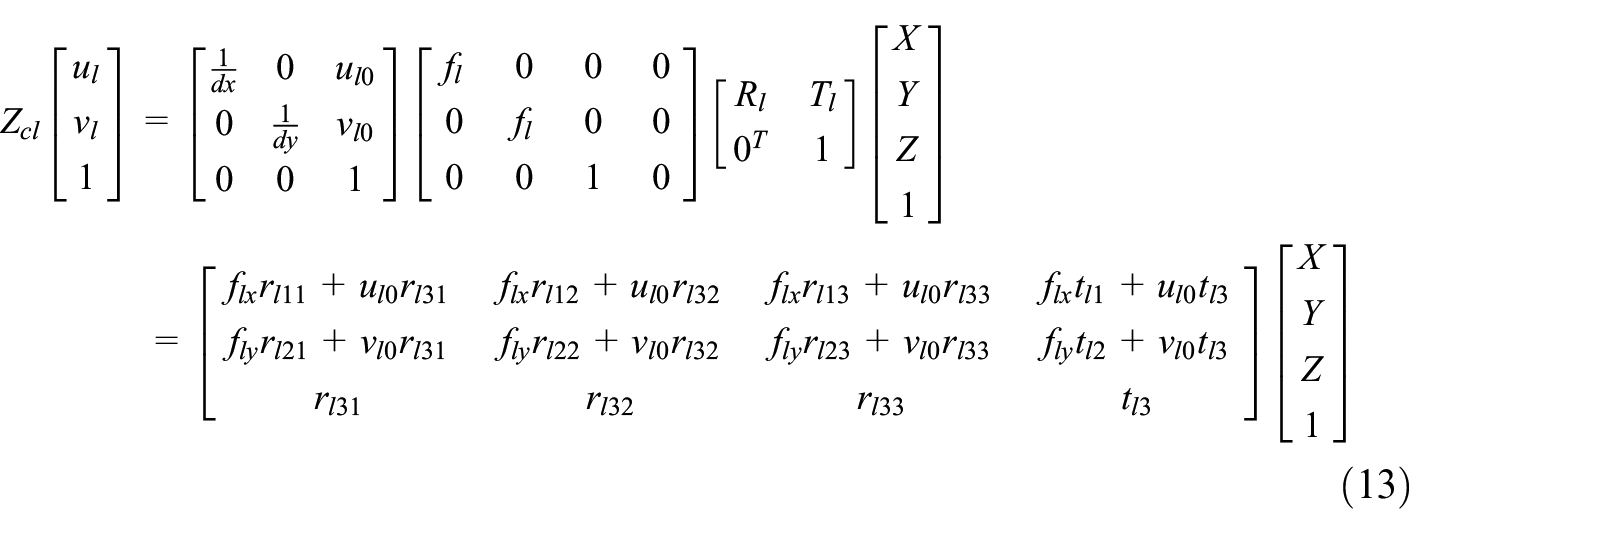
where

There are some distortion errors between the actual image and the ideal image of the object point on the camera imaging surface. The main distortion errors are divided into radial distortion and tangential distortion. Assuming that the ideal pixel coordinate of a 3D point M in the left camera coordinate system in a linear model is

where

where

where

Flowchart of the novel calibration method.
Image rectification
The purposes of image rectification are as follows: the distortions of images are removed by the internal parameters in the calibration results, and the two images aligned in non-coplanar lines are rectified to coplanar line alignment such that the polar lines of the two images lie exactly on the same horizontal line. Any point on such an image must have the same line number as its corresponding point on another image. To match the corresponding point, only performing a 1D search on the line is necessary. The rectified images are shown in Figure 7.

Stereo rectification: (a) Distorted. (b) Rectified. (c) Aligned.
Previous work
When the robot detects the outdoor transmission line, the changing backgrounds, light intensities, and so on will have a great impact on the images acquired by the binocular camera, which results in a serious decline in the ranging accuracy of the feature-based image processing methods. Because of the space constraint, the process of image preprocessing is not discussed in this article. In the previous work (the research results of Huang et al. 38 and Ye et al., 39 and so on), our research group preprocessed the image, and many years of long-term research and field experiments was applied to remove the changes of background, illumination intensity, and weather conditions in the image, which provided an effective guarantee for the robot feature-based image processing method. Under extremely severe weather (e.g. Hail, strong winds, and heavy rain), the robot will stop the patrol operation. After determining the obstacles in the image, stereo matching is performed on the image.
Improved SGM algorithm
SGM algorithm, first proposed by Hirschmüller,32,33 in 2005, is an algorithm that takes into account both matching accuracy and real-time performance. When calculating parallax, the local algorithm usually aggregates the cost based on the local window around the target pixel; the global algorithm considers all the pixels in the image; SGM is called semi-global because it considers all the non-occluded pixels in the image and solves the energy function based on dynamic programming. The SGM algorithm is divided into image preprocessing, matching cost calculation, cost aggregation, and post-processing. In this article, we aim at further improvement of SGM accuracy while maintaining matching efficiency and an improved SGM algorithm based on the least squares fitting interpolation method is proposed.
Disparity refinement
In practical processing, ambiguity occurs due to reflection and weak texture regions. There are still some errors and invalid values in the basic disparity map after computing the matching cost cube. In order to further improve the accuracy of matching results, the least squares fitting interpolation method is used to optimize the basic disparity map in each super-pixel region to improve the continuity and accuracy of three-dimensional reconstruction.40,41 The formula for optimizing the basic disparity map is as follows:

where (a, b, c) denotes disparity plane parameters; if the parameters (a, b, c) are determined, each coordinate point in the image plane can correspond to a disparity value. The formula of least square method is as follows

with


From equations (20) and (21), we can obtain

3D reconstruction
A 3D reconstruction model is usually applied in a binocular vision measurement in which a triangulation principle is adopted to calculate the 3D world coordinates of a point viewed by two cameras.42–45
As shown in Figure 8,


3D reconstruction model of binocular vision.
The vertical coordinate values of point P are equal in the left and right image planes

Disparity d is defined as follows

If the coordinates of the space point P in the imaging plane of the left and right cameras are

In summary, based on the principles of binocular vision, if it is possible to determine the corresponding point on the image planes of the left and right cameras, the depth information of the target point can be determined.
Experiments
Calibration process
To highlight the superiority of the proposed method, we compare the calibration results of the proposed method with Zhang’s calibration results. Either the cameras or the calibration board can be moved freely in Zhang’s calibration, and the calibration procedure is easy to execute. However, the corresponding experimental data indicate that when the flatness of the calibration board has a 1% error, which leads to a calibration error of 10 pixels, it is difficult and costly to produce high-precision plane calibration boards. Generally, a piece of printed checkerboard paper pasted onto a plane object is used as the calibration board, and flatness is not considered. Based on experience, the planarity error of the checkerboard can exceed 0.1 mm. To remove such defaults, we use a liquid crystal display (LCD) panel as the calibration plane instead. The planarity of the LCD panel is of industrial grade, and the flatness deviation of the panel is less than 0.05 µm. Hence, we use the calibration template displayed by the LCD screen as the calibration plane.
In this experiment, Zhang’s calibration method and the proposed calibration method use the same cameras and calibration boards. Hence Zhang’s calibration method and the proposed calibration method are calibrated from an LCD screen. Twenty pictures are obtained (in different positions and orientations) for camera calibration. Some of the calibration images are displayed in Figure 9.

Some of the calibration images.
To verify the effectiveness of the proposed calibration algorithm, the re-projection error is used to indicate the calibration quality. The re-projection error distributions of Zhang’s calibration method and the proposed calibration method are shown in Figure 10.

Distributions of the re-projection errors. (a) Zhang’s calibration method. (b) Proposed calibration method.
The calibration results (the intrinsic and extrinsic parameters) after calibrating the binocular camera parameters are shown in Table 1.
The intrinsic and extrinsic parameters of binocular cameras.

As shown in Table 1, compared with Zhang’s calibration method, the proposed calibration method can yield not only the radial distortion coefficient but also the tangential distortion coefficient. The results show that when an LCD screen is used as the calibration panel, the pixel error of the proposed calibration method can be reduced by approximately two times; the errors in focal length and the principal point are reduced by a factor of four to five; and the errors in the distortion and extrinsic parameters are all reduced. Compared to Zhang’s method, the calibration accuracy of the proposed calibration method using the LCD panel as the calibration plane is obviously improved.
The simulated camera has the following property: The image resolution of the left and right simulated cameras are 800 × 600 pixels with the principal point at (u0, v0) = (400 300) pixel. The skew factor is set to zero. The focal length is 2.1 mm. We conducted simulations to verify the superiority of the proposed method under Gaussian noise and image number.
1. Impact of image Gaussian noise on calibration accuracy
In this simulation, Gaussian noise with 0 mean and the standard deviation σ is added to the image points. The Gaussian noise is varied from 0 to 1 pixel in intervals of 0.2 pixels. For each noise level, 20 independent experiments are performed and the camera calibration results are obtained. The proposed method, Liu et al., 46 Yang et al., 47 Zhang’s method, Cui et al., 48 and Jie et al. 49 are applied to estimate intrinsic parameters and extrinsic parameters errors. Figure 11 shows the comparison results of those methods. The proposed method, methods used by Liu et al. 46 and Yang et al., 47 Zhang’s method, and methods used by Cui et al. 48 and Jie et al. 49 are denoted by methods 1, 2, 3, 4, 5, and 6, respectively.

Relationship between calibration error and Gaussian noise. (a) Comparison of u0. (b) Comparison of v0. (c) Comparison of fx. (d) Comparison of fy. (e) Comparison ofre-projection. (f) Comparison of tx. (g) Comparison of ty. (h) Comparison of tz.
As shown in Figure 11, with a continued increase in the noise level, intrinsic parameters and extrinsic parameter errors of these methods also increase. However, method 1 has better robustness in anti-noise.
2. Impact of number of images on calibration accuracy
In this simulation, Gaussian noise with 0 mean and the standard deviation 0.5 pixels is added to the image points. The number of images is varied from 6 to 20 in intervals of 2 pixels. For each number, 20 independent experiments are performed and the camera calibration results are obtained. The proposed method and Liu et al. 46 and Zhang’s method are applied to estimate intrinsic parameters errors. Figure 12 shows the comparison results of those methods.

Relationship between calibration error and number of images. (a) Comparison of u0. (b) Comparison of v0. (c) Comparison of fx. (d) Comparison of fy. (e) Comparison ofre-projection.
As shown in Figure 12, with a continued increase in the images number, intrinsic parameters and re-projection errors of these methods also decrease. When more images are used, the errors of these three calibration methods will be reduced. With the same number of images, our method is superior to the other two methods.
Measurement evaluation results
To evaluate the performance of the proposed method and test the binocular vision system, we selected an experimental scene consisting of lines, a tower, and obstacles located on the roof of our school building. During the inspection of the high-voltage transmission line, the CIR hanging on transmission line 1 will encounter various types of obstacles. It is necessary to predict the distance of obstacles from the CIR in advance to make mission decisions. Figure 13 is a test scene image.

Test scene image.
Among the parameters of SGBM algorithm, there are three key parameters that have a great influence on the parallax generation effect, namely, SADWindowSize, NumDisparities, and UniquenessRatio.
SADWindowSize (SWS): Size of SAD window in calculation cost step. SADWindowSize should be odd, which is in range (3, 11).
NumDisparities (NDis):The parallax window, that is, the difference between the maximum and minimum parallax values, must be an integral multiple of 16.
UniquenessRatio (UniR): Mainly to prevent mismatch, this parameter has a great impact on the final match result. In stereo matching, if there is a mismatch, it will be very troublesome to encounter an obstacle detection application. This parameter cannot be negative, which can be obtained in range (5, 10).
Therefore, we will focus on the analysis of the parameters of SWS, NDis, and UniR to select the optimal algorithm parameters. In order to verify the validity of the algorithm parameters, we evaluate the disparity map from subjective and objective aspects. The parallax map is based on the images of obstacles, such as counterweights, suspension clamps, and insulator strings. The running environment of the algorithm is 2.5-GHz inter core i5 CPU with 4GB RAM memory, and the system is Windows 8. The algorithm is written in C++ language. First, in the program, we set the initial value of the parameter, then adjust one of the parameters (keep other parameters unchanged) to make the value change the best. In the same way, we adjust the other parameter to make it optimal, and finally select all the best parameters. Setting the initial values of parameters: SWS = 7, NDis = 64, and UniR = 10. Because of the length of the article, we just take the disparity map of the counterweight as an example. From the subjective analysis, Figure 14 is the disparity map when the counterweight parameters SWS = 7 and UniR = 10. Changing the value of NDis, the value range of NDis is (16, 112).

Obstacles variation with respect to Ndis (SWS = 7 and UniR = 10).(a) Counterweight.
It can be seen from Figure 14 that when Ndis = 16, 32, and 48, the target images of the counterweights show the characteristics of high noise and fuzzy matching. When Ndis = 64, 80, and 96, the image matching effect of the counterweight is very good, and the change is not obvious. When Ndis = 112, there are many mismatches in the counterweight.
It can be seen from Figure 15 that when SWS = 11, the matching effect of the counterweight images is poor and the matching is incomplete. When SWS = 9, the disparity maps of counterweights are distorted. When NDIS = 3, 5, and 7, the image matching effect of the counterweight is good, and there is no significant difference in disparity maps.
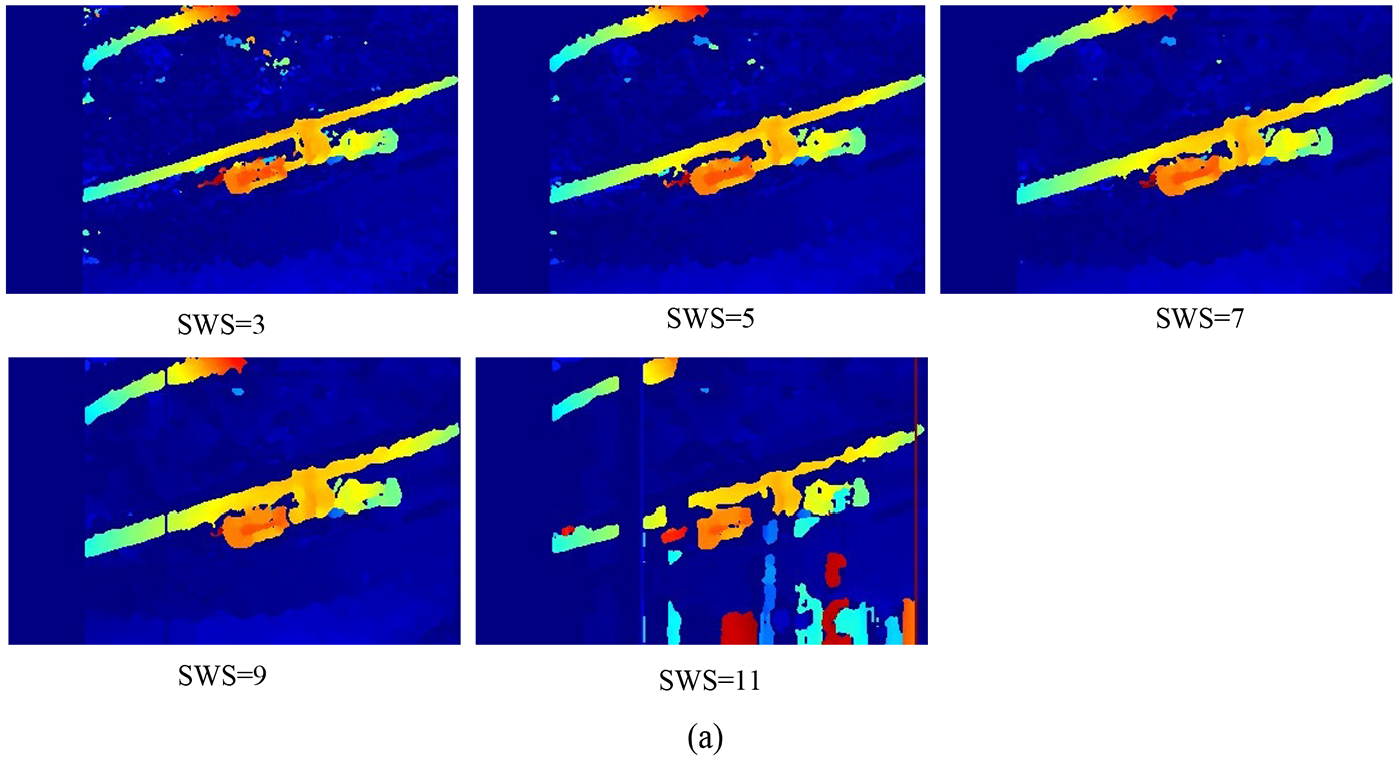
Obstacles variation with respect to SWS (Ndis = 64 and UniR = 10).(a) Counterweight.
From Figure 16, when the parameter UniR changes, there is no significant change in the image matching effect of the counterweight. In order to evaluate the global accuracy of the generated obstacle disparity images, the obstacle images were all compared with the corresponding standard images. By calculating the gray value difference of each pixel, the difference obtained in this way is compared with the similarity of the two images through the square sum of error, the mean square error, and the root mean square error analysis. Therefore, RMSE (root mean square error) can distinguish the best combination of SGBM parameters
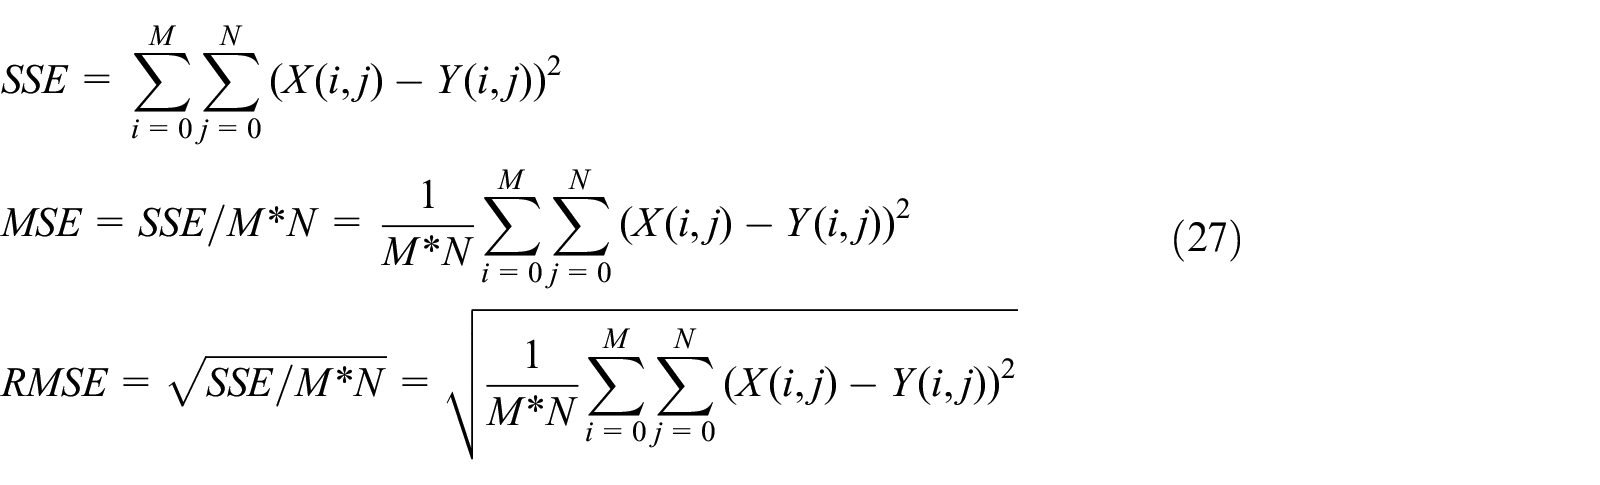
where M*N represents the size of the image, X (i, j) and Y (i, j) represent the gray value of the two images. For all disparity images, SGBM parameters combination is displayed with the corresponding RMSE values in Figure 17. It shows that combination (Ndis = 64, SWS = 7, UniR = 10) produces the most accurate results.
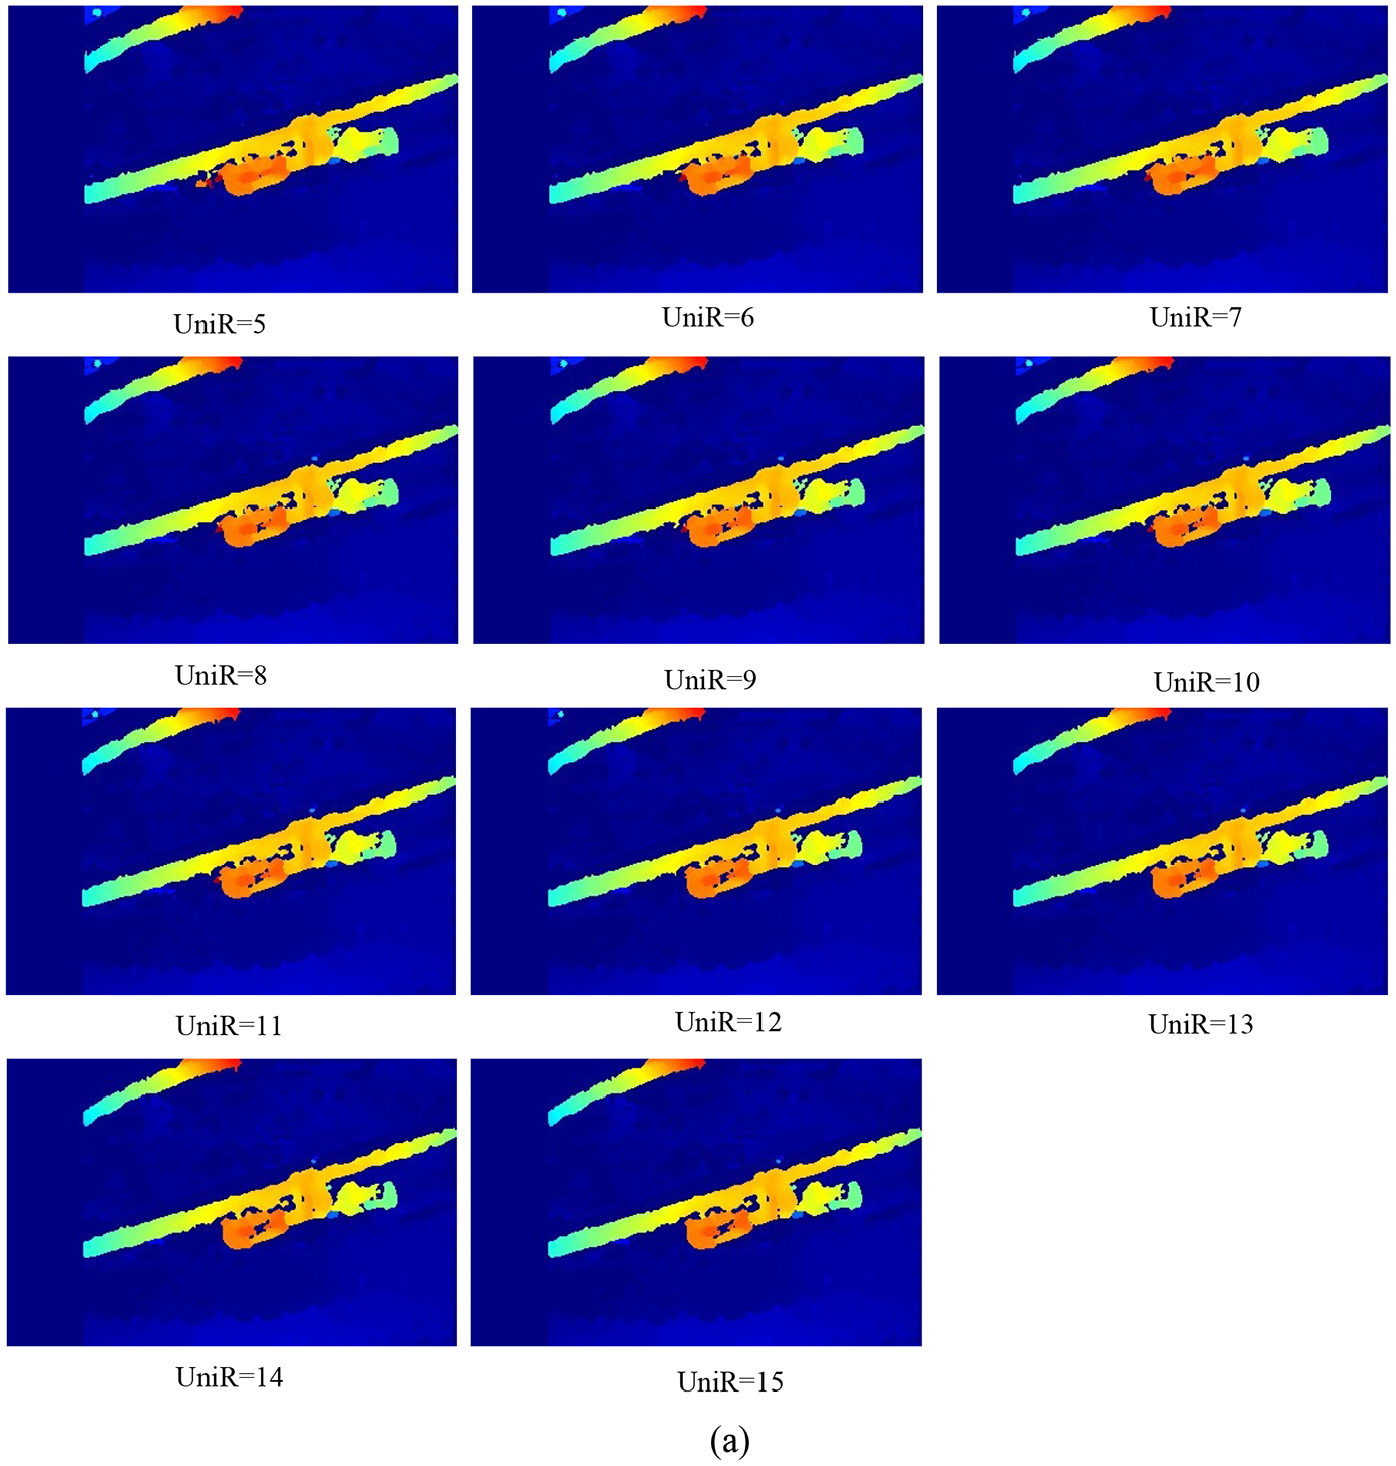
Obstacles variation with respect to UniR (Ndis = 64 and SWS = 7).(a) Counterweight.

SGBM parameters’ effect on obstacle disparity images accuracy. (a) RMSE variation with respect to NumDisparities (SWS =7; UniR = 10). (b) RMSE variation with respect to SADWindowSize (Ndis =64; UniR = 10). (c) RMSE variation with respect to Uniqueness(Ndis =64; SWS = 7).
To illustrate the superiority of the improved SGBM algorithm, the algorithm is compared with the BM algorithm, original SGBM (Ndis = 64, SWS = 7, UniR = 10), and GC. The experimental results are evaluated in two respects: total operation time and correct rate. Partial pictures are chosen to analyze the matching results, as shown in Figure 18.

Matching results. (a) Counterweight. (b) Suspension clamp. (c) Insulator string.
The matching experimental data are shown in Table 2. For convenience, the method of BM, SGBM, GC, and improved SGBM are represented by BM, SGBM, GC, and ISGBM, respectively. The parameters in four algorithms are those recommended by Lowe.
Performance comparison between the improved SGBM algorithm and the original algorithm.

The total operation time of the BM and SGBM algorithms are shorter than that of the improved SGBM algorithm. However, the improved SGBM meets the real-time requirement of the robot. The total operation time of GC algorithm is the highest, which does not meet the real-time requirements of robot. Table 2 shows that the BM algorithm is relatively ineffective and can only get a sparse disparity map. There are a large number of invalid matches and mismatches in the obstacle area in the disparity map. SGBM aggregates the matching cost in many directions, which can get dense disparity map, and the matching effect is better than BM algorithm. However, the disparity map is still incomplete and there are some holes in it. The ISGBM correct matching rate is still higher than those of the other two algorithms. With comprehensive consideration, the improved SGBM algorithm has better precision and robustness.
To evaluate matching performance, we conducted simulations and used two types of noise to test images: Gaussian and salt pepper. Gaussian noise with σ2 = 0.1 and σ2 = 0.2 and salt and pepper noise with densities of 15% and 35% were added to the image points. Figure 19 shows the comparison results of these four methods.

Four algorithms’ performance on noice images. (a) Counterweight. (b) Suspension clamp. (c) Insulator string.
As illustrated in Figure 19, under the influence of noise, BM algorithm is sensitive to noise and easy to cause mismatch. Compared with other algorithms, the improved SGBM algorithm has a better anti-noise interference effect and a higher accurate recognition rate.
After binocular image matching, the results of matching are displayed in the form of a disparity map, as shown in Figure 20. Based on equation (26), the disparity, focal length and baseline distance can be used to calculate the three-dimensional coordinates of the feature points.

Obstacle disparity map. (a) Counterweight. (b) Suspension clamp. (c) Insulator string.
A distance measurement experiment is carried out by selecting multiple targets with different distances. With a camera focal length of 2.1 mm and a baseline distance of 12 mm, we take the insulator string distance measurement as an example. Table 3 shows the experimental data. Fifty measurements were made, and then the measured values were averaged.
Insulator string range information table.

Table 3 shows that when the actual distance is 0.0 to 0.3 m, the test error is large. The reason is that the focal length of the camera used in this article is 2.1 mm; when the obstacles to be measured are close to the cameras, there will be blurred focusing, and the quality of the collected image will be reduced, resulting in low accuracy of stereo matching. When the actual distance is 5.5 to 6.0 m, the test error is also large. The farther the obstacles are from the cameras, the less clear the obstacles are in the picture, which will also lead to lower accuracy of stereo matching. When the actual distance is 0.5 to 5.0 m, the test error is small, and the relative error is between 0.39% and 4.77%, which meets the practical requirements of the CIR. According to the test data in Table 3, data analysis is carried out in the MATLAB environment; the results are shown in Figure 21.
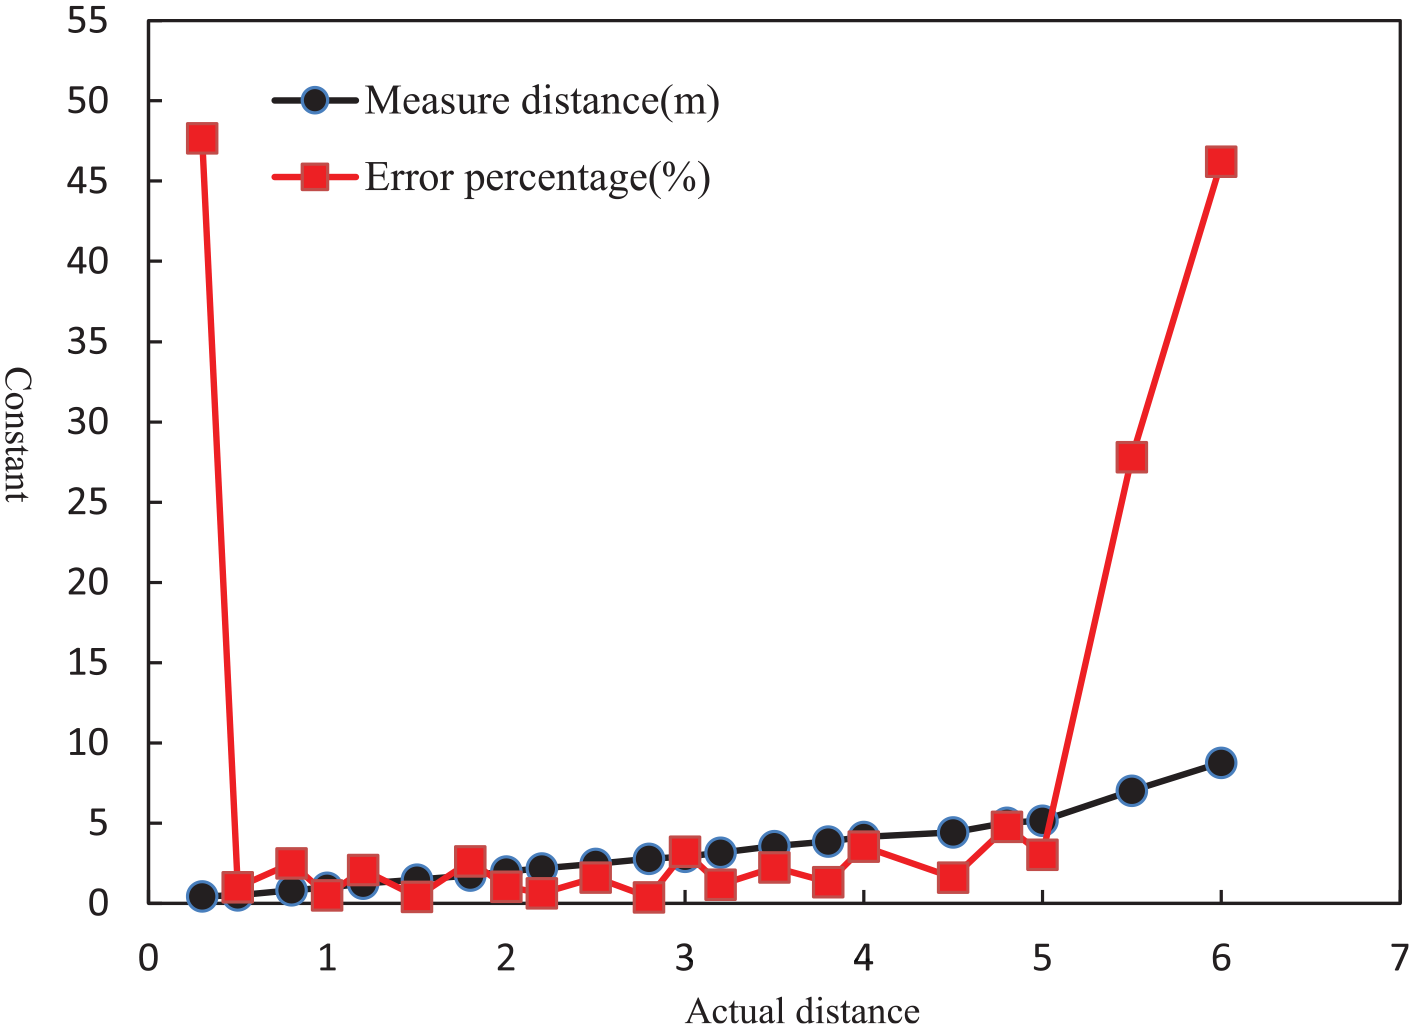
Ranging distribution.
The horizontal ordinate in Figure 21 indicates the actual distance from the cameras to the object being measured, and the y-axis represents the constant. The graph shows that the closer the line of the error percentage is to the horizontal ordinate, the smaller the error.
Generally, the proposed method has a large measurement error when the measurement range is 0.0 m to 0.3 m. The reason is that the focal length of the camera of the robot vision system is long (namely, 2.1 mm). When an obstacle is close to the camera, focus blur will occur. If the image is not clear, the accuracy of feature point matching will be reduced. Therefore, the measurement accuracy is low when the obstacle distance is small. When the measurement range is 0.5 m to 5.0 m, the image quality is high, and the range accuracy is high. The measurement errors are mainly caused by the interference of light, the jitter of the robot and the complexity of the target background. Based on the vision method, the detection accuracy required by the robot is within 5%. The measurement results in this article meet the positioning requirements of CIR.
Discussion
The most notable feature of the proposed CIR is the ability to inspect power transmission corridors along the ground. The CIR is different from a UAV, which must change its posture to perform an inspection. Compared with a lidar system, binocular vision acquisition of two-dimensional images can avoid missing target information. The CIR binocular vision system combines the features of a CIR and a high-definition camera, which is a highly distinctive combination. First, when the angle of the camera is fixed and the visual field is fully concentrated on a power line corridor, the visual system can detect damage to the transmission line and measure the distance from obstacles to the CIR. Second, the CIR can also detect the status of other transmission lines (such as the displacement of a counterweight and damage to the line gold tool). Because the camera uses high-definition optical lenses, the system offers high-definition color in the daytime; nevertheless, the picture remains very clear at night.
Another contribution of the proposed method is autonomous location detection. When the CIR detects obstacles on transmission lines, it provides target location information. This method improves the detection accuracy and efficiency in the range of 0.3~5.0 m. Supplementary testing using other CIR testing instruments is carried out within a close range.
The method could be further improved in two respects. First, a binocular camera can adjust the focal length according to the distance between the target and the CIR. The real-time auto zoom can be made more effective for three-dimensional recognition and measurement. Second, Sloshing caused by CIR on-line walking leads to the reduction of the accuracies of binocular camera calibration and stereo matching. As a next step, a software interface based on MFC can be designed to realize on-line calibration. Under outdoor conditions, the CIR vision system is greatly influenced by strong light, resulting in low precision in image target matching, and it is hoped that higher-quality anti-light cameras can be used.
Conclusion
In this research, we developed a calibration, matching, and 3D reconstruction method suitable for any binocular stereo vision system. In our experiments, the calibration system used an LCD panel as a calibration plane. The intrinsic parameters and the extrinsic parameter errors in the camera calibration were greatly reduced by using 20 images. After the camera calibration, the disparity was formed and refined through an improved SGBM algorithm. Compared with the BM, the classical SGBM (Ndis = 64, SWS = 7, UniR = 10), and GC, the improved SGBM algorithm reduces the mismatch and improves the accuracy and robustness of the matching algorithm while maintaining the real-time performance. A series of test distances ranging from 0.3 m to 6.0 m were also tested. The CIR visual system shows a high accuracy rate, with an error percentage no greater than 5% within a range of 0.5 m to 5.0 m. Hence, the experimental results verify the effectiveness of the proposed method, which can satisfy the intelligence and autonomy requirements for carrying out robot tasks.
Future research works will focus on the image de-jitter algorithm. When the CIR is running along the transmission line, the camera will vibrate slightly, resulting in low precision in binocular ranging, and it is hoped that a more robust de-jitter algorithm can be used.
Footnotes
Author contributions
Le Huang conceived, designed, and performed the experiments; conducted substantial simulations; and wrote the manuscript. Gongping Wu revised the manuscript.
Declaration of conflicting interests
The author(s) declared no potential conflicts of interest with respect to the research, authorship, and/or publication of this article.
Funding
The author(s) disclosed receipt of the following financial support for the research, authorship, and/or publication of this article: This research is financially supported by a State Grid Jilin Electric Power Co., Ltd. Project, China (SGJLBS00YJJS1800155) and a State Grid Jilin Electric Power Co., Ltd. Project, China (SGJLBS00YJYJ1900250).