
Abstract
Objective
With increasing global aging, the relationship between gait and cognitive function has become a research priority. Although spatiotemporal differences in dual-task (DT) gait are well-documented, studies on kinetics remain limited. This study aimed to explore age-related changes in kinetics under cognitive load.
Methods
This study is a prospective cross-sectional study. Thirty-six participants were categorized into 3 groups: young (YG, 18-37 years), middle-aged (MG, 38-57 years), and elderly (OG, ≥ 58 years), with 12 in each group. Gait tests were conducted under single-task (ST) and DT conditions. The DT involved counting down by 1 from a random number of 100 while walking. Kinetics includes forces, moments, power, and center of mass (CoM). Repeated measures general linear model was used to assess effects of tasks on age groups. Group differences in DT gait cost (DTGC) were examined by MANOVA with Bonferroni corrections.
Results
OG showed increased ankle medial-lateral force, decreased knee external rotation moment (p = 0.049), and reduced hip anterior force and power (p < 0.01). MG exhibited reduced hip power (15.4%) and force in multiple directions (p < 0.05), while YG had decreased hip abduction–adduction moment (p = 0.004). In the medial-lateral of CoM, OG had significantly lower motion of range in ST than in DT (p = 0.028). DTGC comparisons showed that OG had the biggest kinetic changes under DT, MG followed, and YG had the least impact.
Conclusions
This study showed that the impact of cognitive load on kinetics differs across age groups. The OG relied on ankle joint compensation but with lower efficiency, leading to decreased gait stability. The MG adjusted gait using both the ankle and hip joints, while the YG showed minimal changes and stable gait. DT gait assessment shows that older adults use different strategies in their lower limbs. This highlights its potential to detect mobility decline early.
Introduction
Gait is not only a simple mechanical process, but also involves complex cognitive regulation, and this includes the combined effects of planning, attention allocation, visuospatial perception, and motor coordination.1,2 According to the Limited Attentional Resource Theory, an individual's attentional resources are finite, and concurrent execution of two or more tasks necessitates competition for these limited resources.3–6 Recently, more studies have used dual-task (DT) methods. These combine cognitive or verbal tasks with motor performance. This approach helps us understand how cognitive load affects gait. 7 In DT conditions, individuals need to perform both motor tasks (e.g. walking) and cognitive tasks (e.g. counting down or memorizing), which can lead to a reallocation of limited cognitive resources between the two. 8 When the total cognitive demand of these tasks exceeds an individual's available resources, DT interference may occur, resulting in performance deterioration in one or both tasks .9,10 In gait research, this interference effect is often quantified using the DT cost (DTC).11,12 It has been shown that changes in spatiotemporal parameters of gait, such as reduced gait speed, slower cadence, shorter step lengths, and increased step widths, may signal a decline in cognitive functioning.7,8,13,14 Cognitive performance and gait stability often decline as people age. This decline is a major risk factor for falls and dementia in older adults.15,16
In DT condition, different age groups may employ different gait adaptation strategies. Compared to younger adults, older adults are significantly less stable in standing and walking during high cognitive load tasks. 17 In addition, many falls do not occur during normal walking, but rather during walking with concurrent performance of secondary tasks, for example, conversation.18,19 This study focuses on gait kinetics, center of mass (CoM), joint forces, moments, and power, which provide direct insight into the mechanical demands and neuromuscular control during walking. Compared to traditional spatiotemporal or kinematic parameters, kinetic analysis reveals how different age groups adjust motor output to maintain stability, especially under cognitive load.
Therefore, this study aimed to examine how gait kinetics varies across three age groups, young, middle-aged, and older adults, under single-task (ST) and DT walking conditions. This study hypothesizes that: (1) older adults would exhibit more pronounced compensatory strategies under DT, such as increased reliance on distal joints (e.g. ankle) and altered CoM trajectories to preserve stability; (2) middle-aged adults would demonstrate intermediate adaptations, reflecting transitional changes in cognitive-motor control; and (3) younger adults would maintain relatively stable gait patterns with minimal kinetic alterations. This research seeks to uncover age-related differences in kinetic responses to DT demands, with implications for early detection of fall risk and development of targeted intervention strategies.
Materials and methods
This prospective cross-sectional study involved three groups of 36 participants. The ethical approval for healthy subjects was obtained from the Dundee University School of Medicine and Life Sciences Research Ethics Committee (SMED REC number 22/118). This study was conducted in accordance with the Declaration of Helsinki of 1975, as revised in 2024. All patient details were de-identified to protect personal privacy and ensure that no individual can be identified in any way. The reporting of this study conforms to STROBE guidelines. 20
Subject data
Thirty-six healthy subjects were recruited into this study and were categorized according to their age into young group (YG, 18–37 years), middle-aged group (MG, 38–57 years), and old-aged group (OG, ≥ 58 years). Each group had 12 participants. The participants were recruited through posted poster in University of Dundee and Ninewells Hospital. Those who met the predefined eligibility criteria and voluntarily agreed to participate were included in the study. The sample size has been determined based on previous studies employing similar DT paradigms. Due to the complexity of data collection in the field of biological psychology, these studies typically utilize smaller sample sizes.21,22 The mean age was 24.42 (±2.71) years for YG, 43.50 (±4.70) years for MG, and 65.67 (±5.50) years for OG. All participants were fluent in either Chinese or English, and able to walk independently. And participants had regular exercise habits, engaging in moderate-intensity physical activity at least two to three times per week. Exclusion criteria were: a history of dementia, severe language impairment, inability to give informed consent, abnormal psychomotor function, major lower limb musculoskeletal problems, or pregnancy. All participants signed a written informed consent form before the experiment.
Laboratory equipment
This study was conducted in the Movement Biomechanics Laboratory at the Institute of Motion Analysis and Research (IMAR), located at Ninewells Hospital and Tayside Orthopaedics and Rehabilitation Technology (TORT) Centre, University of Dundee. The laboratory, measuring 18 m × 9 m, was equipped with the Vicon® Nexus motion capture system (Vicon Motion System Ltd, Oxford, UK), consisting of 15 infrared digital cameras. In addition, the lab was equipped with four force platforms (Advanced Mechanical Technology, Inc., Watertown, MA, USA, AMTI, BP 600 mm × 400 mm) arranged in a hybrid configuration, capable of capturing the ground reaction forces at a sampling frequency of 1000 Hz.
Data collection
During the data collection of this study, the basic anthropometric data and personal information were recorded for each subject. Participants wore tight-fitting shirts and shorts and walked barefoot during all trials to ensure consistency and minimize footwear effects. In accordance with the Vicon Clinical Marker System, reflective markers 14 mm in diameter were attached to specific bony landmarks in the subjects including the head, trunk, pelvis, upper limbs, and lower limbs (marker placement according to Vicon® Plug-in-Gait Model (
During data collection, participants need to complete two separate test conditions. In each condition, participants walked along a 7m walkway at a self-selected comfortable speed. In ST condition, participants focused on looking straight ahead and were unaware of the locations of the force plates. In the DT condition, participants were not asked to prioritize the walking or cognitive task; to simulate the way individuals naturally allocate tasks in everyday life. Participants were asked to perform a countdown counting task while walking, each time decreasing by 1. The starting number was randomly generated by Excel (within the range of 100). To ensure data stability and reliability, each subject performed six trials under both ST and DT conditions, with the trial order randomly assigned to eliminate sequence effects. To ensure data stability and reliability, each participant completed six trials under both ST and DT conditions.
Data analysis
Biomechanical parameters were calculated starting from the marking of the markers, with missing or abnormal data leading to exclusion. The anthropometric data of the subjects were imported into Nexus software. The Vicon Plug-in-Gait model was used to analyze the joint kinetic parameters of the lower limbs (ankle, knee, and hip), including the joint force (N/kg), joint moment (Nm/kg), joint power (W/kg), and the CoM, covering sagittal, coronal, and planar directions. Kinetic data were analyzed during the stance phase only. This phase allows for reliable force and moment measurements. Processed data were exported in comma seperated values format and then the required variables were extracted using MATLAB® for further analysis.
DT gait cost (DTGC) was defined as the percentage change in gait parameters between ST and DT conditions. This can be expressed using the formula
24
:

In the formula, ST and DT refer to gait and joint parameters. A positive DTGC indicates higher parameter values in ST than DT, while a negative DTGC indicates the opposite. To provide a clearer explanation of the meaning of the DTGC and the functional significance of its positive and negative values, relevant examples and explanations have been compiled in Supplemental Appendix Table 1.
Statistical analysis
Statistical analyses were performed using SPSS® Version 28 (SPSS® Inc.). The repeatability of key kinetics within a single testing session was assessed by calculating the intraclass correlation coefficient (ICC(1,1)). ICC values indicate consistency among repeated measures. Values closer to 1 represent higher reliability. Normality of all variables was assessed with the Shapiro-Wilk test. For normally distributed data, repeated measures analysis using general linear modeling (GLM) was applied, with task type (DT vs. ST) as a within-subject factor and age group as a between-subject factor. Differences in DTGC gait parameters between groups were compared using multivariate analysis of variance (MANOVA) within the GLM, with gait parameters as the dependent variable and group as a fixed factor. Pairwise comparisons were conducted using Bonferroni correction (p < 0.05) to minimize false positives. For non-normally distributed data, nonparametric tests were used, including the Kruskal-Wallis H test for group differences and the Wilcoxon signed-rank test for comparing gait parameters between DT and ST conditions.
Results
This study is part of a large project and a previous study by us reported gait parameters and kinematics already. All groups showed reduced cadence and walking speed under DT (p < 0.01). YG: decreased step width with precise ankle control (p = 0.030). MG: exhibited significant hip and pelvic adjustments (p < 0.05). OG: increased left ankle rotational range of motion and step width and reduced right knee range of motion (p < 0.05).
Demography parameters
Table 1 shows the demographic characteristics of the three groups, with no statistically significant differences in these parameters except age.
Demographic characteristics of participants across three age groups.

Note: This table presents the demographic characteristics of the YG, MG, and OG. Data are shown as mean ± SD for continuous variables and frequency (%) for categorical variables. One-way ANOVA was used for continuous variables, and Chi-square test for categorical variables. p < 0.05 indicates a statistically significant difference.
ANOVA: analysis of variance; BMI: body mass index; MG: middle-aged group; OG: old group; SD: standard deviation; YG: young group.
ICC
The key kinetic parameters showed good repeatability across multiple trials within a single testing session. ICC values ranged from 0.702 to 0.962. This indicates moderate to high consistency (see Supplemental Appendix Table 3). These findings support the measurement methods have satisfactory reliability.
Accuracy of counting in dual task conditions
As shown in Figure 1, in cognitive accuracy, both the YG and MG performed significantly better than the OG (p < 0.001).

Cognitive task accuracy across age groups during dual-task walking. This figure illustrates the cognitive accuracy (%) during dual-task walking in the young group (YG), middle-aged group (MG), and older group (OG). Data are presented as mean ± standard error of the mean (SEM). A significant reduction in cognitive accuracy was observed in OG compared to both YG and MG (p < 0.001), while no significant difference was found between YG and MG (p > 0.05). Error bars indicate SEM. Asterisks (***) denote significant group differences (p < 0.001).
Joint force parameters
Within-group comparison (ST vs DT): for ankle joint force, significant increases under DT compared to ST included left compression in the YG, right medial-lateral range of force (ROF) in the MG and left medial-lateral ROF in the OG (p = 0.022, partial eta squared = 0.051). Significant decreases during DT were observed in the young group (YG) for right anterior, anterior–posterior ROF, and left tension-compression ROF, as well as in the MG for right tension and tension-compression ROF. Considering knee joint, the left ROF in the YG decreased by 3.17% in the anterior–posterior under DT compared to ST (p = 0.025, partial eta squared = 0.049). The MG showed significantly lower anterior–posterior ROF under DT. The YG and OG had significant decreases in left medial–lateral ROF under DT, and the MG showed a 0.54% decrease in right ROF compared to ST. For hip force, in the OG, left anterior under DT (2.51) was 3.8% lower than ST (2.61), while right posterior was significantly higher in DT. In the MG, DT values were significantly lower than ST for right anterior, anterior–posterior, compression, and left lateral forces. In the YG, right lateral, medial–lateral ROF, and compression forces were significantly higher in ST than in DT (seen as Table 2 and Supplemental Appendix Table 4).
Between-group comparisons of joint kinetic parameters (ST vs. DT conditions).
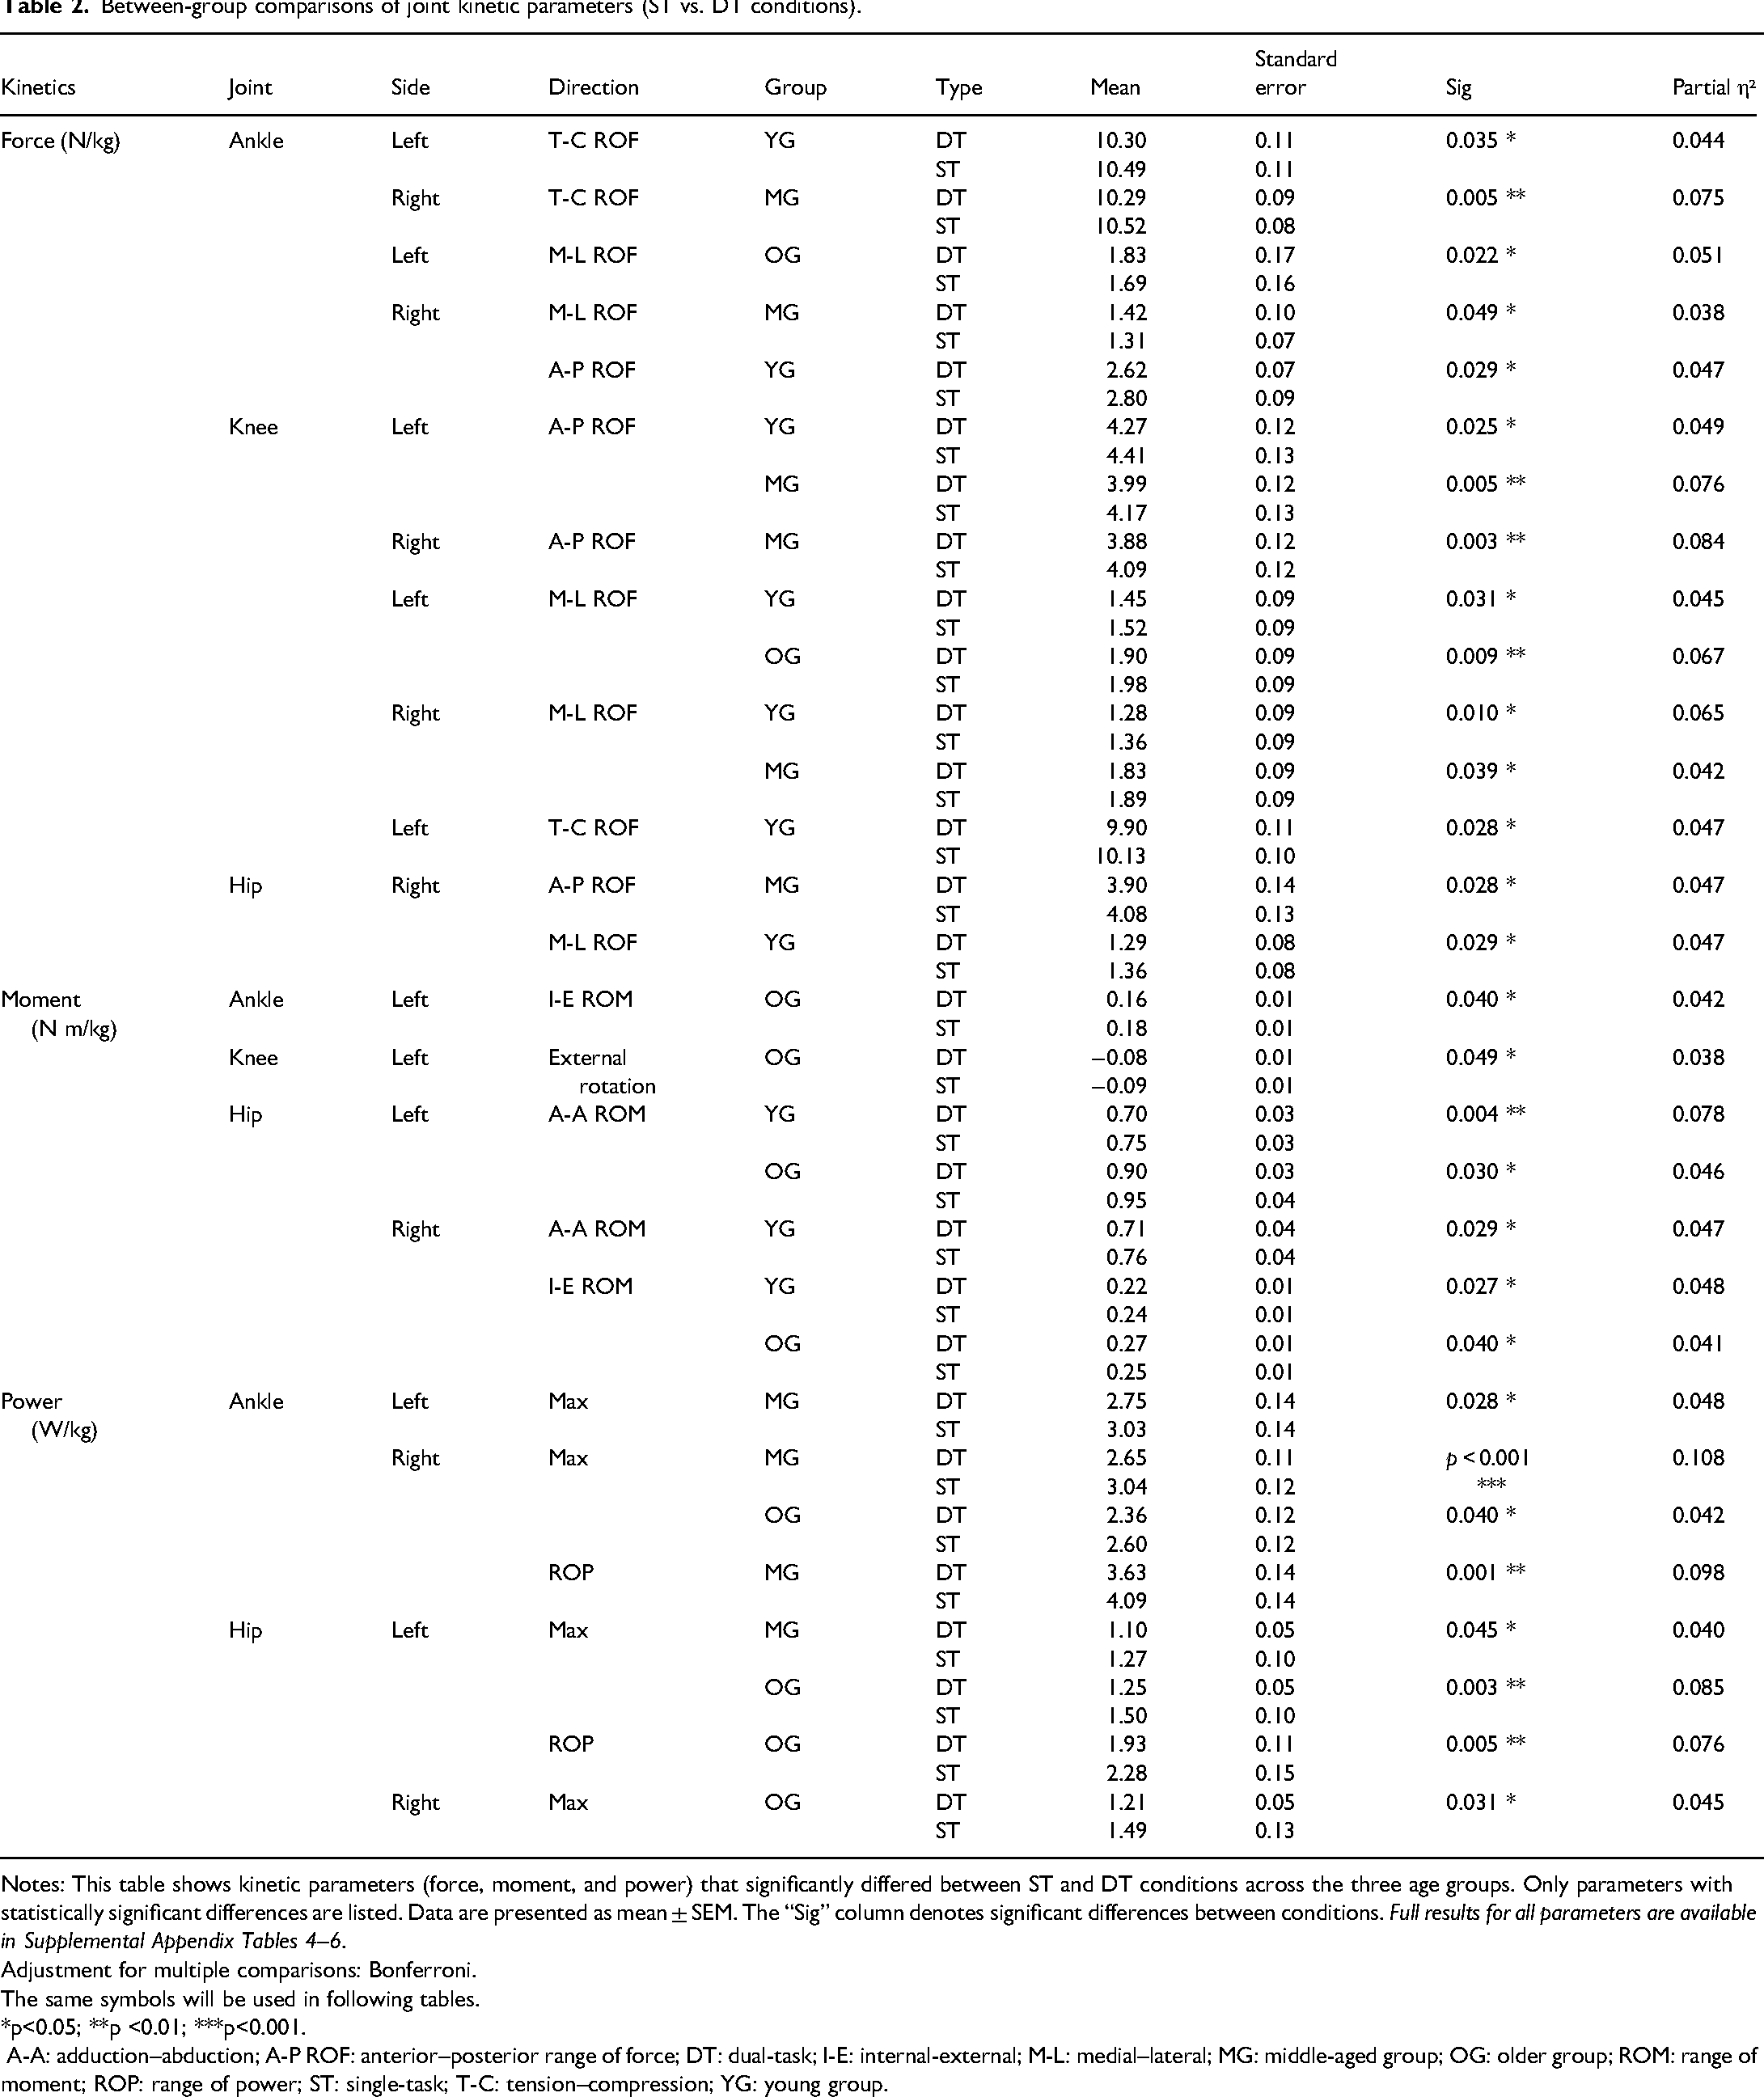
Notes: This table shows kinetic parameters (force, moment, and power) that significantly differed between ST and DT conditions across the three age groups. Only parameters with statistically significant differences are listed. Data are presented as mean ± SEM. The “Sig” column denotes significant differences between conditions. Full results for all parameters are available in Supplemental Appendix Tables 4–6.
Adjustment for multiple comparisons: Bonferroni.
The same symbols will be used in following tables.
*p<0.05; **p <0.01; ***p<0.001.
A-A: adduction–abduction; A-P ROF: anterior–posterior range of force; DT: dual-task; I-E: internal-external; M-L: medial–lateral; MG: middle-aged group; OG: older group; ROM: range of moment; ROP: range of power; ST: single-task; T-C: tension–compression; YG: young group.
Between-group comparison (DTGC): the DTGC analysis showed that the MG had a significantly higher change of the right tension than the OG in the ankle (p=0.026, partial eta squared = 0.088). In the Knee joint, the MG had a lower medial–lateral ROF than the OG in the left knee, while the YG had a higher tension-compression ROF than the OG (p < 0.05). The DTGC analysis showed that in the hip joint, the change in the right medial force in the MG was significantly greater than in the OG (p < 0.05; as Table 3 and Supplemental Appendix Table 7).
Age group comparisons of joint kinetics under dual-task gait cost.
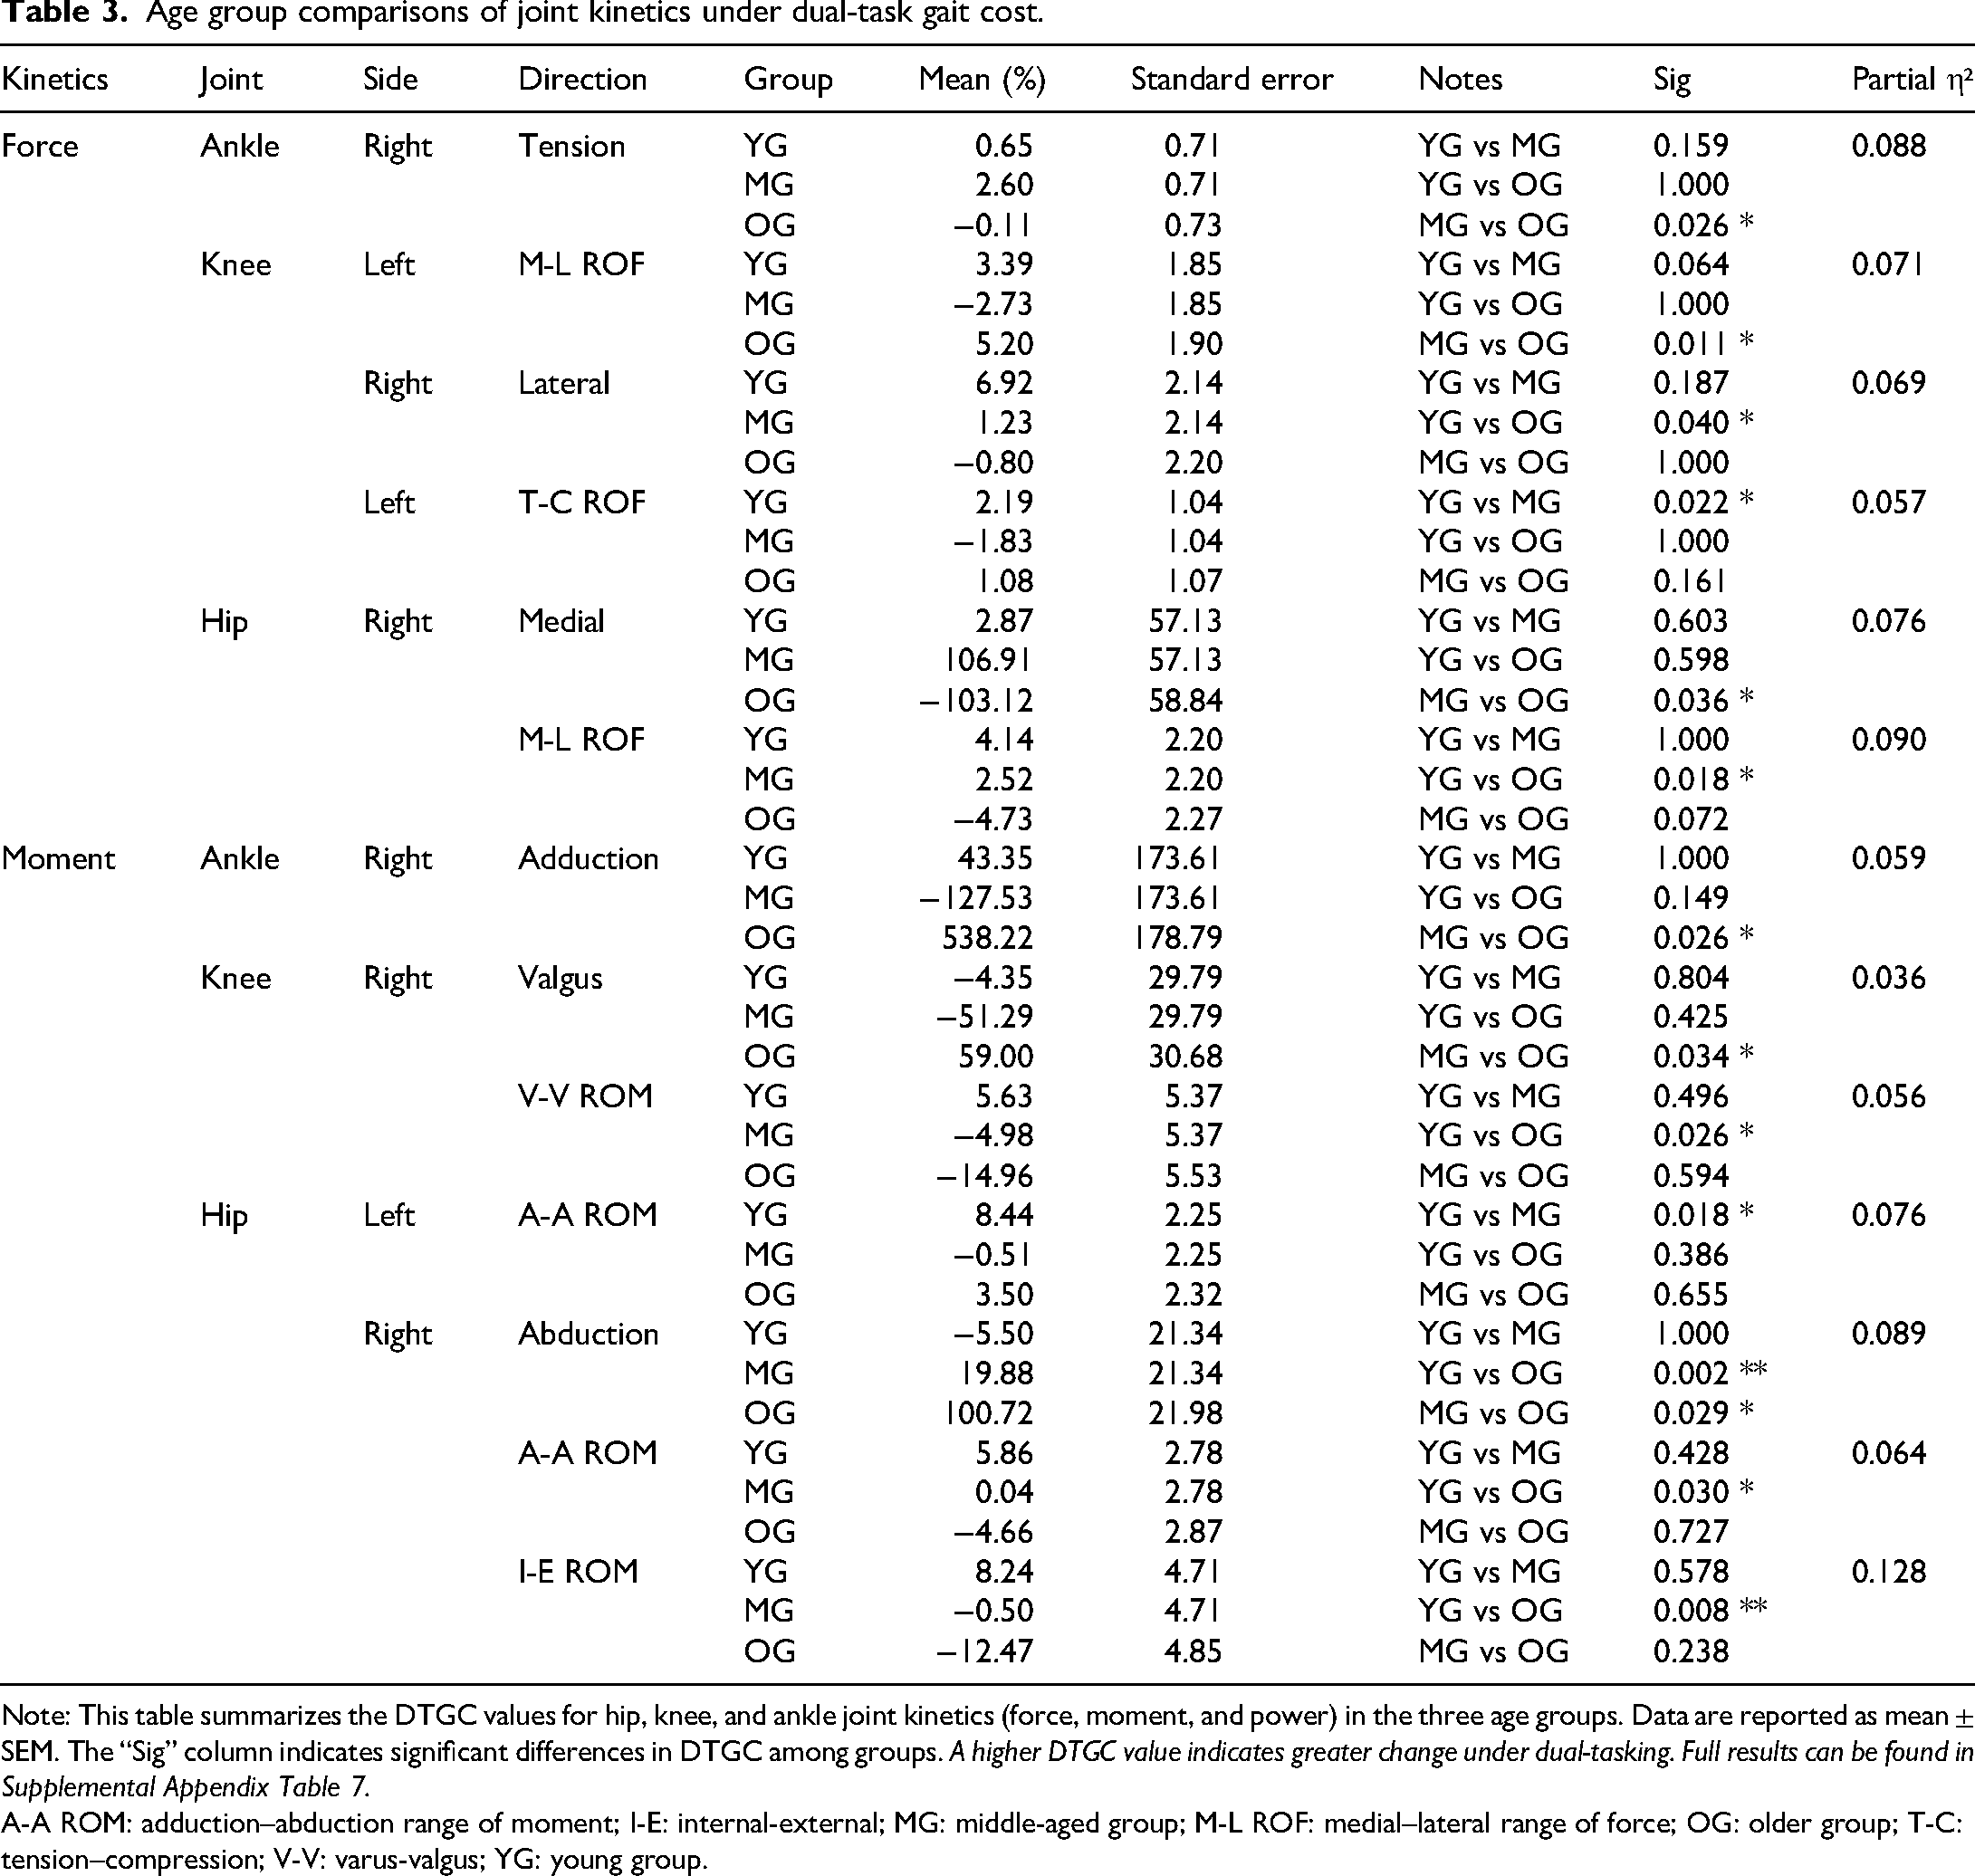
Note: This table summarizes the DTGC values for hip, knee, and ankle joint kinetics (force, moment, and power) in the three age groups. Data are reported as mean ± SEM. The “Sig” column indicates significant differences in DTGC among groups. A higher DTGC value indicates greater change under dual-tasking. Full results can be found in Supplemental Appendix Table 7.
A-A ROM: adduction–abduction range of moment; I-E: internal-external; MG: middle-aged group; M-L ROF: medial–lateral range of force; OG: older group; T-C: tension–compression; V-V: varus-valgus; YG: young group.
Joints moment parameters
Within-group comparison (ST vs DT): In the moment, DT was lower than ST for left ankle and knee external rotation, and the ROM in internal–external rotation of ankle in the OG. In the ankle and knee joints, no significant differences were found in the MG and YG (p < 0.05). For the hip joint, during the DT, the ROM of abduction–adduction and internal–external rotation was lower than in the ST for the YG. In the OG, DT showed reduced ROM in left hip adduction–abduction and external rotation compared to ST (p = 0.040, partial eta squared = 0.041) (seen as Table 2 and Supplemental Appendix Table 5).
Between-group comparison: The DTGC analysis showed the right ankle abduction and right knee valgus change were greater in the OG than the MG (p < 0.05). The change in the YG had a smaller change in knee valgus-inversion ROM than the OG. The OG had a higher rate of change in right hip abduction than YG and MG (p < 0.05, partial eta squared = 0.089) (in Table 3 and Supplemental Appendix Table 7).
Joints power parameters
Within-group comparison (ST vs DT): As shown in Table 2 and Supplemental Appendix Table 6, in the ankle, the maximum power in the MG was significantly lower in DT than ST (p < 0.05), with a 7.5 reduction in the right side the range of power (ROP). In the OG, the maximum power on the right side was significantly smaller in DT (p < 0.05). In the hip, the maximum power on the left side in the MG and OG were smaller in DT (p < 0.05). The left hip ROP of the OG was also significantly smaller in DT (p = 0.005, partial eta squared = 0.075).
Between-group comparison: In the DTGC analysis, no significant power differences were found among the three groups in any direction (p > 0.05) (in Supplemental Appendix Table 7).
CoM parameters
In the CoM of medial–lateral, the ST of the OG was significantly lower than the DT (p = 0.025, partial eta squared = 0.038), as shown in Table 4 and Supplemental Appendix Table 8. There was no significant difference in CoM among the three groups in the DTGC (p > 0.05), as shown in Supplemental Appendix Table 9.
Comparison of CoM kinematics between ST and DT conditions.

Note: This table presents parameters related to the CoM that showed significant differences between ST and DT conditions in each age group. Parameters include CoM displacement and velocity. Data are shown as mean ± SEM. The “Sig” column indicates statistical significance between tasks. Full data are available in Supplemental Appendix Table 8.
CoM: center of mass; DT: dual-task; MG: middle-aged group; OG: older group; ST: single-task; YG: young group.
Summary of significant kinetic changes under dual-task conditions
Table 5 summarizes the proportion of significant changes in joint force, moment, and power under DT across the three age groups (p < 0.05). In the YG, 16.7% of ankle joint forces and 38.9% of knee joint forces significantly decreased under DT, with no significant changes observed in moments or power. In the MG, 11.1% of ankle joint forces, 27.8% of knee joint forces, and 16.7% of ankle joint power showed significant decreases. The OG demonstrated a 16.7% increase in ankle joint force, significant decreases of 11.1% in knee joint force and 5.6% in knee joint moment, as well as a 16.7% reduction in hip joint power. Additionally, the OG exhibited a significant 33.3% increase in medial–lateral displacement of the CoM, whereas no significant CoM changes were found in the YG and MG.
Summary of significant kinetic changes under dual-task conditions.

Note: This table summarizes the percentage of participants in each age group (YG, MG, and OG) who exhibited significant increases (↑) or decreases (↓) in kinetic parameters under dual-task conditions.
The percentages reflect the proportion of individuals within each group showing significant change (p < 0.05) in force, moment, or power.
This table helps visualize the variability and prevalence of kinetic adaptation in response to dual-task walking.
CoM: center of mass; MG: middle-aged group; OG: older group; YG: young group.
Discussion
Under DT conditions, age-related trends were observed in gait kinetics across different age groups. In the OG, under DT, accuracy was significantly reduced, indicating that cognitive performance was affected under DT. 25 At the same time, there was a significant increase in ankle joint force, while both moment and power decreased. This suggests that elderly individuals rely more on the ankle joint to maintain gait stability when cognitive load increases. 26 The findings align with those of Wang et al., who observed significant declines in gait performance and lower-limb joint kinetics during DT stair descent. 27 However, the reduction in moment and power may indicate that the compensation strategy at the distal joint is less efficient, potentially leading to decreased energy utilization and overloading of distal joints. 28 Although the ankle joint experienced more load, the force and moment at the knee joint decreased. This suggests that elderly people may have trouble properly sharing the load through the knee, possibly due to weaker knee muscles or problems with nerve and muscle coordination. 7 Consistently, findings from the Baltimore Longitudinal Study of Aging demonstrated that participants who failed the cognitive task during DT walking exhibited lower ankle generative mechanical work and greater knee absorptive work, further supporting the notion that impaired distal joint efficiency under cognitive load is a common mechanism contributing to gait deterioration in aging. 29
Additionally, there were no significant changes in the hip joint force, suggesting that elderly individuals did not actively adjust the movement pattern of proximal joints, relying more on distal joints for compensation. However, this strategy might be insufficient to maintain overall gait stability. Notably, the CoM showed greater variability, indicating that their ability to control whole-body balance was significantly affected under DT, which could lead to decreased gait efficiency and an increased risk of falls.17,19,30 Similar age-related increases in CoM variability under DT have also been reported in studies combining cognitive and visual tasks, suggesting that older adults adopt more automatic gait control strategies to cope with increased attentional demands. 31 Furthermore, Vanderlinden et al. found that older adults exhibit greater trunk flexion angles and increased compensatory muscle torques during DT performance. 32 This aligns with the reduced CoM control observed in the study and supports the idea that impaired proximal stability affects whole-body balance. Functional near-infrared spectroscopy evidence suggests that dual-tasking reduces neural resources for postural control, particularly in older adults, which may contribute to the increased CoM variability and reduced gait efficiency under DT. 33
In contrast to the OG, the MG demonstrated a different gait adjustment strategy under DT. Both ankle joint force and power decreased, suggesting that they tend to reduce the load on distal joints when cognitive load increases. This may be to optimize gait control and reduce energy expenditure. 34 However, the knee joint force did not change significantly, which means the knee could not fully make up for the reduced load at the ankle. Instead, the body mainly adjusted by using the hip joint. Specifically, hip joint force increased, and in some individuals, there was an increase in pelvic anteversion angle, which could reflect an adjustment in the proximal joint posture to maintain gait stability under increased cognitive load. 16 This interpretation is consistent with previous findings showing that middle-aged adults already exhibit reduced ankle range of motion and diminished ankle and knee joint moment production compared to younger adults, suggesting that distal joint functional decline begins before old age and may underlie their reliance on proximal compensation under DT. 35 While this compensation strategy helps maintain overall balance to some extent, it may increase the load on the lumbar spine and lower back, raising the risk of chronic injury. 36 Specially, despite changes in gait parameters, the CoM remained stable, indicating that the MG could still maintain a good overall balance under increased cognitive load.
In the YG, under DT, the ankle joint force was reduced, indicating that young individuals tend to reduce the load on the ankle joint to optimize gait control under additional cognitive demands. However, the ankle joint moment and power did not show significant changes, suggesting that their neuromuscular coordination is strong and they can effectively maintain energy transfer efficiency. This stability reflects that young individuals can adjust their gait strategy without significantly altering joint kinematics. 37 Consistent with Wang et al.'s findings, healthy young adults maintained good gait control under DT manual conditions. 27 Additionally, the changes in the knee and hip joint dynamics were minimal, further indicating that young individuals can maintain high gait efficiency under DT.7,38 Consistently, healthy young adults maintained good gait control under DT manual conditions.39,40 Additionally, muscle activity in lower limb and trunk muscles may decrease under DT, while overall postural stability is preserved, reflecting a redistribution of attention from motor performance without compromising gait efficiency. 39 Furthermore, the CoM remained stable, suggesting that young individuals can maintain overall stability in DT.
Under DT, cadence and walking speed decreased in all groups. Step width increased in the YG but decreased in the MG and OG. These changes in spatiotemporal parameters relate to the observed kinetic alterations. Reduced cadence and speed affect joint moments and powers by changing gait timing and load distribution. 29 The YG's increased step width may help maintain stability, matching their ankle joint kinetics. In contrast, reduced step width in the older groups may reflect poorer stability control, consistent with their decreased joint kinetics. Compared to the MG and OG, the YG showed the least gait variability, providing a benchmark for comparison with the other age groups and validating the trend of a gradual decline in gait regulation with age. 41 These findings align with previous studies showing links between gait spatiotemporal changes and joint kinetics under cognitive load. 42
Overall, under DT, the kinetics changes in different age groups reflect distinct gait adjustment strategies. The YG primarily maintains stable gait by optimizing ankle control and energy transfer, while the MG and OG exhibit weaker gait control under cognitive load, resulting in varying degrees of compensatory strategies. The MG shows signs of cognitive-motor resource competition, with gait control deteriorating due to cognitive task interference, and some individuals rely on posture adjustments as compensation. In contrast, the OG, due to cognitive resource overload, demonstrates overload in distal joints and a decline in overall gait efficiency, further increasing the risk of falls. Additionally, changes in CoM contribute to further impairments in balance control, amplifying the risk of instability and falls in the elderly individuals. 43 However, these interpretations should be made cautiously given the limited sample size of 12 individuals per group. The observed subgroup differences in gait kinetics and balance control strategies require validation in larger populations to confirm their robustness and generalizability.
Although this study focused on kinetic and kinematic analyses, extensive EMG data were also collected but not analyzed here due to the large dataset. Future work will specifically analyze EMG to further validate and support the findings presented in this study.
Limitation
Although this study has yielded some interesting findings, there are several limitations. The sample size is small, with only three age groups, which may limit the generalizability of the results. The controlled experimental conditions may not fully reflect real-life gait performance. The focus was on kinetics, without considering other cognitive or physiological factors that could influence gait. Additionally, some extreme values in the results are due to the DTGC formula, where small ST values can cause large DTGC percentages due to minor differences between DT and ST. This is a normal phenomenon and does not indicate data issues. Furthermore, the same cognitive task (counting backward) was applied uniformly across all age groups to maintain consistency in cognitive load. However, given the differences in cognitive abilities among age groups, this task may not have imposed equal difficulty levels for all participants. Such discrepancy could affect the calculation of DTGC. Future studies might consider adjusting cognitive task difficulty according to individual cognitive capacity to improve the accuracy and applicability of the findings.
Clinical relevance
This study highlights the importance of DT gait assessment in evaluating the impact of cognitive load on gait stability, particularly in older populations. The results indicate that OG may increase their reliance on the ankle joint to maintain gait stability under cognitive load; however, this strategy could lead to joint overload and increased fall risk. Clinicians can use these findings to identify early signs of cognitive and motor dysfunction and implement personalized interventions, such as gait training or cognitive rehabilitation, to improve balance and reduce fall risk. Future studies may consider using wearable sensors (e.g. IMUs or insoles) to evaluate DT kinetics outside the lab. This would enhance clinical applicability by allowing more accessible and scalable gait assessments. Understanding how different age groups adjust their gait under cognitive load can help optimize clinical assessments and guide personalized rehabilitation strategies.
Conclusion
This study analyzed the changes in kinetics under DT across different age groups. Under cognitive load, the OG exhibited increased ankle joint load and decreased power, suggesting reliance on the ankle joint to maintain gait stability, but with lower efficiency, potentially leading to ankle overload. Additionally, balance control in the OG group was impaired under cognitive load. The MG demonstrated a decrease in ankle joint power and adjusted through the hip joint to maintain gait stability. The YG showed minimal gait changes, particularly in power, and maintained stable gait control. DT gait assessment effectively detects the impact of cognitive load on gait regulation strategies across different age groups, with clinical significance for the older population.
Supplemental Material
sj-docx-1-sci-10.1177_00368504251384880 - Supplemental material for A pilot study of cross-sectional design assessing gait kinetics during dual task in different age groups
Supplemental material, sj-docx-1-sci-10.1177_00368504251384880 for A pilot study of cross-sectional design assessing gait kinetics during dual task in different age groups by Yuying Zhang, Alan Duncan, Afsoun Nicholas and Weijie Wang in Science Progress
Footnotes
Acknowledgements
The authors are grateful to all volunteers who participated in this study, to Mr Sadiq Nasir and Dr Graham Anolrd for their help in data collection.
Ethical approval
The ethical approval for healthy subjects was obtained from the Dundee University School of Medicine and Life Sciences Research Ethics Committee (SMED REC number 22/118).
Informed consent
Informed consent was obtained from all the subjects involved in the study.
Authors’ contribution
YZ and WW participated in the conceptualization of the manuscript. YZ searched for references to be included in the review, writing the initial drafts of the different sections. YZ, AD, and AN collected data. YZ prepared tables and figures. YZ and WW analyzed the data. WW made software. YZ drafted the paper and WW edited and approved the final version of the manuscript. All authors read and approved the final version.
Funding
The authors disclosed receipt of the following financial support for the research, authorship, and/or publication of this article: The authors received open access funding from School of Medicine, University of Dundee.
Declaration of conflicting interests
The authors declared no potential conflicts of interest with respect to the research, authorship, and/or publication of this article.
Data availability statement
The data that support the findings of this study are not publicly available due to their containing information that could compromise the privacy of research participants but are available from the corresponding author WW.
Supplemental material
Supplemental material for this article is available online.
References
Supplementary Material
Please find the following supplemental material available below.
For Open Access articles published under a Creative Commons License, all supplemental material carries the same license as the article it is associated with.
For non-Open Access articles published, all supplemental material carries a non-exclusive license, and permission requests for re-use of supplemental material or any part of supplemental material shall be sent directly to the copyright owner as specified in the copyright notice associated with the article.