
Abstract
Objective
The identification of myocardial injury in the intensive care unit (ICU) has received little attention from researchers. Therefore, this retrospective cohort study aimed to develop a machine-learning model to predict the occurrence of myocardial injury in the ICU.
Methods
Based on the Clinical Research Data Platform of Peking University People's Hospital, we enrolled adult, non-cardiac surgical, and non-obstetric patients who were admitted to the ICU between 2012 and 2022. Logistic regression, random forest, LASSO regression, support vector machine and extreme gradient boosting (XGBoost) models were developed to predict myocardial injury.
Results
Data from 7453 non-cardiac surgery adult patients in ICU were collected in the derivation cohort (myocardial injury group: 2161 [29%], non-myocardial injury group: 5292 [71%]). Among the five models, the XGBoost model (area under the curve = 0.779; accuracy = 0.781) exhibited the best predictive performance for myocardial injury and the results were explained by the SHapley Additive exPlanations analysis. The top six features of the XGBoost model were maximal heart rate, respiratory rate, temperature, minimal heart rate, age and plasma transfusion.
Conclusion
This machine-learning model, developed using the XGBoost algorithm, could be a valuable tool for clinical decision-making and detecting myocardial injury in the ICU.
Keywords
Introduction
The importance of identifying unrecognised myocardial injury (MI) and its influence in intensive care unit (ICU) patients was highlighted over 20 years ago. 1 Now the leading cause of 30-day mortality after non-cardiac surgery is MI. 2 The prevalence of myocardial injury after non-cardiac surgery (MINS) is above 20% and related to fivefold increased post-operative mortality. 3 The incidence of perioperative MI range from 9% to 25%, along with substantial short- and long-term mortality. 4 And the incidence of MI is expected to increase with the elderly population undergoing surgery continues to grow. 5 The identification of MI has drawn more research attention, with the advancements in technology especially artificial intelligence, as machine learning facilitates recognition of MI. 6
This study aimed to develop a predictive model for identifying MI in the ICU using a machine-learning algorithm based on electronic health records (EHRs). Machine learning allows substantial possibility in evaluating predictors, combining them in nonlinear and highly interactive ways for predicting MINS. 7 Comparing with traditional risk scores, it can be retrained and refined continually, as well as providing an automated and real-time estimate of risk clinically. 8 Considering inappropriate testing of cardiac tropnin (cTn) may lead to public and individual economical burden and subjects patients to unexpected risks from false positive results, 9 we focussed on data of EHR in building machine-learning models.
Materials and methods
We extracted demographic, clinical and laboratory data of adult, non-cardiac surgical patients who were admitted to the surgical ICU of Peking University People's Hospital from January 2012 to December 2022. Patients were categorised into MI and non-MI groups according to their cardiac troponin (cTnI) or hypertensive cardiac troponin (hs-cTnI) levels. We applied logistic regression (LR), lasso regression (LASSO), random forest (RF), support vector machine (SVM) and extreme gradient boost (XGBoost) algorithms to build machine learning models for predicting the occurrence of MI in specific ICU patients and explained the predictive results using SHapley Additive exPlanations (SHAP). SHAP was developed to explain the output of machine learning models. It assigns each feature an importance value based on its contribution to the prediction. This approach uses game theory to distribute the total model prediction to individual contributions by each feature and provides a fair and consistent method for understanding the most influential features in making a particular prediction. This study was conducted and reported in accordance with the TRIPOD statement. 10
Study population
Data were derived from the Clinical Research Data Platform of Peking University People's Hospital and were retrieved from GeneLife (Beijing) Technology Co. Ltd All patient details were fully de-identified. The timespan was 10 years from January 2012 to December 2022. Based on the Clinical Research Data Platform of Peking University People's Hospital, we enrolled 8514 adult patients who were admitted to the ICU between 2012 and 2022, excluding patients who were cardiac surgical, pregnant and breastfeeding. Among them we kept only patients admitted to the ICU for the first time, 7453 patients in total were left for further analysis. This study was conducted in accordance with the ethical principles of the Declaration of Helsinki (1975) and its later amendments (revised in 2024). It was approved by the Institutional Medical Ethics Committee of Peking University People's Hospital (Beijing, China; approval number: 2023PHB189-001; date of approval: 2023-07-12). Given its retrospective nature, the requirement for informed consent was waived. A flowchart of the screening process is shown in Figure 1.

Flowchart of screening. Flow chart of patients enrolled to build a predictive machine learning model for myocardial injury. ICU, intensive care unit.
Data collection
The demographics, medical history, family history, personal history, laboratory tests, nursing records, anaesthetic input and output volume, cardiac enzymes and prognostic data of patients who were admitted to the ICU for the first time were collected using Navicat 16 for PostgreSQL (v.16.3.5). Demographic variables (age, sex, height and weight) and medical history (hypertension, hyperlipidaemia, diabetes and coronary artery disease [CAD]) were extracted. Family history (hypertension, diabetes and coronary diseases), personal history (smoking and drinking habits), laboratory tests (routine blood tests [e.g. white blood cell and haemoglobin], biochemistry tests [e.g. alanine aminotransferase and aspartate aminotransferase], coagulation function tests [e.g. activated partial thromboplastin time and prothrombin time], and blood gas analysis [e.g. pH and arterial pressure of oxygen]) data were collected. The nursing records consisted of vital signs (e.g. heart rate [HR] and respiratory rate [RR]), pain scale (including values in resting and activated states), temperature, blood glucose monitoring and input and output volumes. The anaesthetic input and output volume comprised crystalloid ('Sodium Potassium Magnesium Calcium and Glucose Injection’ and ‘Sodium Lactate Ringer’s Injection’) and colloid (‘Voluven’ and ‘Gelofusine’) infusion, intraoperative blood salvage, blood loss, transfusion of blood products and respective volumes (e.g. red blood cell and plasma), along with urine output. Cardiac enzymes include hs-cTnI and cTnI. The outcome variable, MI, was defined as cardiac enzyme ≥0.04 ng/ml after conversion. The study population was categorised into MI and non-MI groups. Prognostic data included the duration of mechanical ventilation, length of stay in the ICU, length of hospital stay and death. All continuous features were extracted from the extreme values. Supplementary Table S1 (see Supplement) provides an overview of all variable details.
Statistical analysis
Data analysis was performed using R software (v.4.2 .1). P < 0.05 was considered statistically significant. A missing data percentage of 5% is generally the cutoff for imputation, 11 and variables with a fixed percent (e.g. 20%) of missing values will be filtered out. 12 To generate a more reliable imputation model, we excluded variables with >5% missing values, except for the MI outcome variable. The percentages of missing values are described in Supplementary Table S1 (see Supplement). Twenty variables remained for subsequent analysis: age; sex; smoking; drinking; maximal and minimal values of HR, RR, systolic blood pressure (SBP) and temperature (T); transfusion of red blood cells, platelets, plasma and albumin; duration of mechanical ventilation; length of hospital stay; death; and MI. After eliminating anomalous values, we performed multiple imputations using the ‘mice’ package of R software. The heat map of the Spearman's correlation analysis is shown in Supplementary Figure S1. The Kolmogorov–Smirnov normality test was used to evaluate variables, and all continuous variables were skewed and distributed. Continuous variables are presented as medians with interquartile ranges and were assessed using the Kruskal–Wallis rank sum test (Table 1). Categorical variables are expressed as proportions and were assessed using the Chi-squared test (Table 1).
Comparison of patient characteristics between myocardial and non-myocardial groups.
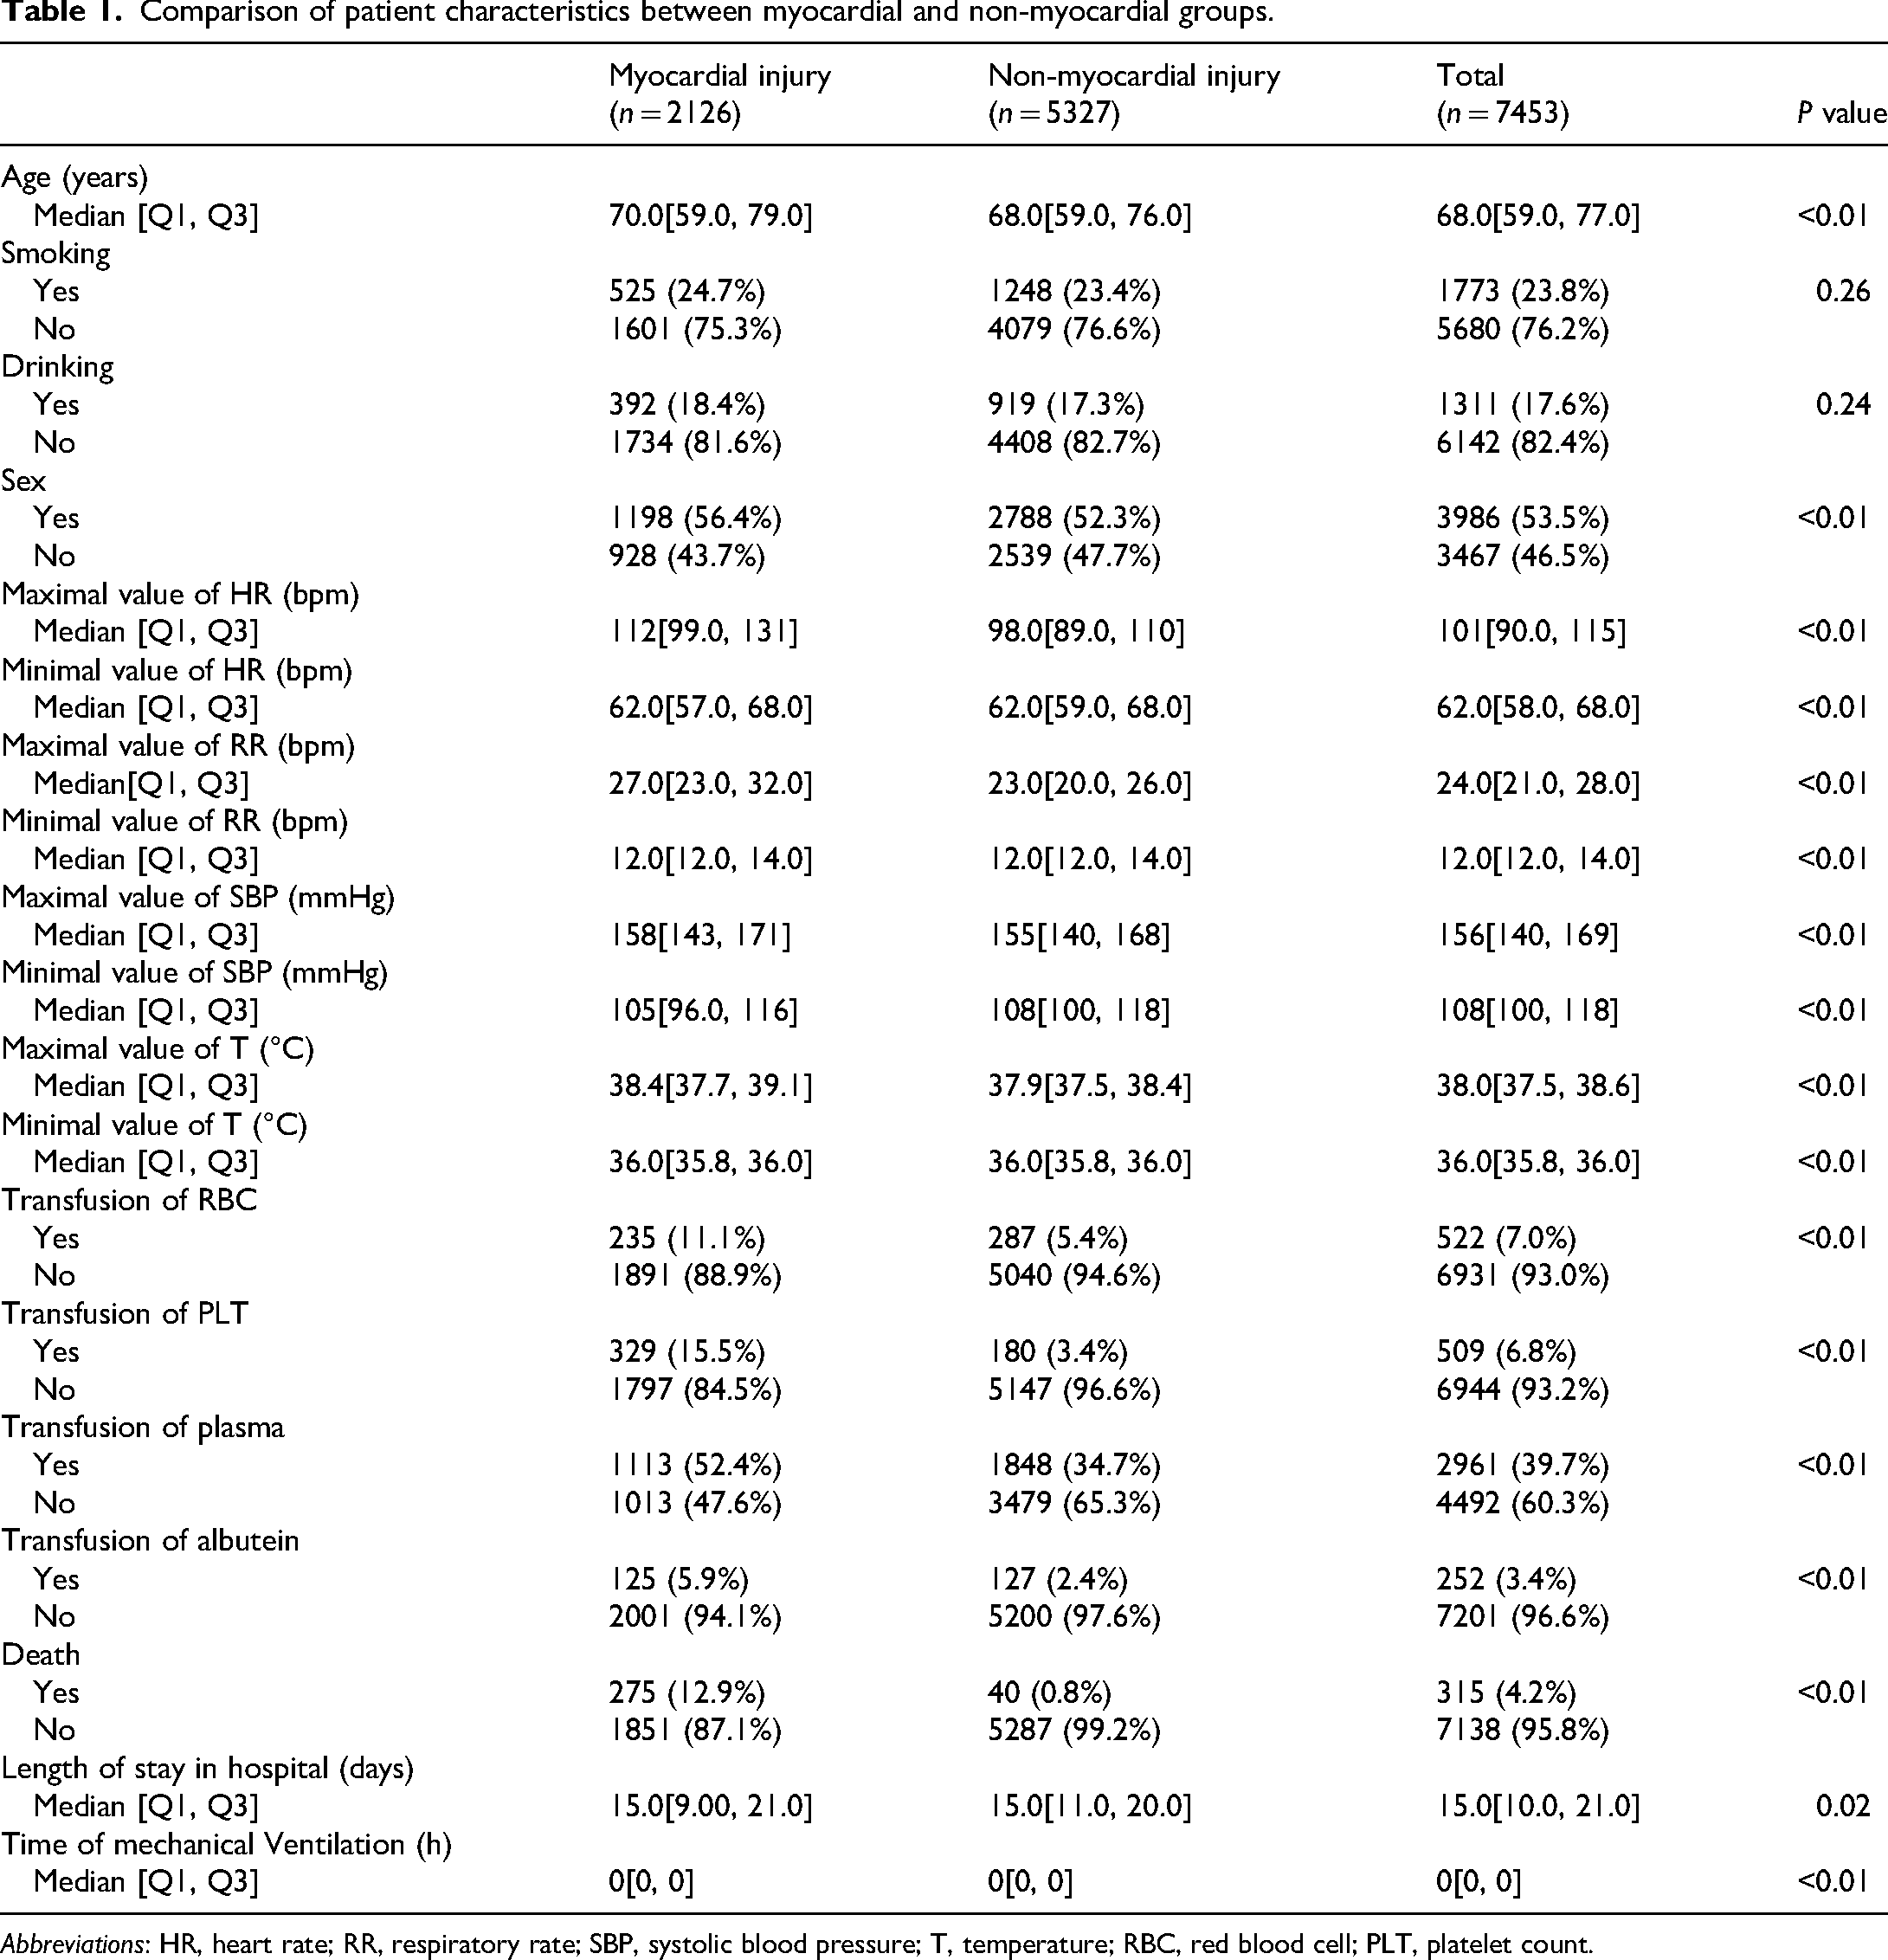
Abbreviations: HR, heart rate; RR, respiratory rate; SBP, systolic blood pressure; T, temperature; RBC, red blood cell; PLT, platelet count.
Based on a ratio of 7:3, the data were randomly categorised into a training set (n = 5217) and a testing set (n = 2236). We applied sample() function which uses a pseudo-random number generator (PRNG) for computer-level randomness. R defaults to using the Mersenne Twister algorithm (a widely-used PRNG). The training set was used for developing predictive models and internal validation, and the testing set was used for external validation (details of the variables in the training and testing sets can be seen in Tables 2 and 3). After excluding prognostic variables, such as time of mechanical ventilation, length of hospital stay, and death, recursive feature elimination (RFE), of which the underlying model was random forest, was used for feature selection, and the best performance over the subset size was 15 variables, except for sex. We employed five machine-learning models (LR, LASSO, RF, SVM and XGBoost) to predict the occurrence of MI in the ICU. Grid search and fine-tuning were manually used to obtain the most suitable hyperparameters and optimise the predictive models. Furthermore, 5-fold cross-validation was applied when the validation of predictive models was necessary to reduce model overfitting and improve robustness. We used the first 15 variables to develop five different machine-learning models. For each model, the area under the curve (AUC) and confusion matrix statistics, such as accuracy, precision, recall and F1 score, we calculated (Table 4). Multiple decision curve (MDC) and receiver operating characteristic (ROC) curve analyses were conducted as depicted in Figure 2(a) and (b). After selecting the most suitable model, we employed the SHAP value to explain its output using the ‘shapviz’ package of R.

(a) Receiver operating characteristic curves of the five predictive models in the external validation cohort. XGB yielded the highest AUC for single-model prediction. (b) Multiple decision curve of five predictive models. The x-axis indicates the threshold probability for the myocardial injury outcome, and the y-axis indicates the net benefit.
Comparison of patient characteristics between myocardial and non-myocardial groups in the training set.

Abbreviations: HR, heart rate; RR, respiratory rate; SBP, systolic blood pressure; T, temperature; RBC, red blood cell; PLT, platelet count.
Comparison of patient characteristics between myocardial and non-myocardial groups in the testing set.

Abbreviations: HR, heart rate; RR, respiratory rate; SBP, systolic blood pressure; T, temperature; RBC, red blood cell; PLT, platelet count.
The AUC, 95%CI, and results of confusion matrix statistics of five machine learning algorithms in the testing set.

Abbreviations: AUC, area under the curve; CI, confidence interval; XGBoost, extreme gradient boosting.
Results
Data from 7453 adult ICU patients undergoing non-cardiac surgery were collected for the derivation cohort. Of these, 2161 (29%) and 5292 (71%) patients belonged to the MI and non-MI groups, respectively.
Characteristics of data
Variables of demographics and personal history
Patients in the MI group were older than those in the non-MI group (median [interquartile range (IQR)]) [70.00 (59.00–79.00) vs 68.00 (59.00–76.00), P < 0.01] (Table 1). No significant differences were observed in smoking [525 (24.69%)–1601 (75.31%) vs 1248 (23.43%)–4079 (76.57%), P = 0.26] or drinking [392 (18.44%) to 1734 (81.56%) vs 919 (17.25%)–4408 (82.75%), P = 0.24] between groups.
Variables of nursing records
All maximal and minimal values of variables left for further analysis in the MI and non-MI groups were statistically significant. These include maximal HR (median [IQR]) [112.00 (99.00–131.00) vs 98.00 (89.00–110.00), P < 0.01], RR (median [IQR]) [27.00 (23.00–32.00) vs 23.00 (20.00–26.00), P < 0.01], SBP (median [IQR]) [158.00 (143.00–171.00) vs 155.00 (140.00–168.00), P < 0.01], and T (median [IQR]) [38.40 (37.70–39.10) vs 37.90 (37.50–38.40), P < 0.01]. The minimal values were as follows: HR (median [IQR]) [62.00 (57.00–68.00) vs 62.00 (59.00–68.00), P < 0.01], RR (median [IQR]) [12.00 (12.00–14.00) vs 12.00 (12.00–14.00), P < 0.01], SBP (median [IQR]) [105.00 (96.00–116.00) vs 108.00 (100.00–118.00), P < 0.01], and T (median [IQR]) [36.00 (35.80–36.00) vs 36.00 (35.80–36.00), P < 0.01]. The results of the minimal values of RR and T were due to a skewed distribution. The skewness values for the minimal value of RR in the MI and non-MI groups were 1.41 and 1.59, respectively, with means of 12.72 and 12.98. The relevant results of the minimal value of T were 0.94, 1.31, 35.92 and 35.95.
Transfusion of blood products
All variables related to blood products showed significant differences and included: red blood cell [235 (11.05%)–1891 (88.95%) vs 287 (5.39%)–5040 (94.61%), P < 0.01], plasma [1113 (52.35%)–1013 (47.65%) vs 1848 (34.69%)–3479 (65.31%), P < 0.01], platelet [329 (15.48%)–1831 (84.73%) vs 180 (3.38%)–5147 (96.62%), P < 0.01], and albutein treatment [125 (5.88%)–2001 (94.12%) vs 127 (2.38%)–5200 (97.62%), P < 0.01].
Prognostic outcomes
Patients in the MI group had a higher mortality rate [275 (12.94%)–1851 (87.06%) vs 40 (0.75%)–5287 (99.25%), P < 0.01] and longer length of hospital stay (median [IQR]) [15.00 (9.00–21.00) vs 15.00 (11.00–20.00), P = 0.02]. Although mechanical ventilation time showed a significant difference, the data might be overly skewed (median [IQR]) [0.00 (0.00–0.00) vs 0.00 (0.00–0.00), P < 0.01]. We calculated the skewness values and means of mechanical ventilation time, which were 6.65 and 30.76, respectively, for the MI group and 12.18 and 1.40, respectively, for the non-MI group.
Model development and performance comparison
Five models were generated to predict the occurrence of MI during surgical ICU stay among non-cardiac surgical adult patients. Among the five models, XGBoost model (AUC = 0.776, 95% CI [0.754–0.799]) showed the best predictive performance for MI, followed by the RF model (AUC = 0.768, 95% CI [0.746–0.791]). The performance of the five models is listed in Table 2. The first model built was the LR model, in which the best alpha and lambda were 0.1 and 0.037, respectively. After optimisation, the performance of the LR model was calculated (AUC = 0.759, 95% CI [0.735–0.782]). The second model was the RF model, in which the hyperparameters tuned for the final model were ntree = 200 and mtry = 7. The third model was LASSO (AUC = 0.759, 95% CI [0.736–0.783]), which was fitted using lambda.1se (0.017). The remaining advanced algorithms were SVM and XGBoost. The final values used for the SVM model were sigma = 0.001 and C = 1024; however, their performance was at the bottom (AUC = 0.625, 95% CI [0.604–0.647]). For XGBoost, the parameters were as follows: nrounds = 200, max_depth = 3, eta = 0.05, gamma = 0, colsample_bytree = 1, min_child_weight = 1, subsamples = 1.
Explainability
The SHAP analysis plot for identifying the features influencing the machine learning model the most in the training set is shown in Figure 3(a) and (b), which depicts the mean absolute SHAP value for each predictor and its impact on the XGBoost model output. In Figure 3(a), the bar chart shows that a higher value indicates greater importance. In Figure 3(b), the x-axis represents the SHAP value, and the y-axis refers to the contribution of the predictors. The plus-minus of the SHAP value of a predictor reflects its positive or negative effect on the predictive value, and values exceeding zero indicate an increased risk of developing MI. The top six variables in the final predictive model were maximal HR, maximal RR, age, minimal HR, maximal temperature and plasma transfusion. As shown, all the previous clinical features directly reflect the potential condition of cardiovascular circulation and the relationship between oxygen supply and demand of the heart, which may lead to an imbalance and eventual MI. The other nine variables are clinically relevant to this logistic relationship. The force and waterfall plots for a single sample and the partial dependence plot are shown in Figures 4(a)–(d) and 5.

(a) A variable importance bee swarm plot was constructed using sHapley additive exPlanations (SHAP) summary tool for the myocardial injury prediction extreme gradient boosting model. According to the SHAP value of each feature, the maximal HR (h _max), maximal respiratory rate (rr_max), and age (yellow dots) were associated with a higher probability of myocardial injury (right side of the vertical dotted line). (b) Variable importance bar chart showing the mean absolute SHapley Additive exPlanations (SHAP) value of each feature and indicates its effect on the output of the extreme gradient boosting model.
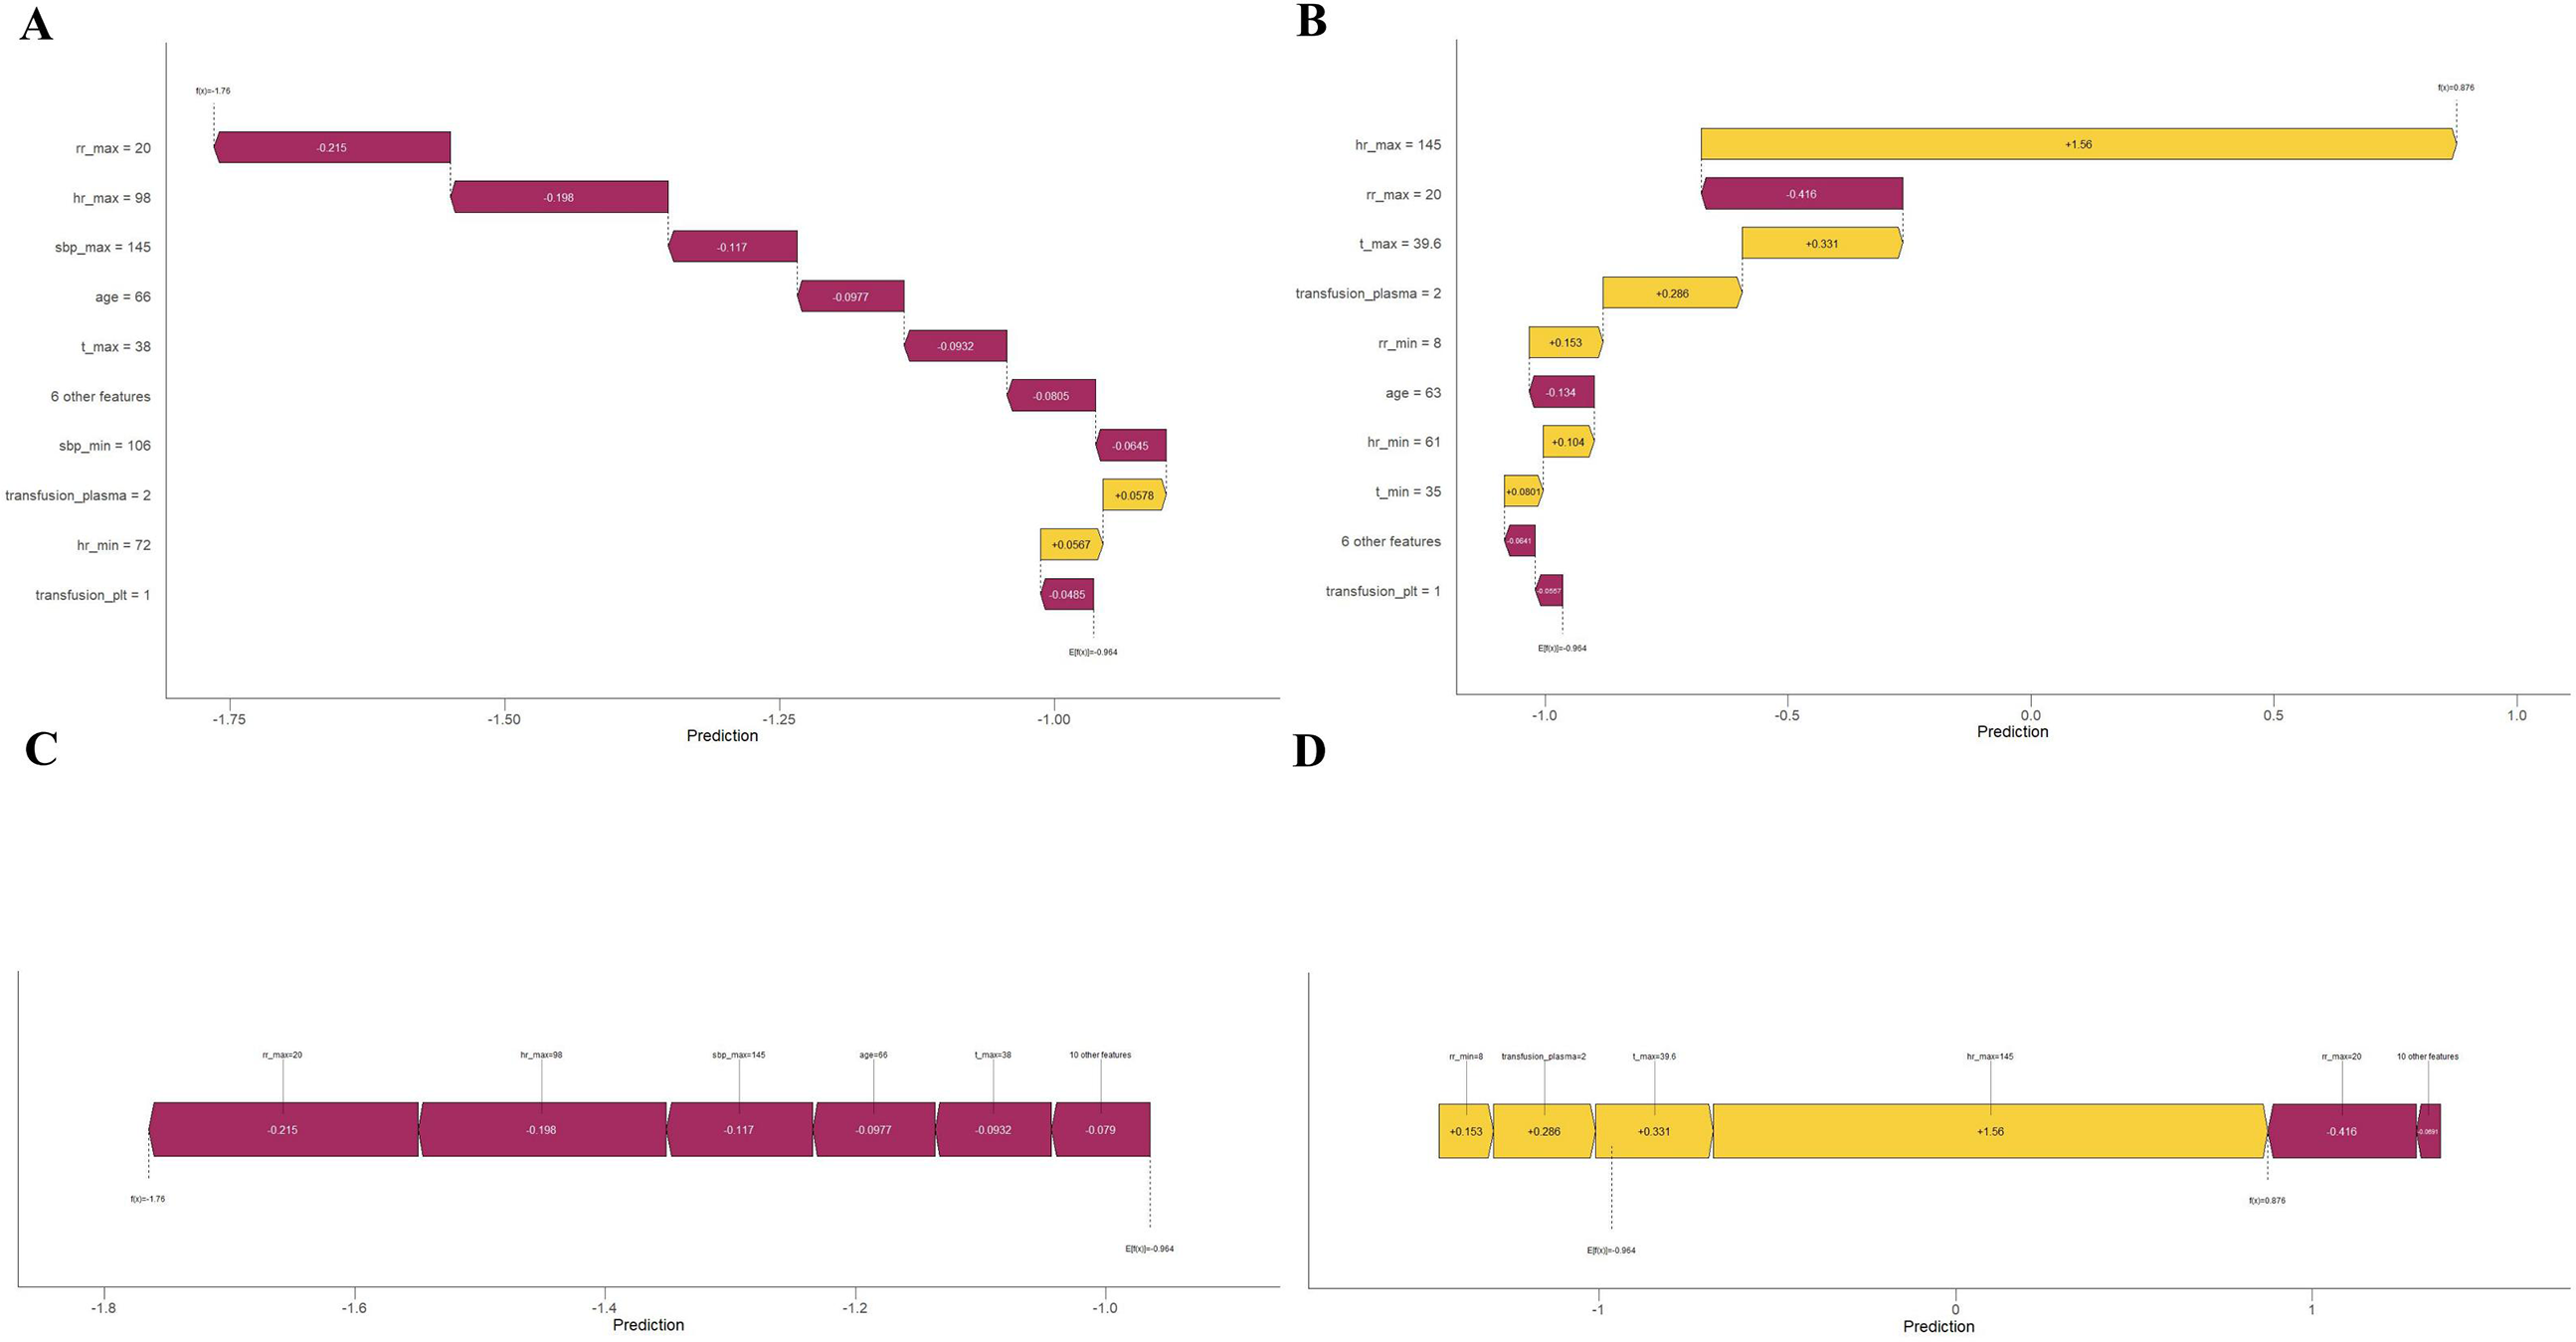
(a) Single-sample waterfall plot for patient ID 10 showing each step from the baseline value to the final predicted value, with each step corresponding to the contribution of a feature. Each level in the waterfall plot represents the contribution of a feature, which can be positive or negative. By observing the cumulative effects of these contributions, we can identify the features that have a significant impact on the final predicted value. For patient ID 10, the overall impact was negative. (b) Single-sample waterfall plot for Inpatient ID 1010, the overall impact is positive, in which the feature of maximal HR (hr_max) contributes the most to the predictive output. (c) Force plot for patient ID 10 shows the relationship between the feature values of each sample and the corresponding SHapley Additive exPlanations (SHAP) values. The features of patient ID 10 are represented in purple and indicate a negative probability of myocardial injury. (d) Force plot for patient ID 1010, in contrast to (c), the features of patient ID 1010 are represented in yellow and purple, where the purple part is overwhelmed by yellow, indicating a positive probability of myocardial injury.

Partial dependence plot. Each dependence plot shows how the features affect each other and the output of the predictive model, where each dot represents one patient. SHapley Additive exPlanations (SHAP) values are represented on the y-axis. The x-axis represents the actual values of one feature, and the values of the other features are depicted by a colour gradient from yellow to purple in descending order. A SHAP value for specific features exceeding zero pushes the decision toward myocardial injury.
Discussion
This study enrolled 7453 patients during the period 2012 to 2022, of which 2126 (28.5%) exhibited MI, which is more than the minimum total sample requirement we calculated (EPV threshold: 20, 20 candidate predictors, event rate: 9–25%). We used five machine learning algorithms to build predictive models, comparing and validating their performances. The XGBoost model underwent 5-fold internal cross-validation and external validation, exhibiting the highest AUC among the five models developed in this retrospective cohort study for predicting the occurrence of MI in non-cardiac surgical adult patients (pregnant and breastfeeding patients were excluded) admitted to the surgical ICU of our hospital for the first time, of which the AUC = 0.776. The 15 features left for the final model are all clinically available and reflect the balance between the oxygen supply and demand of the heart and its general condition.
The European Heart Society released the fourth universal definition of myocardial infarction, which renewed the definition of MI as cTn elevates with at least 1 value above the 99th percentile upper reference limit. 13 It emphasised the comprehensive nature of the concept of MI and the rationality of its diagnosis when evidence of cardiac ischaemia is lacking after non-cardiac surgery. MI and myocardial infarction with increasing concentrations of troponin are common in ICU patients and related prognosis. 14 An increase in troponin level is associated with higher mortality rates and extended mechanical ventilation times, reflecting a simultaneous decline in left ventricular function. 15 The precise diagnosis of MI should be based on clinical symptoms, signs and continuous laboratory tests of cardiac enzymes. 16 The significant risk of complications, such as MI or myocardial infarction, is not uncommon after major non-cardiac surgery and may sometimes be asymptomatic. 17 In the all-cause mortality after non-cardiac surgery, the ratio of patients with MI is as high as one-quarter. 18 Due to the effects of sedation, analgesia and delirium, the cardiac-related symptoms cannot even be elicited in many ICU patients. 14 Such events are called ‘silent’ MI. 19 Approximately 20% to 30% of adult ICU patients who have a history of CAD will experience unrecognised myocardial infarction. 20 Additionally, the fact that troponin is not an index to be monitored routinely might contribute to the reason why MI cannot be recognised sometimes, according to research. 21
The number of studies on predicting MI has increased in recent years; however, the number of machine learning models for predicting the occurrence of MI in the ICU is scarce. By searching PubMed, we found only one article with a very small sample size. 22 The XGBoost algorithm has proven its performance, predictive capability and generalisability in many fields. 23 The 15 clinical variables screened by RFE and used for model development are conveniently available, which guarantees further external validation of generalisability in the future. This model had the best performance in terms of MDC compared with the other models. The MDC showed that the XGBoost model provided the best net benefit in the validation set for guiding clinical intervention when the threshold probability was 15% to 90% (Figure 3(b)). Both multiple ROC and MDC indicate the reliability of the XGBoost model compared with the others in terms of clinical feasibility.
In this study, all 15 features were clinically relevant to MI. Among them, maximal HR, maximal RR, age, minimal HR, maximal temperature and transfusion of plasma are six of the most important features in the MI prediction model, which could reflect the vascular health and potential ischaemic or hypoxic status of the coronary microcirculation in patients with MI (Figure 3(a) and (b)). Force plots and single-sample waterfall plots are depicted to demonstrate how the XGBoost model predicts for two individuals (Figure 4(a) and (c), id = 10; Figure 4(b) and (d), id = 1010), helping us understand its decision-making process.
The search for MI-related risk factors has been reported in many studies over the years. The mechanism of MI starts from an imbalance between oxygen delivery and oxygen consumption. 24 With the depletion of ATP and accumulation of lactate and protons, the cardiomyocytes become shortened and stiffened, resulting in the disability of removing calcium ions, which eventually leads to catastrophic calcium overload and oncotic cell death. 25 The cardiac ischaemia can be facilitated by tachycardia, arrhythmia, hypotension and application of inotropics. 26 Tachycardia increases myocardial oxygen demand and impairs diastolic filling time. 27 Dyspnoea and respiratory failure can be observed in patients with heart failure or cardiac dysfunction. 28 Older adults have decreased sensation of dyspnoea and diminished response to hypoxia, making them vulnerable during high-demand states such as heart failure. 29 Many additional causes of bradycardia exist, including hypoxaemia and acidosis; hypoxia causes sinus bradycardia by depolarising the membrane potential. 30 The management of elevated temperature is beneficial, particularly for patients with acute myocardial infarction. 31 Evidence suggests that inflammation and activation of coagulation are both potential causes of MI. 19 Andrie et al. 32 reported that interleukin-6 (IL-6) has a negative inotropic effect on the myocardium, and the level of procalcitonin is related to CAD. Sepsis-induced cardiac dysfunction is common, with an incidence of approximately 40%. 33 In patients with septic shock, adrenomedullin and endothelin-1 were found to be associated with MI and cardiac dysfunction, according to Lundberg et al. 34 The need for blood product transfusion is one of the burdens causing MI after non-cardiac surgery in high-risk surgical patients, 24 which potentially reflects underlying coagulation disorders and associated oxygen supply–demand imbalance, thereby suggesting a correlation with myocardial injury. Postoperative anaemia is highly associated with severe adverse events, particularly significant in patients with basic cardiovascular disease. 35 Arterial hypertension remains the most frequent cardiovascular risk factor. It is one of the major risk factors for heart failure, which is characterised by chronic, low-grade inflammation, promoting adverse cardiac remodelling.36,37 Intraoperative hypotension is associated with MI. 27 Research shows that intraoperative and postoperative hypotension (mean arterial pressure ≤65 mmHg) within 48 hours increases ICU patients’ risk of cardiovascular adverse events. 38 Although the effect of hypothermia on MI is ambiguous, there are reasons to believe mild hypothermia might provoke cardiovascular complications. 39 Smoking may be the dominant risk factor in the development of myocardial infarction and severe myocardial damage after reperfusion. 40 Long-term smoking, lengthy operations with blood loss, changes in circulatory dynamics, inflammation, and pain after surgery are all deemed important risk factors of post-operative MI. 41 Alcohol consumption has been associated with both beneficial and harmful effects according to research, 42 which is ambiguous and difficult to finalise.
This study has some limitations. First, this was a single-centre, retrospective, cohort study, which limited our ability to deduce the causality and generalisability of our predictive model. Nevertheless, we reduced the proportion of missing values in the variables to 5% to improve the accuracy of the predictive model. Additionally, considering the availability and feasibility of the features used to build the model, we believe that it can be used for external validation in the future. Second, due to the rigorous filtering criteria for the proportion of missing values, we discarded a large number of clinical variables that may have potential benefits in the development of predictive models. However, we believe that this is a necessary trade-off for the accuracy of predictive models. Future models may incorporate more variables as data volume increases. Third, most features left for further analysis between the groups had statistically significant differences, which may have led to overfitting and non-generalisability. To address this problem, we used cross-validation to assess the stability and generalisability of the predictive models. Fourth, events such as cardiac arrest, reintubation and reoperation which may be effective both in terms of their relationship with MI and the predictive power of the model were not enrolled. Fifth, we fully acknowledge the importance of real-world implementation challenges such as workflow integration, real-time processing latency and clinician adaptation which are indeed critical for translational success. These aspects will be prioritised in our forthcoming implementation study, where we plan to collaborate with clinical end-users to co-design workflow-compatible solutions. Finally, the data collected and analysed in this study focused on patients admitted to the ICU for the first time and lacked inner chronology, as continuous variables were all extreme values. Therefore, we will further explore temporal relationships in the data and conduct prospective studies to demonstrate the generalisability of our findings.
Conclusion
This study developed and validated five machine-learning models to predict the occurrence of MI in the ICU. Among them, the XGBoost-based model had the best predictive performance for identifying patients with MI, which could be helpful as a tool for clinical decision-making and detecting MI in the ICU. By standardising the monitoring of cardiac injury biomarkers and using this predictive model, more subtle MI could be identified, improving clinicians’ decision-making and contributing to improved healthcare outcomes in the ICU.
Supplemental Material
sj-docx-1-sci-10.1177_00368504251370452 - Supplemental material for Interpretable machine learning model for predicting myocardial injury in intensive care unit patients using SHapley Additive exPlanations analysis
Supplemental material, sj-docx-1-sci-10.1177_00368504251370452 for Interpretable machine learning model for predicting myocardial injury in intensive care unit patients using SHapley Additive exPlanations analysis by Xiaojiang Liu, Guanyang Chen, Chenxiao Hao, Youzhong An and Huiying Zhao in Science Progress
Footnotes
Acknowledgements
Ethical approval
This retrospective study was approved by the Institutional Medical Ethics Committee of Peking University People's Hospital (2023PHB189-001). All procedures adhered to the ethical standards of the Declaration of Helsinki.
Informed consent
The requirement for informed consent was waived by the Institutional Medical Ethics Committee.
Authors’ contributions
Concept and design, acquisition, analysis or interpretation of data were done by Xiaojiang Liu.
Drafting of the manuscript was done by Xiaojiang Liu and Guanyang Chen.
Critical review of the manuscript for important intellectual content and supervision were done by Huiying Zhao and Youzhong An.
Statistical analysis was done by Xiaojiang Liu, Guanyang Chen and Chenxiao Hao.
Obtained funding, administrative, technical or material support were done by Huiying Zhao.
Funding
The authors disclosed receipt of the following financial support for the research, authorship and/or publication of this article: This work was supported by the Clinical Medicine Plus X – Young Scholars Project, Peking University, the Fundamental Research Funds for the Central Universities, Wu Jieping Medical Foundation Runze Fund for Critical Care Medicine, the National Natural Science Foundation of China, Beijing Natural Science Foundation (grant numbers PKU2022LCXQ031, NO320.6750.2022-2-34, 82202366, L244067).
Declaration of conflicting interests
The authors declared no potential conflicts of interest with respect to the research, authorship and/or publication of this article.
Data sharing statement
The datasets generated from Peking University People's Hospital are not publicly available because of no prior agreement with the ethical committee but are available from the corresponding author upon reasonable request. The code used for statistical analysis was provided by liuxiaojiang1920/Myocardial-injury-prediction-in-ICU (github.com).
Supplemental material
Supplemental material for this article is available online.
References
Supplementary Material
Please find the following supplemental material available below.
For Open Access articles published under a Creative Commons License, all supplemental material carries the same license as the article it is associated with.
For non-Open Access articles published, all supplemental material carries a non-exclusive license, and permission requests for re-use of supplemental material or any part of supplemental material shall be sent directly to the copyright owner as specified in the copyright notice associated with the article.