
Abstract
Microwave de-icing technology demonstrates significant application potential for anti-icing and de-icing various infrastructures due to its environmentally friendly, non-contact, and straightforward operation. However, further research and optimization are required under different microwave conditions, antenna types, and complex engineering surface structures. This paper employs numerical simulation methods to investigate the temperature rise behavior of coating surfaces under varying microwave power and irradiation times, validated through physical experiments. The results indicate that at an irradiation distance of 5 cm, the critical microwave incidence angle is approximately 20°, with minimal impact on the heating effect of the coating. Increasing the microwave frequency accelerates the heating rate but reduces uniformity, with 5.8 GHz causing uneven heating and 0.915 GHz providing more uniform heating. A frequency of 2.45 GHz is recommended to achieve a balance between heating rate and uniformity. Additionally, as the irradiation distance increases, heating efficiency decreases. Horn antennas demonstrate advantages over standard rectangular waveguide antennas by reducing energy loss over long distances, covering a larger area, and improving heating uniformity. Curved surface coatings demonstrate superior heating characteristics, offering valuable insights for de-icing structures with complex shapes.
Keywords
Introduction
In cold regions, the accumulation of ice and snow poses significant challenges in key sectors such as aerospace, wind power, and road traffic.1–4 Traditional de-icing methods primarily include mechanical scraping, chemical de-icing, and thermal heating. However, these methods have several drawbacks: mechanical scraping can damage structural surfaces, and chemical de-icing not only corrodes structures5–7 but also causes environmental pollution.8–10 Traditional heating methods, such as electric heating and hot air, face issues of excessive energy consumption. 11 To overcome the disadvantages of traditional de-icing methods, technologies such as ultrasound and microwave have been applied in the field of de-icing. 12 Among these, microwave de-icing technology has gradually attracted researchers’ attention due to its non-contact nature, environmental friendliness, and low energy consumption. This technology utilizes the thermal effect of microwaves to heat engineering structures, leading to the failure of the bond between the ice and the structure, thereby achieving ice detachment.13,14
Although microwave de-icing shows significant application prospects, its efficiency has always constrained its engineering application. 15 Both domestic and international scholars have extensively studied the effects of microwave frequency, irradiation distance, and antenna type on microwave de-icing efficiency. Increasing the microwave frequency can significantly enhance de-icing efficiency. For instance, Tang et al. discovered that 5.8 GHz microwaves can improve de-icing efficiency by 4–6 times compared to 2.45 GHz microwaves. 16 This improvement is due to higher frequencies concentrating energy on the surface layer of the structure, resulting in greater thermal efficiency. However, considering factors such as cost, complexity, and size of the microwave source,13,17 current applications mainly use 2.45 and 5.8 GHz frequencies.
Both irradiation distance and antenna type influence the heating range and temperature rise rate. 18 Lu et al. 19 found that when the radiation port height was 55 mm, the average microwave heating power and temperature rise rate of the concrete surface reached their maximum. Wang et al. 20 confirmed that a 55 mm irradiation distance could enhance the temperature rise rate by approximately 10–30% compared to 45 mm. Additionally, Wei et al. 21 found that the size of the de-icing area is primarily determined by the horn antenna's aperture width; a larger aperture width results in a larger de-icing area but a lower temperature rise rate. Yang et al. 22 designed slant horns with different tilt angles and conducted comparative heating experiments, finding that the 15° slant horn achieved an average heating temperature 20% higher than other antennas.
While optimizing irradiation distance and antenna design can improve heating range and rate, thus enhancing de-icing efficiency, these measures are less effective for structures with weak microwave absorption capabilities. Consequently, to enhance microwave absorption, scholars have investigated various microwave-absorbing materials, 23 including magnetite,24–28 graphite,14,29,30 steel slag,31,32 and carbon fibers,33–37 as well as the optimization of composites. 38 These efforts, particularly the incorporation of additives, are mainly applied to road paving materials such as asphalt concrete,39,40 leading to an overall temperature increase on both the surface and within the structure. While the rise in internal temperature results in energy waste. Additionally, the incorporation of steel slag can adversely affect structural integrity due to its poor volumetric stability, primarily caused by the hydration of residual free CaO and MgO, which induces expansion and compromises the durability of asphalt mixtures through mechanisms such as membrane rupture and increased moisture susceptibility.41,42 In this context, applying microwave-absorbing materials to the surface of the structure to form an absorption layer 43 has opened a new research direction in the field of microwave de-icing.
Microwave-absorbing coatings have been extensively studied in the field of stealth technology.44,45 However, research on their application in microwave de-icing is still in its infancy.46–48 Notably, most existing studies focus on bulk materials such as asphalt or concrete substrates, rather than on engineered microwave-absorbing surface layers designed for practical de-icing performance. As such, there is a lack of targeted and systematic analysis of how key microwave irradiation parameters affect the heating behavior of these specialized coatings. To address this gap, this study utilizes numerical simulation methods to examine the temperature evolution of coating surfaces under varying microwave power levels and exposure times. The numerical results are corroborated through experimental validation. Expanding on this foundation, numerical simulations are employed to investigate the influence of several parameters on coating heating efficiency, including microwave incidence angle, irradiation distance, microwave frequency, antenna configuration, and coating geometry. This comprehensive analysis aims to elucidate the heating characteristics of microwave-absorbing coatings. The findings from this research are intended to contribute to the theoretical underpinnings necessary for the optimization and practical implementation of microwave de-icing technology.
Methodology
Fundamental equations
(1) Electromagnetics
The propagation of electromagnetic waves within air and microwave-sensitive coatings is governed by the vector Helmholtz equation for the electric field, derived from Maxwell's equations for a source-free, linear, isotropic, and homogeneous medium:

Where:
(2) Heat transfer in solids
The microwave energy is converted into heat energy based on the electromagnetic field distribution. In transient temperature field calculations, the microwave power loss density acts as the heat source term in the heat transfer equation. The heat transfer governing equation of microwave sensitive coatings is:

Where:
The coating surface exchanges heat with the surrounding air through convection:

Where: q is the heat flux density (
Numerical model
The microwave-sensitive coating heating model consists of the coating, a WR430 standard rectangular waveguide antenna, and an air domain. To ensure that the coating can receive the majority of the microwave energy, its dimensions are set to 150 mm × 150 mm × 3 mm. For the transmission of 2.45 GHz electromagnetic waves, the standard rectangular waveguide WR430, 49 with a cross-sectional size of 109.22 mm × 54.61 mm and a length of 100 mm, is employed in this study. The model is constructed based on the dimensions of the experimental waveguide. To ensure that the microwave energy received by the coating is not affected by reflections from the boundaries, the air domain is configured as a cube with an edge length of 300 mm, with its outer surfaces set to scattering boundary conditions. The dimensions of the coating are 150 mm × 150 mm ×3 mm, the WR430 standard rectangular waveguide antenna measures 109.22 mm × 54.61 mm × 100 mm, and the air domain is 300 mm × 300 mm × 300 mm. In the model, the coating is placed within the air domain, with the center of the coating specimen aligned with the central axis of the waveguide. The geometric distribution and numerical mesh model of the coating, waveguide antenna, and air are illustrated in Figure 1.

Geometric model and mesh model of microwave sensitive coating, air and standard rectangular waveguide antenna.
To facilitate numerical analysis, the following assumptions are made in the model:
The microwave-sensitive coating is considered an isotropic and homogeneous medium, with the microwave absorbers uniformly dispersed in the epoxy resin matrix; Air is modeled as an ideal medium with a relative permittivity and permeability of 1; The dielectric properties, specific heat capacity, and thermal conductivity of the coating are assumed to be temperature-independent; Thermal stresses within the coating are neglected during the simulation.
While these assumptions facilitate computational tractability and provide valuable insights into the microwave heating characteristics, they also introduce certain limitations to the generalizability of the results. The assumption of material isotropy and homogeneity neglects potential inhomogeneities and anisotropic behaviors in the actual microstructure, particularly at high filler loadings where local clustering of absorbers may occur. Furthermore, the use of temperature-independent thermal and dielectric properties does not capture the real material behavior under elevated temperatures, where changes in conductivity or permittivity could alter the microwave absorption characteristics. These simplifications, while reasonable for a first-order analysis, should be addressed in future work to improve the physical fidelity and predictive power of the model under complex engineering conditions.
The microwave-sensitive coating is composed of carbon black as the absorber, with a ratio of absorber to binder of 0.2:1. The electromagnetic parameters (relative permittivity, relative permeability), thermal parameters (specific heat capacity, thermal conductivity), and basic parameters (density) of the coating are listed in Table 1. The specific heat capacity, thermal conductivity, and density were all measured experimentally, while the electromagnetic parameters were based on references50,51 and further calibrated through experimental results. The initial temperature of the model was set to 10 °C.
Calculation parameters of microwave sensitive coating.
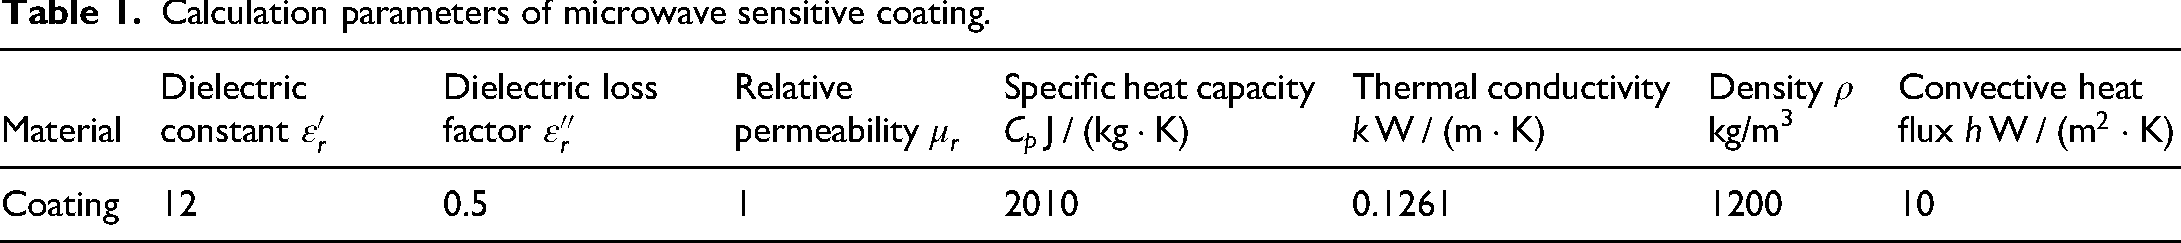
The parameters in Table 1 critically govern microwave heating. The dielectric constant (
The air boundary is defined by a Scattering Boundary Condition to simulate wave transmission without reflection, effectively approximating an open boundary where the air domain extends to infinity. This condition prevents artificial reflections from the computational domain edges, which would otherwise interfere with the wave field and distort the simulation results. By absorbing outgoing waves, it ensures that the modeled electromagnetic field distribution closely represents the physical behavior of wave propagation in free space, thereby improving the accuracy and stability of the numerical solution. This can be represented by Equation (4):
Where:
Numerical simulation parameter calibration and result validation
Before applying numerical simulation methods to analyze the impact of microwave radiation conditions and coating forms on coating temperature rise, an analysis was conducted on the relationship between microwave power, radiation time, radiation distance, and coating temperature rise in physical experiments. By comparing the results of physical experiments with preliminary numerical simulation results, precise calibration of simulation parameters was performed, as shown in Table 1. This process not only aligned numerical simulation with physical experimental results but also enhanced the reliability of numerical simulation analysis.
After calibrating the numerical simulation parameters, this section investigates temperature field distribution and heating rate under six different microwave power and radiation time coupling conditions (1 kW × 30 s, 1 kW × 60 s, 1 kW × 90 s, 1 kW × 120 s, 2 kW × 30 s, 2 kW × 60 s) through numerical simulation and experimental validation. The microwave frequency is set at 2.45 GHz, with an irradiation distance of 5 cm, a rectangular waveguide antenna, and the planar coating measuring 150 mm × 150 mm × 3 mm.
As shown in Figure 2, the temperature field of the coating exhibits elliptical patterns with coincident principal axes under all six operating conditions in the physical experiments. The highest temperature consistently appears at the central region (indicated by the white area), with a gradual and nearly uniform decline in temperature extending outward toward the periphery. The temperature rise at the edges of the coating is negligible. Notably, the major axis of the observed elliptical distribution aligns with the direction parallel to the narrow side of the rectangular waveguide cross-section.

Temperature distribution on carbon black coating surface with various microwave power and heating time. 52 (a) 1 kW × 30 s; (b) 1 kW × 60 s; (c) 1 kW × 90 s; (d) 1 kW × 120 s; (e) 2 kW × 30 s; (f) 2 kW × 60 s.
Figure 3 demonstrates a high degree of agreement between the temperature field distribution characteristics obtained from the numerical simulation and those observed experimentally. Although the experimental results do not display a perfectly regular elliptical pattern, as seen in the simulation, due to unavoidable practical factors such as slight misalignments between the waveguide and the sample surface or variations in coating uniformity, the core spatial characteristics and peak temperature trends are sufficiently consistent. This supports the reliability of the simulation results in capturing the essential behavior of the microwave-induced heating process.

Temperature distribution on coating surface with various microwave power and heating time. (a) 1 kW × 30 s; (b) 1 kW × 60 s; (c) 1 kW × 90 s; (d) 1 kW × 120 s; (e) 2 kW × 30 s; (f) 2 kW × 60 s.
As the microwave power and irradiation time increase, both the physical experiments and numerical simulations show a clear upward trend in the maximum temperature of the coating. A comparison of the results under the six different microwave conditions (Table 2) reveals a satisfactory level of consistency in the maximum temperature rise obtained by both approaches. The maximum deviation observed was 23.85%, while the minimum was only 1.26%. These findings indicate that, despite some inherent experimental uncertainties, the numerical simulations effectively replicate the key thermal response characteristics, thereby providing strong preliminary validation of the modeling approach.
Comparison of temperature rise in coating samples under diverse microwave power and time settings: simulation versus experiment.

It is important to highlight that the numerical simulation results consistently exceed the physical experimental data. This variance can primarily be attributed to the temporal delay in the experimental process, specifically, a gap of approximately 10 s between the cessation of microwave irradiation and the actual temperature measurement. Due to safety considerations, the experiments were conducted using an open-ended microwave system in which personnel were required to wait outside the microwave shielding enclosure during irradiation. As a result, temperature measurements could only be taken after the irradiation had ended and the shielding had been removed. This unavoidable delay leads to a natural cooling of the coating surface, thus contributing to the systematically lower experimental temperature readings compared to the simulation results.
Nevertheless, it is worth emphasizing that despite this discrepancy in absolute temperature values, the simulations accurately reproduce the overall thermal behavior observed in experiments, including the spatial temperature distribution and the trend of maximum temperature increase with rising input power. Therefore, the observed deviation does not undermine the validity of the simulation results. In fact, the actual surface temperature at the moment irradiation ends, which the simulations reflect, is theoretically higher than the experimentally recorded temperature. This suggests that the numerical and experimental results may be more closely aligned than the measured values imply.
Results and discussion
To comprehensively analyze the response patterns of coating temperature rise under different conditions, this section will investigate how the microwave incidence angle, microwave irradiation distance, microwave frequency, antenna type, and coating surface morphology influence the temperature field distribution and the rate of temperature increase.
Microwave incidence angle
In microwave de-icing applications, microwave radiation typically does not strike the target surface perpendicularly. Instead, it often impinges at an oblique angle, denoted as the incidence angle
Theoretical analysis
The theoretical model for oblique incidence of microwaves from an air medium onto a microwave-sensitive coating medium is illustrated in Figure 4. In this model,

Microwave oblique incidence schematic diagram.
According to the tangential field boundary conditions, the tangential components (x-direction) of the electric and magnetic fields are continuous across the interface. Consequently, the tangential propagation speeds of the incident, reflected, and transmitted waves are equal, that is
This implies:
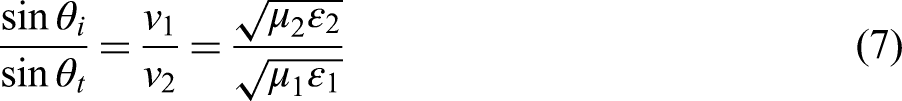
Given that both air and carbon black coating are non-magnetic, with 
This is Snell's law from optics.
For parallel-polarized waves, the boundary conditions are given by:

Solving simultaneously yields:

The reflection coefficient for parallel-polarized waves is:
And the transmission coefficient is:

Where
Similarly, for perpendicular-polarized waves, the reflection and transmission coefficients are:


From the above analysis, it is evident that the reflection coefficient at the coating interface is related to the incidence angle. When
Equations (15) and (18) indicate that when the transmission angle 
When microwaves obliquely impinge upon a microwave-sensitive coating in air, using a carbon black coating sample as an example with
From equation (15), for parallel-polarized waves, 
Combining this with equation (10) yields:
Here,
From the above analysis, it is evident that the incidence angle affects the entry of microwave energy into the coating, impacting the microwave loss and heating of the coating when microwaves impinge obliquely.
Numerical results
This section undertakes an analysis of the temperature field distribution and heating rate under five distinct angles of microwave incidence: 5°, 10°, 20°, 30°, and 40°. The analytical model employed is illustrated in Figure 5. Throughout the analysis, the microwave power is maintained at 1 kW, the irradiation duration is set to 60 s, the distance from the microwave source is fixed at 5 cm, the microwave frequency is 2.45 GHz. A rectangular waveguide antenna is used, and the planar coating dimensions are 150 mm × 150 mm × 3 mm.

Numerical model.
As the angle of microwave incidence increases, the distribution of the heating region on the coating surface evolves from ellipses into a “D-shaped” configuration, as illustrated in Figure 6. The major axes of the ellipses and the longer sides of the “D-shape” align along the direction perpendicular to the short edge of the antenna port (vertical direction), whereas the minor axes of the ellipses and the shorter sides of the “D-shape” orient themselves parallel to the long edge of the antenna port (horizontal direction). Specifically, when the incidence angle is at 5° and 10°, the area of maximum temperature displays a relatively stable distribution with minimal displacement. However, as the incidence angle increases to 20°, the region of maximum temperature exhibits a slight shift towards the side closer to the antenna. This trend becomes more pronounced at incidence angles of 30° and 40°, where the zone of maximum temperature markedly shifts in the direction towards the side adjacent to the antenna.
Temperature distribution on coating surface at various irradiation incidence angles. (a) Incidence angle = 5°; (b) Incidence angle = 10°; (c) Incidence angle = 20°; (d) Incidence angle = 30°; (e) Incidence angle = 40°.
The effect of incidence angle on the maximum temperature rise of the coating surface can be divided into two stages, as illustrated in Figure 7. Within the incidence angle range of 0–30°, the maximum temperature rise on the coating surface fluctuates within the range of 31.6 ± 0.2°C. This indicates that within this range, the incidence angle has minimal impact on the maximum temperature rise. However, when the incidence angle reaches 40°, the maximum temperature rise on the coating surface increases significantly to 43.7°C, markedly higher than the previous range. This change is primarily due to the constant position of the central point of the coating surface, while the distance between one side of the coating and the antenna decreases with increasing incidence angle, leading to an increased power density in that area.

Variation of maximum temperature rise of coating surface with incidence angle.
Regarding the shift in the position of the maximum temperature rise on the coating surface, it progressively moves horizontally towards the edge of the coating with increasing incidence angle, as shown in Figure 8. When the incidence angle increases from 0° to 20°, the displacement of the maximum temperature rise is relatively small, not exceeding 3 mm. However, as the incidence angle increases from 20° to 40°, the displacement becomes significant, reaching 25.11 mm at 40°.

Temperature rise distribution on coating surface in the X-direction.
There exists an equivalent normal distance in the case of oblique microwave incidence. When the incidence angle is 0°, the equivalent normal distance is the same as the irradiation distance. As the incidence angle increases, the equivalent normal distance decreases and shifts within the incidence plane towards the edge of the coating along the antenna's longer side. This results in an increased maximum temperature rise and a displacement of its position. For instance, at an irradiation distance of 5 cm, this critical angle is approximately 20°. Consequently, within a certain range of incidence angles, the de-icing efficiency of the coating remains largely unaffected.
Microwave irradiation distance
This section explores the analysis of the temperature field distribution and heating rate of the coating under five distinct irradiation distances: 3, 5, 7, 10, and 15 cm. The microwave power is maintained at 1 kW, the irradiation duration is set to 60 s, the incidence angle is at 0°, the microwave frequency is fixed at 2.45 GHz, the antenna is rectangular waveguide, and the coating is a flat plate measuring 150 mm × 150 mm × 3 mm.
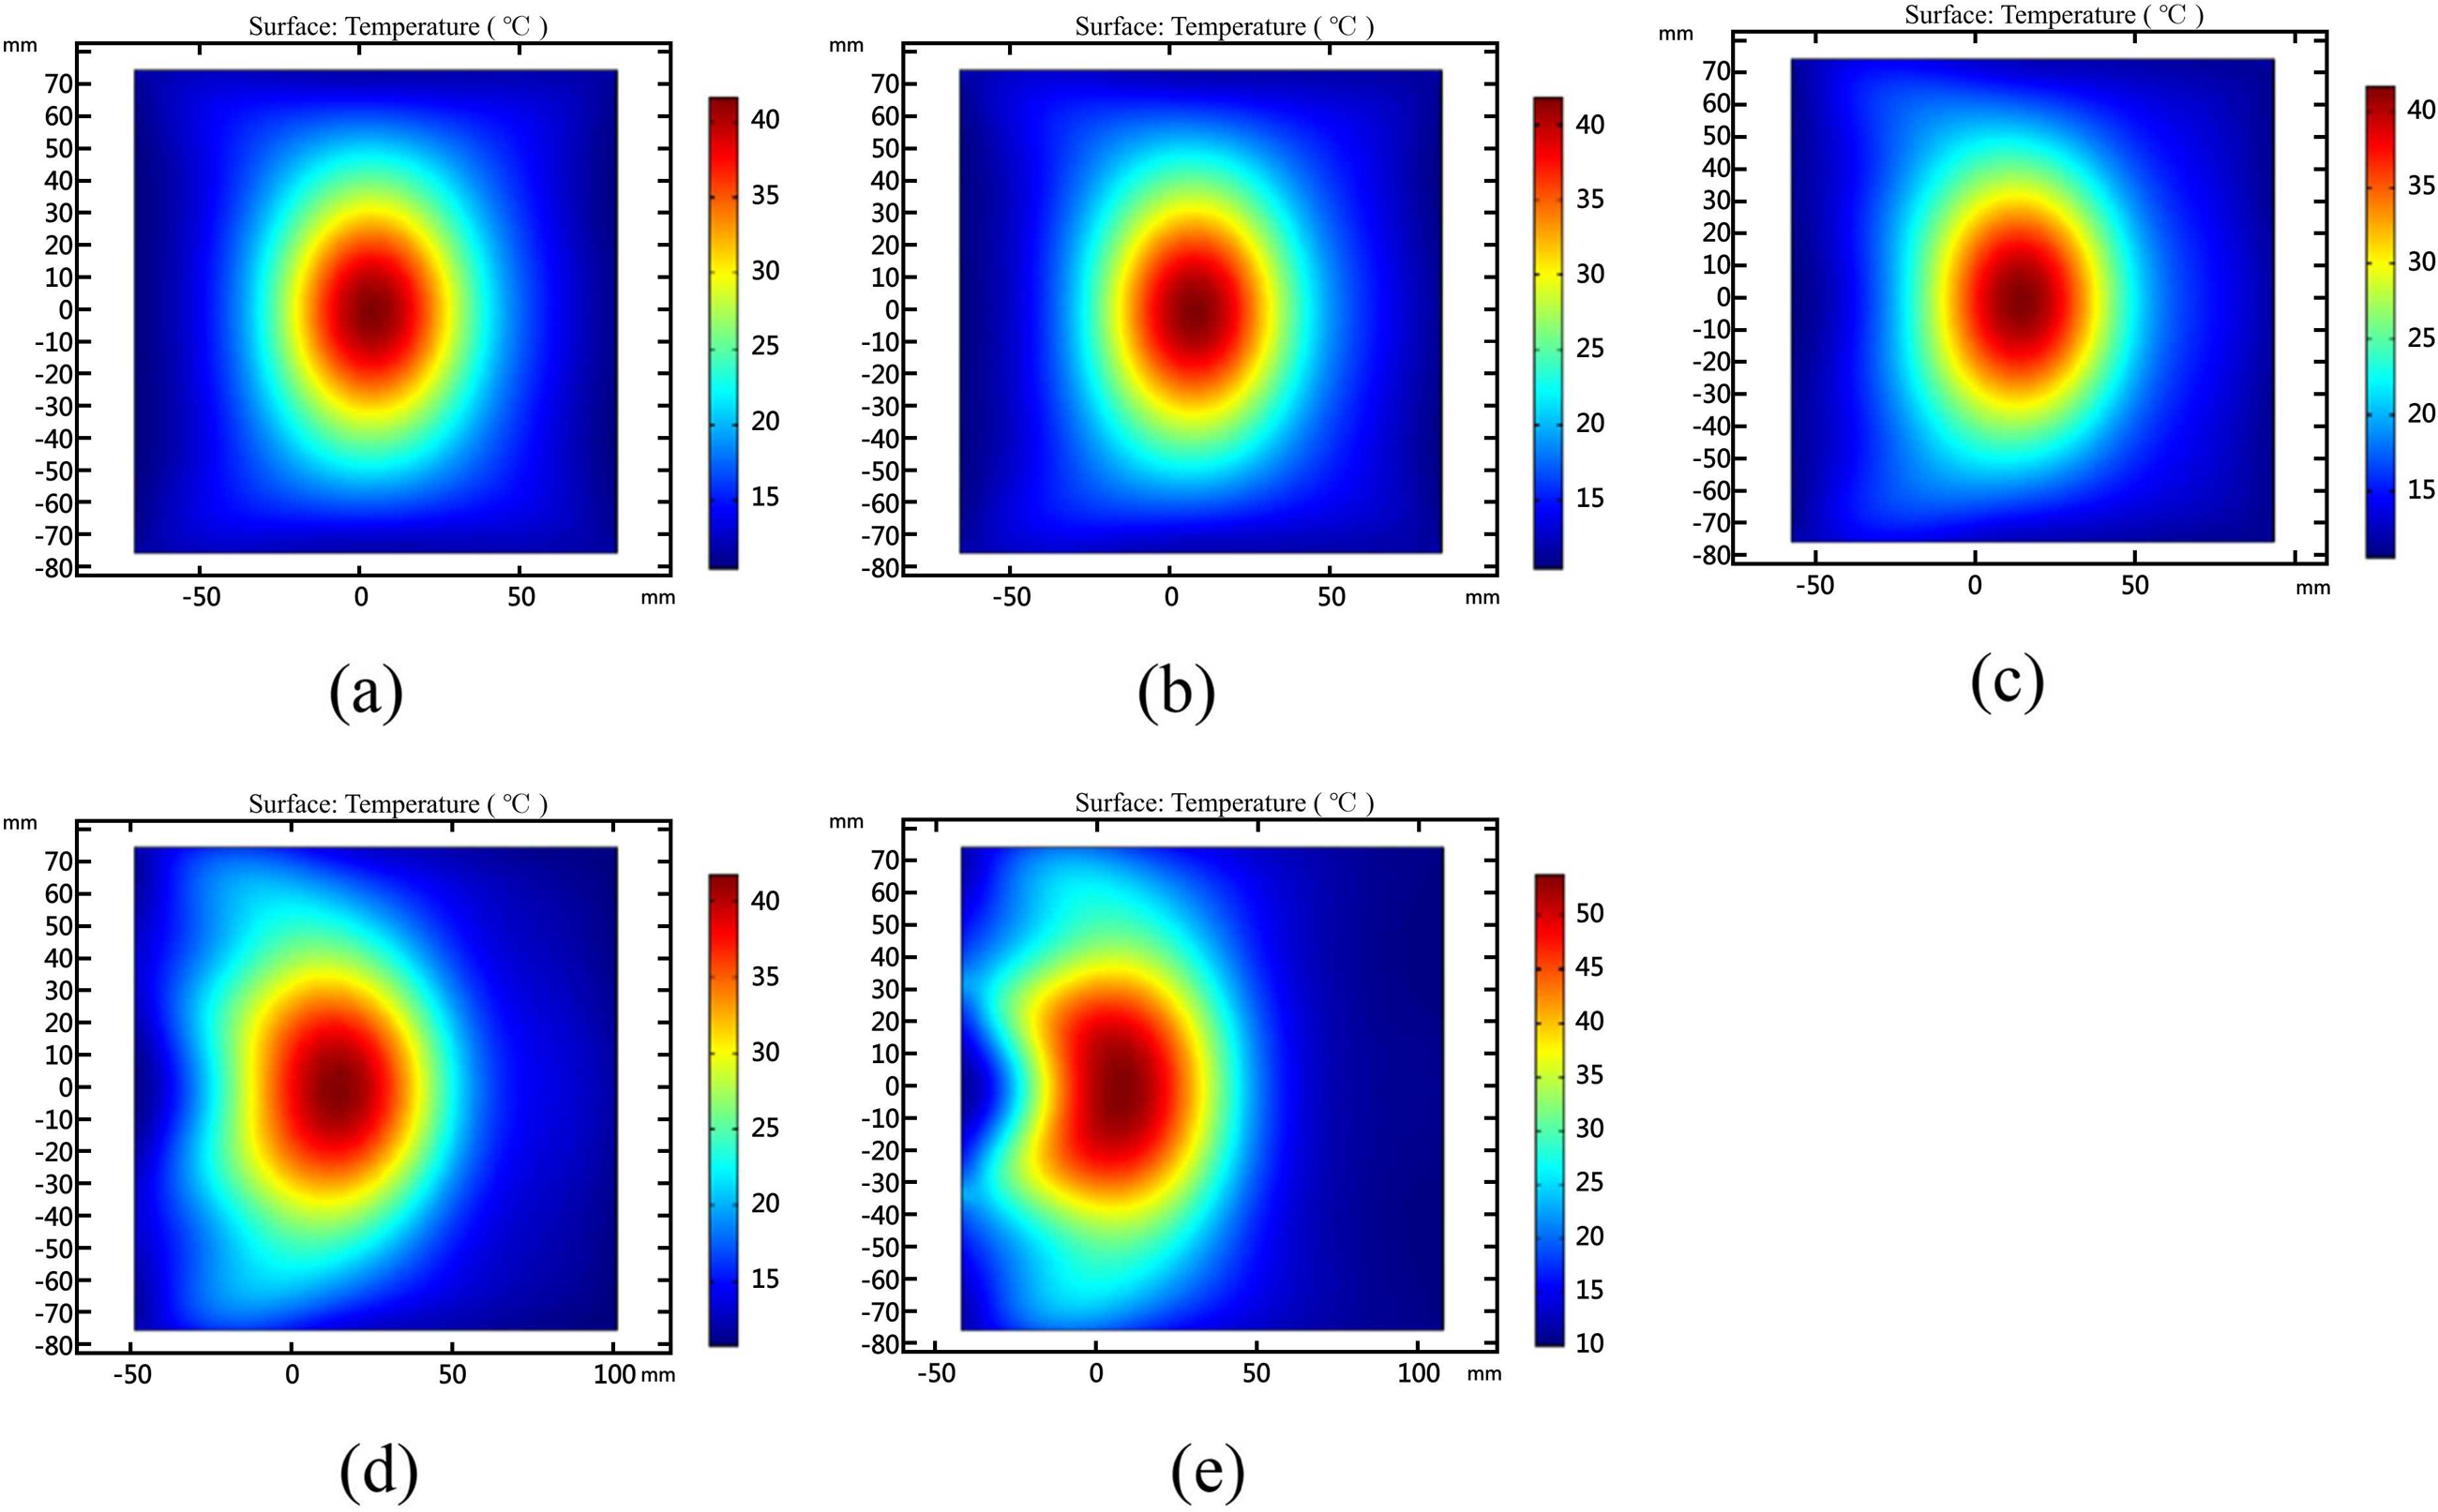
At a short irradiation distance (3 cm), the temperature field on the coating surface displays a concentric circular pattern, as illustrated in Figure 9. As the irradiation distance increases, the temperature field shape on the coating surface transitions from circular to elliptical, and eventually to rectangular. Concurrently, the area of the heated zone on the coating surface expands. The major axis of the ellipse and the longer side of the rectangle align with the direction perpendicular to the antenna's short edge (the vertical direction), whereas the minor axis of the ellipse and the shorter side of the rectangle are oriented parallel to the antenna's long edge (the horizontal direction). Across different irradiation distances, the region of maximum temperature on the coating surface consistently remains at the center, with the temperature gradually decreasing from the center outward.

Temperature distribution on coating surface at various irradiation distances. (a) Irradiation distance = 3 cm; (b) Irradiation distance = 5 cm; (c) Irradiation distance = 7 cm; (d) Irradiation distance = 10 cm; (e) Irradiation distance = 15cm.
Specific data indicate that when the irradiation distance is 3 cm, the maximum temperature rise on the coating surface reaches 54.6 °C. However, as the irradiation distance increases, the maximum temperature rise on the coating surface decreases rapidly, dropping to 7.4 °C at 15 cm, as shown in Figure 10.
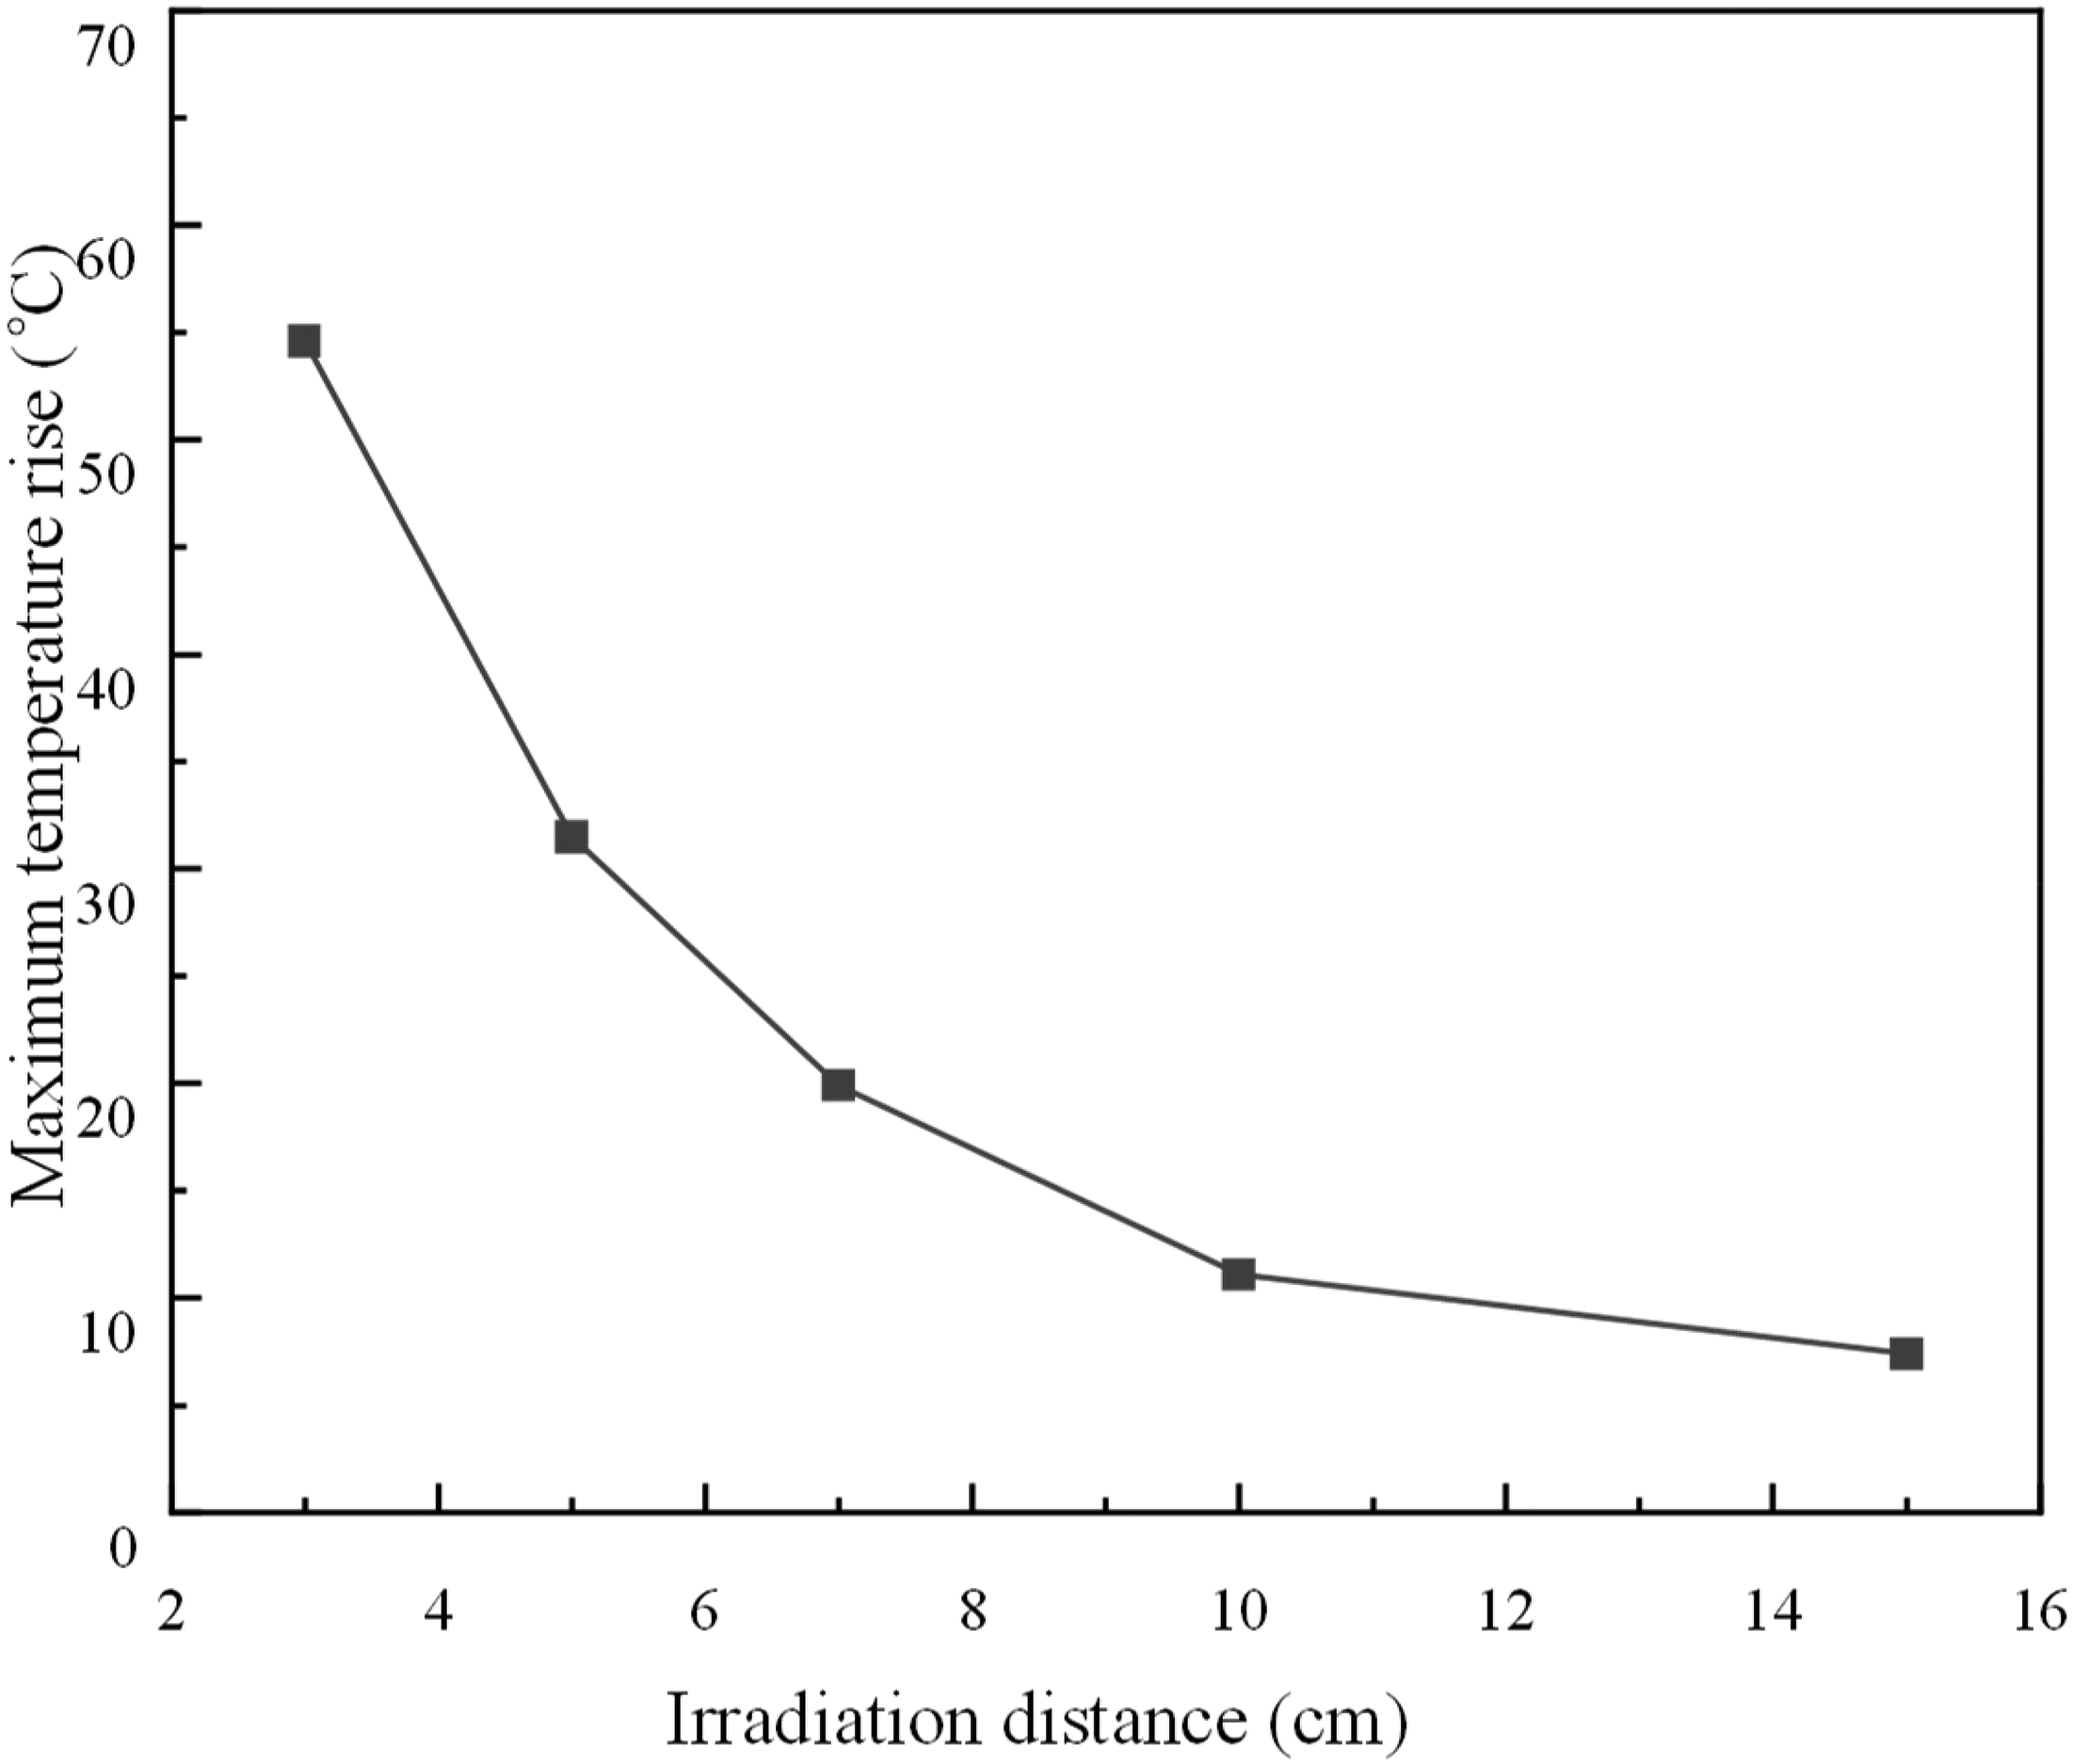
Numerical simulation results of coating samples at various irradiation distances.
The characteristics of heating non-uniformity on the coating surface show that the closer the irradiation distance, the more pronounced the heating non-uniformity becomes due to the proximity between the coating and the antenna. As the irradiation distance increases, the scattering effect of the microwaves improves the vertical heating uniformity on the coating surface, but horizontal non-uniformity remains significant. Additionally, the adhesion strength between the microwave-sensitive coating and the ice layer is most significantly weakened in the vertical direction. Therefore, when an external force is applied vertically, the required force to remove the ice layer is minimized, resulting in the highest de-icing efficiency.
The observed reduction in maximum temperature rise with increasing irradiation distance can be primarily attributed to the attenuation of microwave energy density in free space. As microwaves propagate from the rectangular waveguide antenna into the surrounding environment, the energy disperses spatially due to the divergence of the wavefront. This spatial spreading leads to a decrease in energy density per unit area with increasing distance from the source. In other words, although the total radiated power remains constant, the energy becomes distributed over a larger surface area, thereby reducing the effective heating intensity at the coating surface.
Furthermore, the radiated field pattern from a rectangular waveguide antenna exhibits directionality governed by the antenna's geometry and the operating mode (
Therefore, while the reduction in heating efficiency is fundamentally caused by the increase in irradiation distance, the underlying mechanisms involve a complex interplay of electromagnetic propagation, antenna radiation characteristics, and spatial energy distribution, all of which affect the thermal response of the coating.
Microwave frequency
With increasing microwave frequencies, the rotational frequency of polar molecules rises, leading to more vigorous molecular motion. This intensified activity enhances energy conversion efficiency, accelerating the heating rate. Moreover, there is an inverse relationship between microwave frequency and the penetration depth in the medium: higher frequencies result in shallower penetration. This concentration of microwave energy on the surface layer of the medium enhances heating efficiency and improves the heat utilization under icing conditions. In this section, different commonly used microwave frequencies (0.915, 2.45, and 5.8 GHz) will be employed to explore the heating response of the coating. Microwave irradiation was conducted at a constant power of 1 kW for a duration of 60 s, with an incidence angle of 0°, across a range of distances: 3, 5, 7, 10, and 15 cm. A rectangular waveguide antenna is used, and the coating dimensions are 150 mm ×150 mm × 3 mm.
For microwave heating simulations, microwave sources at 0.915, 2.45, and 5.8 GHz frequencies all use corresponding standard rectangular waveguide antennas, as shown in Figures 1, 11, and 12. The specific configurations are as follows: the 0.915 GHz frequency uses a WR975 waveguide antenna with a cross-sectional size of 247.65 mm ×123.82 mm; the 2.45 GHz frequency uses a WR430 waveguide antenna with a cross-sectional size of 109.22 mm × 54.61 mm; and the 5.8 GHz frequency uses a WR187 waveguide antenna with a cross-sectional size of 47.549 mm × 22.149 mm. Numerical simulation results indicate that although the physical aperture of the waveguide antenna at 0.915 GHz is geometrically large enough to cover the entire surface area of the coating, there is no significant rise in temperature observed near the coating edges. This suggests that the effective heating region remains concentrated in the central portion of the coating, primarily due to the lower energy density caused by the broader spatial distribution of microwave energy at this frequency. As a result, the current coating size of 150 mm × 150 mm × 3 mm is sufficient to encompass the relevant heating zone and is retained in the numerical model to enable consistent and meaningful comparisons across different conditions.

Numerical model at 0.915 GHz frequency.

Numerical model at 5.8 GHz frequency.
Under microwave irradiation at a frequency of 0.915 GHz, the temperature field on the coating surface exhibits multiple nested ellipses at different irradiation distances, as shown in Figure 13. The major axis of these ellipses aligns with the antenna port's long edge direction (horizontal), while the minor axis aligns with the antenna port's short edge direction (vertical). The heating area on the coating surface nearly covers the entire coating specimen. The maximum temperature is located at the center, with the temperature field gradually and uniformly decreasing from the center outward.

Temperature distribution on coating surface with 0.915 GHz radiation at various irradiation distances. (a) Irradiation distance = 3 cm; (b) Irradiation distance = 5 cm; (c) Irradiation distance = 7 cm; (d) Irradiation distance = 10 cm; (e) Irradiation distance = 15cm.
A detailed analysis of the temperature field on the coating surface under microwave irradiation at 2.45 GHz has been provided in section “Microwave irradiation distance” and will not be reiterated here.
Under microwave irradiation at a frequency of 5.8 GHz, the temperature field distribution shows significant variability with increasing irradiation distance, transitioning from a single heating area to an array-like distribution, as illustrated in Figure 14. When the irradiation distance is short, the high-temperature region on the coating surface is concentrated in the central area; as the distance increases, the high-temperature areas gradually form an array pattern, with the vertical length of each array domain being greater than its horizontal length.
Temperature distribution on coating surface with 5.8 GHz radiation at various irradiation distances. (a) Irradiation distance = 3 cm; (b) Irradiation distance = 5 cm; (c) Irradiation distance = 7 cm; (d) Irradiation distance = 10 cm; (e) Irradiation distance = 15cm.
This array-like distribution is primarily attributed to the shorter wavelength at 5.8 GHz and the resulting far-field radiation characteristics of the waveguide antenna. At this higher frequency, the waveguide aperture becomes electrically larger (i.e. several wavelengths across), and thus more likely to operate in the far field even at moderate distances. This leads to a pronounced radiation pattern with a central main lobe and clearly defined side lobes. The interference between these lobes produces spatially periodic regions of constructive and destructive field strength, manifesting on the coating surface as alternating zones of high and low temperature, hence the observed array-like distribution. In contrast, lower frequencies such as 2.45 and 0.915 GHz produce broader and less distinct radiation patterns due to their longer wavelengths and the relatively smaller electrical size of the antenna aperture.
Overall, with increasing irradiation distance, the maximum temperature rise on the coating surface exhibits a significant downward trend across all three microwave frequencies, as illustrated in Figure 15. At frequencies of 2.45 and 5.8 GHz, the attenuation patterns of the maximum temperature rise are similar; in contrast, the attenuation curve at 0.915 GHz is relatively more gradual.

Variation of maximum temperature rise on coating surface with irradiation distance at different microwave frequencies.
At different irradiation distances, the maximum temperature rises on the coating surface at 2.45 and 5.8 GHz are quite similar and significantly higher than those at 0.915 GHz. As the irradiation distance increases, the maximum temperature rises at 0.915 GHz gradually approach those at 2.45 and 5.8 GHz. When the irradiation distance is 3 cm, the maximum temperature rise at 0.915 GHz is 15.9% and 18.1% of that at 5.8 and 2.45 GHz, respectively. At an irradiation distance of 15 cm, the maximum temperature rise at 0.915 GHz is 21.6% and 29.7% of that at 5.8 and 2.45 GHz, respectively.
Although microwave heating at 0.915 GHz exhibits the best uniformity, the heating rate is insufficient to meet the demands for efficient de-icing. In this context, “uniformity” refers to the spatial distribution of surface temperature, where lower peak-to-mean ratios and fewer localized hotspots indicate better uniform heating performance. As shown in Figure 15, 0.915 GHz produces the smallest variation in surface temperature, while 5.8 GHz results in distinct array-like hot spots due to far-field radiation effects, leading to a highly non-uniform heating pattern.
Thus, the 0.915 GHz microwave frequency is not suitable for efficient coating de-icing applications. Compared to 0.915 and 2.45 GHz frequencies, the heating rate at 5.8 GHz is higher, but the uniformity is poor. Additionally, the increase in heating rate at 5.8 GHz is relatively small compared to that at 2.45 GHz. Therefore, among the three commonly used microwave frequencies, 2.45 GHz is the optimal frequency for de-icing microwave-sensitive coatings.
Horn antenna
Under the irradiation of a standard rectangular waveguide antenna, which is a fundamental aperture antenna, the relatively small geometric area results in weaker directivity and a smaller area of coating temperature rise. As the irradiation distance increases, the power density of the microwave radiation emitted by the rectangular waveguide antenna undergoes a significant reduction, thereby resulting in a diminished heating efficiency for the coating at greater distances. To enhance the microwave transmission efficiency of the antenna and improve the uniformity of the microwave power density distribution, this paper designs a method to increase the aperture area of the rectangular waveguide antenna and extend its walls outward to construct a horn antenna. The impact of the horn antenna on the coating heating characteristics is also studied in detail.
Theoretical analysis
A horn antenna consists of two primary components: the waveguide section, which functions as the feeder, and the horn section, responsible for radiating microwaves. In the design of a horn antenna, if the short-axis dimension of the rectangular waveguide is kept constant while the long-axis dimension is expanded, the resultant horn antenna is classified as an H-plane sectoral horn antenna. Conversely, if the long-axis dimension remains unchanged while the short-axis dimension is extended, the outcome is an E-plane sectoral horn antenna. Should both the long-axis and short-axis dimensions of the rectangular waveguide be enlarged, the result is a pyramidal horn antenna. The horn antenna designed for this study falls into the category of pyramidal horn antennas, as depicted in Figure 16.

Horn antenna.
Neglecting reflections from the waveguide and horn sections, when only the TE₁₀ mode is transmitted within the rectangular waveguide, the field structure in the horn section approximates that of the rectangular waveguide. However, due to the flared geometry of the pyramidal horn, rays emitted from different positions along the aperture experience unequal propagation distances from the phase center, resulting in a curved phase front across the aperture.
The field strength at the aperture of a pyramidal horn is given by:
Where:
The exponential term 
The maximum phase shift occurs at the apex of the aperture, given by:
Where:
Thus, for engineering purposes, the maximum allowable phase difference in the E-plane is:

And for the H-plane, the maximum allowable phase difference is:

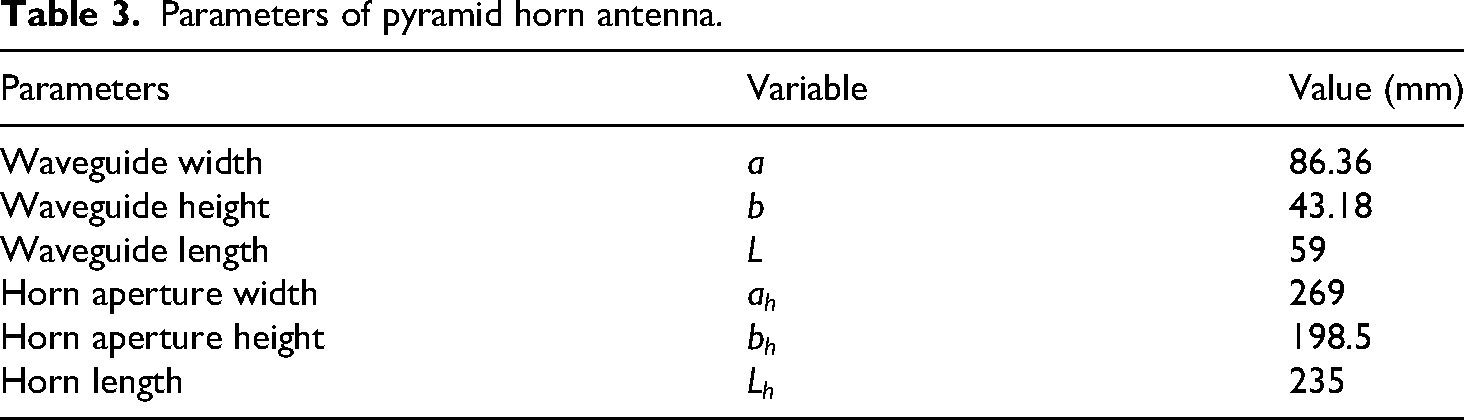
Based on the above analysis, the parameters for the pyramidal horn antenna are summarized in Table 3.
Parameters of pyramid horn antenna.
Numerical results
In this section, the temperature rise response of the coating under a pyramidal horn antenna will be explored, as illustrated in Figure 17. The microwave power is set at 1 kW, with an irradiation duration of 60 s. The incidence angle for the microwave radiation is 0°. The irradiation distances are varied at 3, 5, 7, 10, and 15 cm. The operating frequency of the microwaves is 2.45 GHz, and the coating is a flat plate measuring 400 mm × 400 mm × 3 mm, which is selected to match the larger aperture size and broader energy distribution of the pyramidal horn antenna used in this section.
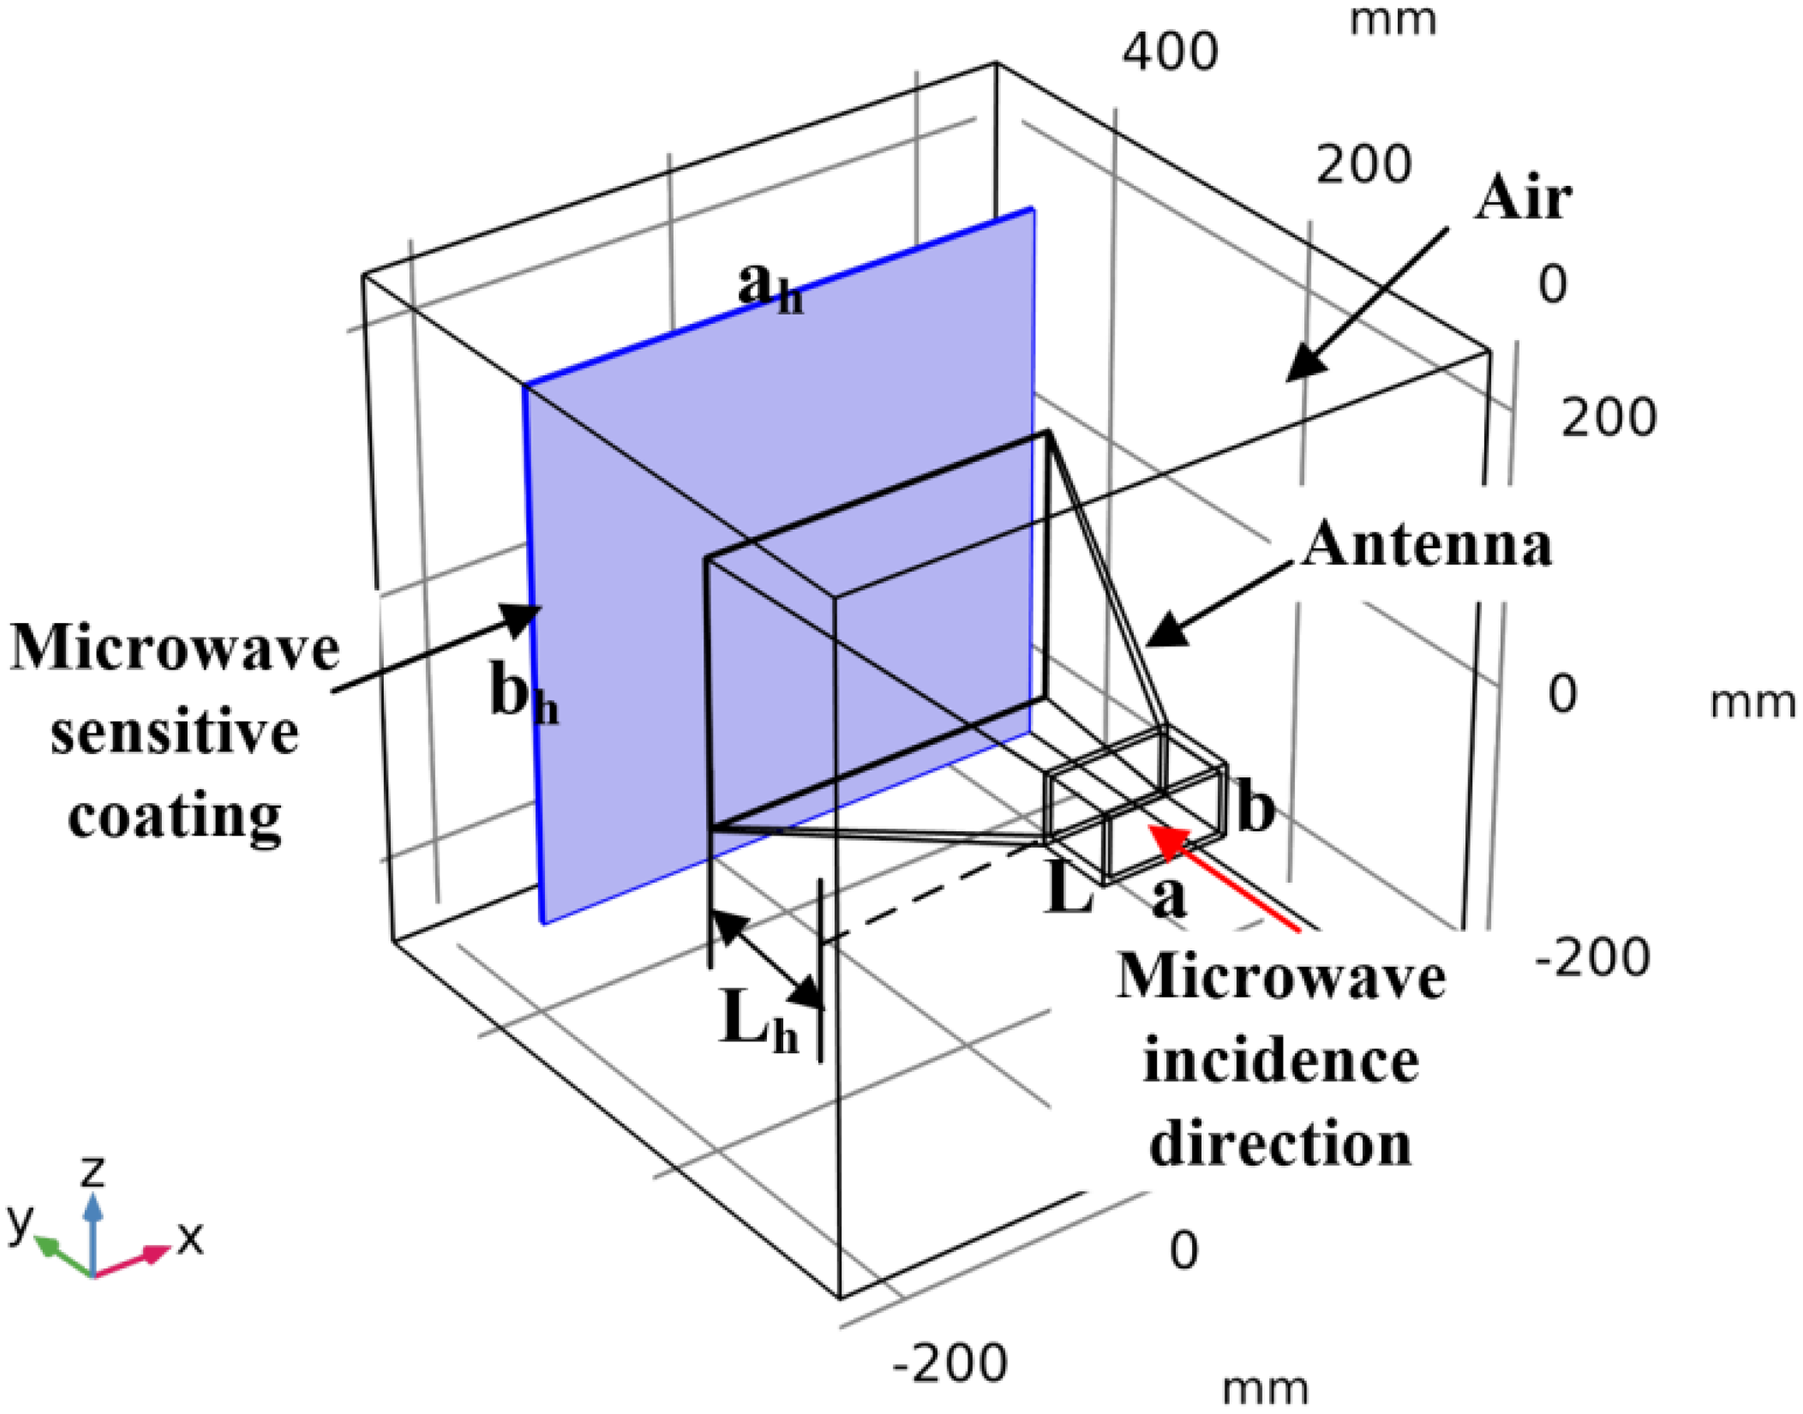
Numerical model.
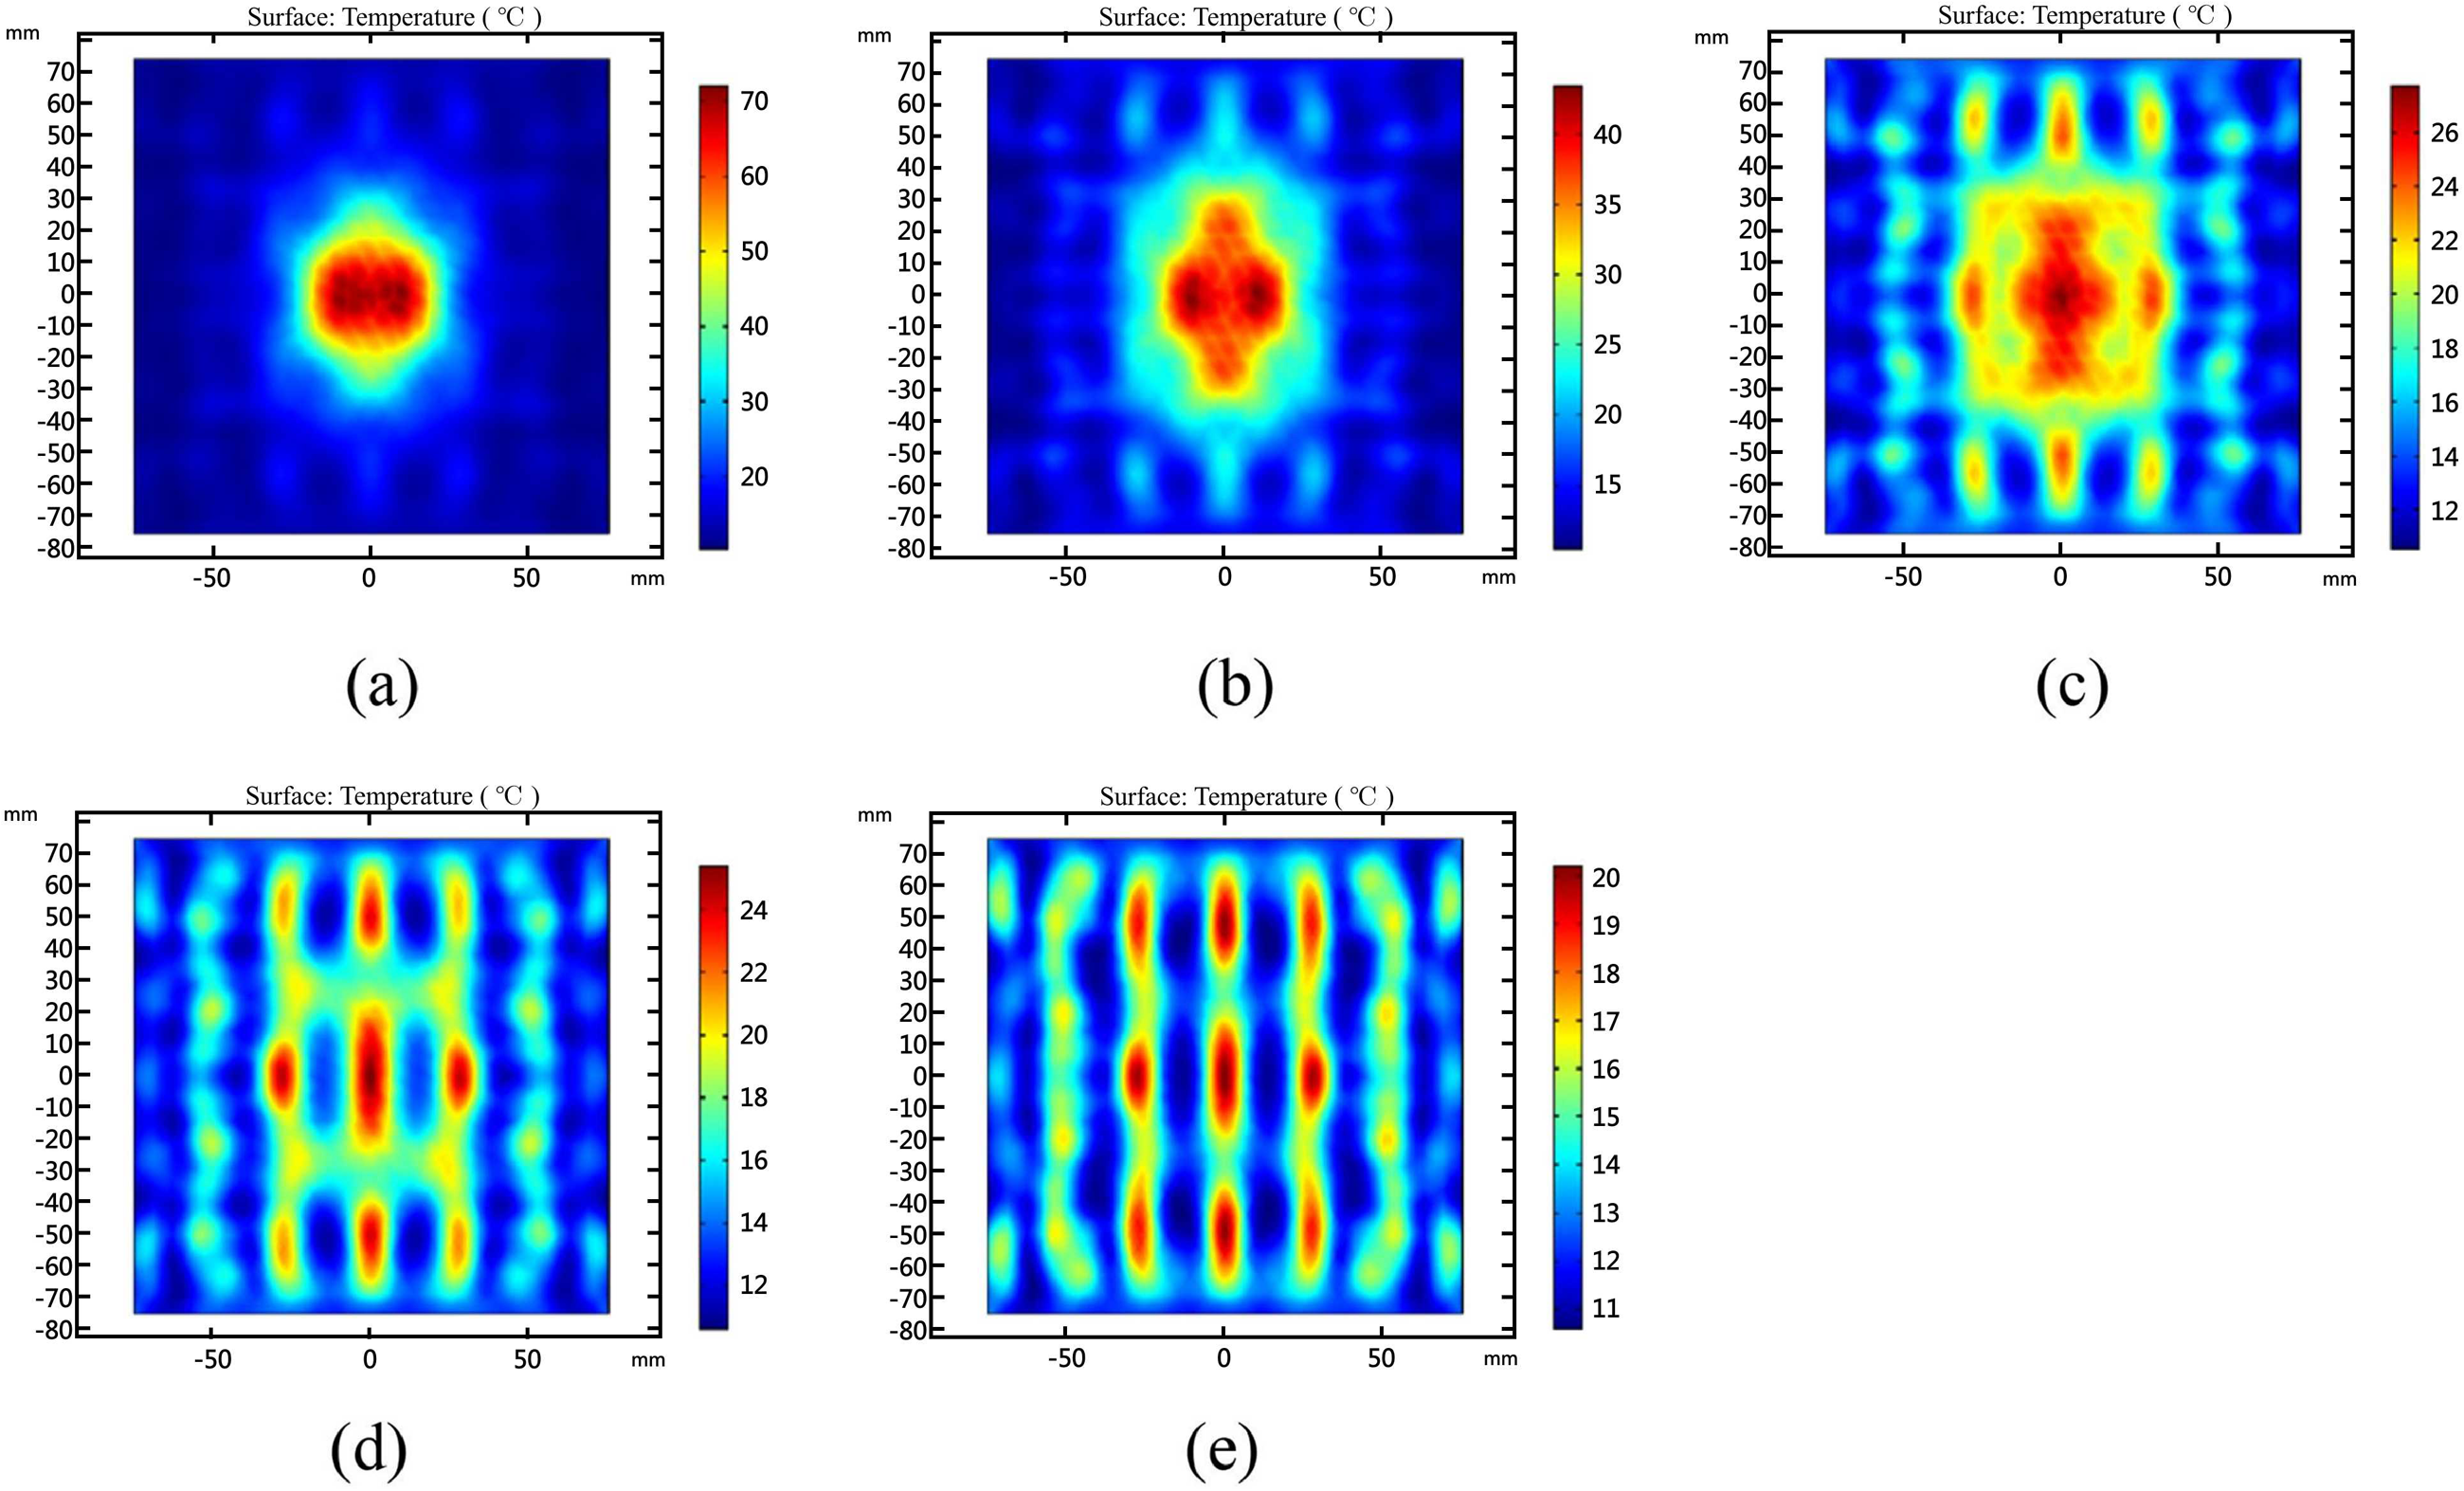
Under the irradiation of the horn antenna, a significant temperature increase is observed in the central region of the coating surface, with the temperature gradient decreasing progressively towards the edges, as shown in Figure 18. Compared to the standard rectangular waveguide antenna depicted in Figure 9, the area experiencing elevated temperatures under the horn antenna is substantially larger. As the radiation distance increases, there is a marked transformation in the shape of the heated region, which predominantly adopts regular geometric forms such as ellipses, rectangles, and elongated rectangles.

Temperature distribution on coating surface under horn antenna radiation at various irradiation distances. (a) Irradiation distance = 3 cm; (b) Irradiation distance = 5 cm; (c) Irradiation distance = 7 cm; (d) Irradiation distance = 10 cm; (e) Irradiation distance = 15cm.
Under the irradiation of the horn antenna, the maximum temperature increase on the coating surface remains relatively stable across different irradiation distances, fluctuating within the range of 13.4 ± 4.8 °C. In contrast, under the standard rectangular waveguide antenna, the maximum temperature increase on the coating surface shows a clear downward trend as the irradiation distance increases, as illustrated in Figure 19. This indicates that the horn antenna experiences less microwave energy loss over long-distance transmission compared to the rectangular waveguide antenna.
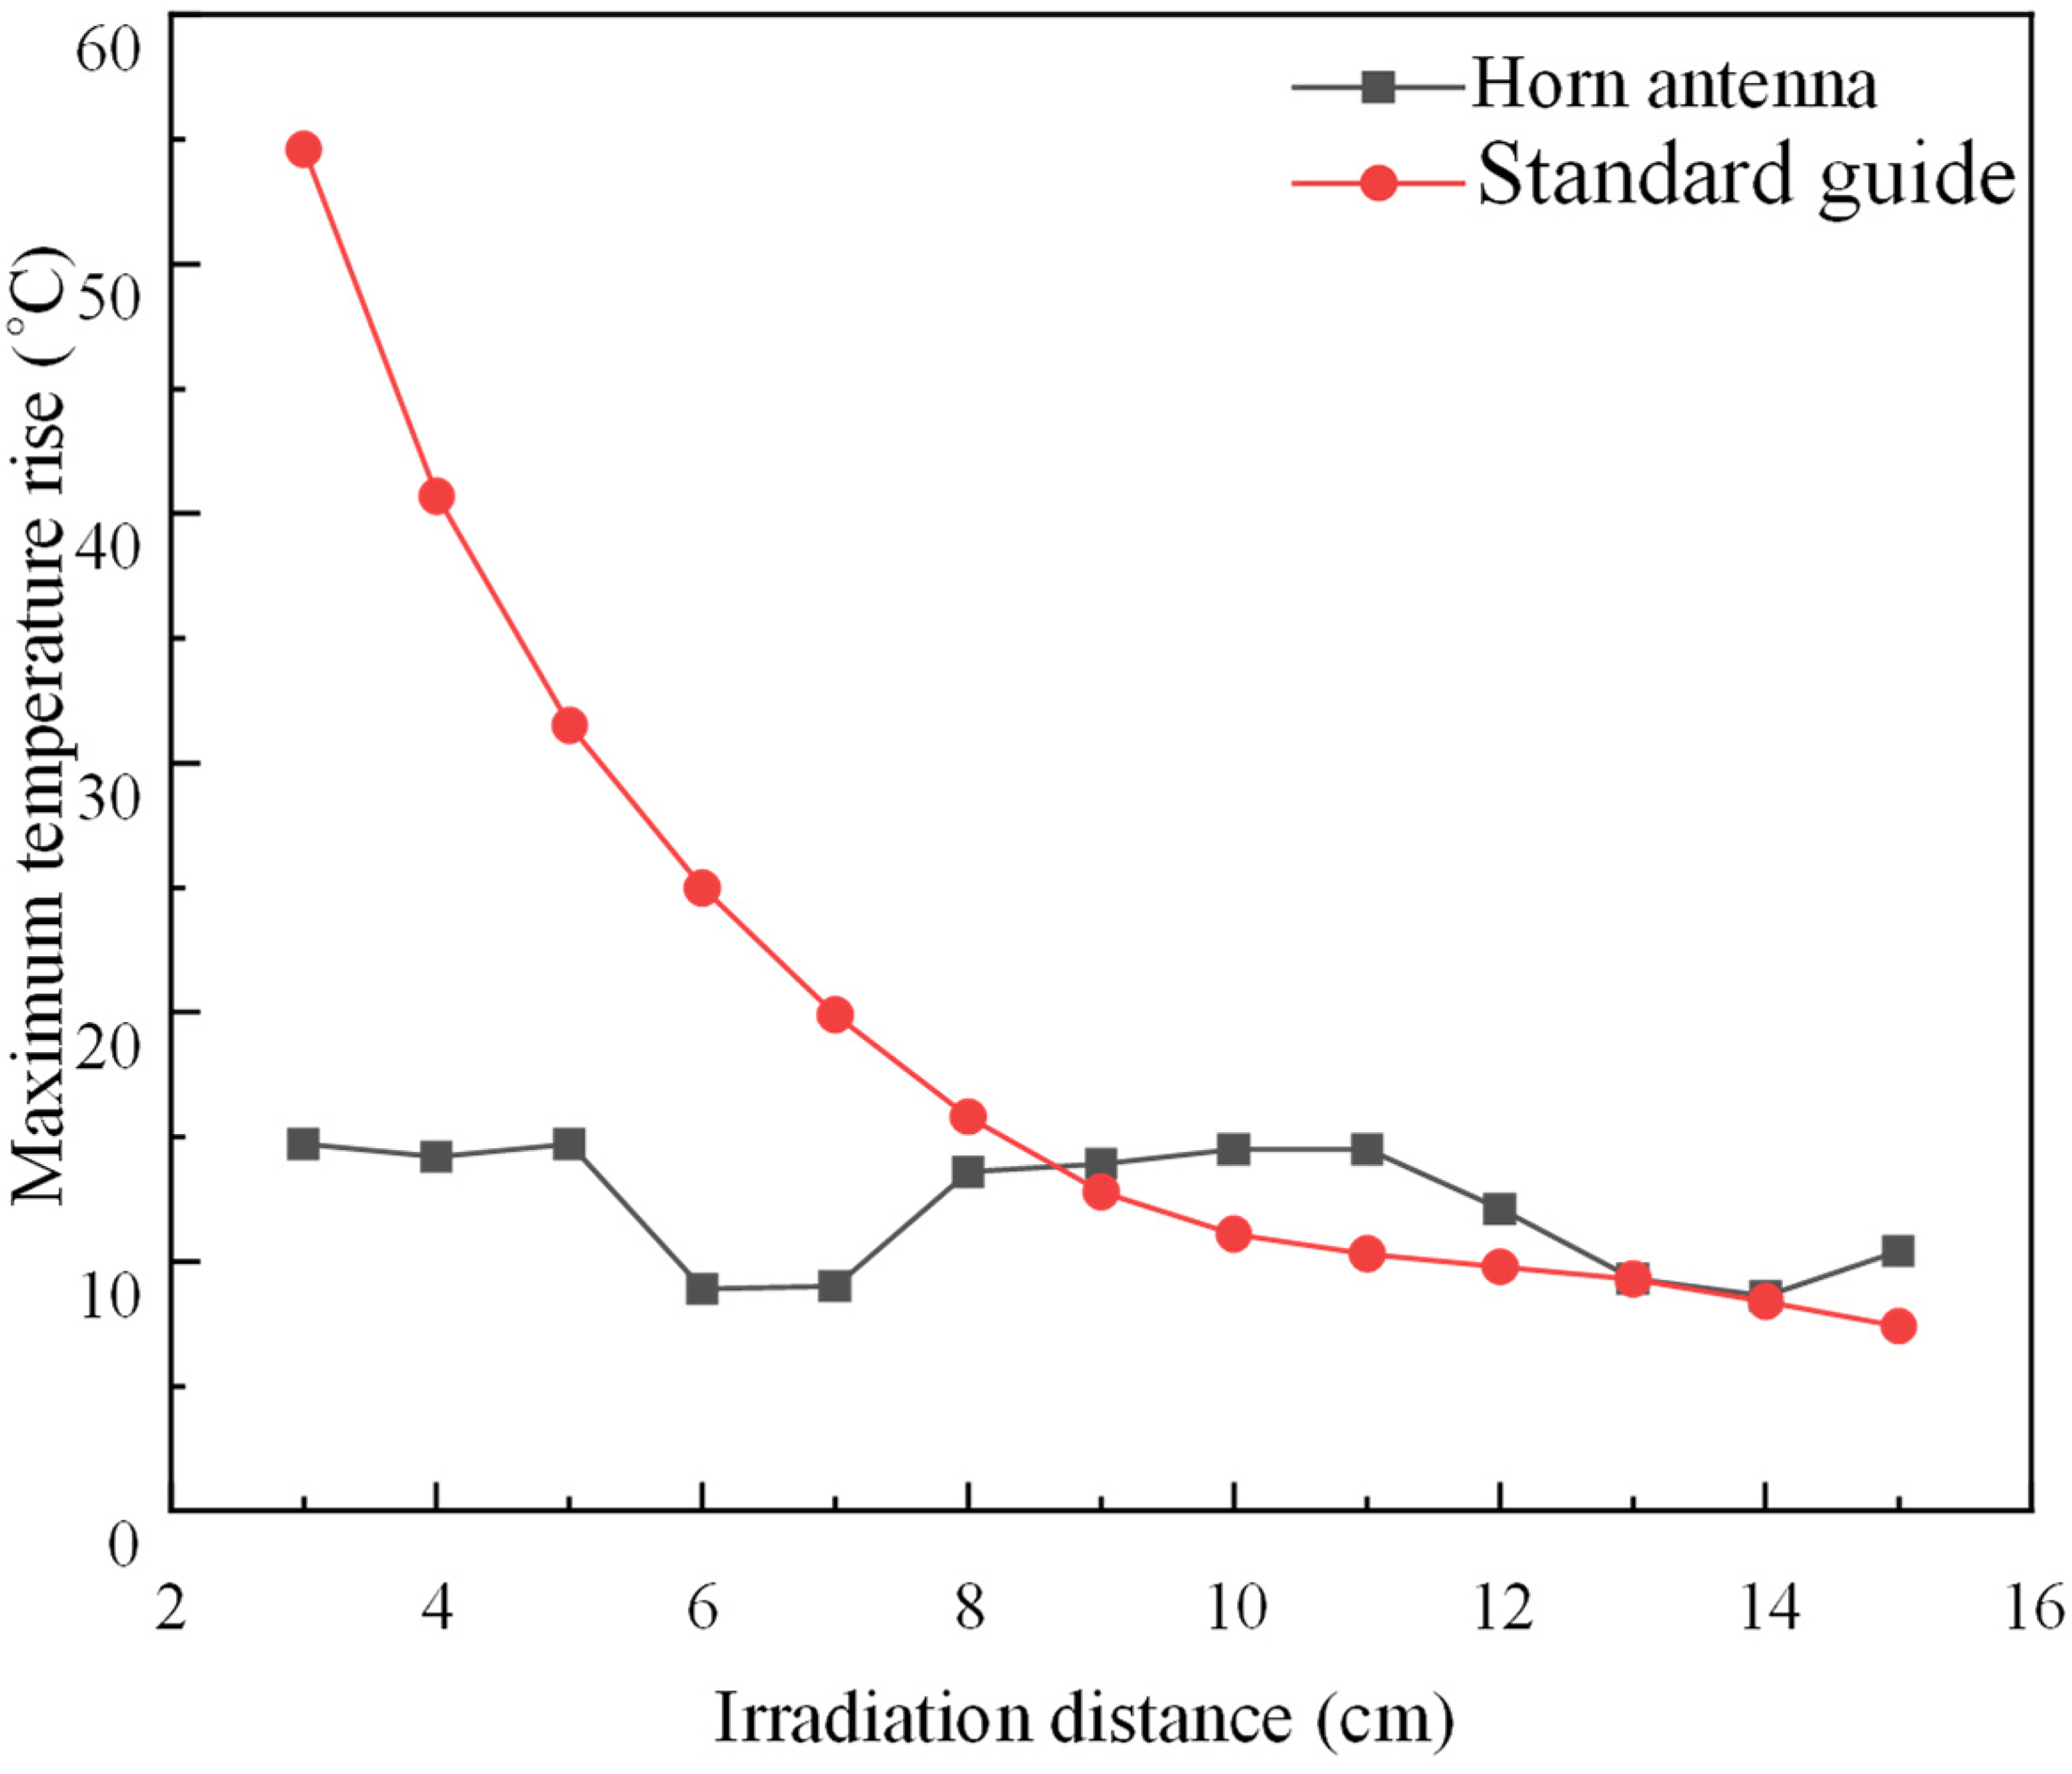
Variation of maximum temperature rise on coating surface with irradiation distance.
When the irradiation distance is less than 9 cm, the maximum temperature increase on the coating surface under the horn antenna is lower than that under the standard rectangular waveguide antenna. As the irradiation distance increases, the difference in maximum temperature increase between the two antennas gradually diminishes. When the irradiation distance exceeds 9 cm, the maximum temperature increase on the coating surface under the horn antenna surpasses that of the standard rectangular waveguide antenna.
Under the irradiation of the horn antenna, the area affected by temperature increase on the coating surface is approximately five times that of the standard rectangular waveguide antenna. Notably, when the irradiation distance exceeds 9 cm, the maximum temperature increase on the coating surface under the horn antenna surpasses that of the standard rectangular waveguide antenna. Therefore, compared to the standard waveguide antenna, the horn antenna offers significant advantages in terms of working distance, heating area, and heating uniformity.
Coating surface forms
In microwave de-icing applications, the surfaces to be treated are not always planar; structures such as bridge cables and power transmission lines often exhibit cylindrical curved surfaces. In this section, the heating characteristics of microwave radiation on curved coatings will be examined, as illustrated in Figure 20. The coating is applied to a cylindrical surface with a diameter of 150 mm, a height of 150 mm, and a thickness of 3 mm. The microwave power is set to 1 kW, with an irradiation time of 60 s, an incidence angle of 0°, and irradiation distances of 3, 5, 7, 10, and 15 cm, at a frequency of 2.45 GHz.

Numerical model.
In the central region of the coating, the temperature distribution of the curved coating (Figure 21) closely resembles that of the planar coating (Figure 9) across various irradiation distances, and therefore will not be elaborated upon further. In the peripheral region, two pairs of relatively high-temperature zones emerge, symmetrically distributed along the horizontal axis, forming a spindle shape. As the irradiation distance increases, this spindle-shaped temperature distribution becomes more pronounced. The curved coating experiences additional refraction and reflection effects, resulting in significant differences in the temperature distribution in the outer region compared to the planar coating.
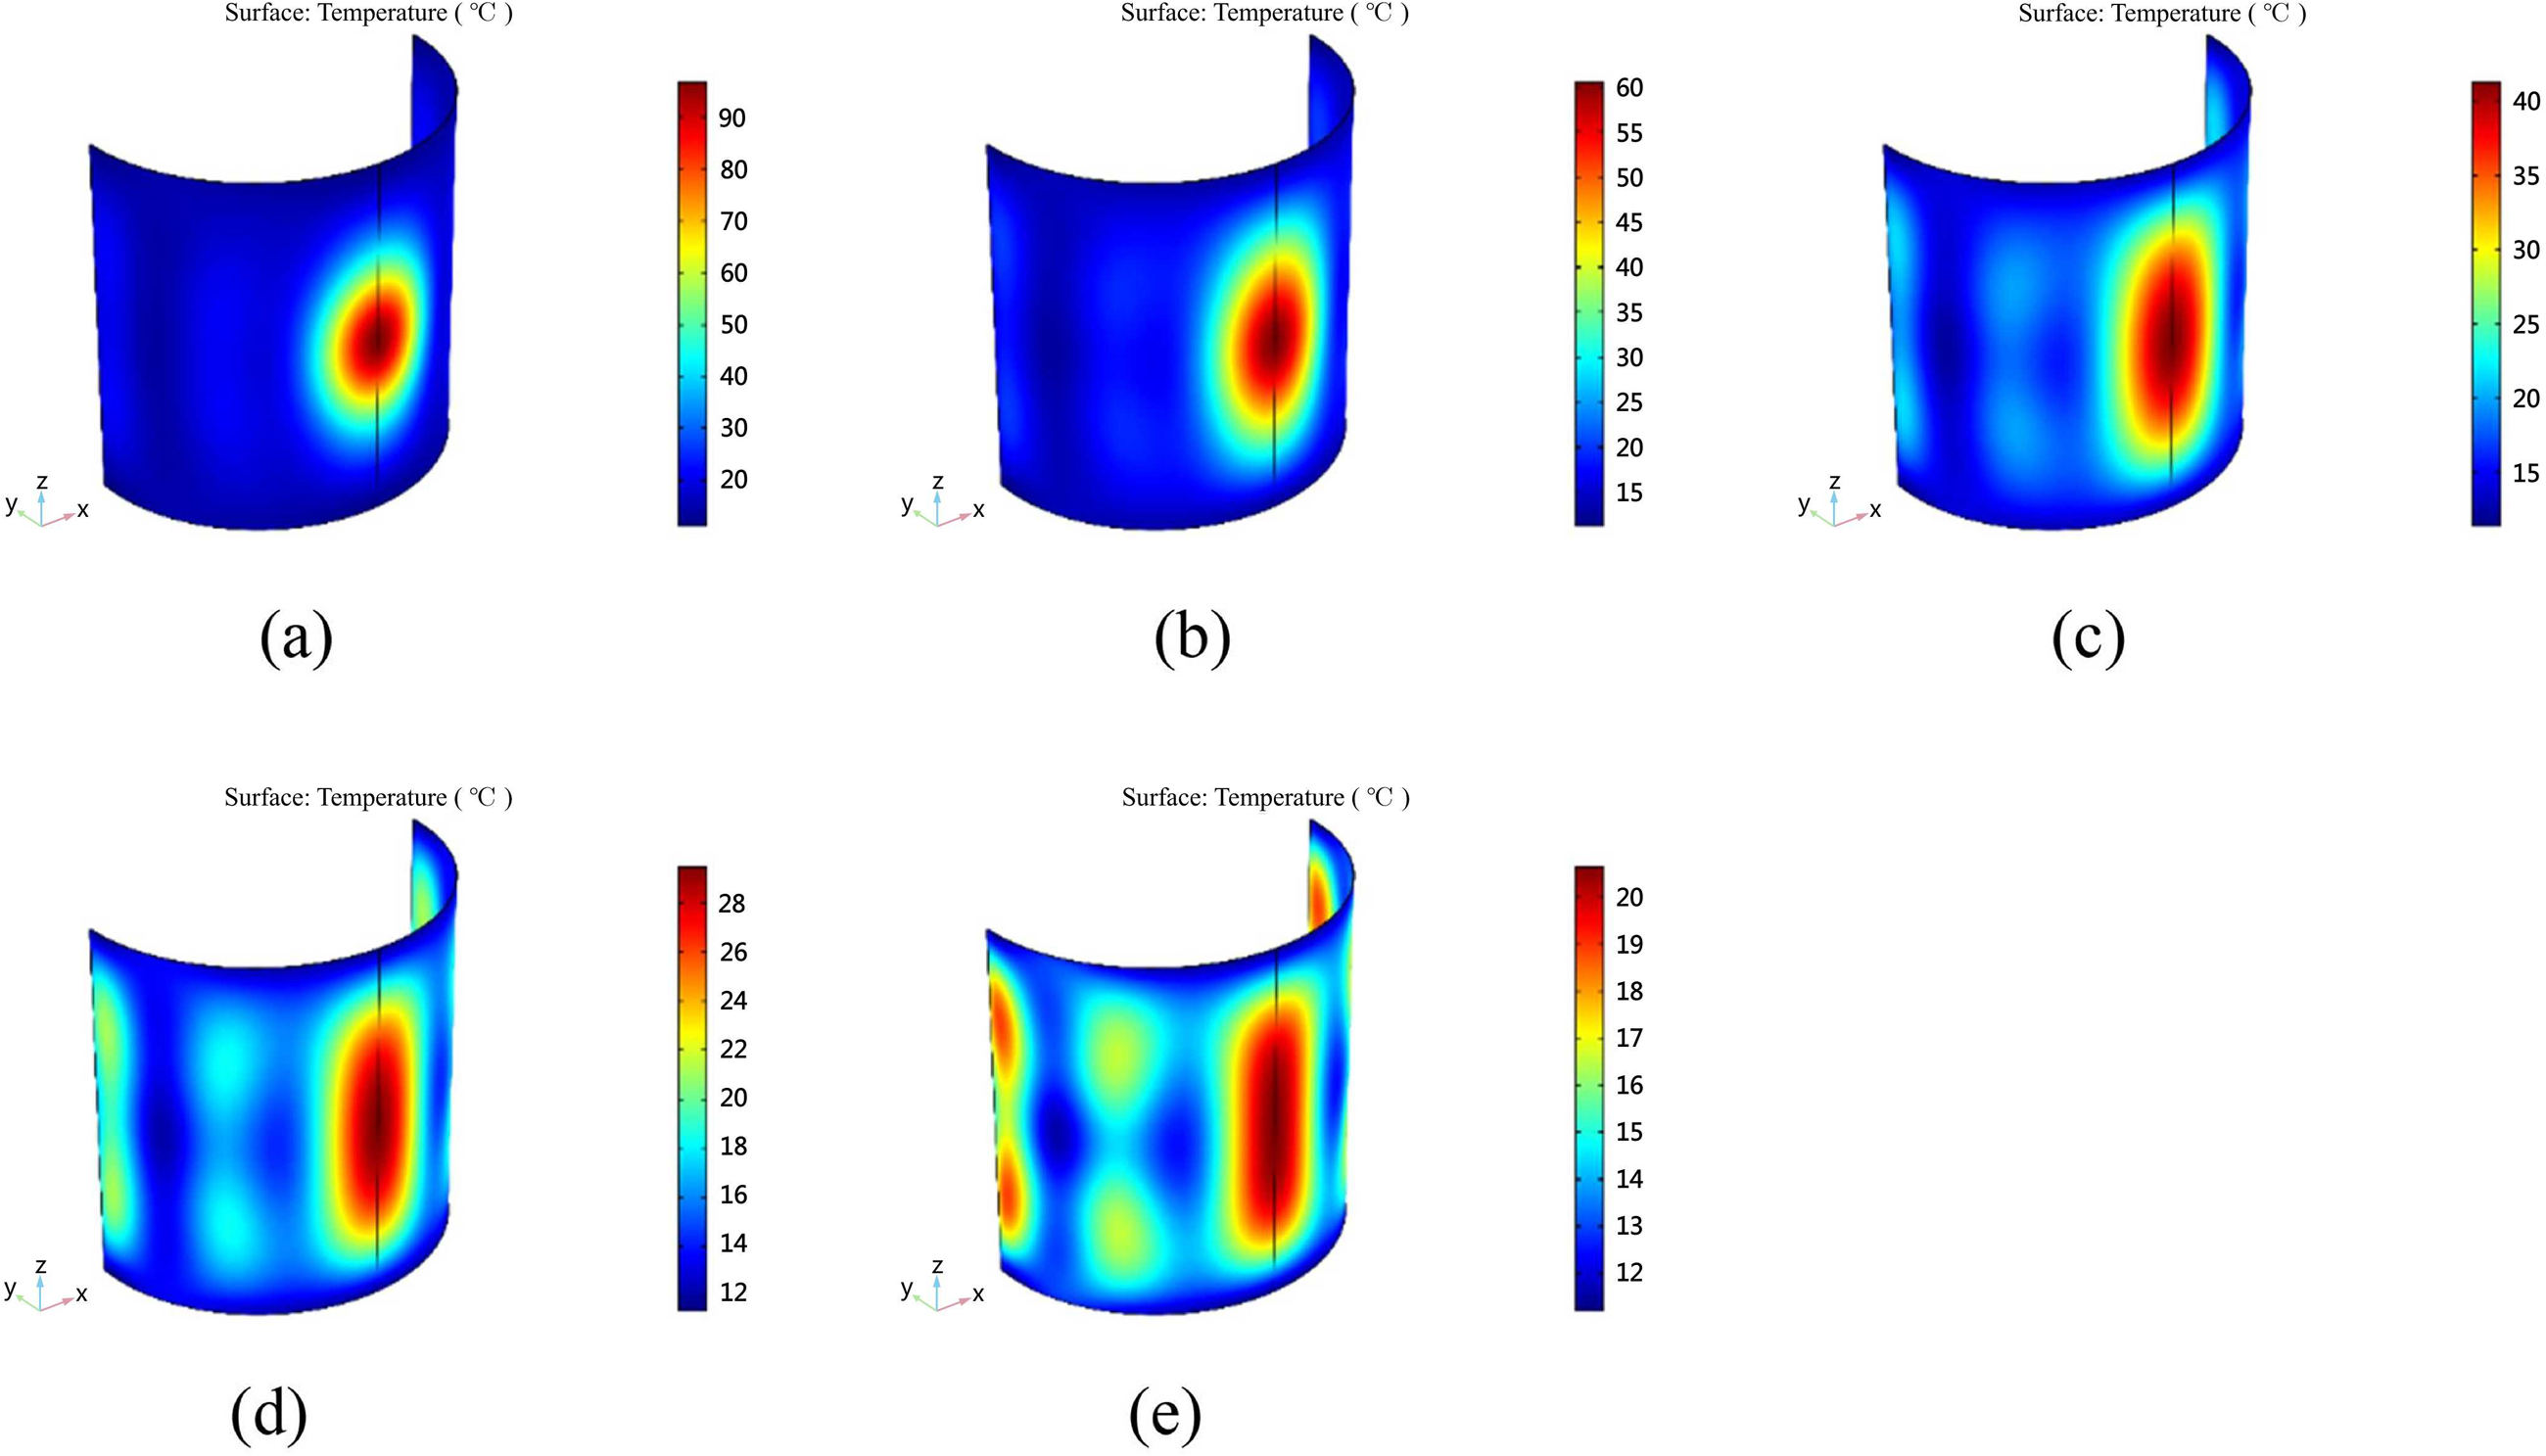
Temperature distribution on curved coating surface at various irradiation distances. (a) Irradiation distance = 3 cm; (b) Irradiation distance = 5 cm; (c) Irradiation distance = 7 cm; (d) Irradiation distance = 10 cm; (e) Irradiation distance = 15cm.
The maximum temperature rise for both curved and planar coatings is observed at the center of the coating surface. Overall, the curved coating consistently exhibits a higher peak temperature than the planar counterpart, as illustrated in Figure 22 and quantitatively detailed in Table 4. For instance, at an irradiation distance of 3 cm, the maximum temperature rise of the curved coating attains 86.79 °C, whereas the planar coating only reaches 54.56 °C, evidencing a 32.23 °C difference. This enhanced heating performance is primarily attributed to the higher effective power density at the center of the curved geometry, which arises from additional microwave reflection and refraction effects along its edges. As the irradiation distance increases, this temperature differential gradually diminishes. At 15 cm, the difference between the curved and planar coatings reduces to 3.19 °C, indicating that the geometric advantage of curvature becomes less pronounced with distance due to the broader dispersion of microwave energy.

Comparison of maximum temperature rise in coating samples under various irradiation distances: plane versus curve.
Maximum temperature rise in coating samples under various irradiation distances: plane versus curve.

Under identical microwave energy input and irradiation distance, the curved coating configuration demonstrates a higher heating rate and a more confined affected area compared to the planar configuration. The alignment of the high-temperature region with the de-icing target area suggests that microwave-sensitive coatings may be effective for de-icing on curved structures, such as cables and power lines. This indicates that curved coatings could potentially enhance de-icing efficiency on these surfaces.
Conclusions
This study employed a series of three-dimensional finite-element simulations to investigate the microwave heating behavior of microwave-sensitive coatings under varying electromagnetic and geometric conditions. By systematically varying parameters such as incidence angle, frequency, irradiation distance, antenna type, and surface curvature, the thermal response of the coatings was quantitatively analyzed. The key findings are as follows:
Critical incidence angle: At an irradiation distance of 5 cm, the critical incidence angle is approximately 20°. As the numerical simulations in this study assume ideal and uniform material and geometric properties, this value does not include an explicit uncertainty range. Within a certain range, the incidence angle does not significantly affect the de-icing efficiency of the coating. Microwave frequency impact: Microwave frequency critically influences both heating rate and energy distribution. Higher frequencies (e.g. 5.8 GHz) enable rapid heating but exhibit poor spatial uniformity due to localized hotspots. Lower frequencies (e.g. 0.915 GHz) yield more uniform heating but insufficient rates for effective de-icing. Thus, 2.45 GHz provides an optimal trade-off between efficiency and uniformity for coating de-icing. Effect of irradiation distance: By incrementally increasing the distance between the antenna and the coating surface, simulations showed a marked reduction in peak surface temperature. This effect was particularly significant for rectangular waveguide antennas with narrow beam dispersion. Horn antenna advantages: Simulations comparing waveguide and horn antenna configurations revealed that horn antennas substantially improve heating area, uniformity, and permissible working distance. These advantages stem from their broader radiation pattern and higher spatial coverage, making them more suitable for real-world de-icing of large and irregular surfaces. Curved coating performance: By modeling both planar and curved coating geometries, it was observed that curvature enhances localized electric field strength and heat generation, particularly at the geometric center. This indicates that complex-shaped substrates may benefit from more effective microwave de-icing than flat counterparts.
Despite the above findings, several limitations of this study should be acknowledged. The numerical simulations are based on simplified assumptions, including material isotropy, homogeneous absorber distribution, and temperature-independent physical properties. These idealizations may introduce deviations when applied to real-world scenarios. Future work should incorporate more detailed material models and experimental validations to further refine the predictive accuracy.
Footnotes
Author contributions
Huaiguang Xiao: conceptualization; formal analysis; writing—original draft; writing—review & editing; visualization; funding acquisition. Weiqiang Zhu: formal analysis; writing—original draft; writing—review & editing; visualization. Yifan Wang: investigation; resources; data curation; writing-original draft. Lei He (corresponding author): conceptualization; methodology; supervision; project administration; funding acquisition.
Funding
The authors received no financial support for the research, authorship, and/or publication of this article.
Declaration of conflicting interests
The authors declared no potential conflicts of interest with respect to the research, authorship, and/or publication of this article.
Data availability
The data supporting the findings of this study are available from the corresponding author upon reasonable request.