
Abstract
Over-supporting and under-supporting of the roadway perimeter rock in the mining process will affect the support effect, so the existing roadway perimeter rock support needs to be analysed, and the support structure parameters need to be adjusted accordingly. In order to study the deformation characteristics of the roadway surrounding rock, this article adopts FLAC3D software to simulate the stress distribution and deformation characteristics of the roadway surrounding rock under the existing anchor support, and analyses the test results of the support structure parameters based on mathematical methods. The results show that the existing support situation can improve the surrounding rock stress state, reduce the degree of stress concentration in the surrounding rock, effectively reduce the range of the plastic zone, and reduce the deformation value of the surrounding rock in the roadway, but it cannot effectively reduce the range of its plastic zone. Through orthogonal test, using extreme difference analysis, the primary and secondary order of the influence of the main control factors of the roof roadway on the total deformation of the roadway was obtained as follows: the thickness of the sprayed slurry > the anchor spacing > the length of the anchors = the distance between the rows of anchors. The roof of the roadway is: Spray thickness > Anchor spacing > Anchor length > Anchor row spacing. For the left gang of the roadway, it is: Spray thickness > Anchor spacing > Anchor row spacing > Anchor length, and for the right gang of the roadway, it is: Spray thickness > Anchor row spacing > Anchor length > Anchor spacing. For the total deformation of the roadway in the vein of the ore layer, the primary and secondary order of the influence of the two gangs is: the thickness of the spray slurry > anchor length > anchor spacing > anchor row spacing, and for the top plate of the roadway is: the thickness of the spray slurry > anchor length > anchor row spacing > anchor spacing. When the displacement of the roadway exceeds the permissible amount, the support parameters can be adjusted in the order of the degree of influence of each of the main control factors mentioned above. The results of the study can provide reference significance for the design and optimization of support for similar mines.
Introduction
Long-term mining of mineral resources has led to the complexity of mechanical properties and geological conditions of roadway surrounding rock.1,2 In the selection of supporting structure, if it is not appropriate, the problem of supporting failure will be frequently encountered, and the bearing capacity of surrounding rock itself cannot be effectively utilized.3,4 This may lead to geological disasters, which will bring many challenges to the deformation control of roadway surrounding rock and the safe and efficient mining of ore.5,6 Therefore, it is necessary to evaluate the reliability of the existing roadway surrounding rock support methods and adjust the parameters of the support structure accordingly.7,8 At the same time, it is of great significance to monitor the deformation and failure of surrounding rock and analyse its deformation characteristics, which is of great significance for controlling the stability of surrounding rock and predicting disasters in advance.
Many scholars at home and abroad have achieved many research results through theoretical analysis and rich engineering practice experience on the study of the deformation and failure characteristics of surrounding rock and the stability control technology of roadway.9–13 Wang et al. 14 studied the discontinuous deformation characteristics of different positions in the roadway. When there is no obvious interface between the roadway strata, the middle of the side wall of the roadway will be raised, but there is no significant dislocation phenomenon. In the contact area between the side wall of the roadway and the roof and floor, smaller deformation is observed. In order to analyse the reinforcement mechanism and performance of the supporting structure of the layered soft rock tunnel, Chen 15 carried out field tests, measured the axial force of the plug-in bolt, the pressure of the surrounding rock and the stress of the steel I-beam and the lattice beam, and analysed the supporting behaviour in detail. Ngoc-Anh et al.16,17 analysed the effects of structural forces induced in the roadway as well as the surrounding ground displacements to predict the settlement of the upper enclosing rocks. Xu et al. 18 used Midas numerical simulation software and field test to compare and analyse the plastic zone distribution, deformation characteristics of surrounding rock and the stress of supporting bolts under double support system and single-layer shotcrete anchor net support. Through theoretical analysis and numerical simulation, Lin et al. 19 found that the main failure characteristics of soft rock roadway include side wall slip, support failure, stress concentration and floor heave. By optimizing the roadway section, carrying out thin surface spraying reinforcement, improving support components and setting slope support, the deformation of soft rock roadway can be effectively controlled. Basarir 20 constructed a mine-scale 3D global model to extract the stresses acting on the gateway. Zhang 21 used the UDEC polygon method to compare and analyse the crack development and stress distribution, and proposed a new support scheme combining reinforcement in key areas with high-strength yield bolts to ensure that the stress distribution of surrounding rock is reasonable and the deformation of surrounding rock of roadway is effectively controlled. Xie 22 research shows that after the surrounding rock of the mine cross-section roadway undergoes two-stage pressurization, the original abutment pressure peak area will shift to the lower part of the surrounding rock, resulting in an increase in the stress of the surrounding rock on the side of the roadway. In addition, he also clarified the pressure relief mechanism of the surrounding rock in the static pressure and dynamic pressure stages during the hole forming process. Yang and Yan23,24 used FLAC3D for numerical simulation, and found that under the condition of deep soft rock, the deformation of surrounding rock of annular roadway is more uniform. Compared with the straight wall semi-circular roadway, the deformation of the annular roadway can be reduced by about 86% at most. In addition, the failure of the arch of the annular roadway has a significant impact on the final control effect of the surrounding rock. Wang 25 systematically studied the support effect of lining roadway in deep soft rock mass, and proposed a lining unit support model in the Graphic Processing Unit (GPU) parallel combined Finite Discrete Element Method (FDEM) programme based on Compute Unified Device Architecture (CUDA). The research of scholars at home and abroad has analysed the shear slip, stress redistribution and plastic zone expansion mechanism of surrounding rock failure by means of theory-experiment-numerical simulation, and verified the effectiveness of differentiated support, annular section optimization and other technologies. In the future, multi-field coupling analysis, dynamic construction and support optimization design should be deepened to meet the challenges of deep mining and complex geological conditions.
In summary, the existing roadway support structure can improve the stress state of the surrounding rock, reduce the degree of stress concentration, and effectively control the stability of the surrounding rock of the roadway. However, due to the complex and changeable geological conditions of the mine and the changes in mining technical conditions, the roadway support scheme still needs to be further studied. Therefore, according to the methods of field investigation, numerical analysis and mathematical analysis, this article analyses and demonstrates the existing support methods of roadway and roof roadway surrounding rock in orebody vein, and analyses the stress distribution and deformation characteristics of roadway surrounding rock. In order to determine the influence degree of supporting structure parameters on supporting effect, the parameters of supporting structure are optimized and adjusted by numerical simulation and orthogonal test. The length of bolt, the spacing of bolt, the row spacing of bolt and the thickness of shotcrete are determined as the main control factors, and the test results are analysed by range analysis. This has theoretical and practical guiding significance for the subsequent roadway surrounding rock support measures.
Project overview
Roadway surrounding rock conditions
The roof roadway of a phosphate mine body in Guizhou is mainly a roof ramp, which is arranged in the stratigraphic dolomite, and the enclosing rocks of the roadway are all dolomite, with three-centre arch section, and the south, middle and north disc area ramps are supported by spraying slurry, and the roof ramp of the shaft entrance is supported by anchor mesh spraying. The integrity of the surrounding rock of the roadway is good, and no traces of large-scale roofing and sheeting have been found, but the fine joints are developed, and there is a danger of debris falling from the top plate. The current situation of the roof roadway is shown in Figure 1.

Current status of roadway support on the roof of the ore body.
The roadways within the veins of the ore body are all trapezoidal in section, the roof of the roadway is the dolomite of the ore body's roof, with good roof integrity, the two gangs are the ore body's apatite, and the direct base plate is sandstone, and the roof of some of the veins’ roadways are supported by anchor rods. Most of the sections of the roadway roof integrity is good, there is no roofing phenomenon, locally affected by the structure of the roof plate has broken phenomenon. The two gangs of the local roadway are relatively broken due to the lack of slurry spraying, and are now basically able to meet the needs of mine transport, ventilation, pedestrian and pipeline laying. The current status of the lanes in the vein is shown in Figure 2.

The present situation of roadway support in vein.
Part of the roadway is supported by anchor mesh spraying, and the anchors are pipe slit anchors, Φ43 mm × 1500 mm; some sections are supported by rebar anchors, Φ18 × 3000 mm; the row spacing between the anchors is 1 m × 1 m, and the thickness of spraying slurry is 50 mm in the whole cross-section; the size of the rebar mesh is 2000 × 2000 mm, and the mesh is 150 mm × 150 mm.
Analysis of the mineral composition of the surrounding rock of the roadway
The quantitative X-ray diffraction pattern of the test is shown in Figure 3. As can be seen from Figure 3, the main mineral composition of the phosphate rock is apatite (hydroxylapatite). It does not contain hydrophilic minerals, so the mechanical properties of the roadway perimeter rock arranged in the ore body will not be affected by underground water, which mainly affects the mechanical properties of the structural surface, resulting in a reduction of its cementation properties. The direct base plate of the ore layer is sandstone, its composition is more complex, containing five kinds of minerals, including quartz and ilmenite as the main, two kinds of mineral composition accounted for more, and contains a small amount of kaolinite, kaolinite in contact with water after the mechanical properties will be greatly reduced, resulting in a decline in the overall bearing performance of the roadway peripheral rock. Assays of the ore body roof show that the minerals are dominated by dolomite (dolomite), which contains quartz. Quartz is a hard mineral and its presence does not reduce the mechanical properties of the dolomite. Therefore, the mineral composition of the rock at the top of the ore body is relatively simple and does not contain hydrophilic minerals, which determines its strong mechanical properties.
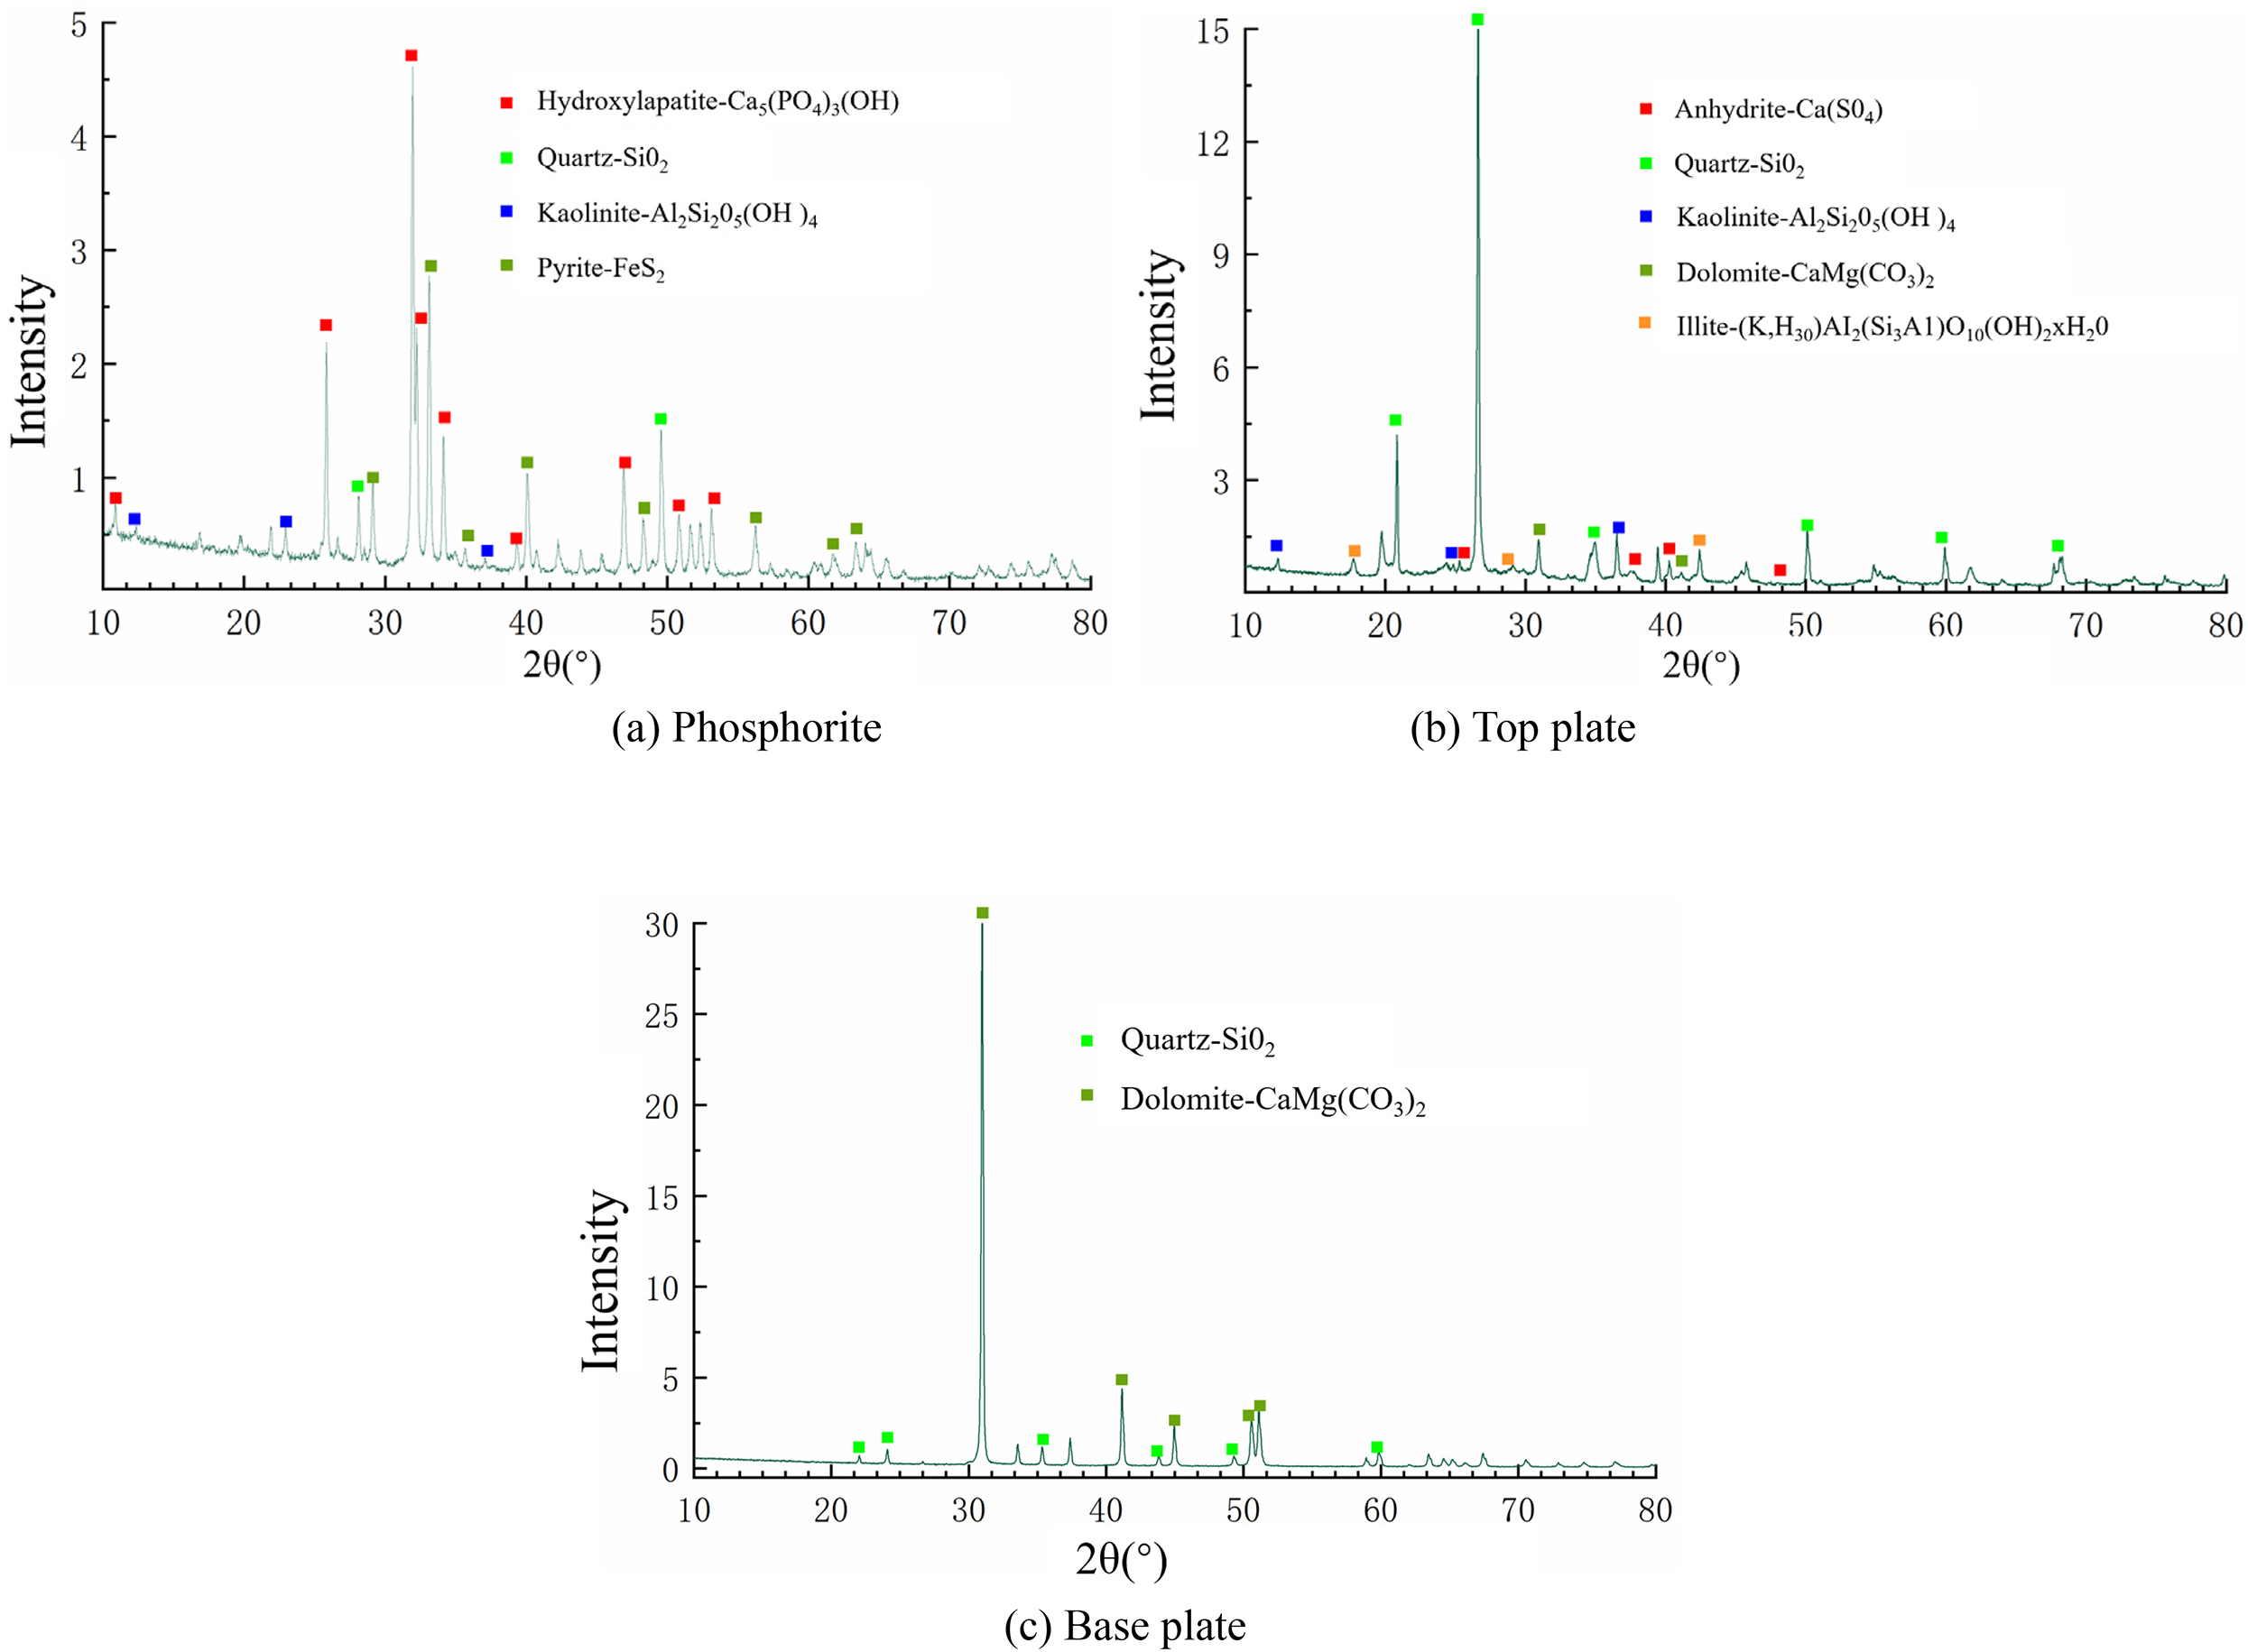
Quantitative X-ray diffraction pattern.
Stress distribution and deformation characteristics of the surrounding rock of the roadway
Computational models and calculation schemes
The forces and deformations in the middle roof roadway and in-vein roadway of a phosphorus mine in Guizhou were simulated and analysed using FLAC3D numerical simulation software, and the dimensions of the model were set to 50 m × 20 m × 50 m. The model was designed to be a simple and easy-to-use model. In the simulation process, the Ubiquitous multinodular mechanics model was chosen to describe the behavioural properties of the rock. In addition, the Interface function was employed to simulate the contact surfaces between formations, and the liner structural unit was used to represent the reinforcing mesh and shotcrete layers, while the Cable structural unit was used to simulate the action of anchors and anchor cables. In order to ensure that the anchor rods and cables are able to deform synergistically with the reinforcing mesh and the shotcrete layer, they are connected in a Node–Node fashion, while the anchored ends are connected to the rock units by means of a Node–Zone approach.
In the model, the bottom of the model is set with fixed constraints, and the horizontal boundaries should be normal constraints, while the upper part of the model is set as a load-bearing boundary. The top of the model was buried at a depth of approximately 800 m, and a face force load of 20.0 MPa was applied to its top. The origin of the model is set at the centre of the channel, where positive values of stress and strain indicate a positive direction and negative values a negative direction. In order to monitor changes within the roadway, horizontal displacements and stresses in the horizontal direction of the sidewalls, as well as vertical displacements and stress trends in the vertical direction of the top and bottom slabs, will be measured at 5 m intervals. Each monitoring was carried out on a monitoring line with a length of 5 m, with six measurement points distributed along each line. The specific construction of the model is shown in Figures 4 and 5.

FLAC3D numerical calculation model of roof roadway in orebody.
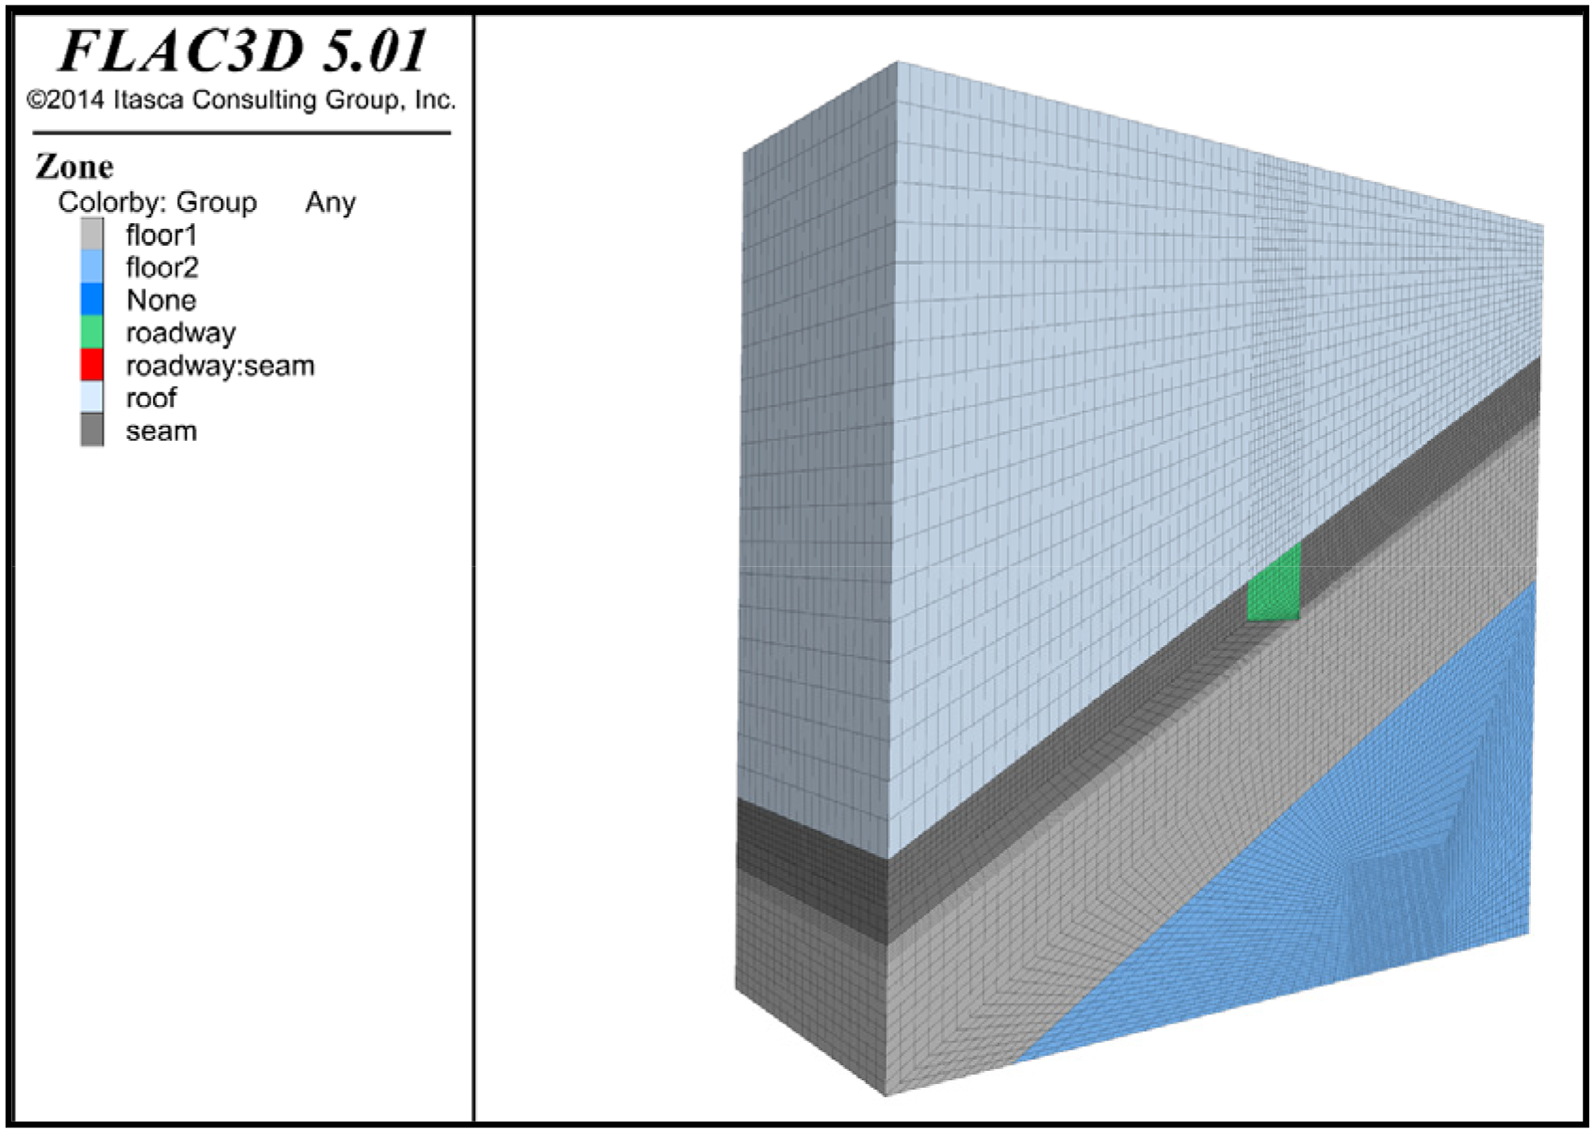
FLAC3D numerical calculation model of ore body vein roadway.
The reinforcing mesh and the concrete spray layer were modelled using liner structural units, and the relevant computational parameters are shown in Table 1. while the anchors were represented by Cable structural units, and their computational parameters are shown in Table 2. In order to ensure that the anchors can deform together with the reinforcing mesh and the spray layer, the outer ends of the anchors are connected to the reinforcing mesh and the spray layer by means of Node–Node, and the anchoring ends are connected to the rock units by means of Node–Zone.
Numerical calculation parameter table of steel mesh and spray layer.

Numerical calculation parameter table of bolt.

Analysis of the reliability of the existing support for the roof roadway of the ore body
As an example, the numerical calculation model of the existing support structure for the wellhead roof ramp is shown in Figure 6. The parameters of the existing support are the roof ramp anchor net spray support, the anchor rod adopts the pipe seam anchor rod, φ43 mm × 1500 mm, the row spacing between the anchor rods is 1 m × 1 m, and the thickness of the whole section is 50 mm; the size of the steel mesh is 2000 × 2000 mm, and the mesh is 150 mm × 150 mm. The investigation of the phenomenon shows that the integrity of the surrounding rock of the roadway is good, and no traces of large-scale roof fall and rib spalling are found, but the detailed joints are developed, and the roof is in danger of falling gravel.

Numerical model of existing supporting structure of roof roadway in ore body.
Characteristics of surrounding rock stress distribution
Under the condition of the existing support structure, the stress distribution of the peripheral rock in the roof roadway of the ore body is shown in Figure 7. According to the data in Figure 7, the horizontal stress value within 3 m on both sides of the roadway stays below 7.0 MPa. Horizontal stress formed a stress concentration zone at the location of the top and bottom plates of the roadway, and the maximum horizontal stress appeared at 1.5 m from the top of the roadway, with a peak value of 29.4 MPa, corresponding to a stress concentration factor of 1.47. There is a small range of tensile stress in both gangs of the roadway, with a value of 0.05 MPa, which is due to the fact that after the action of the supporting structure, the stress of the surrounding rock of the roadway is not fully released, but its value is much lower than the tensile strength of the supporting structure, and therefore it does not cause damage to the supporting structure. Positive vertical stress values at the top and bottom of the roadway indicate that these areas are subjected to compressive stresses. Vertical stress formed a stress concentration zone on both sides of the roadway, and the maximum vertical stress appeared at a position of 2.5 m from the left or right side, with a peak value of 36.5 MPa, corresponding to a stress concentration factor of 1.83.

The existing support stress cloud diagram of the roof roadway of the ore body.
According to Figure 7, the shear stress cloud map shows a lantern-like pattern, and a circular area of shear stress concentration is formed around the roadway. This stress concentration zone is specifically located in the range of 0.8–1.8 m above the roadway vault, 1.8–3.0 m on each side of the left and right sides, and 3.0–3.8 m below the floor. In this region, shear stress values typically exceed 8.0 MPa and a similarly shaped plastic zone is also formed in this region.
As can be seen from Figure 8, compared with the unsupported state, the range of the plastic zone of the top plate and two gangs of the roadway is greatly reduced, and the plastic zone of the bottom plate of the roadway is basically unchanged, which indicates that the support means of the anchor mesh spraying has a better control of the expansion of the plastic zone.

Distribution map of plastic zone in roof roadway of orebody.
Characteristics of surrounding rock deformation
The displacement field of the perimeter rock in the existing state of support of the roof roadway of the ore body is shown in Figure 9. As can be seen from Figure 9, the amount of horizontal displacement of both gangs and the amount of roof subsidence are within 9 cm. Under the action of the existing support structure, the deformation of the top plate is smaller than the deformation of the bottom plate, indicating that the existing support plays a better role in controlling the deformation of the top plate. The deformation amount of the two gangs is basically the same, and its value is within the permissible deformation range, which will not affect the use of the roadway and the integrity of the supporting structure.
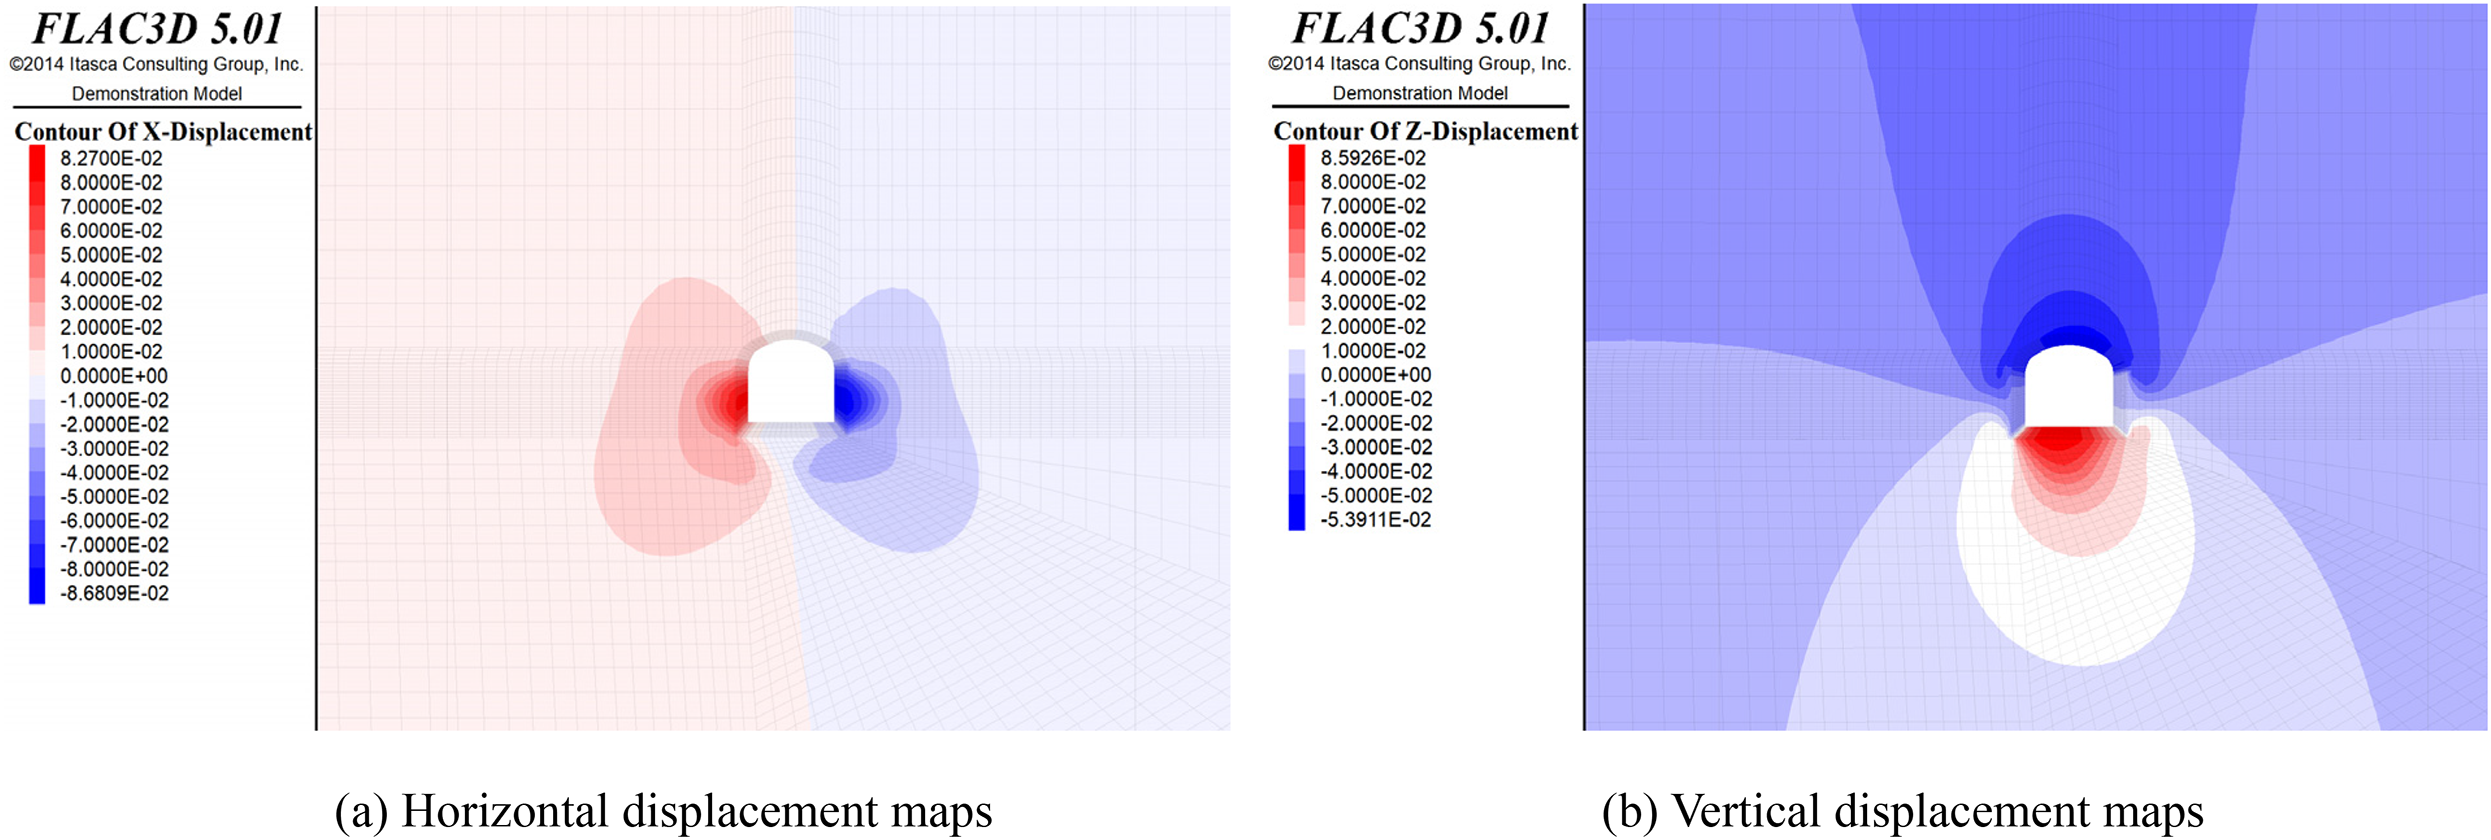
The existing support displacement cloud diagram of the roof roadway of the ore body.
Analysis of the reliability of the existing support for the roadways within the veins of the ore body
The numerical calculation model of the existing support structure is shown in Figure 10.

Numerical model diagram of existing supporting structure in-vein roadway of ore body.
Characteristics of surrounding rock stress distribution
The stress distribution of the roadway perimeter rock in the vein of the ore body under the existing support structure conditions is shown in Figure 11. According to Figure 11, the horizontal stress values on the left side of the roadway (on the ore body inclined side) within 1 m and on the right side (on the opposite side of the ore body inclined side) within 2 m remain below 5 MPa. Horizontal stress formed a stress concentration area in the top plate, bottom plate and right corner of the roadway, and the maximum horizontal stress appeared at a position of 2.0 m from the top of the roadway, and its peak value reached 28.6 MPa, and the corresponding stress concentration coefficient was 1.43. There is a small range of tensile stress in both gangs of the roadway, with a value of 0.8 MPa, which is due to the fact that after the action of the supporting structure, the stress of the surrounding rock of the roadway is not fully released, but its value is much lower than the tensile strength of the supporting structure, so it does not cause damage to the supporting structure. Positive values of vertical stress at the top and bottom plates of the roadway indicate that these areas are subjected to compressive stress. Vertical stress formed a stress concentration zone on the left and right sides of the roadway, and the maximum vertical stress appeared at the positions of 1.0 m from the left side and 3.5 m from the right side, respectively, with a peak value of 38.7 MPa, corresponding to a stress concentration factor of 1.93.

The existing support stress cloud diagram of the roadway in the vein of the ore body.
According to Figure 11, the shear stress cloud map shows an inclined lantern shape with a circular area of shear stress concentration formed around the roadway. This area is specifically located within 2.0–3.8 m above the top of the roadway arch, 2.0–2.5 m on the left side, 3.0–4.5 m on the right side, and 1.5–2.2 m below the base plate. Within this region, shear stress values typically exceed 7.0 MPa.
The distribution of plastic zones in the existing state of support of the roadway within the vein of the ore body is shown in Figure 12. As can be seen from Figure 12, compared with the unsupported state, the scope and depth of the plastic zone of the left gang (ore body inclined side) in the roadway vein is reduced to within 2 m, the scope of the plastic zone of the roof plate is also significantly reduced, the scope of the plastic zone of the right gang (reverse side of the ore body inclined side) has not been significantly reduced, and the plastic zone of the bottom plate of the roadway is basically unchanged, and the existing means of support has a better control of the extension of the plastic zone of the roof plate of the roadway and the left gang, but not until a good control effect of the extension of the plastic zone of the right gang. The existing support means have good control effect on the expansion of the plastic zone of the roadway roof and left gang, but not on the expansion of the right gang.

Distribution of plastic zone in ore body vein roadway.
Characteristics of enclosing rock deformation
The displacement field of the surrounding rock in the existing state of support of the roadway within the vein of the ore body is shown in Figure 13. As can be seen from Figure 13, the amount of horizontal displacement and the amount of subsidence within the veins of both gangs are within 9 cm. Under the action of the existing support structure, the amount of deformation in the vein and the deformation of the bottom plate are basically comparable, indicating that the existing support plays a better role in controlling the deformation in the vein. The deformation of the left gang is effectively controlled, but the deformation of the right gang is not significantly reduced, indicating that the existing support structure has an obvious control effect on the left gang of the roadway, and the control effect on the right gang is not obvious.
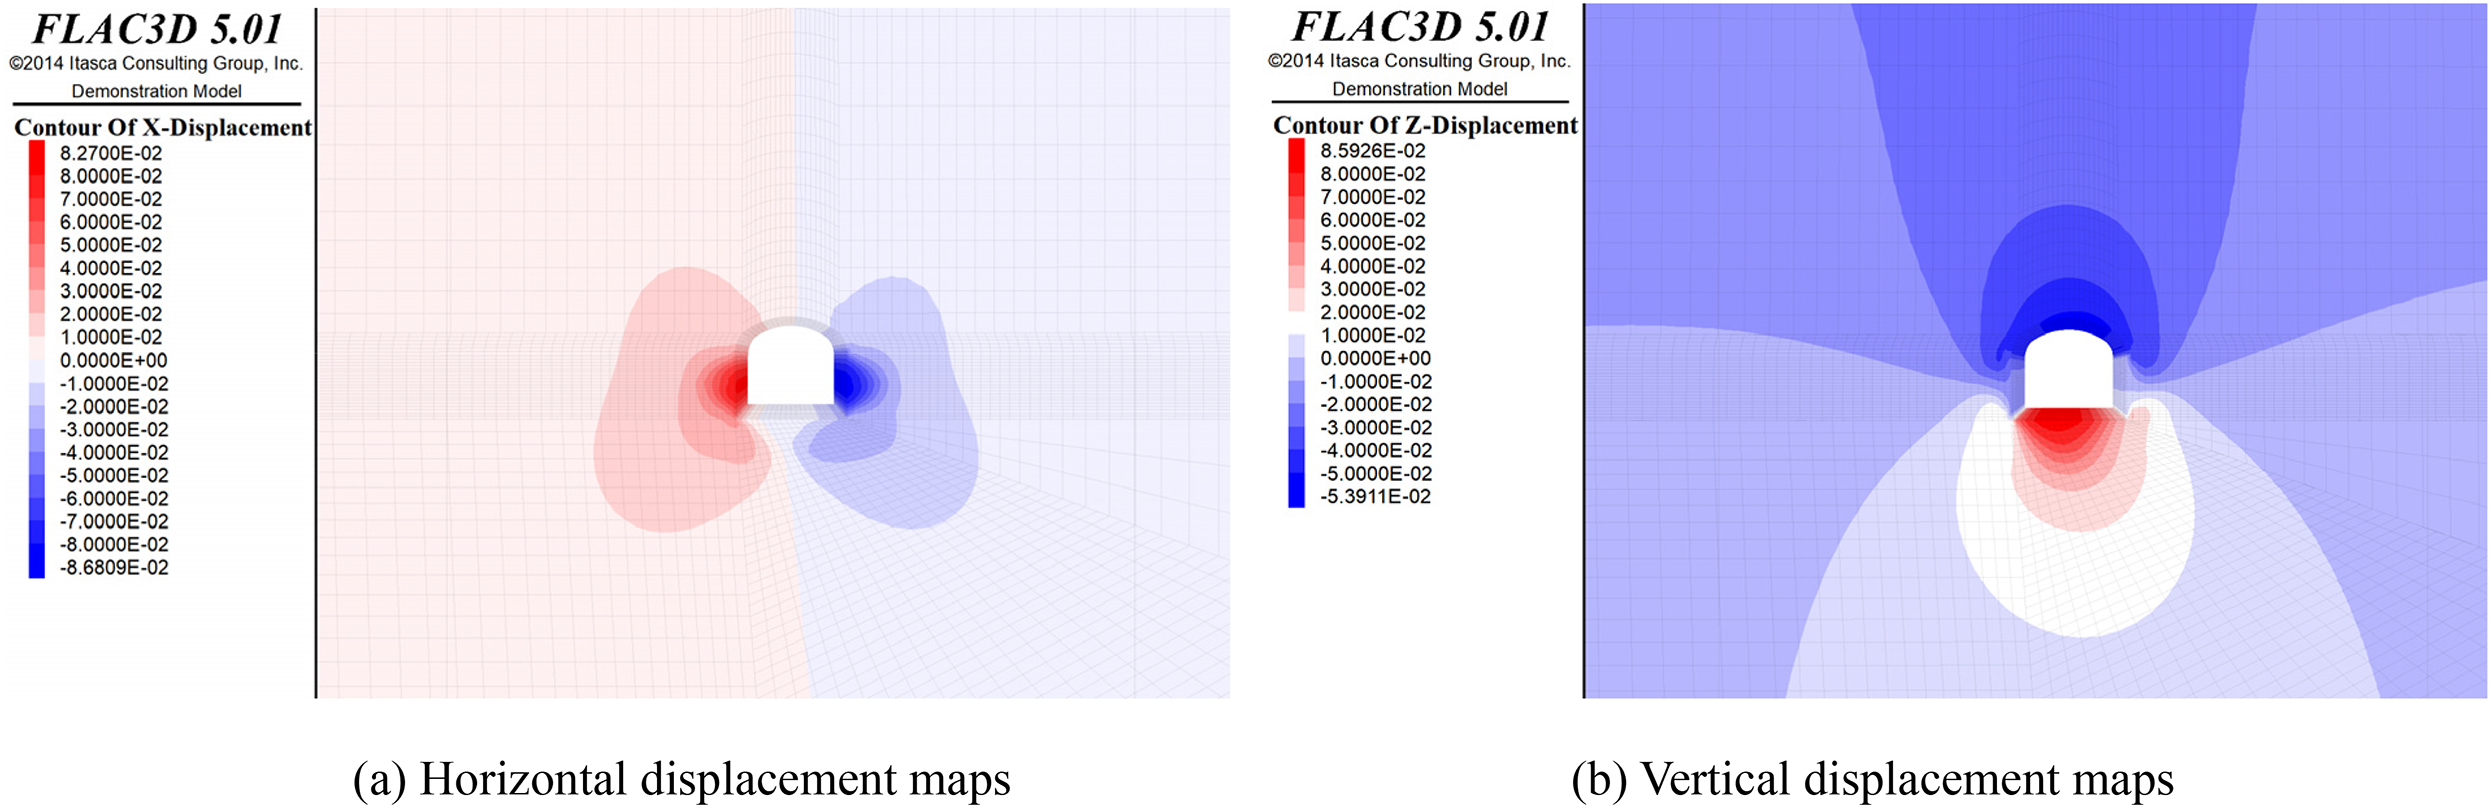
The existing support displacement cloud diagram of the roof roadway of the ore body.
Comprehensive analysis of the above, combined with the site investigation, in the existing support structure construction in place, can improve the surrounding rock stress state, reduce the degree of stress concentration in the surrounding rock, effectively reduce the scope of the plastic zone, reduce the deformation value of the roadway surrounding rock, can effectively control the stability of the roadway surrounding rock, the reliability of the anchor mesh spraying support method is good.
Adaptive analysis of support structures by orthogonal tests
Orthogonal test programme
In order to determine the degree of influence of the support structure parameters on the support effect, this article adopts the orthogonal test method to test the support structure parameters after various combinations. There are many factors affecting the effect of roadway support in underground mine, such as the layer of roadway arrangement, the geostress environment, the tectonic environment, the water content of the stratum and the support project, etc. Among these influencing factors, only the support project can be conveniently and effectively controlled. Therefore, on the basis of the original support scheme, this article adopts the method of orthogonal test to determine the degree of influence of the parameters of the support structure on the effectiveness of the roadway support.
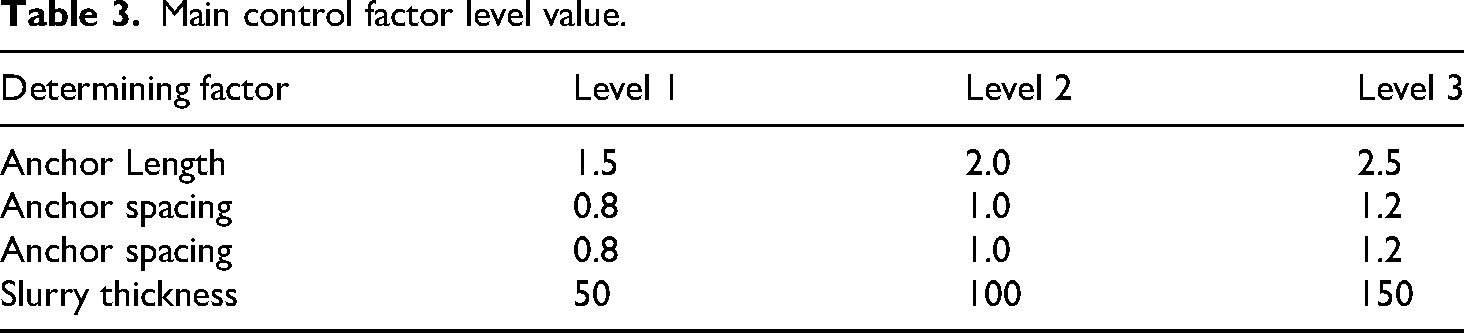
Both the roof roadway and the roadway in the vein adopt the combined support scheme of anchor + shotcrete + metal mesh, and the parameters of the metal mesh in the scheme are fixed, so the anchor length, anchor spacing, anchor row spacing, and shotcrete thickness are determined as the main control factors, and the total deformation of the roadway and the deformation of each direction are taken as the test indexes. The level values of the test master control factors are shown in Table 3.
Main control factor level value.
The four factors, three levels in the above table were tested and orthogonal tests were designed as shown in Table 4.
Main controlling factors orthogonal table.

Numerical simulation programme
Adopting the above standard four-factor three-level orthogonal test table, numerical simulation calculations were carried out on the roadway roof roadway and the roadway in the vein respectively, in order to study the degree of influence of each influencing factor on the effect of roadway support, the numerical model of the roof roadway support of the above nine tests is shown in Figure 14, and the numerical model of the roadway support of the roadway in the vein is shown in Figure 15.

Numerical model diagram of supporting structure of each test scheme in roof roadway.

Numerical model diagram of support structure for each test scheme of roadway in vein.
Simulation results and analyses of the roof roadway
Calculations were carried out in FLAC3D software according to the above nine test schemes, and after the model convergence, vertical slices were taken at 5 m in the y-direction for the horizontal displacement cloud and vertical displacement cloud in the calculation results, and the distribution map of the plastic zone of the surrounding rock of the roadway in each scheme, the vertical stress cloud, the horizontal stress cloud, the vertical displacement cloud, the horizontal displacement cloud, and so on, are shown in Figures 16∼20.
The distribution map of plastic zone of surrounding rock of roadway in each test scheme of roof roadway.

Vertical stress cloud diagram of each test scheme of roof roadway.
Horizontal stress cloud diagram of each test scheme of roof roadway.

Vertical displacement cloud diagram of each test scheme of roof roadway.
Horizontal displacement cloud diagram of each test scheme of roof roadway.
The deformation of the roadway was monitored during the numerical calculation process, and the monitoring points were arranged at 5 m, 10 m, and 15 m in the y-direction of the model, and four deformations were monitored at each monitoring point for the top plate, the bottom plate and the two gangs of the roadway, and the data in Table 3 were obtained by taking the average value of these data. The deformation in the four directions of the roadway is added up to get the total deformation of the roadway, which acts as an index for orthogonal test analysis.
This article proposes the support structure that is preferred to be adjusted or optimized when controlling the deformation of the roadway, analyses the deformation amount of the top plate, the deformation amount of the bottom plate, the deformation amount of the two gangs and the total deformation amount, and adopts the method of analysis of extreme deviation to process the test data. The test results of each support scheme are shown in Table 5.
Deformation monitoring data table of roof roadway in all directions.

Extreme variance analysis
Kjm denotes the sum of test metrics corresponding to the factors in column j at level m, while 
Rj reflects the degree of change in the test index when the level of the factors in column j changes. The larger the Rj value, the more significant the influence of this factor on the test index, so the importance of this factor is higher. Accordingly, the importance of each factor can be determined by the size of the Rj value.
The degree of influence of the four support parameters on the total displacement of the roadway (top plate + bottom plate + left gang + right gang displacement) was evaluated using the method of extreme variance analysis, as shown in Table 6. Due to space constraints, only the table of total displacement principal control factors polar analysis is presented in this article.
Range analysis table of main controlling factors of total displacement.

The degree of influence of the four support structure parameters on the amount of displacements in each direction of the mine roof roadway was calculated by the extreme difference method as: Total displacement: Spray thickness > anchor spacing > anchor length = anchor row spacing. Top plate: Spray thickness > anchor spacing > anchor length > anchor row spacing. Left gang (inclined side of the ore body): Spray thickness > anchor spacing > anchor row spacing > anchor length. Right gang (reverse side of ore body tendency): Spray thickness > Anchor row spacing > Anchor length > Anchor spacing.
There are significant differences in the order of influence of key supporting parameters such as spray net thickness, bolt length, bolt spacing and bolt row spacing on the deformation of the left and right sides of the roadway. This spatial difference is mainly due to the complexity of the interaction mechanism between surrounding rock and supporting structure, in which the mechanical properties of the joint surface play a key role. Specifically, the parameters such as contact stiffness, friction coefficient and interface shear strength of the joint surface show non-uniform distribution characteristics on the left and right sides of the roadway, resulting in differences in the mechanical effect transmission path and influence degree of the support parameters. 25 In addition, the anisotropy of geological tectonic stress field, the non-uniformity of spatial distribution of surrounding rock joints and fissures, and the asymmetry of stress redistribution during roadway excavation also aggravate this difference. Therefore, in the process of roadway support design and construction, the spatial variability characteristics of surrounding rock-support structure interaction should be fully considered, and the differential support parameter optimization scheme should be adopted to realize the effective control of surrounding rock deformation and ensure the long-term stability of roadway.
Simulation results and analyses of the in-vein roadway
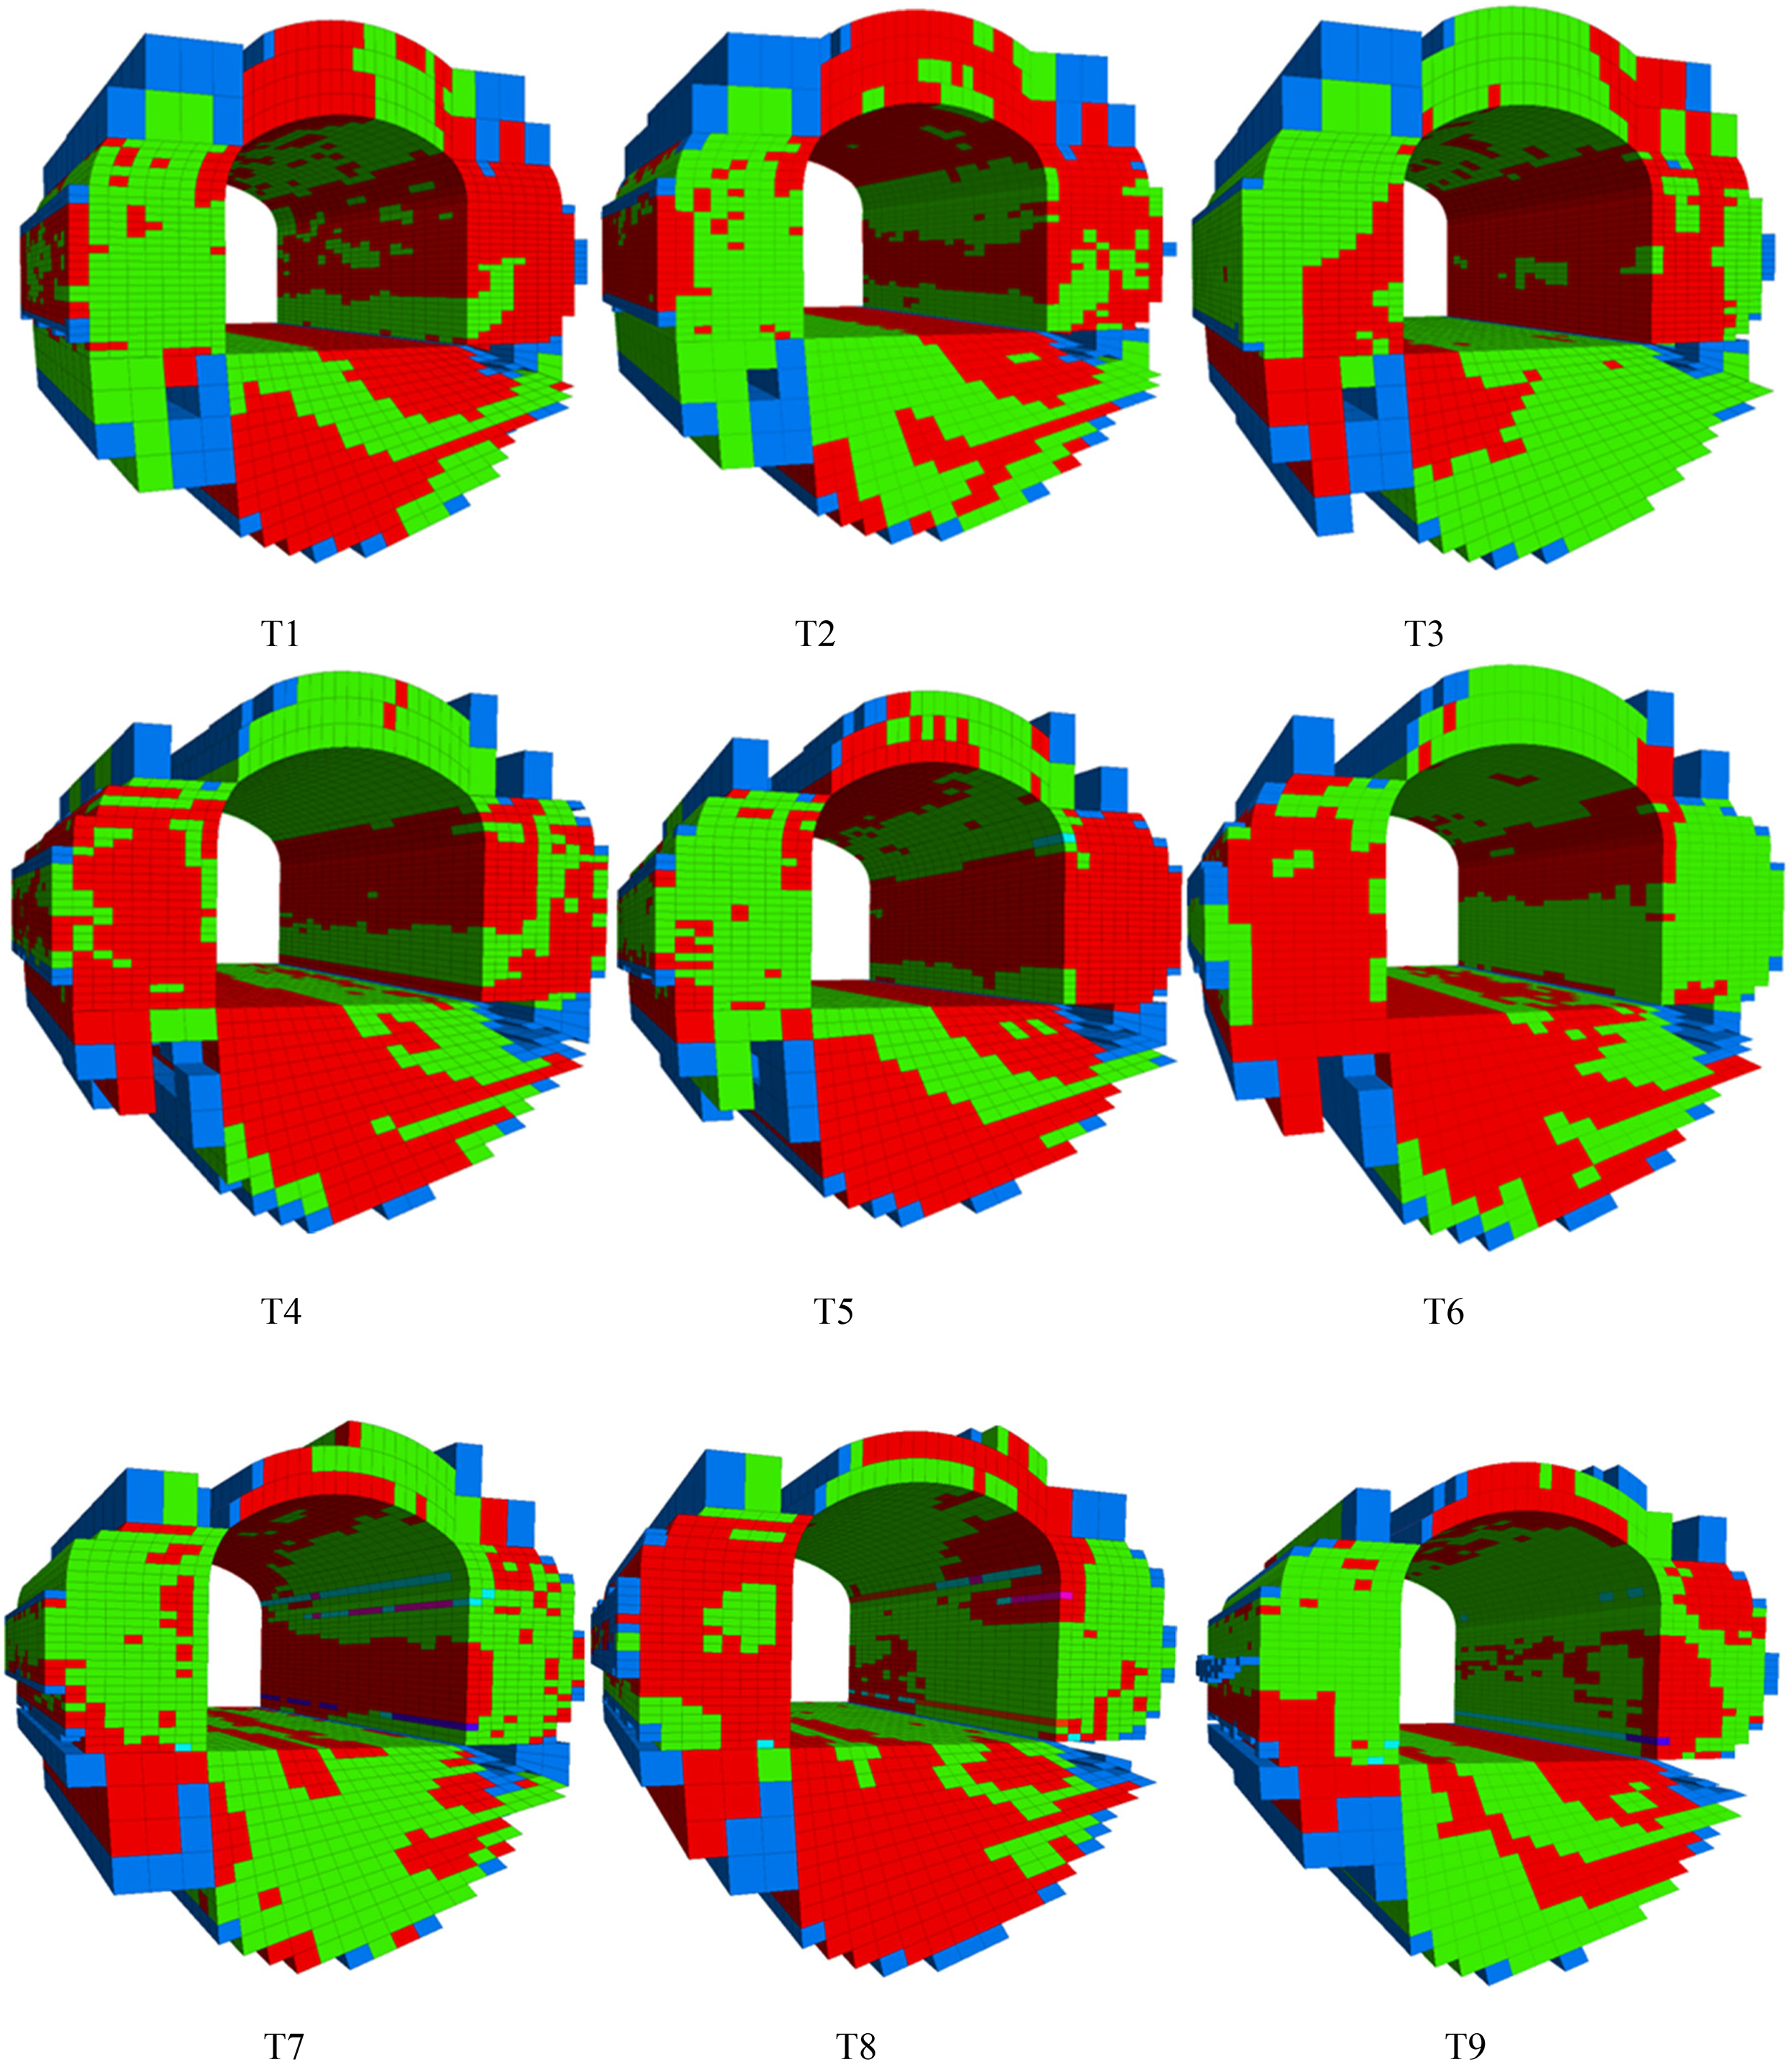
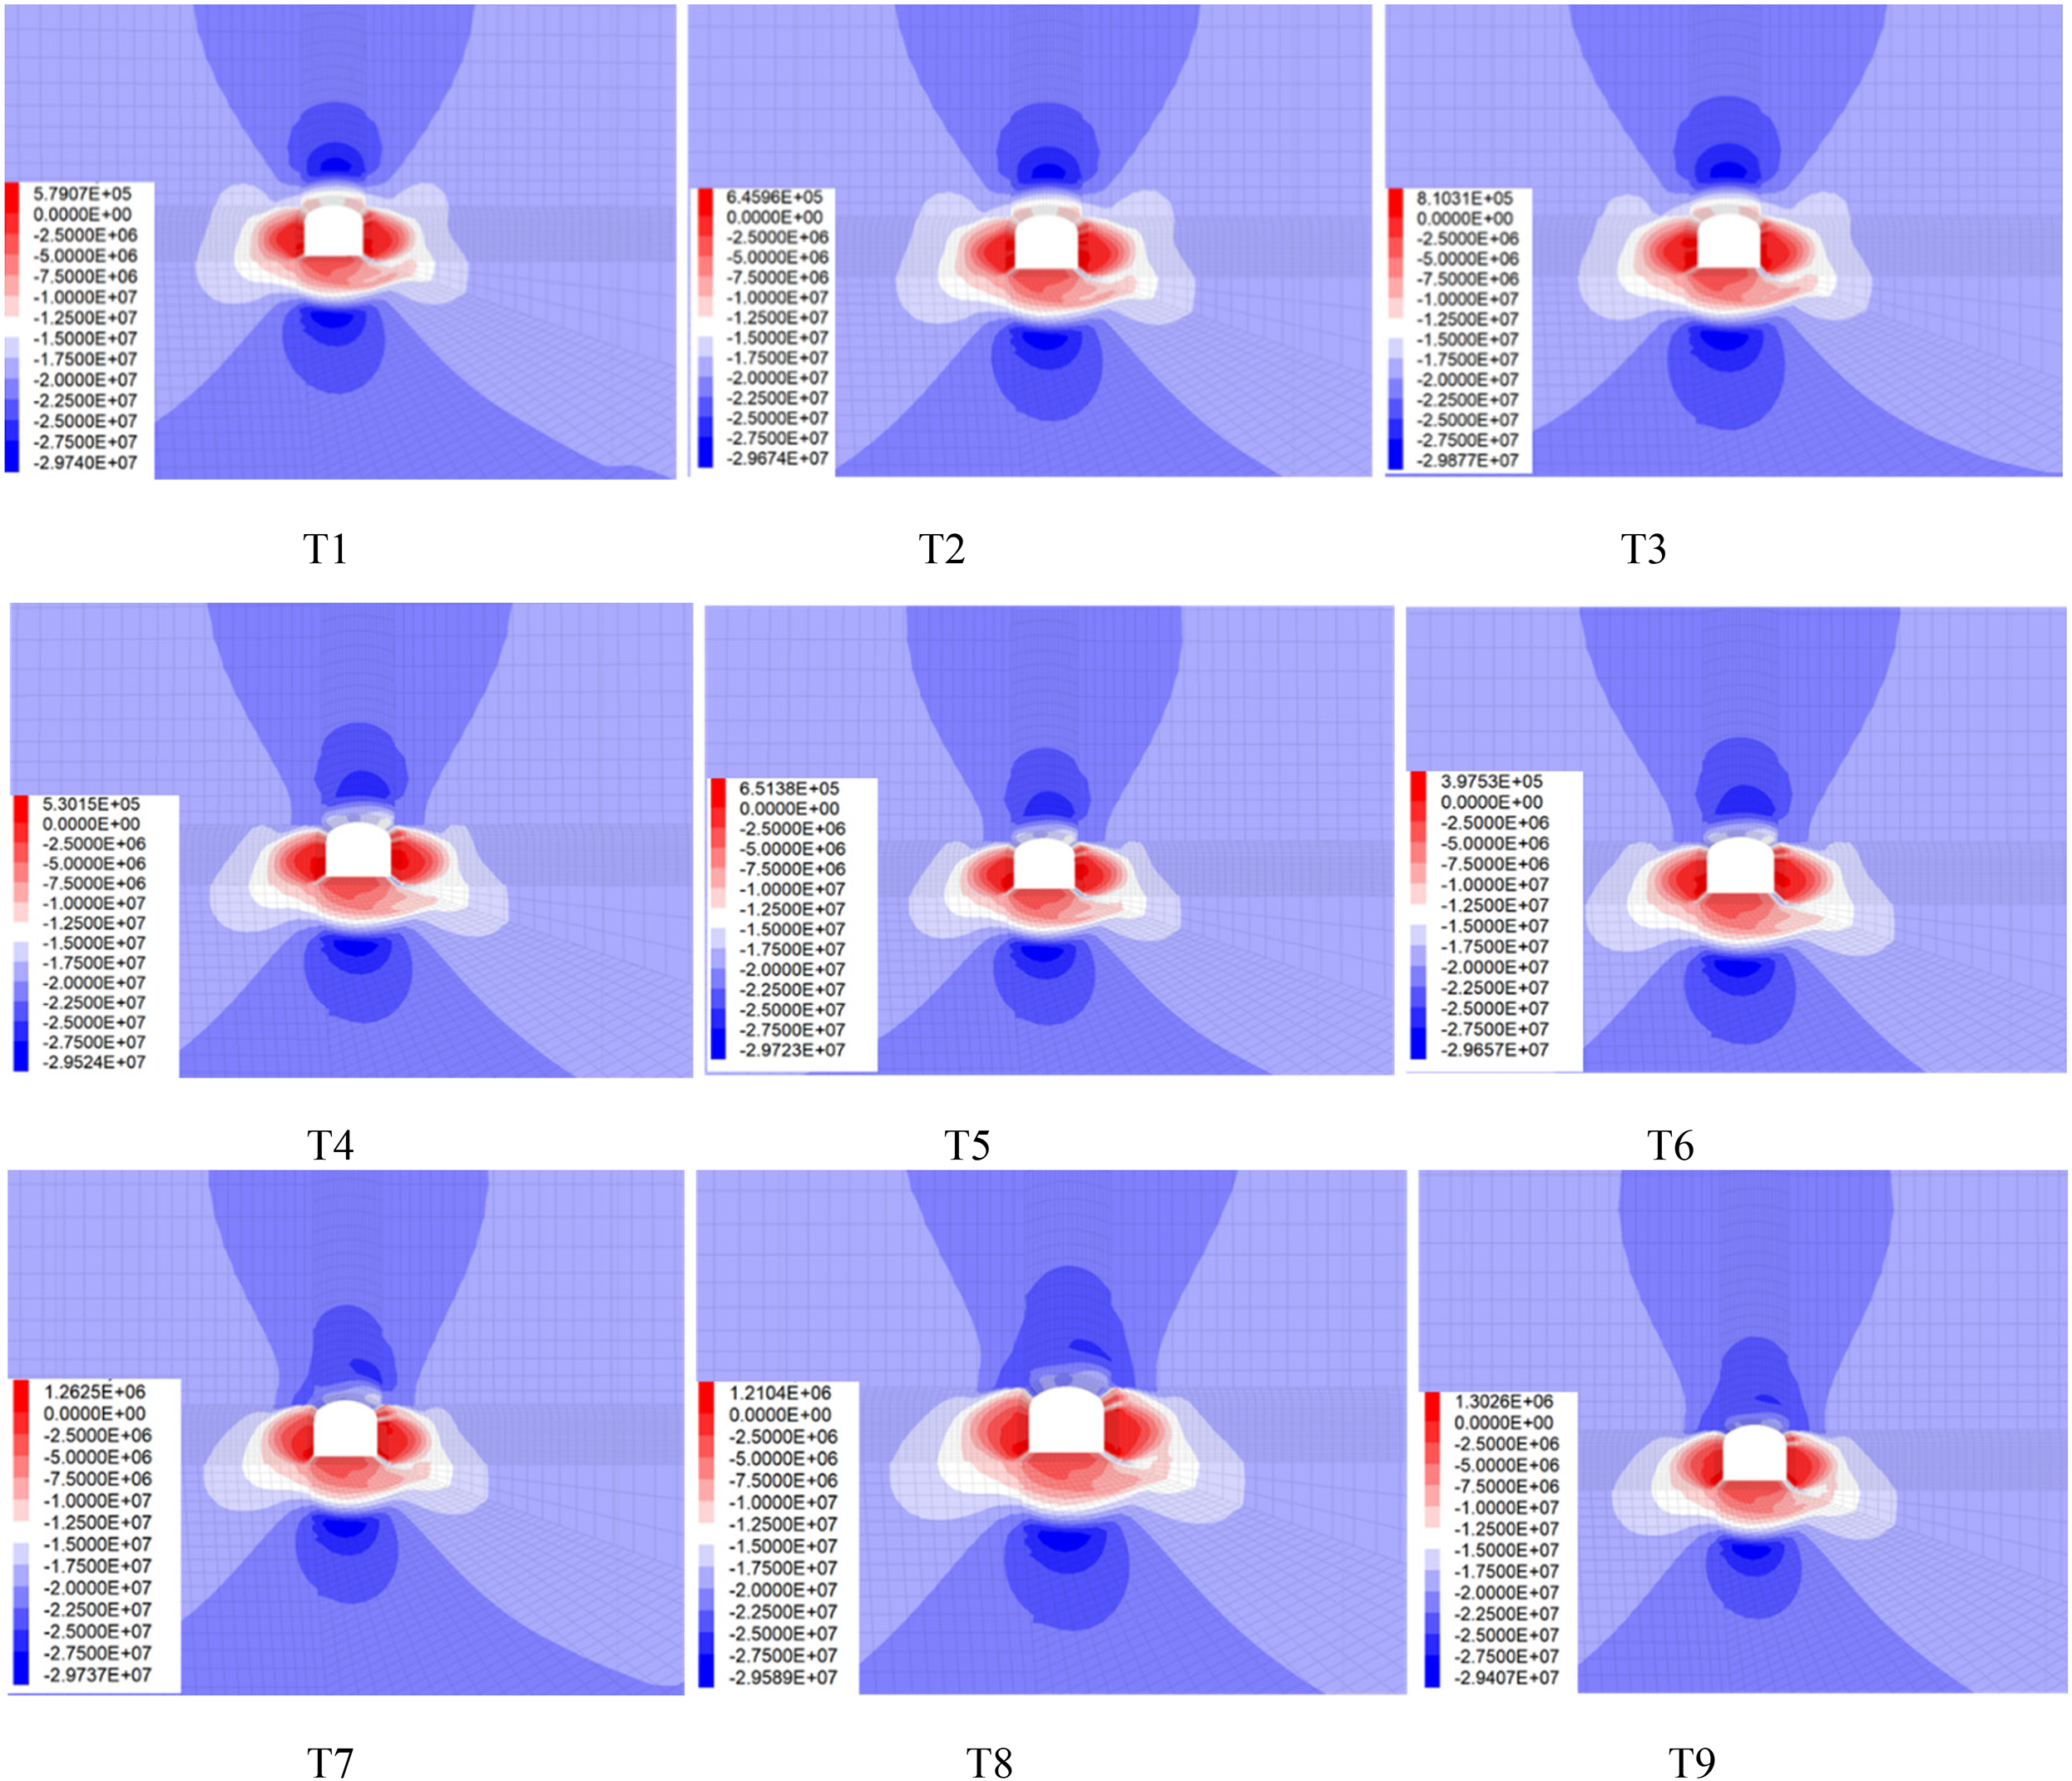
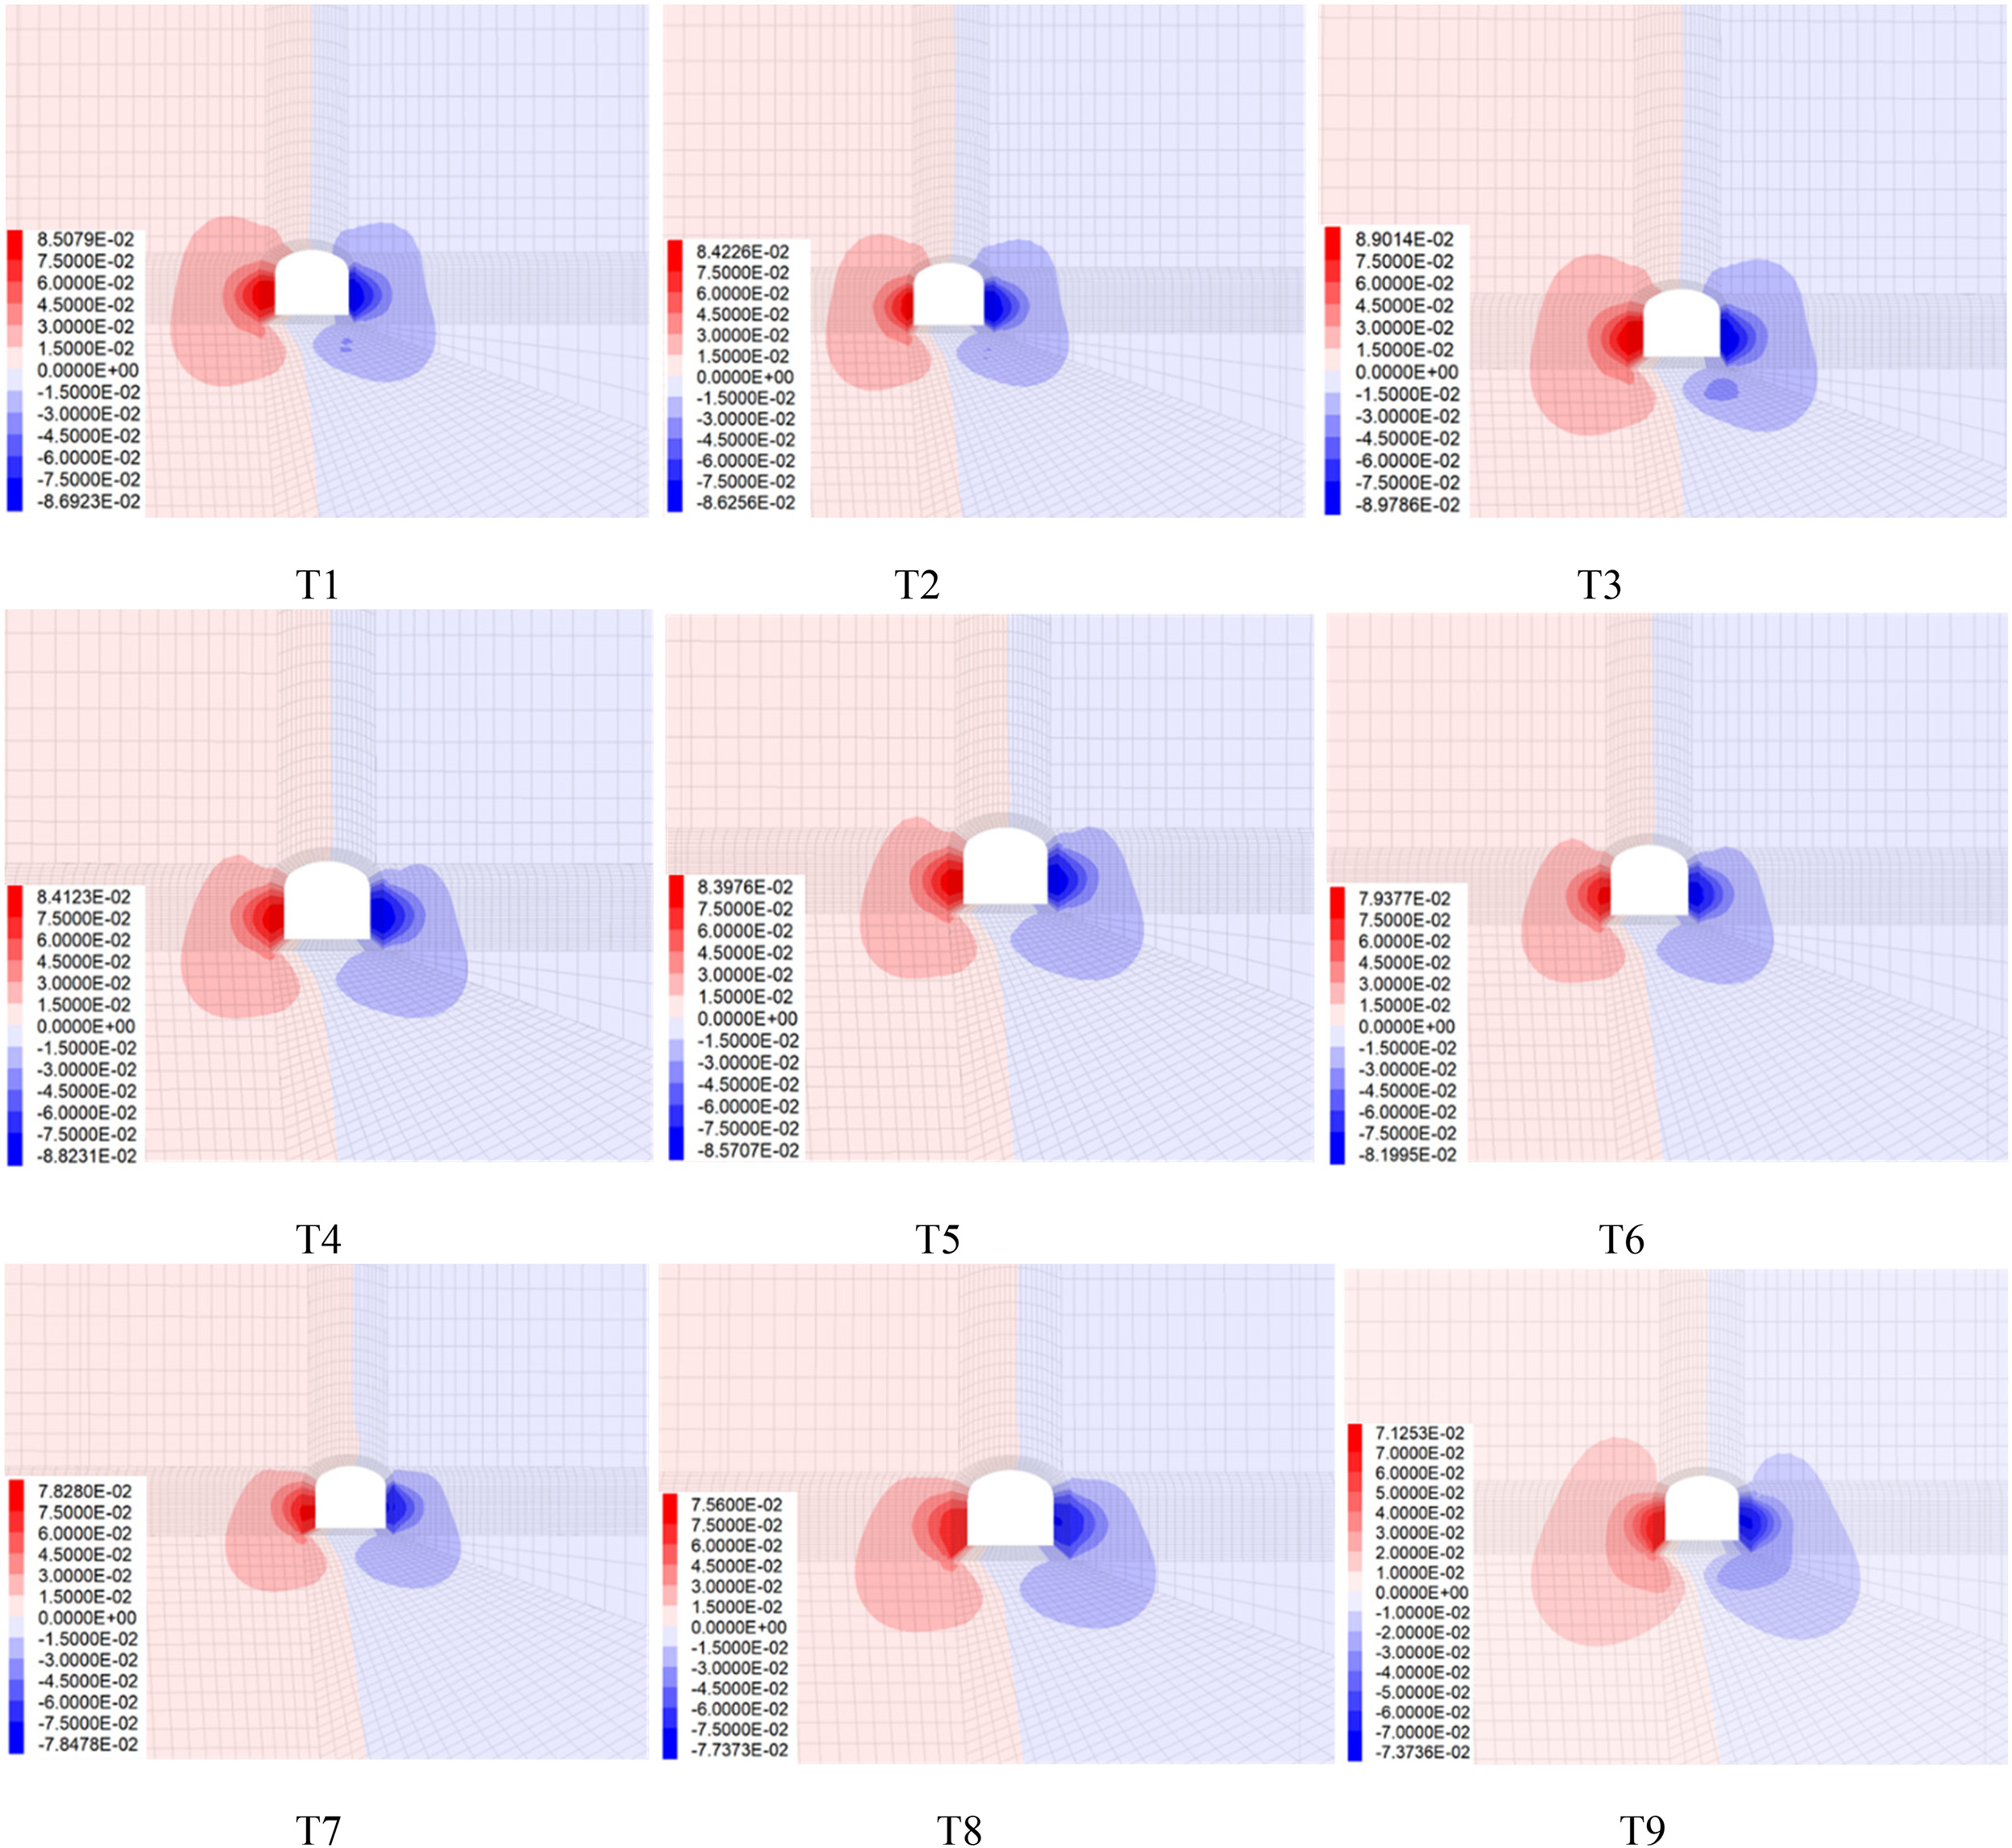
Calculations were carried out in FLAC3D software according to the above nine test scenarios, and after the model convergence, vertical slices were taken at 5 m in the y-direction for the horizontal displacement cloud and vertical displacement cloud in the calculation results, and the distribution map of the plastic zone of the surrounding rock of the roadway in each scenario, the vertical stress cloud, the horizontal stress cloud, the vertical displacement cloud, the horizontal displacement cloud, and so on, are shown in Figures 21∼25 each.
Distribution of plastic zone of roadway surrounding rock in each test scheme of roadway in vein.
Vertical stress cloud diagram of each test scheme of roadway in vein.
Horizontal stress cloud diagram of each test scheme of roadway in vein.

Vertical displacement cloud diagram of each test scheme of roadway in vein.

Horizontal displacement cloud diagram of each test scheme of roadway in vein.
The deformation of the roadway was monitored during the numerical calculation process, and the monitoring points were arranged at 5 m, 10 m, and 15 m in the y-direction of the model, and four deformations were monitored at each monitoring point for the top plate, the bottom plate and the two gangs of the roadway, and the average value of these data was obtained to get the data in Table 7. The deformation in the four directions of the roadway is added up to get the total deformation of the roadway, which acts as an index for orthogonal test analysis.
Deformation monitoring data table of roadway in all directions in vein.
The results of the tests for each support scheme are shown in Table 7.
The degree of influence of the four support parameters on the total displacement of the roadway (top plate + bottom plate + left gang + right gang displacement) was evaluated using the method of extreme variance analysis, as shown in Table 8. Due to space constraints, only the table of total displacement principal control factors polar analysis is presented in this article.
Range analysis table of main controlling factors of total displacement.

From the calculation results of the main control factors, it can be seen that the degree of influence of the four support structure parameters on the amount of displacement in each direction of the roadway in the vein is as follows: total displacement, two gangs: the thickness of the spray slurry > anchor length > anchor spacing > anchor row spacing. Top plate: spray slurry thickness > anchor length > anchor spacing > anchor spacing.
Conclusion
With the existing support structure construction in place, the roof roadway of the ore body can improve the stress state of the surrounding rock, reduce the degree of stress concentration in the surrounding rock, effectively reduce the scope of the plastic zone, reduce the deformation value of the surrounding rock of the roadway, and effectively control the stability of the surrounding rock of the roadway, and the reliability of the support method of anchor net spraying is good.
The roadway within the vein of the ore body can improve the stress state of the peripheral rock in the right gang of the roadway and reduce the degree of concentration of stress in the peripheral rock, but it cannot effectively reduce the scope of its plastic zone.
For the roof roadway, the order of influence of each main control factor on the total deformation of the roadway is as follows: spray slurry thickness > anchor spacing > anchor length = anchor spacing, for the roof of the roadway: spray slurry thickness > anchor spacing > anchor length > anchor spacing, for the left gang of the roadway: spray slurry thickness > anchor spacing > anchor spacing > anchor length, for the right gang of the roadway: spray slurry thickness > anchor spacing > anchor length > anchor spacing. Anchor spacing.
For the roadway in the vein, the order of influence of each main control factor on the total deformation of the roadway and the two gangs is as follows: the thickness of the spray slurry > the length of the anchor rods > the spacing of the anchor rods > the spacing of the anchor rods, and the order of influence of each main control factor on the roof of the roadway is as follows: the thickness of the spray slurry > the length of the anchor rods > the spacing of the anchor rods > the spacing of the anchor rods.
The rock grading done in this study is based on the results of rock mechanics parameter tests, as well as the current structural surface of the mine and the stress state of the surrounding rock and other comprehensive calculations, etc. If the above conditions change, the mine can re-grade the rock body of the underground roadway project, and adopt targeted support measures.
Footnotes
Acknowledgements
Guizhou Provincial Science and Technology Support Program (No. QKHJC-ZK[2022] General 176)
Author contributions
Qinghe Lu: writing – original draft, methodology, investigation, data curation. Zhen Lu: writing – review and editing, supervision, conceptualization. Zhenzhi Liu: writing – original draft, methodology, investigation, data curation. Ke Li: writing – review and editing, supervision, conceptualization.
Funding
The authors disclosed receipt of the following financial support for the research, authorship, and/or publication of this article: This work was supported by the Ke Li (grant number Guizhou Provincial Science and Technology Support ).
Declaration of conflicting interests
The authors declared no potential conflicts of interest with respect to the research, authorship, and/or publication of this article.
Data availability statement
Data will be made available on request.