
Abstract
A moored floating platform has great potential in ocean engineering applications because the mooring system is necessary to keep a floating platform in the station. It relates directly to operational efficiency and safety of a floating platform. This study presents a comprehensive assessment of the dynamics of a moored semi-submersible in waves by performing model test and numerical simulation. First, a three-dimensional panel method was used to estimate the motion of a moored semi-submersible in waves. A semi-submersible is modelled as a rigid body with six degrees-of-freedom (6DOF) motion. Dynamic response analysis of a semi-submersible is performed in regular wave and irregular wave. Second, the model test is performed in various wave directions. An Optical-based system is used to measure 6DOF motion of a semi-submersible. Numerical results are compared with the experimental results in various wave directions. Wavelength and wave direction showed significant effects on the motion response of a semi-submersible in regular wave. Third, to obtain a better understanding of response frequencies, the time histories of motion responses in irregular wave are converted from the time domain to the frequency domain. Effects of the wave frequency component on motion responses and mooring dynamics are analyzed. Motion spectrum in irregular wave has a strong response to the natural frequency of a moored semi-submersible and the peak of wave frequency. Finally, exceedance probability is estimated to predict probable extreme values of motion responses of a moored semi-submersible as well as mooring dynamics.
Introduction
A moored floating platform has great potential in ocean engineering applications because the mooring system is required to keep a floating platform in the station. It relates directly to the operational efficiency and safety of a floating platform to reduce the risk of accident at sea. Thus, it is essential to find the effect of mooring configuration on motion response of a floating platform to provide guidance in selecting the best possible configuration of a mooring system in various wave directions. Many researchers have studied motion responses of floating platform with a mooring system. Natarajan and Ganapathy 1 have performed the experiment on moored ships to investigate the behavior of a moored ship under the load of waves and current. Xiao et al. 2 have investigated the heave, pitch and roll motions of the semi-submersible by performing the numerical simulation and experiment in random waves. Ma et al. 3 have analyzed the response of motion and mooring system in different sea states. In addition, the effect of the wind and wave load on the system was investigated. Xiao et al. 4 have studied wave run-up along the broad side of a single point moored Floating Production Storage and Offloading (FPSO) in oblique waves by conducting experiments. Montasir et al. 5 have studied the effect of mooring line configuration on dynamic responses of truss spar platforms using the numerical simulation. Jose et al. 6 have studied the influence of mooring lines on dynamics of floating wind turbine and tension in mooring lines. Catherine et al. 7 have investigated current-induced motion of a lifeboat with a single point mooring by performing experiment. Li et al. 8 have performed an experiment and simulation to predict the motion and dynamic responses of the semi-submersible in freak wave. Choi et al. 9 have investigated the coupled motion between the tension leg platform and the semi-submersible. An eigenvalue analysis was applied to investigate this coupled motion by performing numerical simulation and experiment. Xu et al. 10 have conducted the experiment and numerical simulation to investigate the performance of the mooring systems. In their study, the experiment was carried out in beam sea, head sea and quartering sea. Liang et al. 11 have proposed a simplification methodology for reducing mooring lines in a very large floating structure (VLFS) at a moderate water depth. In their study, a simplified mooring system was effective in designing to replace the original mooring system in a scale model. Junbo et al. 12 have conducted the experimental investigation to measure the drag of the cage and static deformation of a mooring system using a scale model. Xu et al. 13 have investigated on the hybrid mooring system for heaving-buoy wave energy converter. Several studies have analyzed mooring lines and responses of floating structures. Lin et al. 14 have investigated the effect of wave heading angle, mooring model and wave drift forces on the motion of the semi-submersible wind float by the numerical simulation. Wei et al. 15 have investigated the effects of the motion coupling on the resonance of the semi-submersible. In this paper, a mathematical model was proposed based on the potential theory to simulate the motion responses. An experiment was conducted to confirm the simulation results using a new mathematical model. Li et al. 16 have conducted the numerical simulation and the model test to investigate the second-order resonant motions of the semi-submersible in various sea states. In their numerical simulation, the quadratic transfer function was applied by the mean of the commercial boundary element method. Guo et al. 17 have conducted an investigation of the motion response of the dry tree semi-submersible by performing numerical and experimental studies. In their study, a lower pontoon was used to reduce the motion and tendon responses of the semi-submersible. Nevertheless, only a few studies have investigated the response of a moored semi-submersible in regular wave and irregular wave in various wave directions. The primary objective of this study is to investigate a comprehensive assessment of the dynamics of a moored semi-submersible in waves by performing model test and numerical simulation. A three-dimensional panel method is used to estimate the dynamic response analysis of a semi-submersible in waves. In addition, the model test is performed in various wave directions. An Optical-based system is used to measure 6DOF motion of a semi-submersible. Numerical results are compared with experimental results in various wave directions. Effects of wavelength and wave direction on the motion response of a semi-submersible in regular waves is discussed. Effects of the wave frequency component on the motion responses of a moored semi-submersible are analyzed.
Numerical method
Governing equation
In this study, the motion response of a ship in regular wave was calculated by the three-dimensional panel method based on the potential theory. If the fluid is assumed incompressible, inviscid and irrotational, the governing equation becomes a Laplace equation. The velocity potential that satisfies the Laplace equation, free surface, bottom and body boundary condition is estimated to calculate the pressure distribution acting on the ship hull. Eq. (1) is the three-dimensional Laplace equation for the velocity potential. Eq. (2) is the classical linear free-surface condition for steady-state harmonic oscillatory motion of wave frequency. For mean wetted hull surface and sea floor surface, boundary conditions are estimated by Eqs. (3)∼(4). The bottom boundary condition is considered in Eq. (3), there is no flow through the seabed.


Dynamic of mooring lines
Mooring line dynamics are modelled by the lumped-mass method using a discretization along the length and an assembly of the mass. The mooring line is modelled by the Morison element as a chain under the influence of different external forces. A single element of a mooring line subjected the distribution of external hydrodynamic, structural and inertia loading as shown in Figure 1. Equation of motion for a single element of the mooring line can be estimated by Eq. (21).


Modelling of mooring lines. a) Modeling of a dynamic mooring line. b) Forces on a mooring element.
The element buoyant force matrix can be estimated by Eq. (24).


Equation of semi-submersible motion
In order to investigate the six-degree of freedom (6DOF) motion of the semi-submersible, we assumed that the body is rigid and in a state of stable equilibrium in a calm water. By considering hydrodynamic forces acting on the body, the equation of motion can be obtained by Eq. (27). The total hydrodynamic load

Experiment
Experimental method
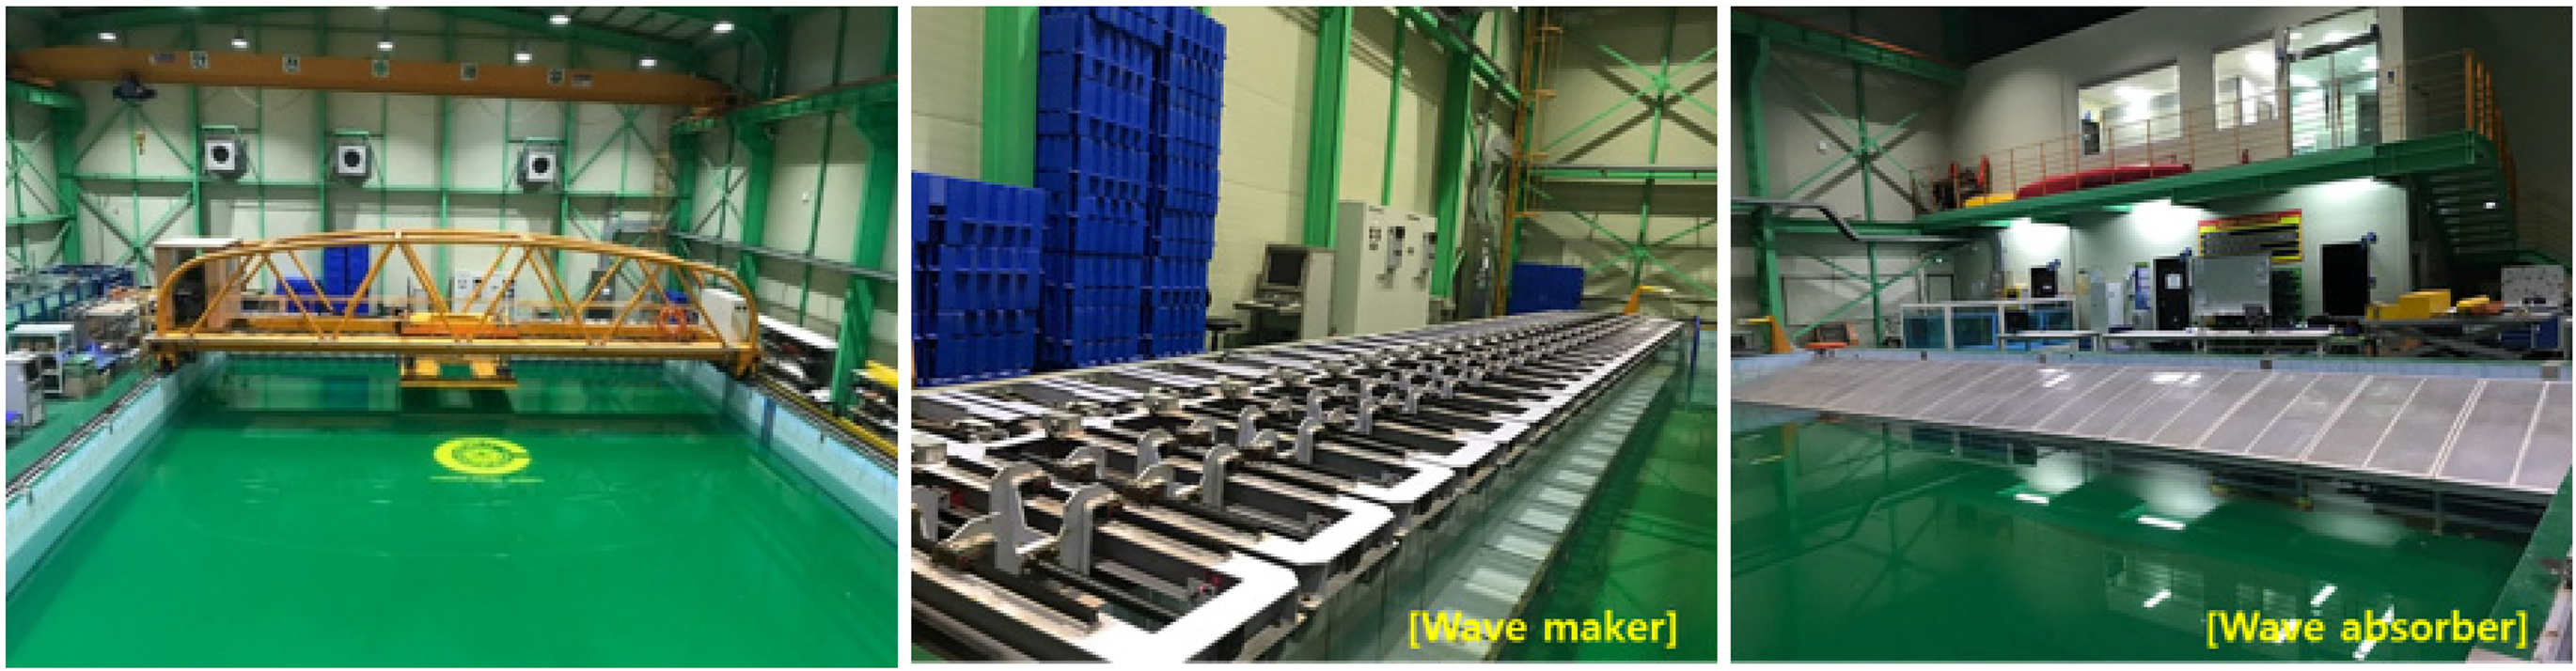
A scaled model of the semi-submersible was carried out in square wave basin at the Ship Dynamics and Control Laboratory in Changwon National University (CWNU). Figure 2 shows the square wave basin, the wave generation system and wave absorber at CWNU. The square wave basin has a length of 20 m, a width of 14 m and a maximum water depth of 1.8 m. The carriage's fastest speed is 1.0 m/s. Both regular and irregular waves can be generated with a wave generation system. The wave generation system can generate waves with period ranging from 0.5s to 30s. A wave absorber was installed at the furthest end of the square wave basin to effectively dissipate waves. The maximum wave height and wavelength are 30 cm and 3 m, respectively. Instruments used in this experiment are shown in Figure 3. Wave elevation was evaluated using a CHT6-50E wave probe, as illustrated in Figure 3a. The wave probe was utilized to calibrate the wave elevation at the semi-submersible position before the experiment. Tension gauges were used to measure the pretension of the mooring lines. The tension gauge used in this experiment is shown in Figure 3b. The motion of the semi-submersible was measured by a non-contact 6DOF measurement system, consisting of an OptiTrack camera and a data acquisition system. The OptiTrack V120-Trio is the model of OptiTrack camera utilized in this experiment, as shown in Figure 3c. NaturalPoint was the business that developed it. The area available for tracking markers is 5.2m long, 4.3m wide and 4.6m high from the center of the OptiTrack camera. Figure 5d shows the NI USB-6212 A/D converter (National Instruments Corporation) used during this experiment. An A/D converter was used to convert an electrical signal from the wave probe and tension gauges into a digital signal. The 6DOF of the semi-submersible was measured by the optical-based system. In order to record the motion of rigid body, a detailed hypothesis and standard of the optical-based system presented by Filho 18 were used.
Square wave basin in CWNU.

Measurement instruments.

Model of the semi-submersible.
Figure 4 shows the processing of an optical-based system to measure the 6DOF motion of the semi-submersible. There are four steps in the process of measuring the 6DOF motion. To start, markers are appended on the semi-submersible. In the initial step, the Image Acquisition utilized an OptiTrack Camera to catch pictures of markers. Quickly, the situation of markers is progressively distinguished based on the marker location. To help this cycle, the OptiTrack Camera presented an aides programming called Motive which was created by the NaturalPoint company. These markers are identified by utilizing auto labelling. The auto labelling will decide identified focuses. It is related to markers in the caught picture. The auto labelling on the next frames will be naturally refreshed dependent on the underlying naming of the primary edge. To keep away from the secret corner of the marker, a spherical marker is utilized for the following items. The OptiTrack camera utilized new advantaged advancements to follow the movement with a high exactness at an extremely high testing rate. On the following stage, a three-dimensional (3D) position recreation is utilized to obtain 3D focuses from two-dimensional (2D) acquired from the picture. Then 3D position remaking was identified by setting up a connection between markers recognized in the picture of various perspectives. In this cycle, space resection is one of the direction errands of PC vision and photogrammetry. In the event that three markers are recognized, and an inflexible body is made on a picture, its 2D point areas will decide a picture plane. From catching pictures, the 3D situation of the markers is remade from the 2D situation of the markers by space resection. Displacements are determined as the displacement of the markers. Rotations are determined as the rotation of the image plane created by three markers. At last, the 6DOF motion of the semi-submersible in waves is obtained. The estimation handling of the 6DOF rigid body is displayed in Figure 4.

Measurement processing of 6DOF of the semi-submersible.
Description of model and test conditions
The model scale was set at 1:100 due to the wave generation system's limitation for large waves at big model scale. The scale factor was determined using Froude's law of similarity. As illustrated in Figure 5, the model of the semi-submersible has two demi-hulls with a separation of 0.52 m between their centers. Main parameters of the semi-submersible are summarized in Table 1. Four mooring lines are designed to moor the semi-submersible. To investigate the moored semi-submersible's hydrodynamic performance in various wave directions, model test was done in regular and irregular waves. Totally, ten wave conditions were considered, including seven regular wave conditions and three irregular wave conditions. In regular wave conditions, wavelengths were varied from


Comparison of ITTC wave spectrum at model scale.
Principal dimensions of the semi-submersible.

Regular wave conditions.

Irregular wave conditions.

Natural frequency of model scale and full scale.

Mooring setup
In this experiment, the mooring system was studied, including chain, polyester and optical fiber. The length of chain, polyester and optical fiber are 0.3m, 2.5m and 0.25m, respectively. Table 5 summarizes main properties of mooring line segments. A turnbuckle is used to adjust the pre-tension on the mooring lines in a consistent manner. The stiffness of the mooring system is calculated from component stiffnesses of chain 

Main properties of mooring line segments.

The dynamic response of a mooring line is scale-dependent, making it difficult to obtain perfect dynamic similarities between prototypes and model tests. To achieve dynamic similarity, three parameters corresponding, including the length scale, the diameter scale and scale of wave in model celerity must be equal to those in prototypes. The length scale 

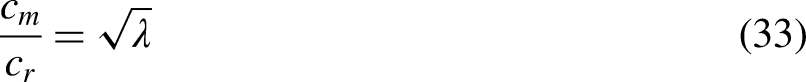

Wave celerity c is the propagation celerity of longitudinal elastic waves.
Experimental setup
Figure 7 shows a detailed mooring setup of the semi-submersible in wave direction of 90 degrees. The model was fixed by a system of 4 mooring lines that tied symmetrically through x and y axes of the hull. Turnbuckle, optical fiber, tension gauge, polyester and chain are all parts of the mooring system. A 20 kg weight at the bottom of the square wave basin locks the mooring system to the bottom of the tank. The pre-tension applied to the moorings is adjusted consistently to guarantee that the semi-submersible is not hampered by tension differences between mooring lines. The tension of four mooring lines is monitored by four tension gauges to check the pretension of mooring lines before performing the experiment. To manage the tension of the mooring line, the turnbuckle was linked to the mooring line and the tension gauge. Figure 8 shows a real experimental setup that comprises a semi-submersible model, mooring line, tension gauge and an OptiTrack camera. The model and the mooring systems are rotated to create varied wave directions acting on the hull while changing the direction of waves acting on the hull. In this experiment, the water depth is 1.5 m, the scale mooring setup of the semi-submersible is considered in wave direction 180 degrees. In this experiment, the model of the semi-submersible is installed in the center of the square wave tank as shown in Figure 8. The wave generation system is codirectional at the zero heading angle. Tension gauges of four mooring lines are denoted by numbers 1, 2, 3, 4. During the test, a wave probe is utilized to measure the wave height. The wave probe is positioned ahead of the model's location and fastened in this place. Three makers are positioned in the semi-submersible main deck's center. As indicated in Figure 8, the measuring equipment is designated by the number 5. A OptiTrack optical-based system is used to measure the motion of the semi-submersible. The OptiTrack camera is mounted on the carriage above the semi-submersible and records the movement of markers on the deck of the semi-submersible. A set of three markers connected to the semi-submersible are tracked by three stationary cameras.

Diagram showing the mooring setup of the semi-submersible.

Diagram showing the experimental setup of the semi-submersible in wave tank.
Results and discussion
Motion response of semisubmersible in regular wave
The 6DOF motion of the moored semi-submersible is directly related to the operational efficiency and safety of the floating platform. Thus, it is studied and discussed to minimize the incidence of an accident at sea. The duration of the model test in regular waves was at least 10 times the corresponding wave period as recommended by ITTC. 20 Results of the surge and sway amplitude variation with incident wave amplitude are illustrated in Figure 9 to make it much easier to examine the influence of the mooring system on surge and sway. Figure 9 shows Response Amplitude Operators (RAOs) of the semi-submersible in surge and sway obtained from the model test and the numerical simulation in various wave directions. Numerical simulation results for surge and sway are generally similar to experimental results.

Surge RAO and sway RAO of the semi-submersible.
The surge is most noticeable in the head sea, accompanied by the following sea. It gradually diminishes in the beam sea. Because the surge is well correlated with the vertical motion of the water surface in head sea and the moored semi-submersible moves backward away from the incident waves before going forward. However, the incident wave moves the excursion to the moored semi-submersible in the beam sea. As a result, sway is significantly greater than the response in surge in oblique sea and beam sea. The largest surge RAOs of semi-submersible occurs in head sea and following sea. RAOs of surge increases dramatically when the wavelength is larger than 1.5 times the semi-submersible's length. In contrast, the sway RAOs is the greatest in beam sea. It reduces when the wave direction reaches to head sea and following sea. Surge RAOs from experimental and numerical results are very similar in the short wavelength. Some surge and sway RAO discrepancies were most likely caused by ignoring nonlinearities, resulting in a decrease in the accuracy of hydrodynamic forces in the horizontal plane. Nevertheless, the numerical simulation accurately captured variations in wave-induced motions as a function of wave direction and wavelength. It was discovered that displacements of the moored semi-submersible are strongly influenced by the mooring system and the direction of the incident wave. Figure 10 shows motion RAOs of the semi-submersible in heave and roll obtained from the model test and the numerical simulation in various wave directions. The simulation results of the heave RAO and roll RAO are similar to the experimental results. Based on these results, it can be seen that the numerical simulation correctly predicted the hydrodynamic force which include the wave excitation forces and mooring forces acting on the structure. The heave RAO has a small value in short wavelength. However, it has a large values in various wave directions as the wavelength increases and is greater than the length of the semi-submersible. This is because the heave is directly associated with the vertical motion of the water surface in various wave directions. The majority of the motion of the moored semi-submersible is coupled with the heave. However, the roll RAO is the most noticeable in the beam sea, accompanied by the oblique sea. It gradually diminishes in the head sea and following sea. This is because the wave frequency is close to the natural frequency of the roll and the sway is coupled with the roll of the moored semi-submersible. Figure 11 shows motion RAOs of the semi-submersible in pitch and yaw obtained from the model test and the numerical simulation in various wave directions. The simulation result of the pitch RAO is similar to the experimental result. Based on these results, it can be seen that the numerical simulation correctly predicted the hydrodynamic force including wave excitation forces and mooring forces acting on the structure. Some yaw RAO discrepancies were most likely caused by ignoring nonlinearities, resulting in a decrease in the accuracy of hydrodynamic forces in the horizontal plane. Nevertheless, the numerical simulation accurately captured the variations in wave-induced motions as a function of wave direction and wavelength. Pitch RAO has a small value in short wavelength, but has a large value in various wave directions as the wavelength increases and is greater than the length of the semi-submersible. The pitch RAO is most noticeable in the beam sea and following sea, accompanied by the oblique sea. It gradually diminishes in the beam sea. This is because the pitch is coupled with the surge of moored semi-submersible. The yaw of the moored semi-submersible is the smallest in the head sea, following sea and beam sea. It becomes the largest in the oblique sea. This could be due to the effect of the incident wave's direction, which pushes the moored semi-submersible against mooring lines as the wave propagates away.
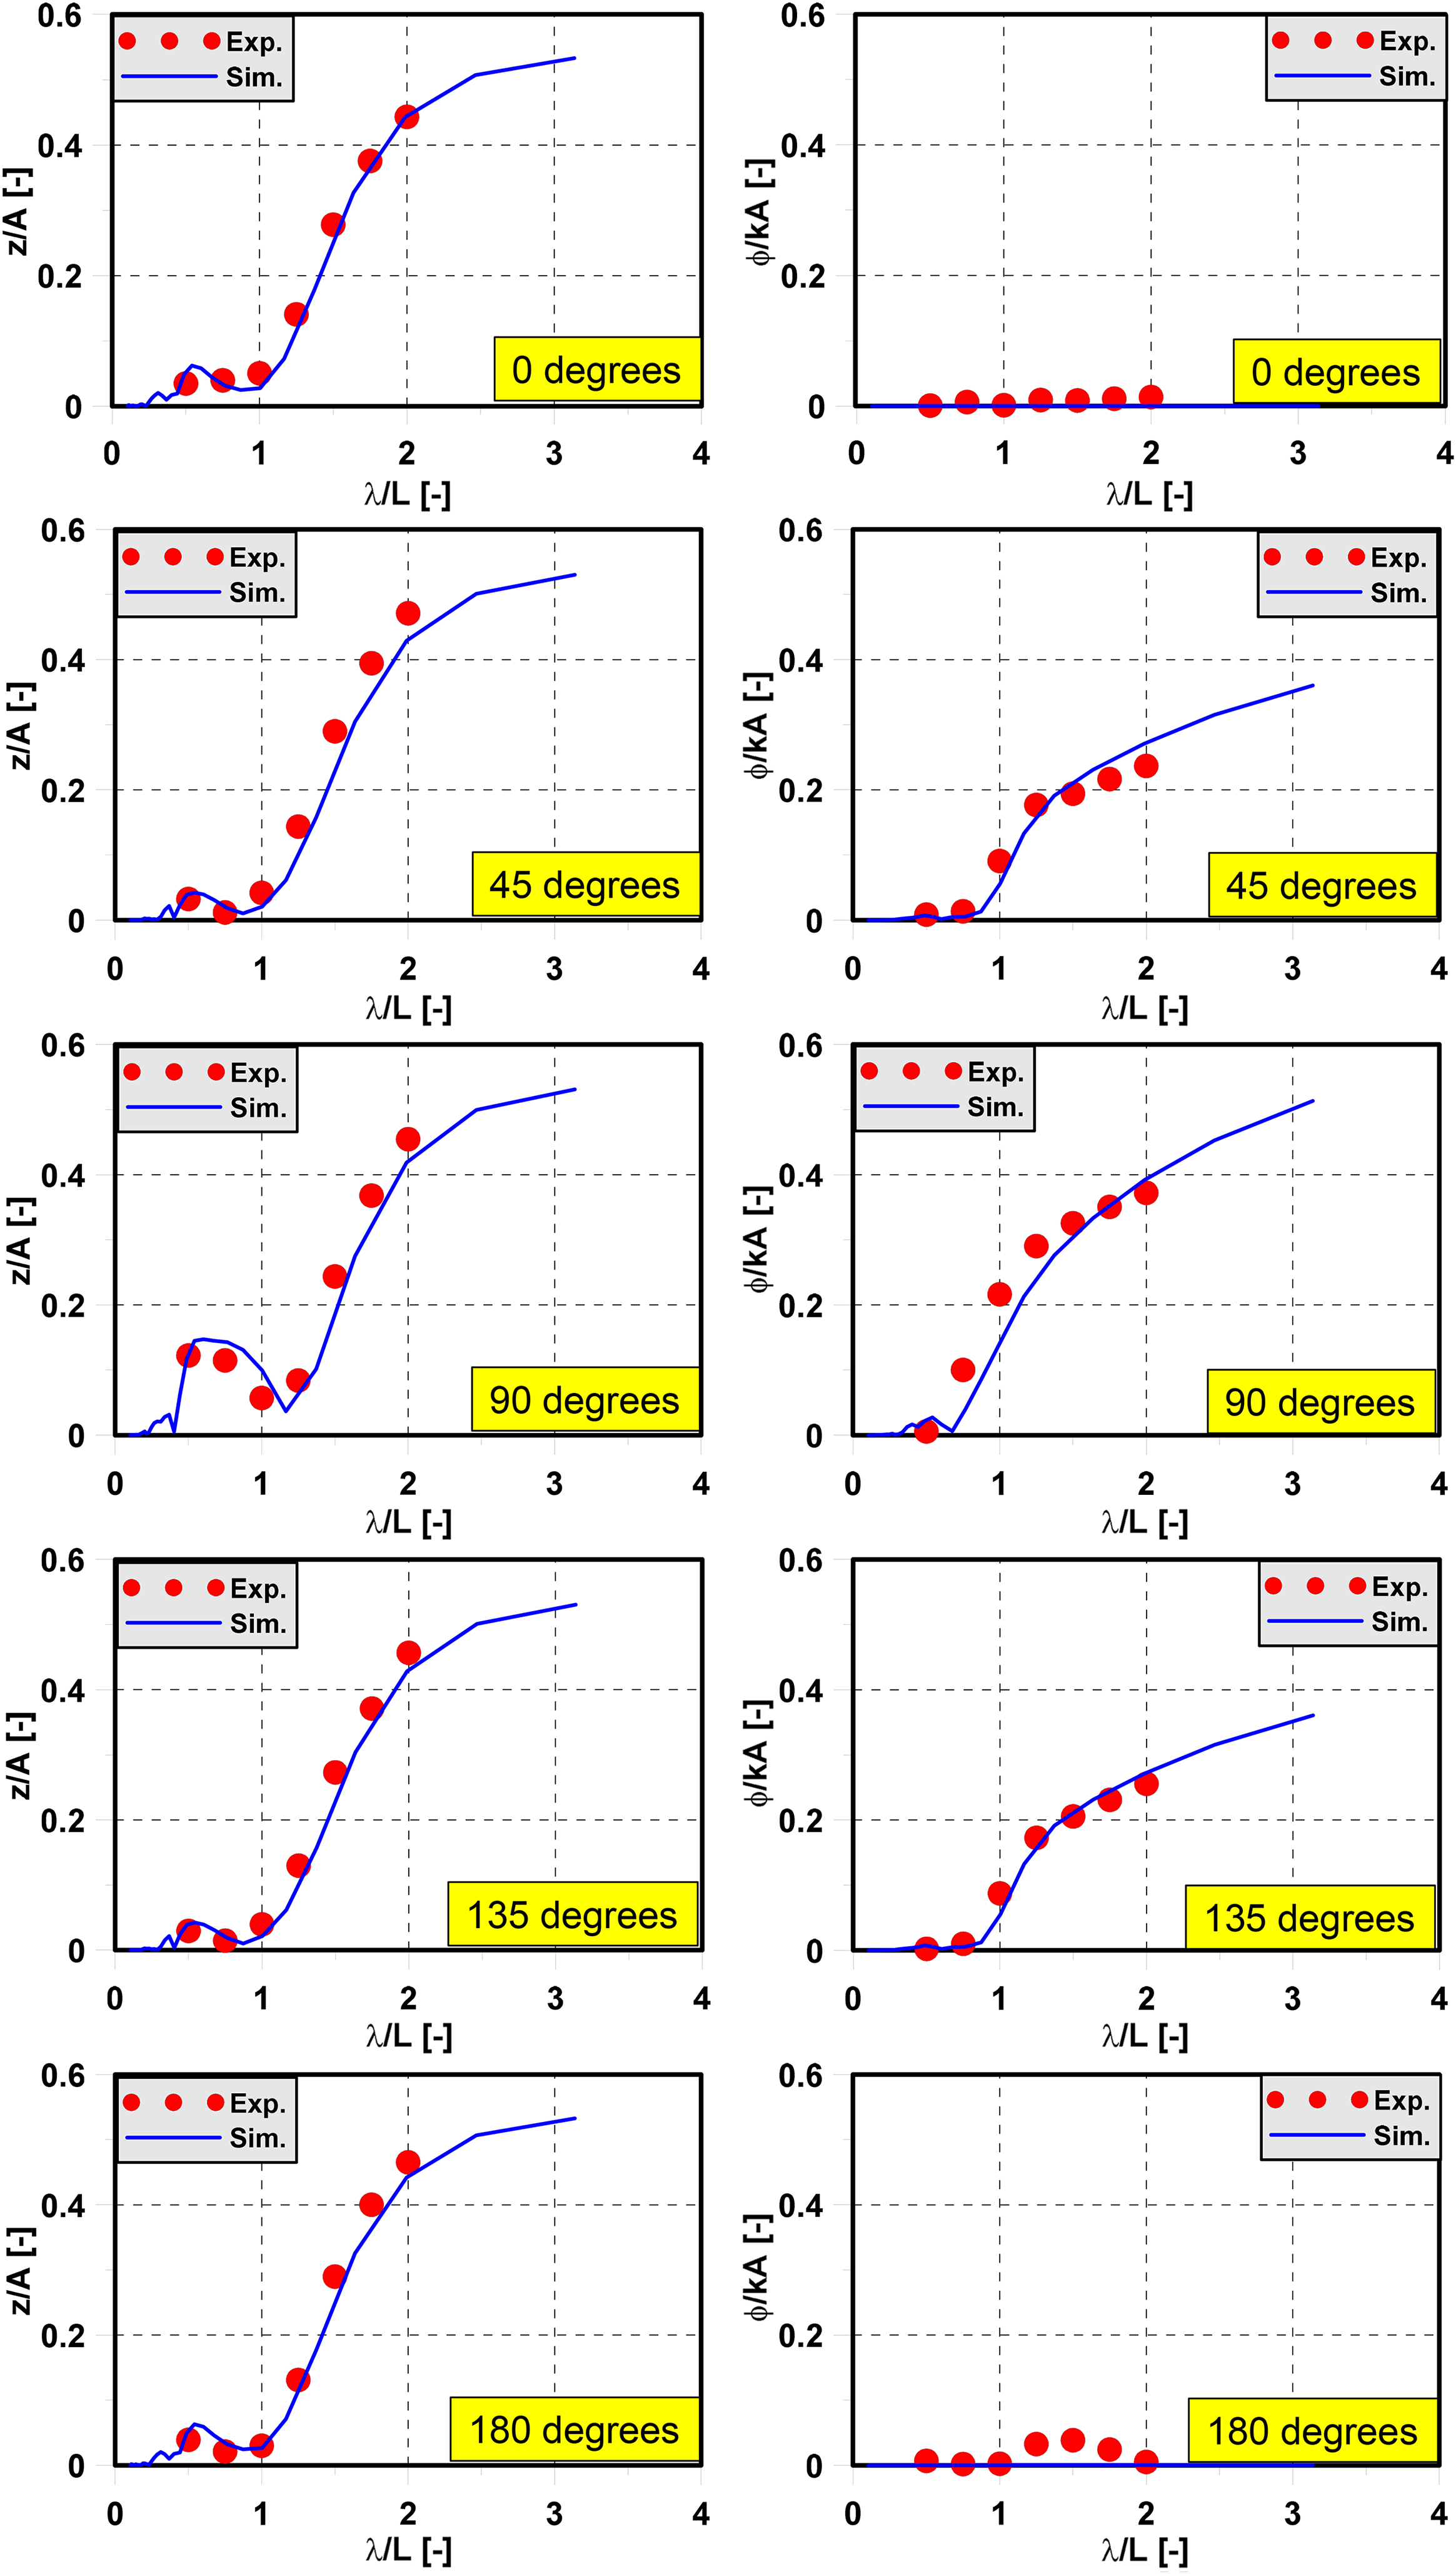
Heave RAO and roll RAO of the semi-submersible.

Pitch RAO and yaw RAO of the semi-submersible.
Motion response of semi-submersible in irregular waves
In irregular waves, the motion spectrums of the semi-submersible were investigated. The wave test was performed prior to the experiment to ensure the quality of the wave. The difference in significant wave height between measured and target significant wave height is 0.04%. As a result, the wave quality is sufficient to perform the seakeeping test in an irregular wave. The model test was carried out in various wave directions. Motions signal of the semi-submersible for each test were recorded during the experiment. The sampling time to analysis was for each test was 200s, which equals to 2000s in full scale. Under irregular waves, the time history of motion responses of the moored semi-submersible was recorded at a frequency of 100 Hz. Spectral analyses were performed for measured time histories to determine frequency-domain characteristics of motions.
Hence, time history of motion responses are transformed from the time domain to the frequency domain to gain a better understanding of response frequencies. Figures 12∼14 show effects of the frequency component on motion responses induced by wave excitation in irregular waves. Figures 12∼14 show motion spectrum in various wave directions at sea state 4, sea state 5 and sea state 6, respectively. In sea state 4, the surge spectrum has the three peaks. The 1st peak of surge spectrum occur in low frequency. This is because the surge storing force of the mooring system has large effects due to 2nd wave drift force. The 2nd peak of surge spectrum occurs near the peak of target wave spectrum. The 3rd peak of surge spectrum occurs near the natural frequency of the mooring system. It can be confirmed that the surge is mainly at low frequency. However, the wave frequency cannot be neglected. Surge spectrum is dominant in head sea and following sea, while sway spectrum is dominant in beam sea. Sway spectrum has three peaks. The 1st peak of sway spectrum occurs at low frequency in beam sea. The 2nd peak of surge spectrum occurs near the peak of target wave spectrum. The 3rd peak of sway spectrum is observed at the natural frequency of the mooring system. As a consequence, the peak of heave spectrum at the wave frequency increases gradually until it reaches the peak. This confirmed that the heave is dominated by the natural frequency of the heave. The effect of the natural frequency of heave is stronger than the peak of wave frequency. The roll spectrum is dominated by the natural frequency of the roll. Peak of the roll spectrum is close to the natural frequency of the roll. The peak of roll spectrum is dominant in beam sea, the effect of peak of wave spectrum is weaken with natural frequency of the roll. The pitch spectrum also has three peaks. The 1st peak is close to the natural frequency of pitch. 2nd peak occurs at peak of wave spectrum. 3rd peak of surge spectrum occurs near the natural frequency of mooring system. It mean that the pitch is dominated by natural frequency of the pitch. The effect of peak of wave spectrum is weaken with the natural frequency of the pitch. The yaw spectrum is smaller than the roll and pitch spectrum in various sea states and various wave directions. It indicates that the wave direction has a direct effect on the motion response of the semi-submersible. The extreme surge depends on the type of sea state and the wave direction, while heave is dominated by wave frequency component only. This is because the surge is usually affected by the low frequency component which causes a non-linear wave force. In sea state 5 and sea state 6, the roll spectrum and the pitch spectrum are opposite phenomenon. In beam sea, the roll spectrum is the largest, while the pitch spectrum is the smallest On the other hand, the pitch spectrum is largest in head sea and following sea, while the roll spectrum is the smallest The surge and sway are coupled with pitch and roll, respectively. Hence, the surge and sway have the same tendency as the pitch and roll, respectively. In addition, the 1st peak value of pitch spectrum occurs at pitch natural frequency. The 2nd peak value of pitch spectrum occurs at natural frequency of heave and the 3rd peak value of pitch spectrum occurs at wave peak frequency. The geometry of the semisubmersible is nearly identical at bow and stern. As a result, the motion spectrum in the head sea is similar to that in the following sea. Furthermore, the motion response in the bow quartering sea is equivalent to that in the stern quartering sea. Surge and pitch motions of the semi-submersible have largely been influenced by the 2nd wave loads in head sea and following sea. In contrast, sway and roll responses have a dominant influence in beam sea. The sway and roll responses are reduced by half when the wave direction is toward the oblique sea compared with ones in beam sea. The direction of the wave has small effect on the heave response. The heave response in the oblique sea is greater than that in other wave directions, although the difference is not significant. The yaw response is greatly influenced by the wave load in the oblique sea. However, the yaw response is nearly zero in the beam sea because the geometry of the semi-submersible is the same at bow and stern.

Motion spectrum of the semi-submersible at sea state 4. a) Surge b) Sway c) Heave d) Roll e) Pitch f) Yaw.

Motion spectrum of the semi-submersible at sea state 5. a) Surge b) Sway c) Heave d) Roll e) Pitch f) Yaw.

Motion spectrum of the semi-submersible at sea state 6. a) Surge b) Sway c) Heave d) Roll e) Pitch f) Yaw.
Exceedance probability
Based on ITTC procedures, 21 the exceedance probability can be calculated to predict likely extreme values of the moored semi-submersible's motion responses. After sorting peak values of motions induced by wave excitation in irregular waves, exceedance probability can be estimated. Figures 15∼17 show exceedance probability distribution for motions induced in irregular waves based on sea conditions and wave directions. Using a statistical analysis and an exceedance probability distribution, the return period that occurs during an extreme motion can be estimated. Compared to other wave directions and sea conditions, the exceedance probability distribution of the surge in head sea and following sea gradually shifted to the right. This suggests that the surge at sea state 4 and sea state 5 have less extreme values than that at sea state 6. This implies that the sea state is the most important factor in determining the value of the surge. The exceedance probability distribution of the sway in beam sea gradually shifted to the right when compared to other wave directions and sea conditions. This suggests that the sway at sea state 4 and sea state 5 have less extreme values than that at sea state 6, implying that the sea state and the beam sea are the most important factors in determining the value of the sway. The exceedance probability distribution of the heave gradually shifted to the right and the heave changes independent of different wave directions compared with other wave directions and sea conditions. This implies that the heave is influenced less by wave direction but more by sea conditions. The exceedance probability distribution of the heave occurs in sea state 6. The exceedance probability distribution of the roll in beam sea gradually shifted to the right compared to other wave directions and sea conditions. This suggests that sway is coupled with the roll in various wave directions and sea conditions, implying that the sea state and beam sea are the most important factor in determining the value of the roll. The exceedance probability distribution of the pitch in beam sea gradually shifted to the right when compared to other wave directions and sea conditions. This implies that the surge is coupled with the pitch in different wave directions and sea conditions, implying that the sea state, following sea, and head sea are the most important factors in determining the pitch value. Compared to other wave directions and sea conditions, the exceedance probability distribution of the yaw in oblique sea gradually shifted to the right. This suggests that the sway at sea state 4 and that at sea state 5 have less extreme values than those at sea state 6, implying that the sea state and oblique sea are the most important factor in determining the value of the yaw.
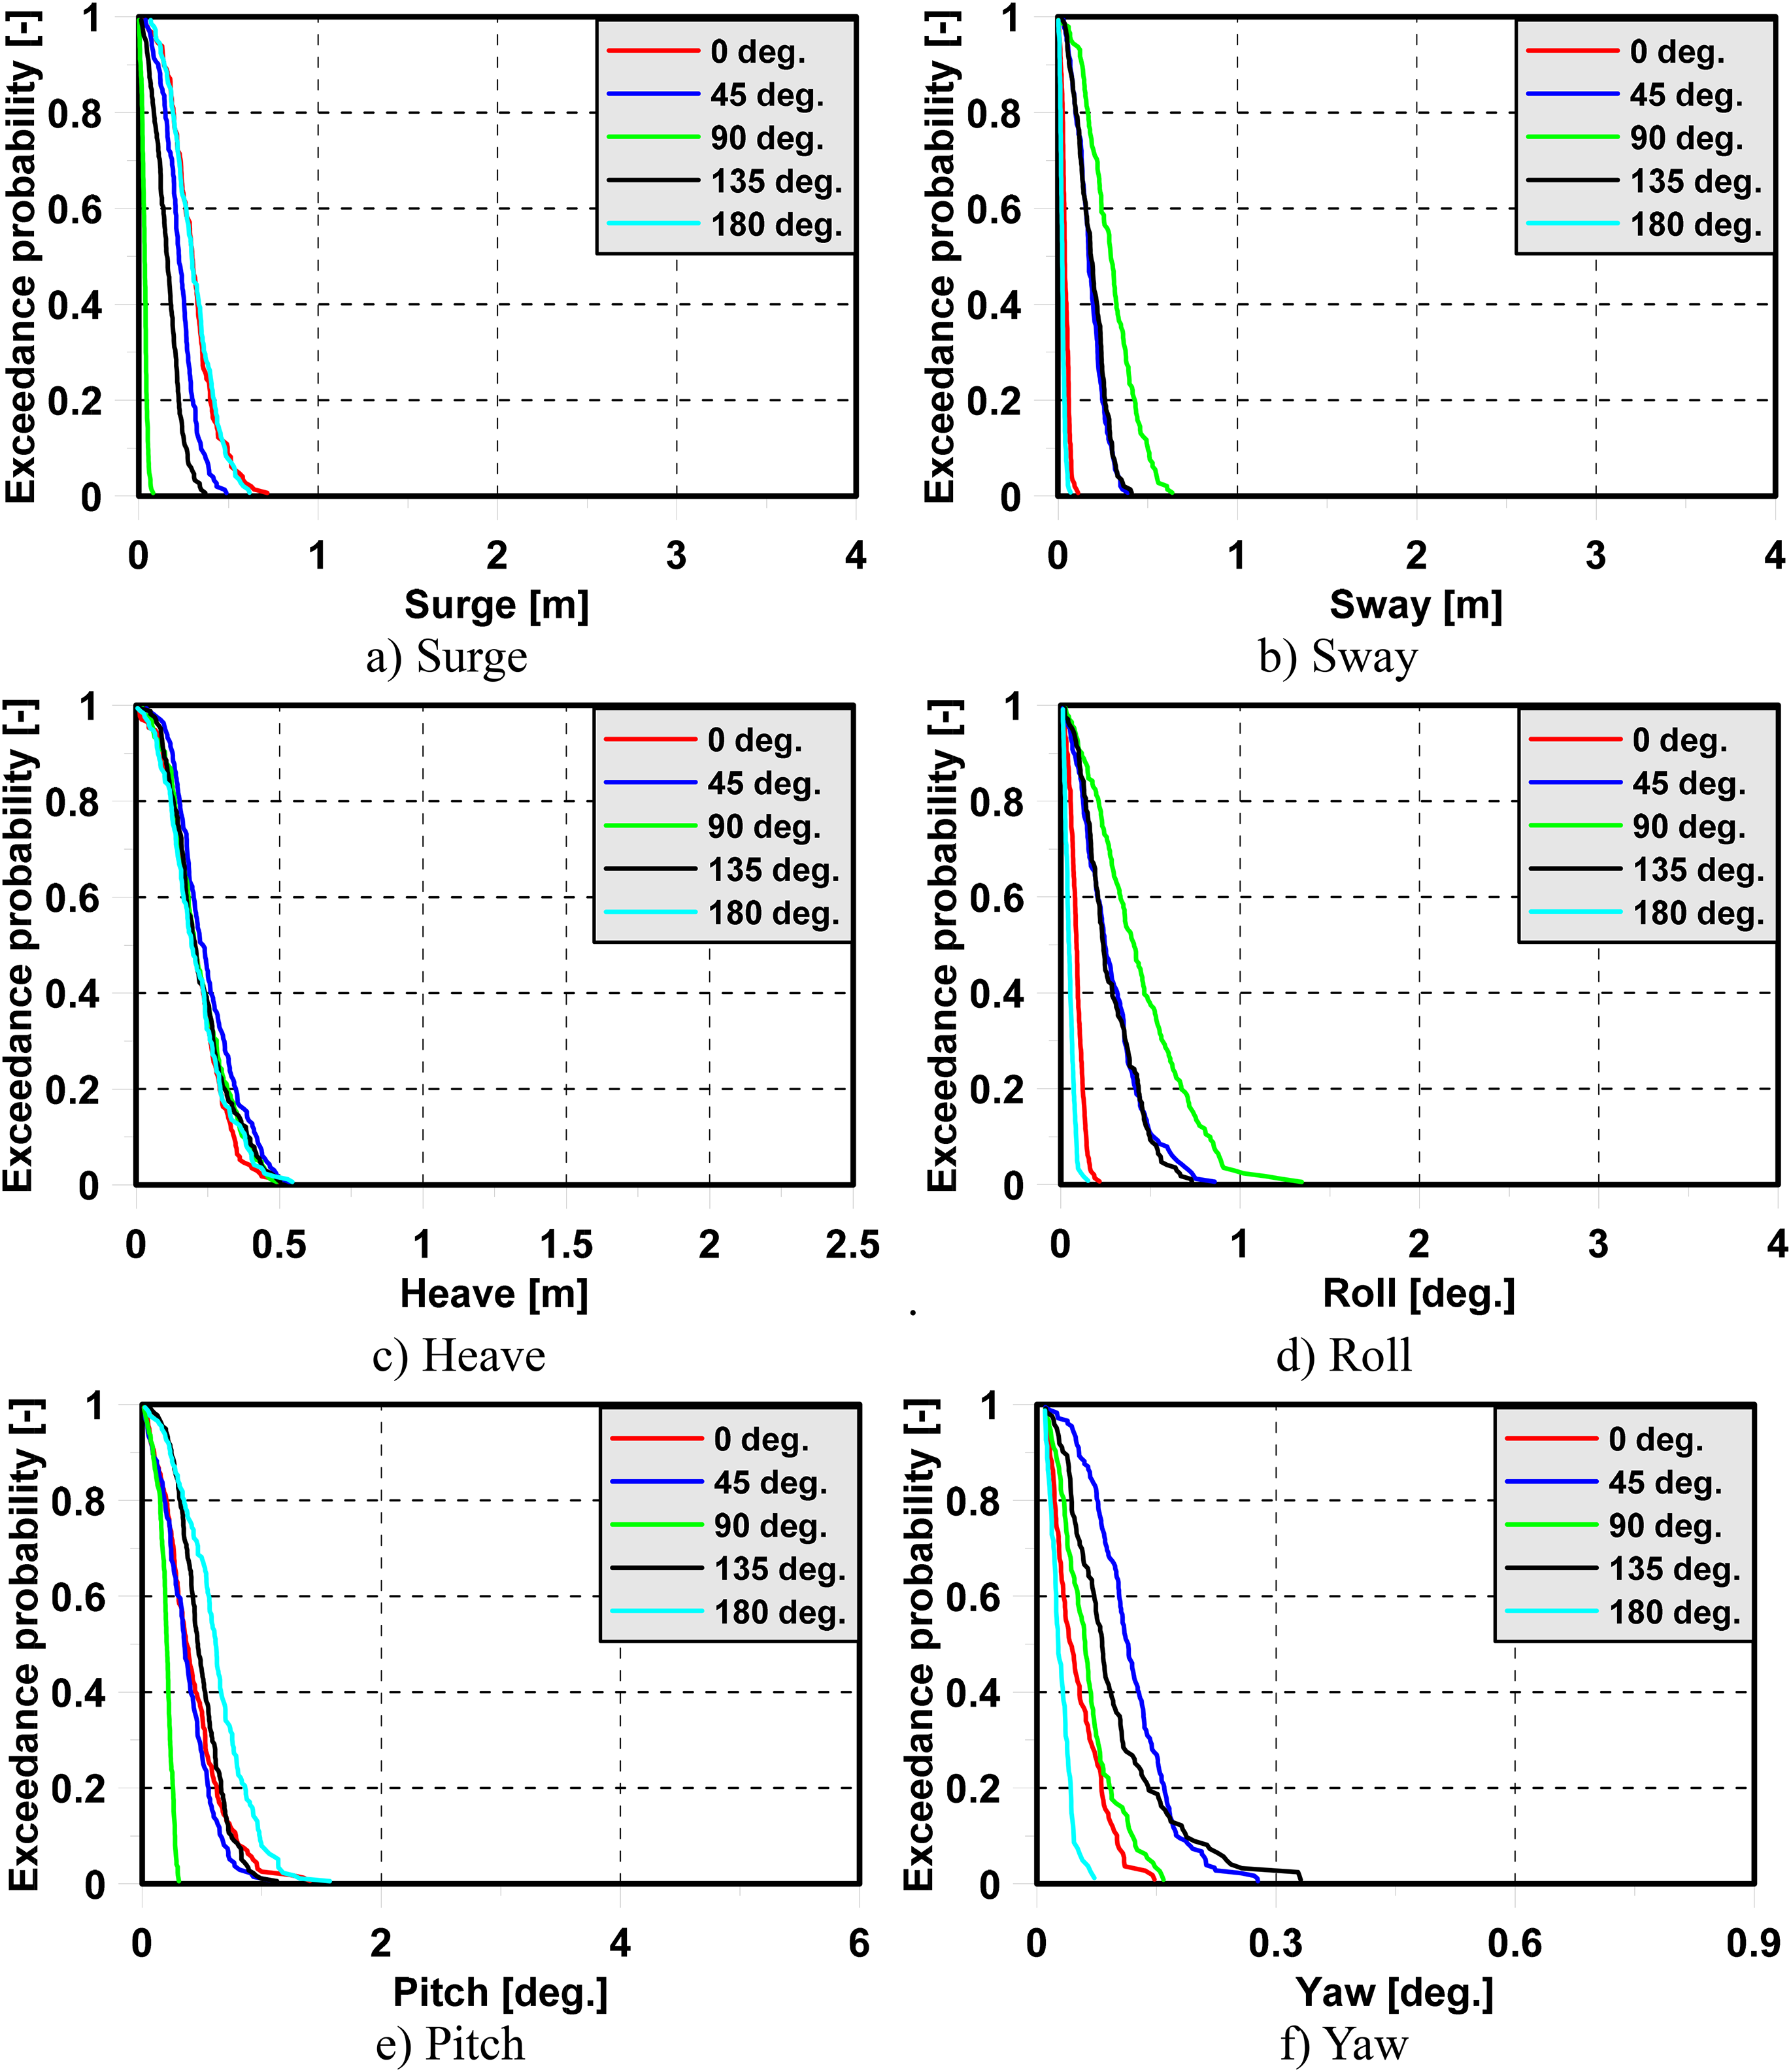
Exceedance probability of the semi-submersible at sea state 4. a) Surge b) Sway c) Heave d) Roll e) Pitch f) Yaw.

Exceedance probability of the semi-submersible at sea state 5. a) Surge b) Sway c) Heave d) Roll e) Pitch f) Yaw.

Exceedance probability of the semi-submersible at sea state 6. a) Surge b) Sway c) Heave d) Roll e) Pitch f) Yaw.
Conclusion
Experimental and numerical investigations of motion responses of the semi-submersible in various wave directions were performed in waves. The followings are conclusions drawn from the semi-submersible's response analysis:
First, a three-dimensional panel method was used to estimate the motion of a moored semi-submersible in waves and the mooring line dynamics were modelled by the lumped-mass method. Simulation results of motion responses of the moored semi-submersible were similar to experimental results except some surge and sway RAO discrepancies were most likely caused by ignoring nonlinearities. However, the numerical simulation and experiment accurately captured variations in wave-induced motions as a function of wave direction and wavelength.
Second, it was noted that characteristics of motion responses of a semi-submersible could be affected by mooring systems. Since the moored semi-submersible was a symmetrical object, ship motions have a similar trend in cases of wave direction as follows: 180 degrees with 0 degrees and 135 degrees with 45 degrees. In regular waves, amplitude motions of semi-submersible were noted to change dramatically at each wave frequency and wave direction. In irregular waves, dynamic responses of the model in frequency domain and time domain substantially differed from those under sea conditions. The peak of wave frequency and natural frequency directly affected on frequency domain characteristics of horizontal motion and mooring tension of semi-submersible.
Finally, effects of wave direction and wavelength on motion responses of the semi-submersible were investigated. Through model test in irregular waves, the effect of wave direction and sea state on motion responses of semi-submersible were analysed based on spectral analysis. Effects of the wave frequency component on motion responses of the semi-submersible were analysed.
Footnotes
Acknowledgment
This work was supported by the National Research Foundation of Korea (NRF) grant funded by the Korea government (MSIT) (No. 2019R1F1A1057551). This work was supported by The University of Danang, University of Science and Technology, code number of Project: T2022-02-04.
Declaration of conflicting interests
The author(s) declared no potential conflicts of interest with respect to the research, authorship, and/or publication of this article.
Funding
The author(s) disclosed receipt of the following financial support for the research, authorship, and/or publication of this article: This work was supported by the National Research Foundation of Korea (NRF) grant funded by the Korea government (MSIT), (grant number No. 2019R1F1A1057551).