
Abstract
Compared with plane cutterhead, the cone-shape cutterhead has better rock-breaking performance with a free surface during the rock-breaking process. Tunneling parameters of cone-shaped cutterhead have great influence on the rock-breaking efficiency and cutterhead thrust. A full-scale excavation model of cone-shape cutterhead was constructed using LS-DYNA to characterize the rock-breaking process accurately and efficiently. The effects of penetration depth and rotation speed on the damage, cutterhead thrust, and rock-breaking efficiency in each area were investigated. The results show that the penetration depth is more sensitive to the field penetration index and thrust fluctuation index than the rotation speed. When the penetration depth and rotation speed is 4 mm/r and 4.5 r/min, respectively, the cone-shape cutterhead performs best with high rock-breaking efficiency and smallest fluctuation of cutterhead thrust under specific geological conditions. It provides suggestions for the selection of tunneling parameters during cone-shape cutterhead construction.
Keywords
Introduction
Tunnel boring machines (TBMs) are heavy-duty engineering machines for tunnel excavation and have been widely applied to water conservancy, electricity transmission, highway and railway projects.1–4 The cutterhead serves as the TBM's core component for cutting and crushing rock, which are categorized into flat, conical, and irregular types. Among them, the flat cutterhead is the most widely used structure due to its simpler manufacturing process. However, conical cutterhead performs better in terms of rock-breaking efficiency and muck removal efficiency than flat cutterhead in inclined extremely hard rock tunnel project. A typical conical cutterhead features a multistage structure, where the initial stage provides a free surface for the subsequent stages, enabling the multistage conical cutterhead to break rock without the confinement of surrounding rock. It significantly improves rock-breaking efficiency compared to traditional flat cutterhead. 5 Owing to its unique structural characteristics, the conical cutterhead has higher muck removal efficiency, superior structural strength and stiffness, better excavation performance, and enhanced geological adaptability than the flat cutterhead. Consequently, the conical cutterhead has become the current research and design focus, especially in inclined shaft boring projects in extremely hard rock conditions.6,7
In recent decades, scholars have conducted fewer studies on cone-shape cutterheads. Zhang 8 found that the soil chamber pressure of cone-shape cutterhead with 180° cone tip angle is smaller, and its flow thrust of tunnel face is larger, compared with plane cutterhead. The cone-shape cutterhead has a better adaptability under complex geological condition such as Boulders, ancient tree roots or building pile foundation. Chen et al. 9 studied the effect of cone angle, cutter spacing and cutter installation angle on the rock-breaking performance of cone-shape TBM cutterhead, which provides guidance for the cutterhead design through discrete element method. Feng et al. 10 investigated the rock deformation mechanism during the TBM tunneling process of cone-shape cutterhead through numerical simulation, and proposed a new radial deformation analysis model. Kang et al. 11 investigated the characteristics of the rock-breaking process of two cutters with different blade width for SBM cone-shape cutterhead. It concludes that the rock-breaking efficiency would not increase when scaling the width of the flat blade up to 18 mm and the arc blade to 24 mm. Furthermore, TBM tunneling parameters have a significant effect on the cutterhead tunneling load and rock-breaking efficiency, greatly affecting the construction safety and tunneling efficiency.12,13 The tunneling parameters of cutterhead needs to be dynamically adjusted to the appropriate value according to the working condition during TBM construction. Once the tunneling parameters is unreasonable, it will cause low tunneling efficiency, severe wear of cutterhead, even serious safety accidents.14,15 Furthermore, researchers have studied TBM cutterhead loads under various factors such as tunneling parameters, cutterhead structure, and geological conditions. Han et al. 16 established a finite element model of cutterhead–rock interaction, considering dynamic effects, material damage, and frictional contact. And it concludes that the cutterhead thrust and torque roughly obey the normal distribution and largely depended on the penetration depth and uniaxial compressive strength of the rock. Li et al. 17 conducted numerical simulations and experiments on continuous multicutter rotary cutting of rock, indicating that the normal force, rolling force, and the cutting coefficient for the rolling force increase with increasing radius of the disc cutter installation, while the lateral force decreases. Geng et al. 18 presents a numerical study on the rock muck transfer process of TBM cutterhead using the discrete element method and investigated the effects of the number and size of mucking chutes, muck particle shape, cutterhead diameter, and rotation speed on muck removal performance of cutterhead. Jiang et al. 19 investigated the correlation between rock properties and thrust, cutterhead torque, rotation speed, and penetration depth and established a statistical prediction model describing the influence of rock properties on TBM tunneling efficiency using multivariate linear regression analysis, where the tunneling parameters is derived from a specific tunnel project during the stable operation stage. In summary, research on cutterhead rock-breaking performance has primarily focused on the planar cutterhead. While there are few studies on the conical cutterhead, where the rock-breaking characteristic is quite different from the planar cutterhead. Furthermore, most analyses rely on numerical simulations of single-cutter or multicutter coordinated cutting, where the distribution characteristics and rock-breaking influence law of conical cutterhead are ignored. Additionally, the distribution characteristics and laws of the conical cutterhead thrust and the rock-breaking rate under different tunneling parameter conditions needs to be studied. It is essential to provide guidance for optimizing tunneling parameters control.
In order to elucidate the rock-breaking mechanism of the full-face cone-shape cutterhead during tunneling process, this paper establishes a full-scale simulation model of cutterhead breaking the rock. The model's accuracy is demonstrated through experimental validation and filed data of actual TBM construction. Furthermore, the influence of penetration depth and rotation speed on key performance metrics of cone-shape cutterhead are investigated, including rock-breaking performance, cutterhead thrust and rock-breaking efficiency. It provides a foundation for improving thrust control and excavation efficiency in TBM inclined shaft excavation under similar geological conditions.
Tunnel overview and geological conditions
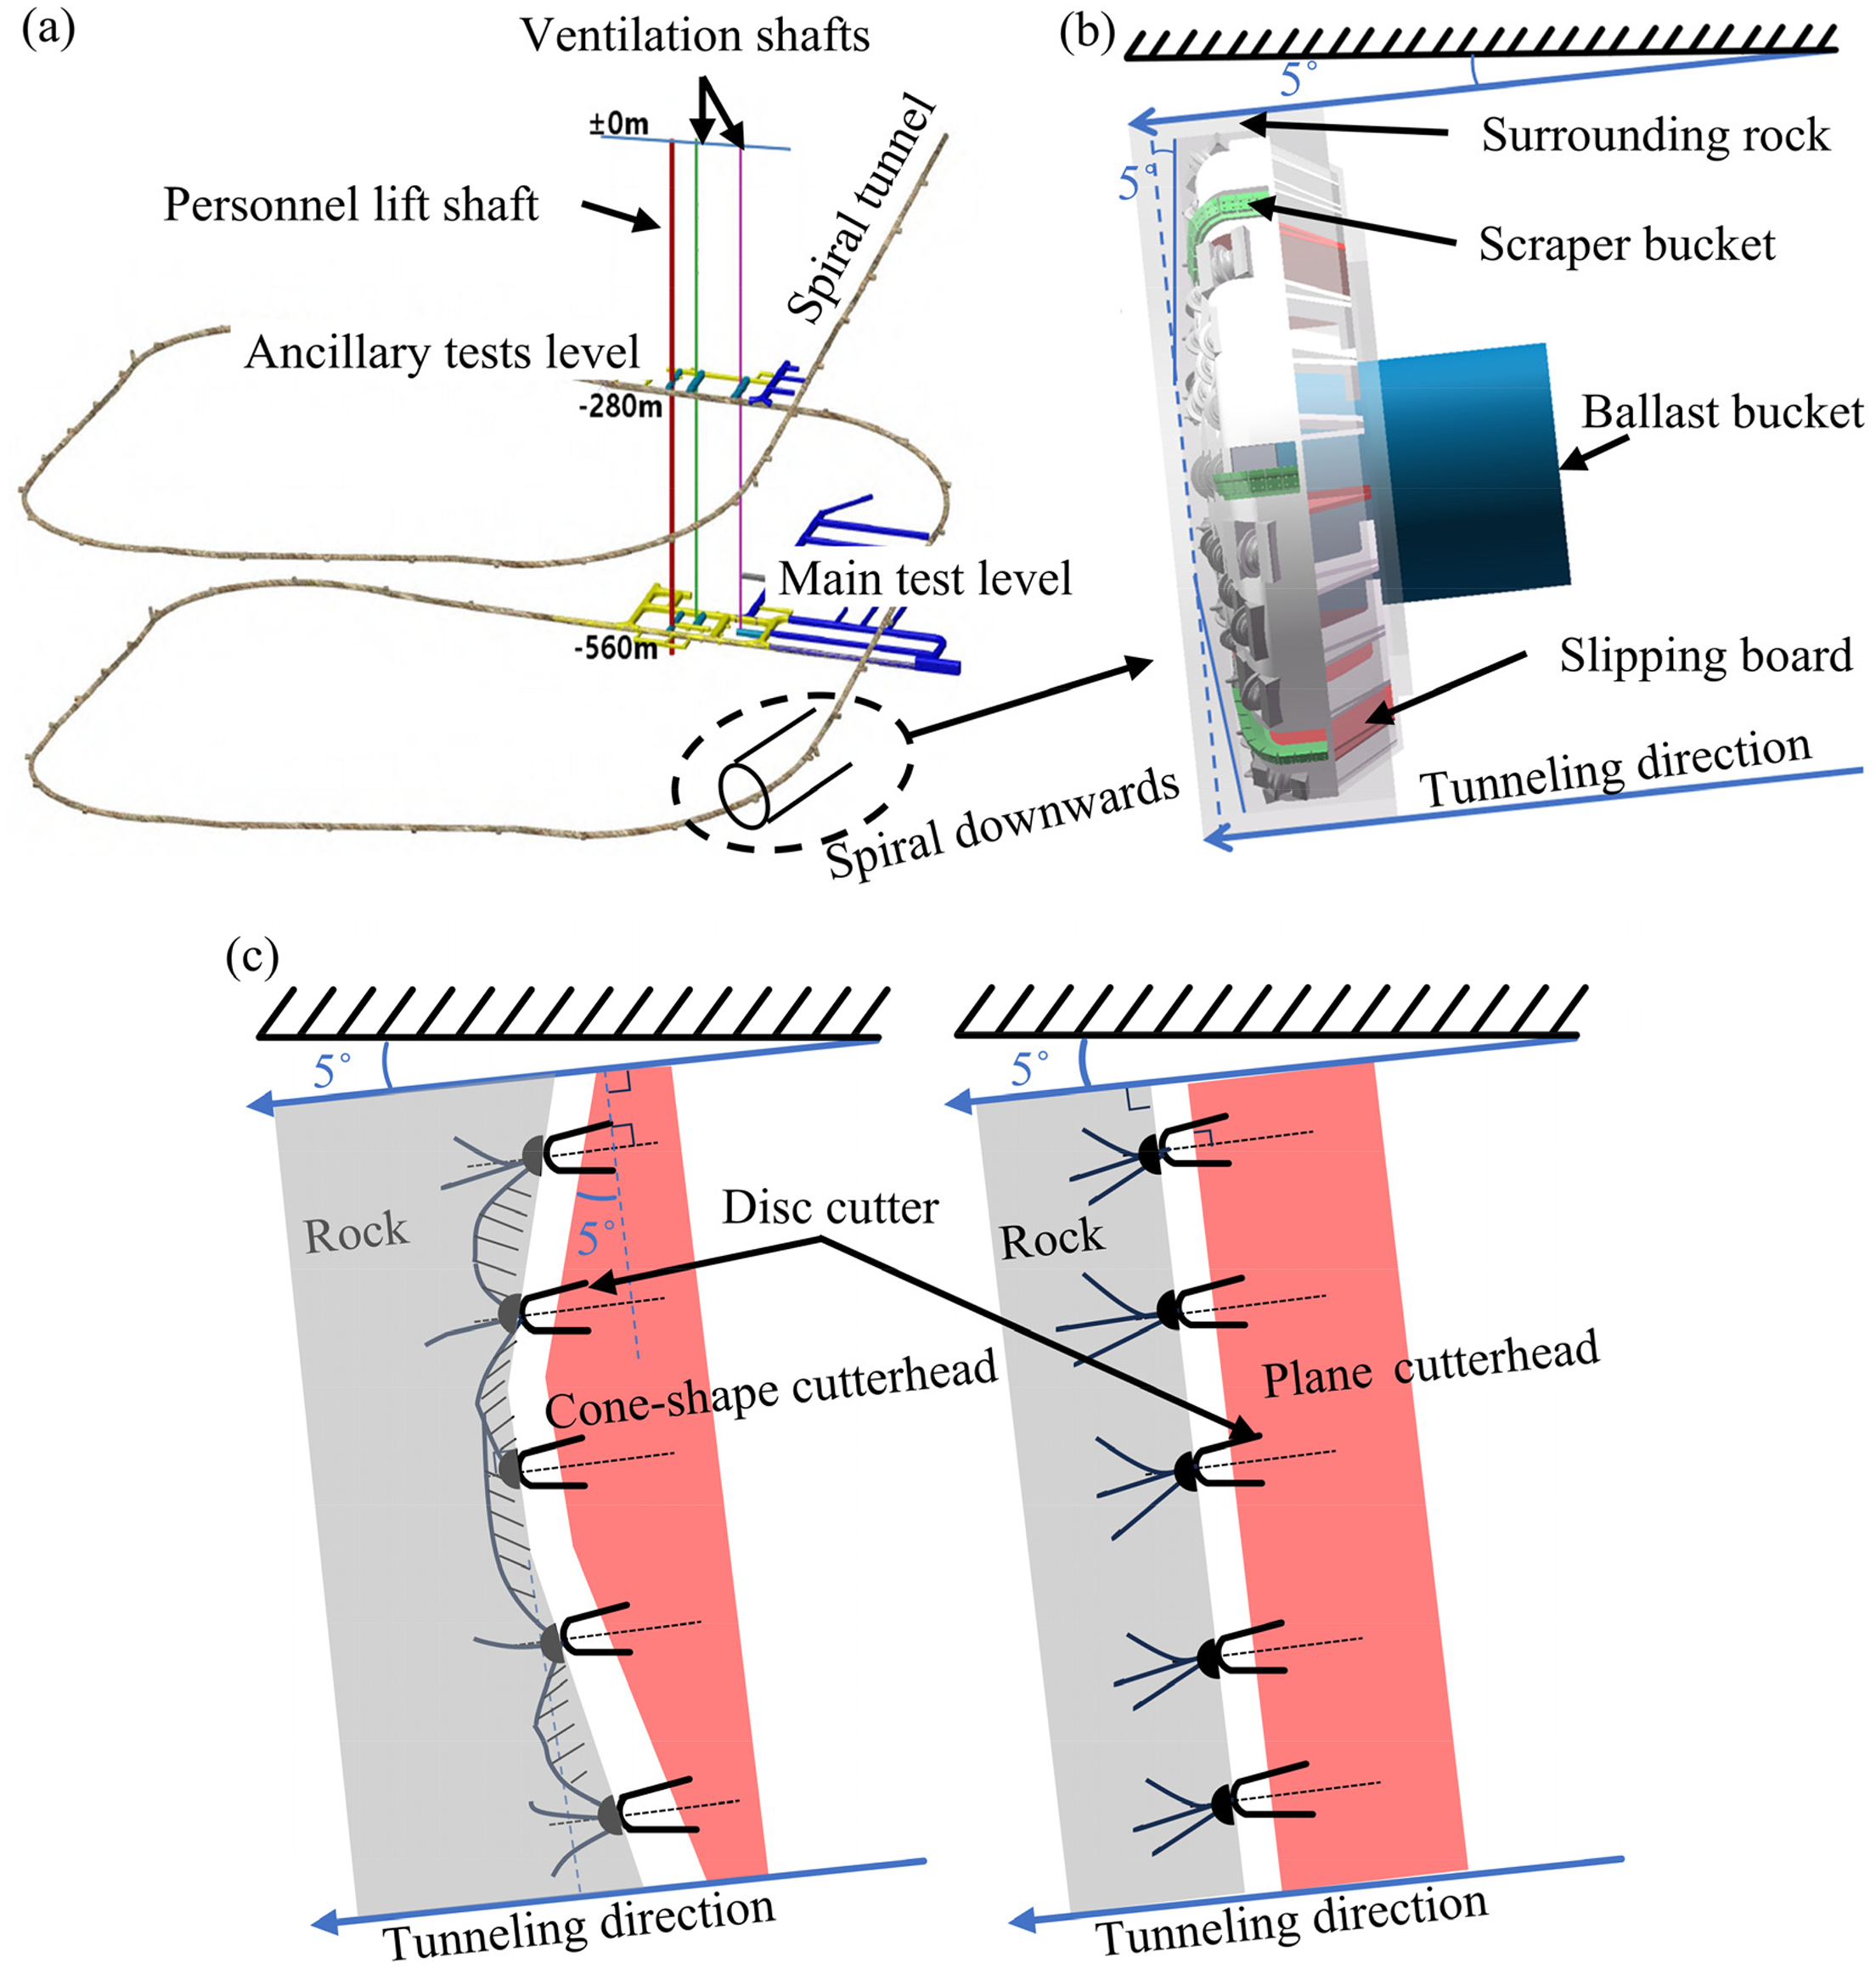
The Beishan URL (underground research laboratory) is used for high-level radioactive waste disposal in China. Its architecture scheme is shown in Figure 1(a) to (c),20,21 which adopts the main architecture scheme of spiral rampway + three lift shafts + two level alleys. The three shafts are one personnel lift shaft and two ventilation shafts, which are all straight to the bottom of the underground laboratory. TBM was used to excavate the tunnel clockwise and spirally from the surface downward, where the length of the spiral rampway is about 7.0 km, with a maximum gradient of 10%, and the inclination of the spiral rampway reaches 5°. The TBM cutterhead is designed as cone-shape with 5° cone angle, as shown in Figure 1(b). As shown in Figure 1(c), the rock-breaking characteristics between 5° cone-shape and flat cutterhead are compared. The rock is broken by the front disc cutters of cone-shape cutterhead, and then a free surface is created that facilitates subsequent rock breaking by the rear disc cutters. It promotes the extension and convergence of rock cracks to the center of excavation face. The surrounding rock is mainly composed of granite, with quartz content ranges from 25% to 30%. The uniaxial compressive strength of rocks ranges from 110 to 235 MPa, with a mean of uniaxial compressive strength of 169.5 MPa. The tensile strength of rocks ranges from 6 to 15 MPa, with a mean of tensile strength of 11 MPa. The main rock mechanics parameters are shown in Table 1. Typically, surrounding rock exhibits high density, low porosity, high mechanical strength, low deformability, and high brittleness, with generally intact conditions.
Tunnel project and cone-shape cutterhead.
Main mechanics parameters of surrounding rock.

Experimental validation of cone-shape rock-breaking simulation model
Simulation model establishment
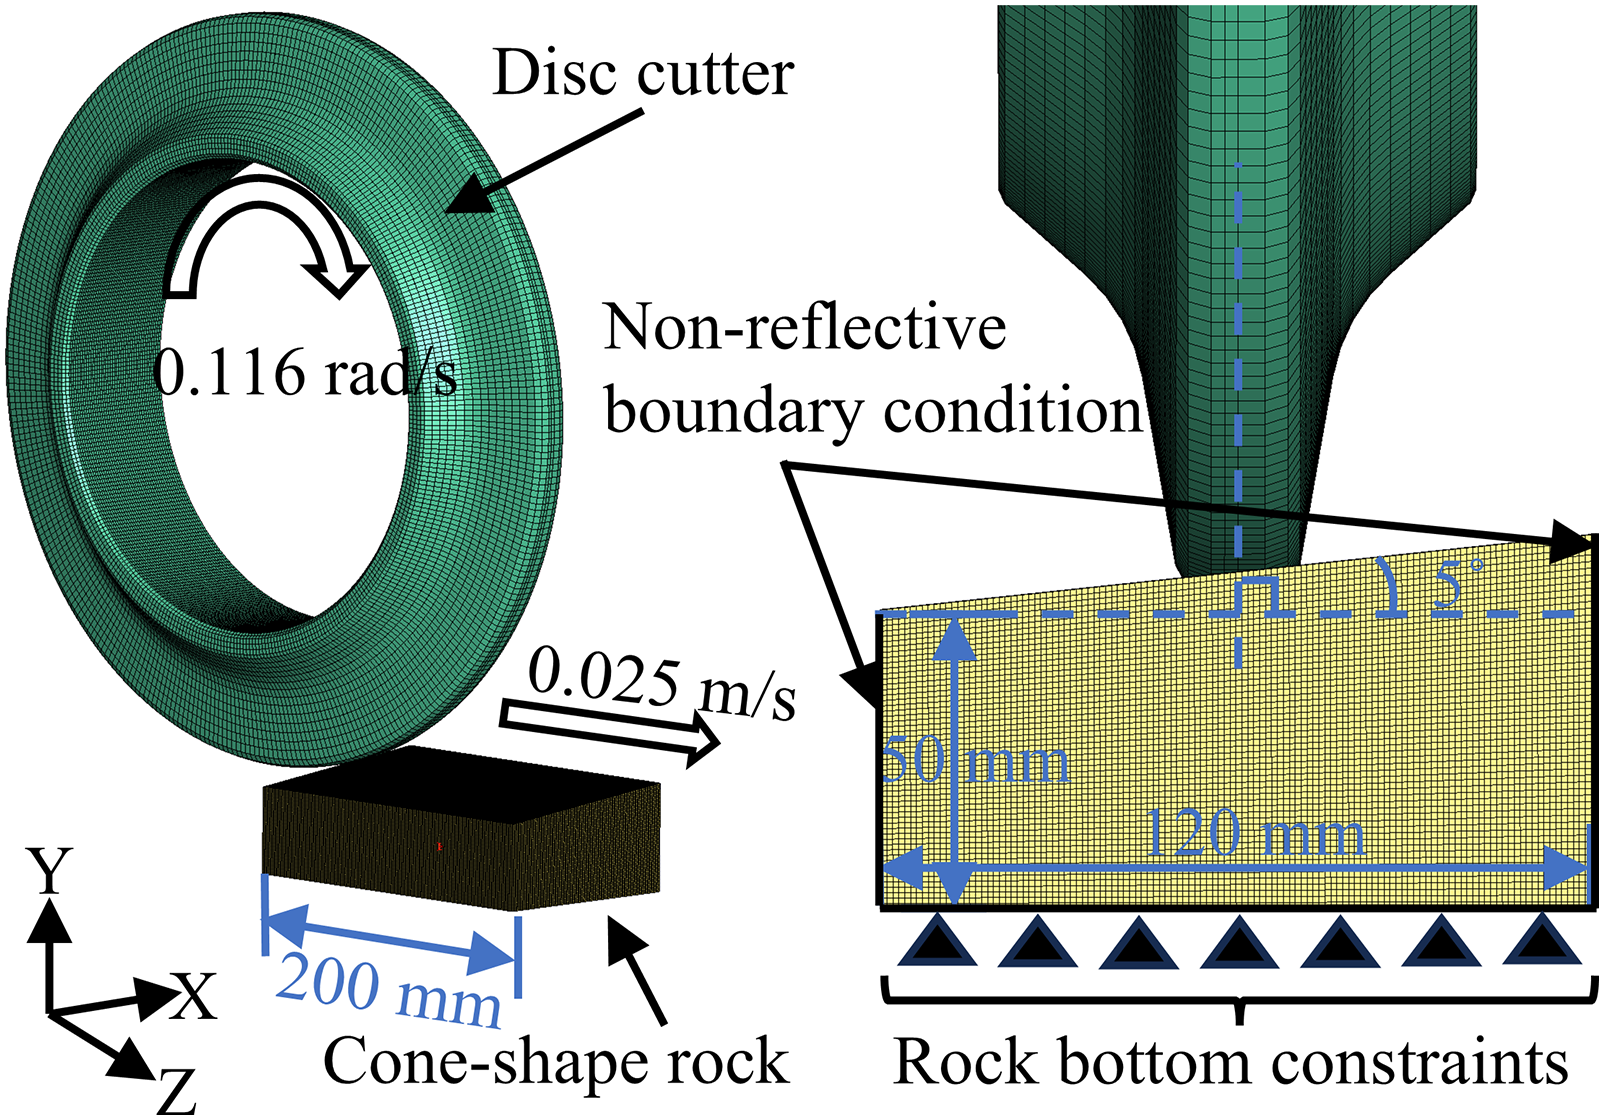
To verify the accuracy of the rock-breaking simulation model, a single-cutter breaking a conical rock simulation model was established, where the rock-breaking condition is the same with the experiments for validation. As shown in Figure 1(c), the contact surface between a single cutter and the rock in the front area is conical. Therefore, the single-cutter rock-breaking simulation was configured to vertically penetrate this conical rock surface (Figure 2). And the upper surface of the rock sample is inclined with 5p cone angle, which is the same with the conical cutterhead. The disc cutter is oriented perpendicular to the rock sample's flat lower surface. The length and width of the rock sample model is 200 mm × 120 mm, with a minimum height of 50 mm at the tapered edge. As shown in Figure 1(c), the conical cutterhead forms a conical surface. For the cutter on the cutterhead, the contact surface of the cutter is a small conical area. Due to the phase angle between adjacent cutters on the cutterhead, when multiple cutters work together, each cutter cuts rock successively. Therefore, single cutter rock breaking is the basic unit of multi cutter collaborative rock breaking. Through single cutter rock-breaking experiments, the accuracy and reliability of the rock-breaking simulation model have been verified, and the model has been applied to full cutterhead rock breaking, indicating that conical rock mass has a promoting effect on rock breaking. The disc cutter is set with rigid body*RIGID attribute, with density of 7850 kg/m3, elastic modulus of 210 GPa and Poisson's ratio of 0.3.
Simulation model of cone-shape rock breaking.
As shown in Figure 3, in order to determine the rock model parameters, uniaxial compression experiments and Brazilian splitting experiments were performed on granite samples from Beishan URL. The macroscopic physical parameters of grey white coarse-grained granite were obtained as shown in Table 2. 22 In ANSYS/LS-DYNA software, the Holmquist–Johnson–Concrete (HJC) material is chosen for the rock ontology model to match the actual properties of rock which could better describe the deformation and fracture of rocks, concrete and other materials under large strains, high strain rates, and high pressures.23,24 The microscopic physical property parameters and ADD_ERSION keywords are set up in the HJC constitutive model to simulate the failure process of rocks such as extrusion failure, tensile fracture and shear fracture. When the cutter intrudes the hard rock, the crushing core is formed under local high pressure, and then the plastic shear deformation is accumulated. Finally, the rock elements are deleted after reaching the damage limit of HJC model. The key parameters of the HJC model are shown in the Table 3, which refers to relevant literature.25,26 C is the strain rate influencing parameter, A, B, and Smax are collectively referred to as the limit surface parameters, ρ is the density, fc is the quasi-static uniaxial compressive strength, T is the maximum normalized tensile hydrostatic force, Ucrush is the volumetric strain corresponding to the elastic ultimate hydrostatic pressure Pcrush, Ulock is the volumetric strain corresponding to the compacted hydrostatic pressure pl, EFmin is the minimum value of the plastic strain when the material fails, and G is the shear modulus. Some of the crucial parameters of the HJC intrinsic structure model. When the hob intrudes, the crushing core is formed under local high pressure, the plastic shear deformation is accumulated, and the material points are deleted after reaching the damage limit of HJC model. The uneven distribution of mineral composition, porosity, and fracture of the actual rock sample leads to the spatial difference of mechanical properties, which is different from the ideal rock mass material model used in simulation.

Rock physical-mechanical test.
Rock physical-mechanical parameters.

Rock material parameters of numerical simulation.

The cutterhead is tunneled forward by the force of the propulsion cylinder at the rear in the actual construction process. At the same time, the cutterhead is driven around the axis of the cutterhead by the action of the main drive. In order to simulate the rotating and advancing process of the disc cutter as the actual construction, the disc cutter penetration is set to 4 mm, the speed of the disc cutter to move along with the Z-axis (direction of advancement) is set to 0.025 m/s, and the angular velocity of the disc cutter is set to 0.116 rad/s. At the same time, the degrees of freedom of the rest of the nonmovement directions are restricted. A fixed constraint is added to the bottom of the rock to constrain all degrees of freedom. The rock sample size in the single blade rock-breaking simulation experiment differs greatly from the actual tunnel excavation size, so nonreflecting boundary is set around the rock to simulate the infinite rock. Thus, the influence of boundary effects is eliminated, the rock used in the simulation can be deemed large enough for simulating excavation on a larger tunnel face. The contact between rock and disc cutter is set to eroding contact.
Experimental validation
The disc cutter rock-breaking experiment was carried out by the multifunctional tool cutting performance test bench of Central South University. As shown in Figure 4, this experimental system mainly consists of adjustable angle cutter holder system, hydraulic system, control system, rock feed bin, movable crossbeam, and other parts. The disc cutter is mounted on the adjustable angle cutter holder. The tilt of the cutter holder is adjusted so that the cutter is vertical to the horizontal plane. The bottom surface size of the rock sample is 900 mm × 380 mm, the short side height is 250 mm, and the inclination angle is 5°. The confining pressure is applied to the rock sample through the partition plate, and rock is fixed in the bin. The hydraulic cylinder drives the bin to move horizontally for cutting, and the movable crossbeam drives the cutter holder up and down vertically through the hydraulic cylinder to adjust the distance between the disc cutter and the cone-shape rock.

Multifunctional tool cutting performance test bench.
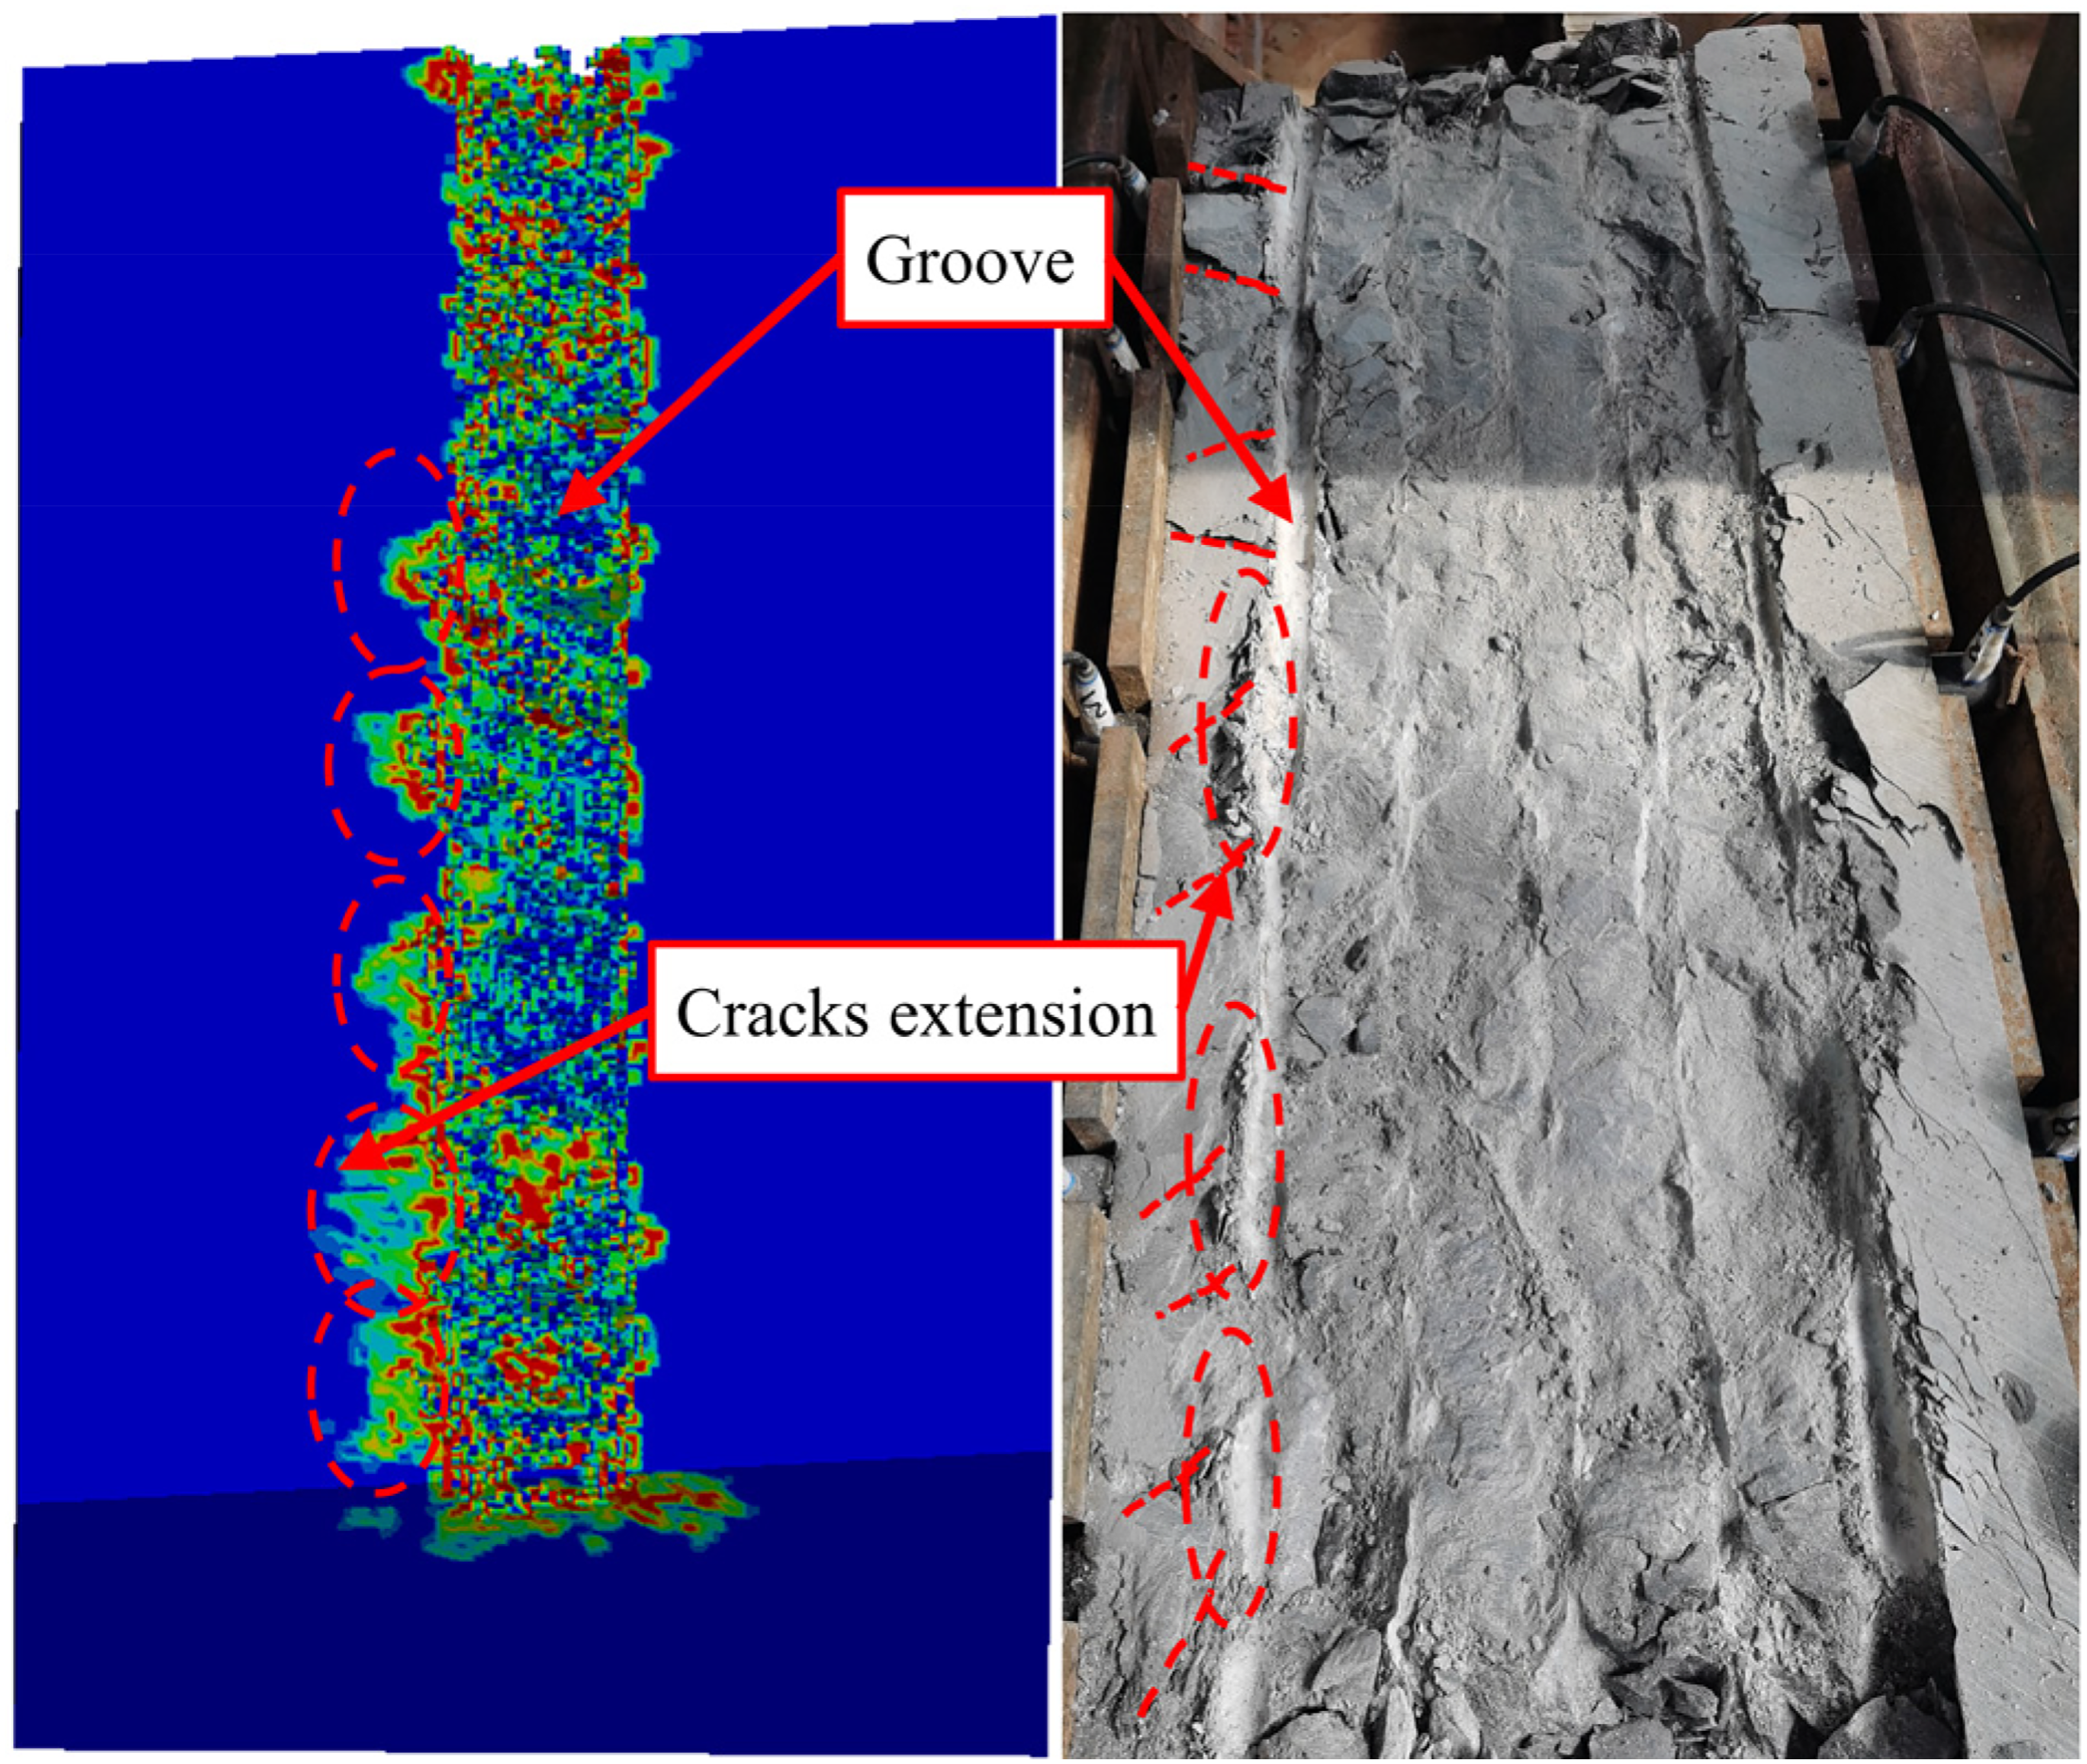
The vertical force of disc cutter was monitored and recorded simultaneously by the three directional force sensors. As shown in Figure 5, for the comparison of the rock damage state under simulation and test, the grooves on the lower side of the cone-shape rock form multiple banded crushing zone. The crushing zone promoted the cracks extension. It further indicates that the free surface effect of the cone-shape cutter is significant for the enhancement of the tunneling efficiency. The rock damage states of numerical simulation and test have a high degree of agreement.
Comparison of experimental and simulated rock damage states.
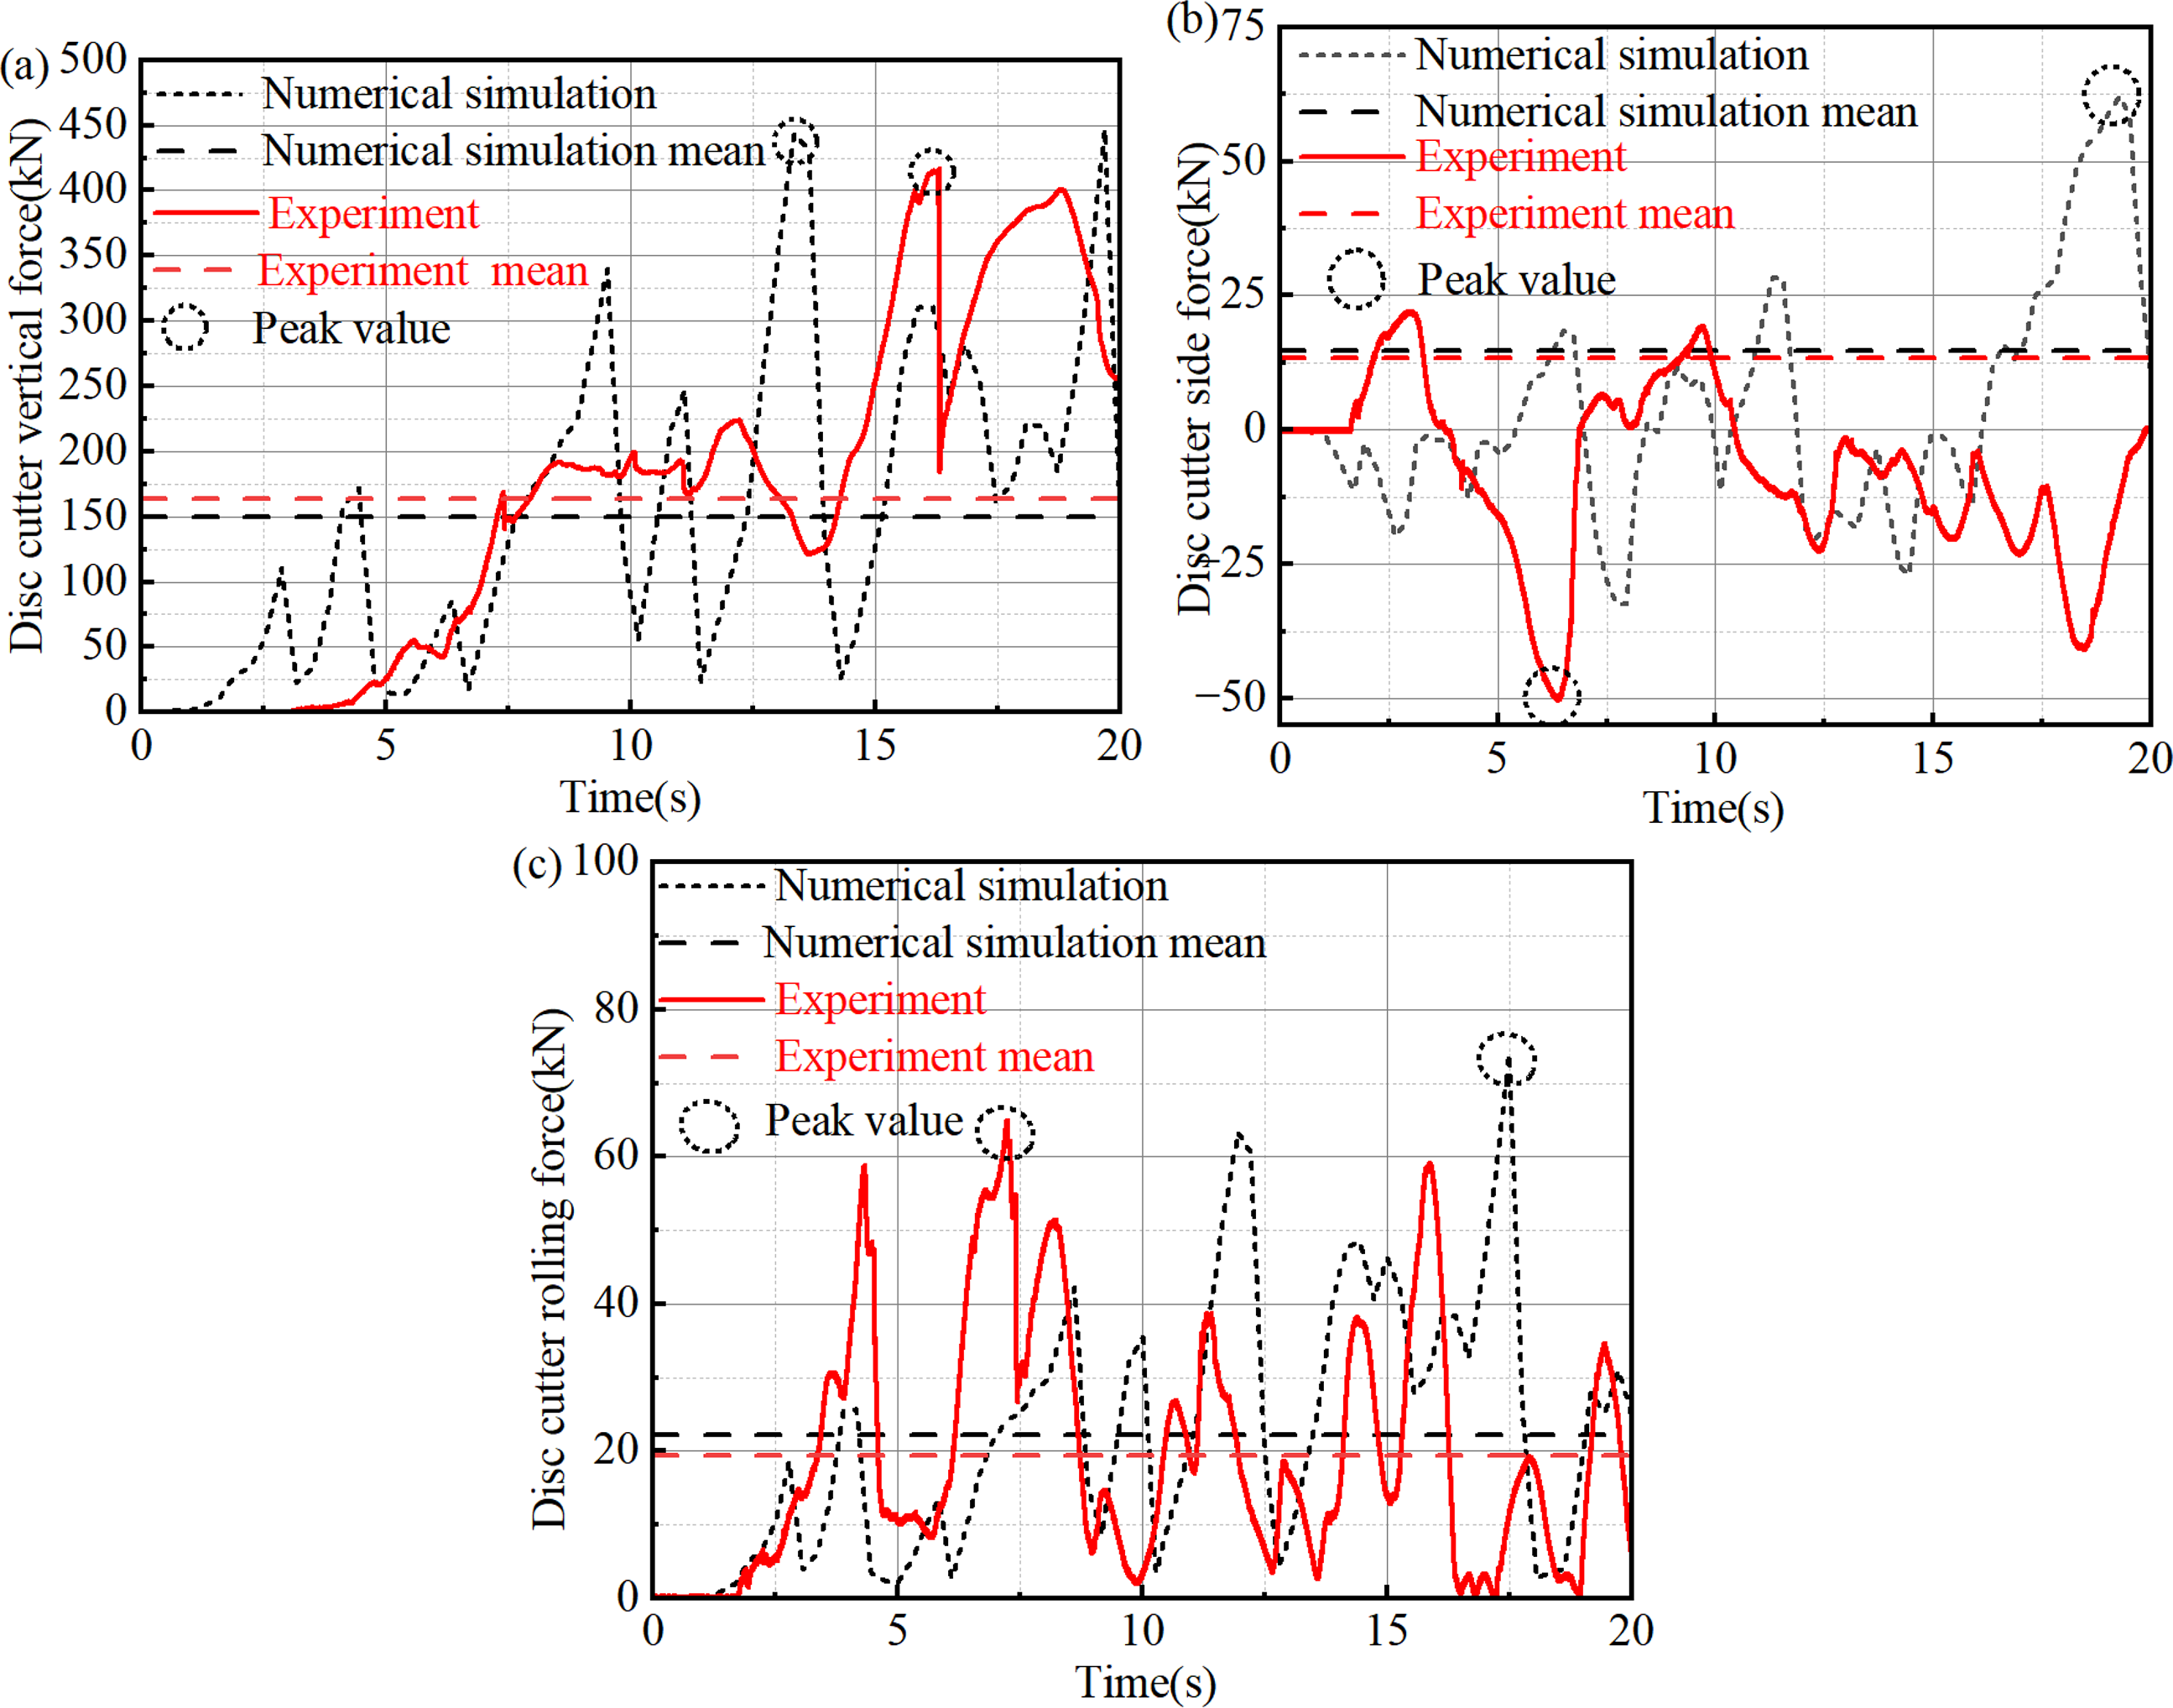
The mean and peak values of the disc cutter vertical force, side force, and rolling force between rock-breaking experiment and numerical simulation are compared as shown in Table 4 and Figure 6. The peak and mean values of the vertical force of the experiment are 417.2 kN and 163.2 kN, respectively. While the peak and mean values of the vertical force of the numerical simulation are 447.0 kN and 149.9 kN, respectively. The errors between experiment and simulation are 7.1% and 8.1%. In Figure 6(b), since the side force has positive and negative values, the mean value is obtained from the absolute value of the data. The peak and mean values of the side force of the experiment are 50.4 kN and 13.4 kN, respectively, while the values of the numerical simulation are 62.1 kN and 14.8 kN, respectively. The errors between experiment and simulation are 23.2% and 10.4%. The peak and mean values of the rolling force of the experiment are 65.0 kN and 19.4 kN, respectively, and the numerical simulation values are 74.0 kN and 22.1 kN, respectively. The errors between experiment and simulation are 13.8% and 13.9%. The error may be caused by the uneven distribution of mineral composition, porosity and fracture of the actual cone rock sample, which leads to the spatial difference of mechanical properties. The actual rock sample has a certain error with the ideal rock mass material model used in the calculation. In addition, due to the large fluctuations of load during rock-breaking process, the average value of the loads is more important than the peak value of the load. The small error between mean force between experiment and simulation verified the accuracy and reliability of the rock-breaking simulation model.
Comparison of experimental and simulated of disc cutter rock-breaking load.
Comparison of experimental and simulation data.

Numerical simulation of cone-shape cutterhead tunneling
Simulation model establishment
The cone-shape TBM cutterhead geometric model is established as shown in Figure 7. Figure 7(b) and (c) shows the size data of frontal, edge and central disc cutters, respectively. The TBM cutterhead contained 55 cutters with an edge width of 19 mm, the number and arrangement is shown in Figure 7(d), the disc cutter spacing of the center area is 100mm. In the frontal cutter area, the cutter spacing from S9 to S22 is distributed between 96 mm and 60 mm, and the disc cutter spacing from S22 to S43 is 60 mm. Edge cutters are mainly responsible for the contour shaping of the excavation face, where the installation inclination angle of S44 to S55 edge cutters range from 10.7° to 70°.
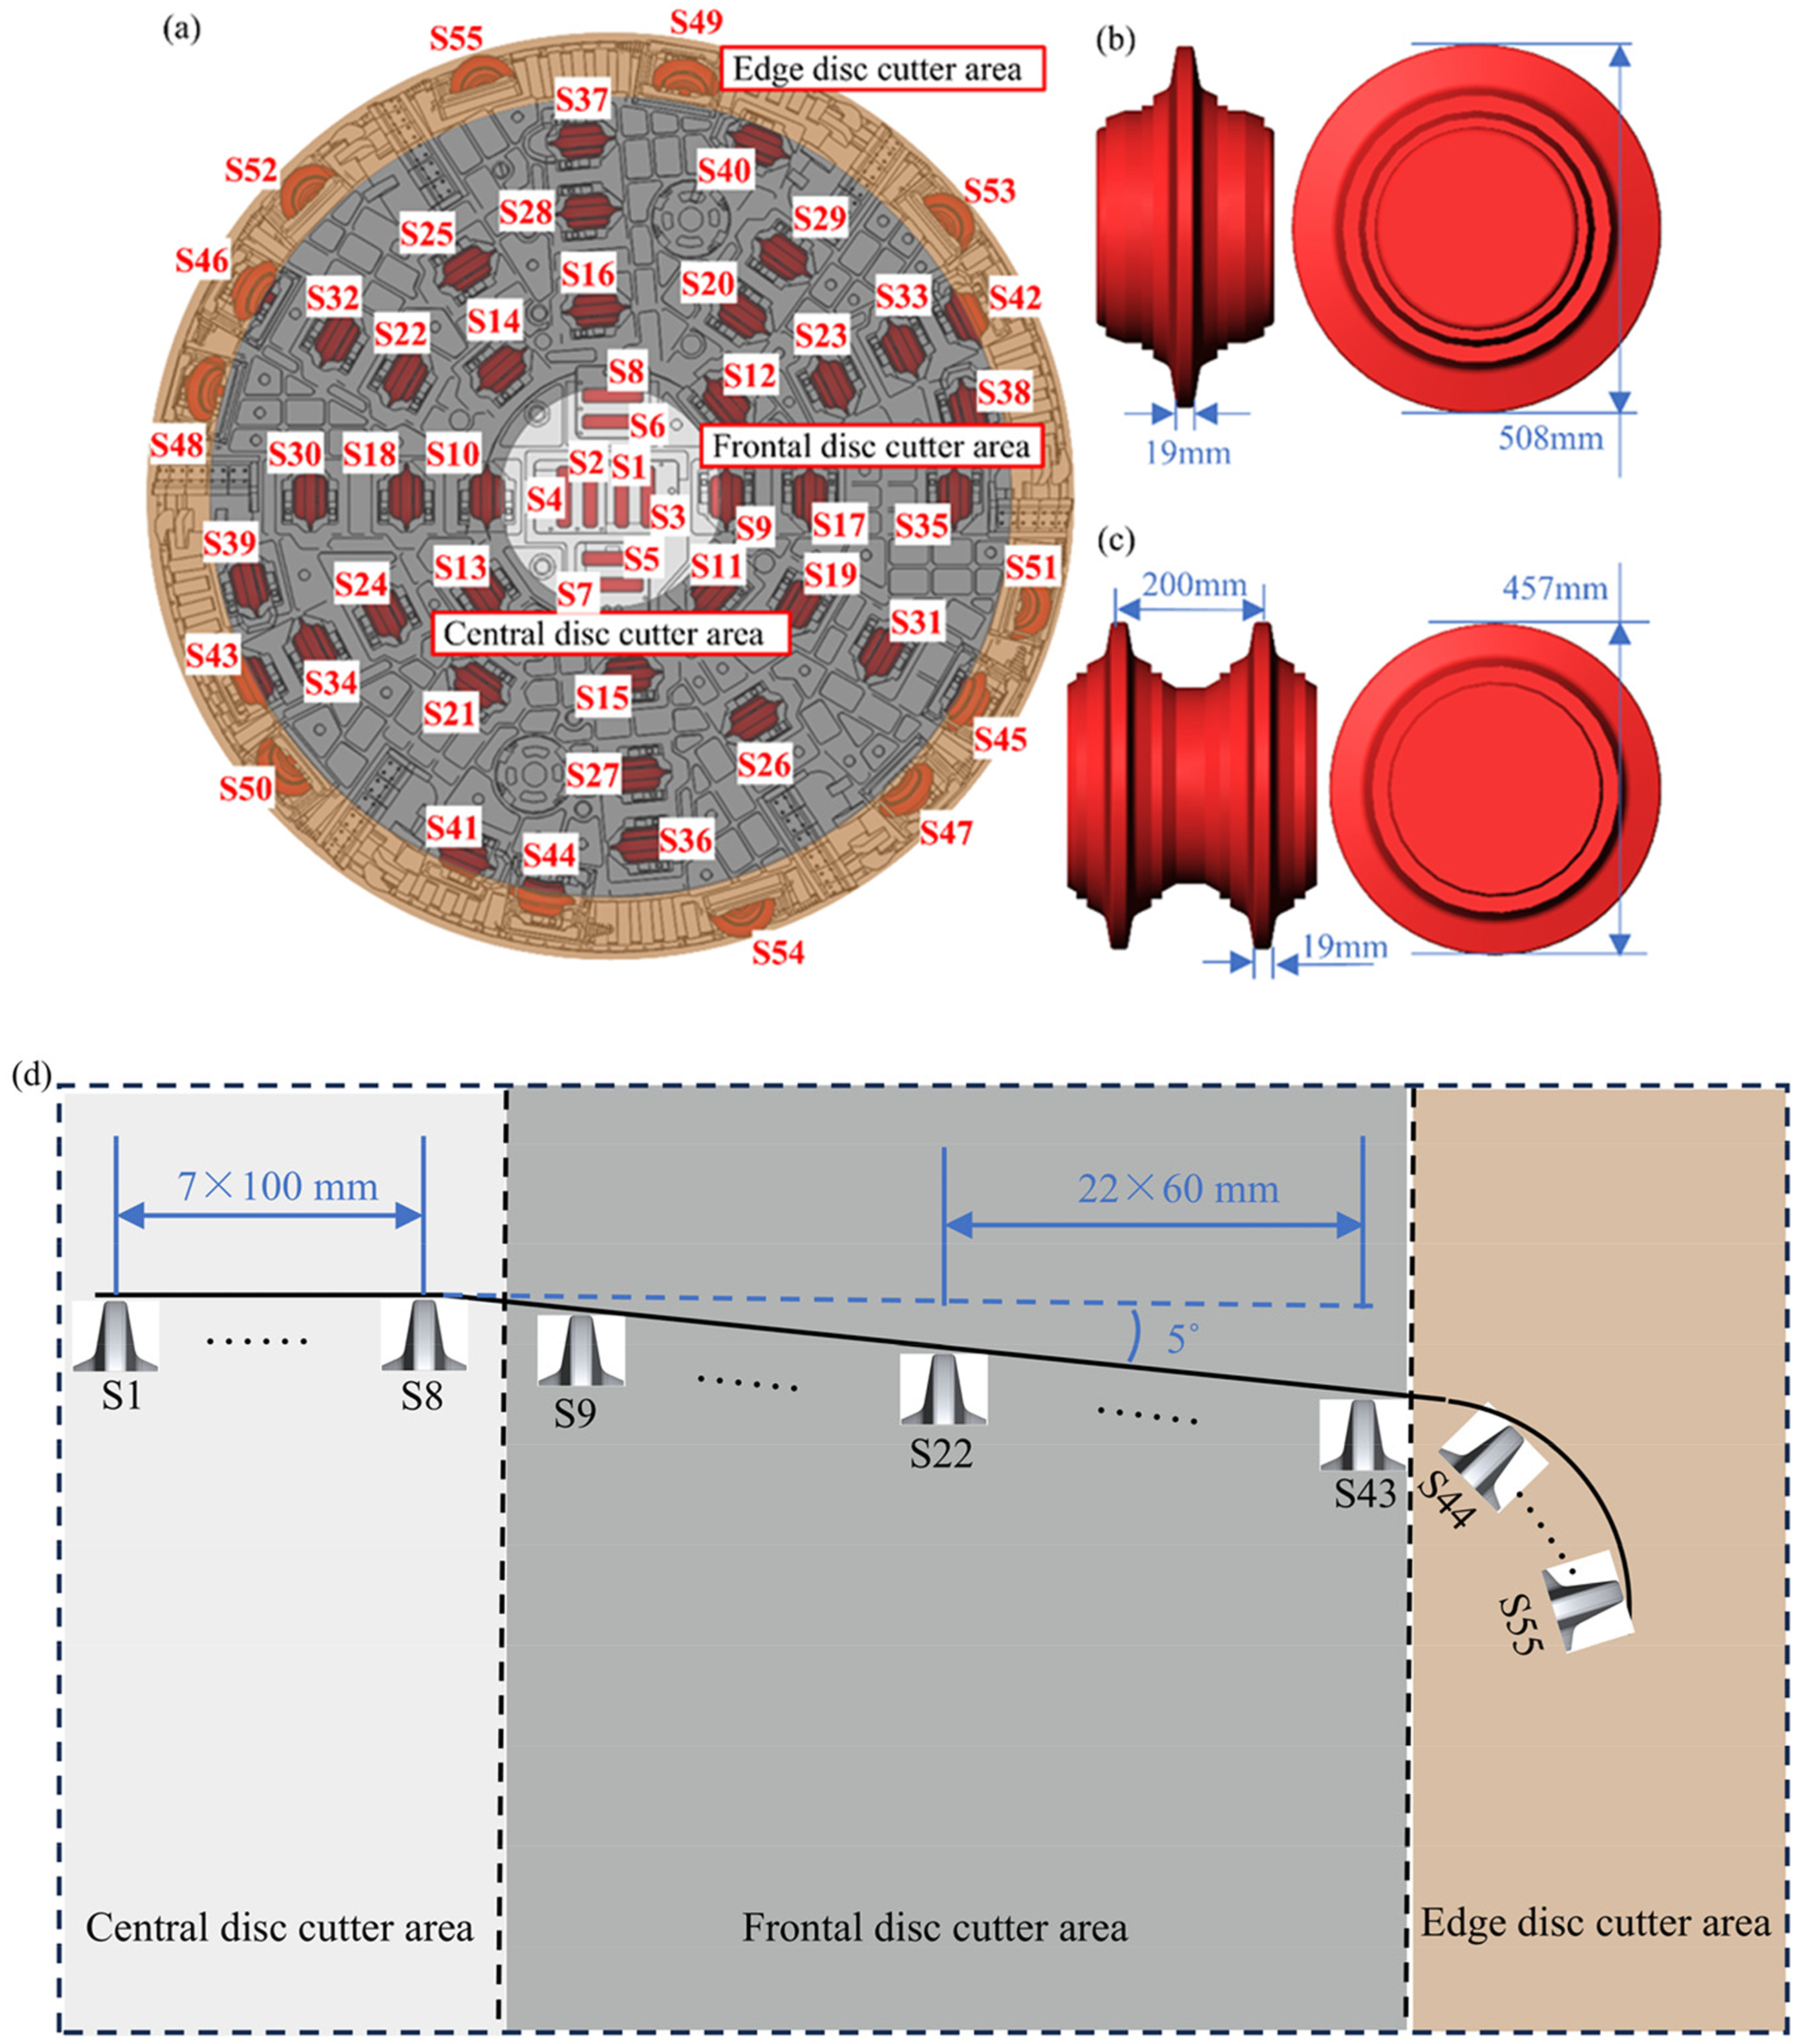
Cone-shape cutterhead geometric model.
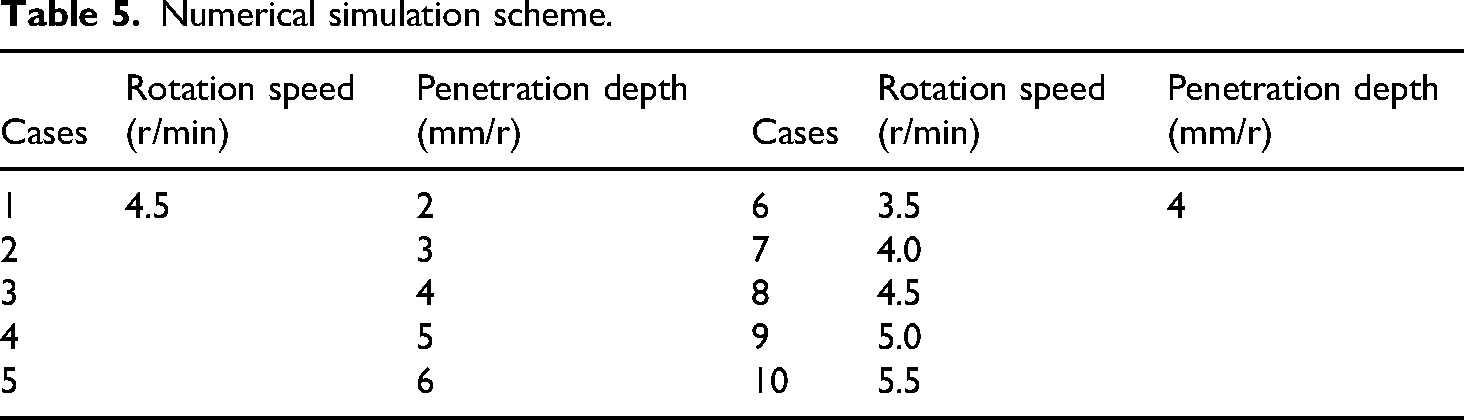
Figure 8 shows the established full-scale cutterhead tunneling simulation model. In the process of rock breaking by cutterhead, the cutters are the main body of rock breaking by cutterhead, which contact with the tunneling face and break the rock directly. While the water injection holes, manholes, muck discharging chutes of the cutterhead and the wear-resistant plate of the cutterhead face have little influence on the rock-breaking process, which are omitted in the simulation model to improve the simulation calculation efficiency. In the actual construction process, the cutterhead is driven forward by the rear propulsion cylinder. At the same time, the cutterhead is rotated around the cutterhead's axis by the main drive. The axial movement speed and the angular velocity of cutterhead around the axis are set up to simulate the cutterhead rotation and advancement in actual construction, and the degree of freedom of the other nonmoving directions of the cutterhead is limited. Fixed constraints are set at the bottom of the rock, and nonreflecting boundary is set around the rock to simulate the infinite rock. In the general tunneling process, the stratum contains complex boundary conditions such as faults, fracture zones. It is difficult to simulate the complex geology condition. In the Beishan TBM tunnel project, the stratum is almost granite with well integrity and extremely high strength. Therefore, the granite rock material is adopted in the simulation. According to the actual TBM excavation process, multiple sets of numerical simulation schemes are set up as shown in Table 5. In order to simulate the cutting process of the edge disc cutter, the edge of the rock is a rounded shape matching the cutterhead, and the center of the rock is at an angle of 5° from the surrounding area. The diameter of rock is 7.21 m, and the diameter of the TBM cutterhead model is 7.03 m. The cutterhead and disc cutters are set as rigid body. The type of rock is granite from Beishan URL, and its material parameters are consistent with Table 2 and Table 3.
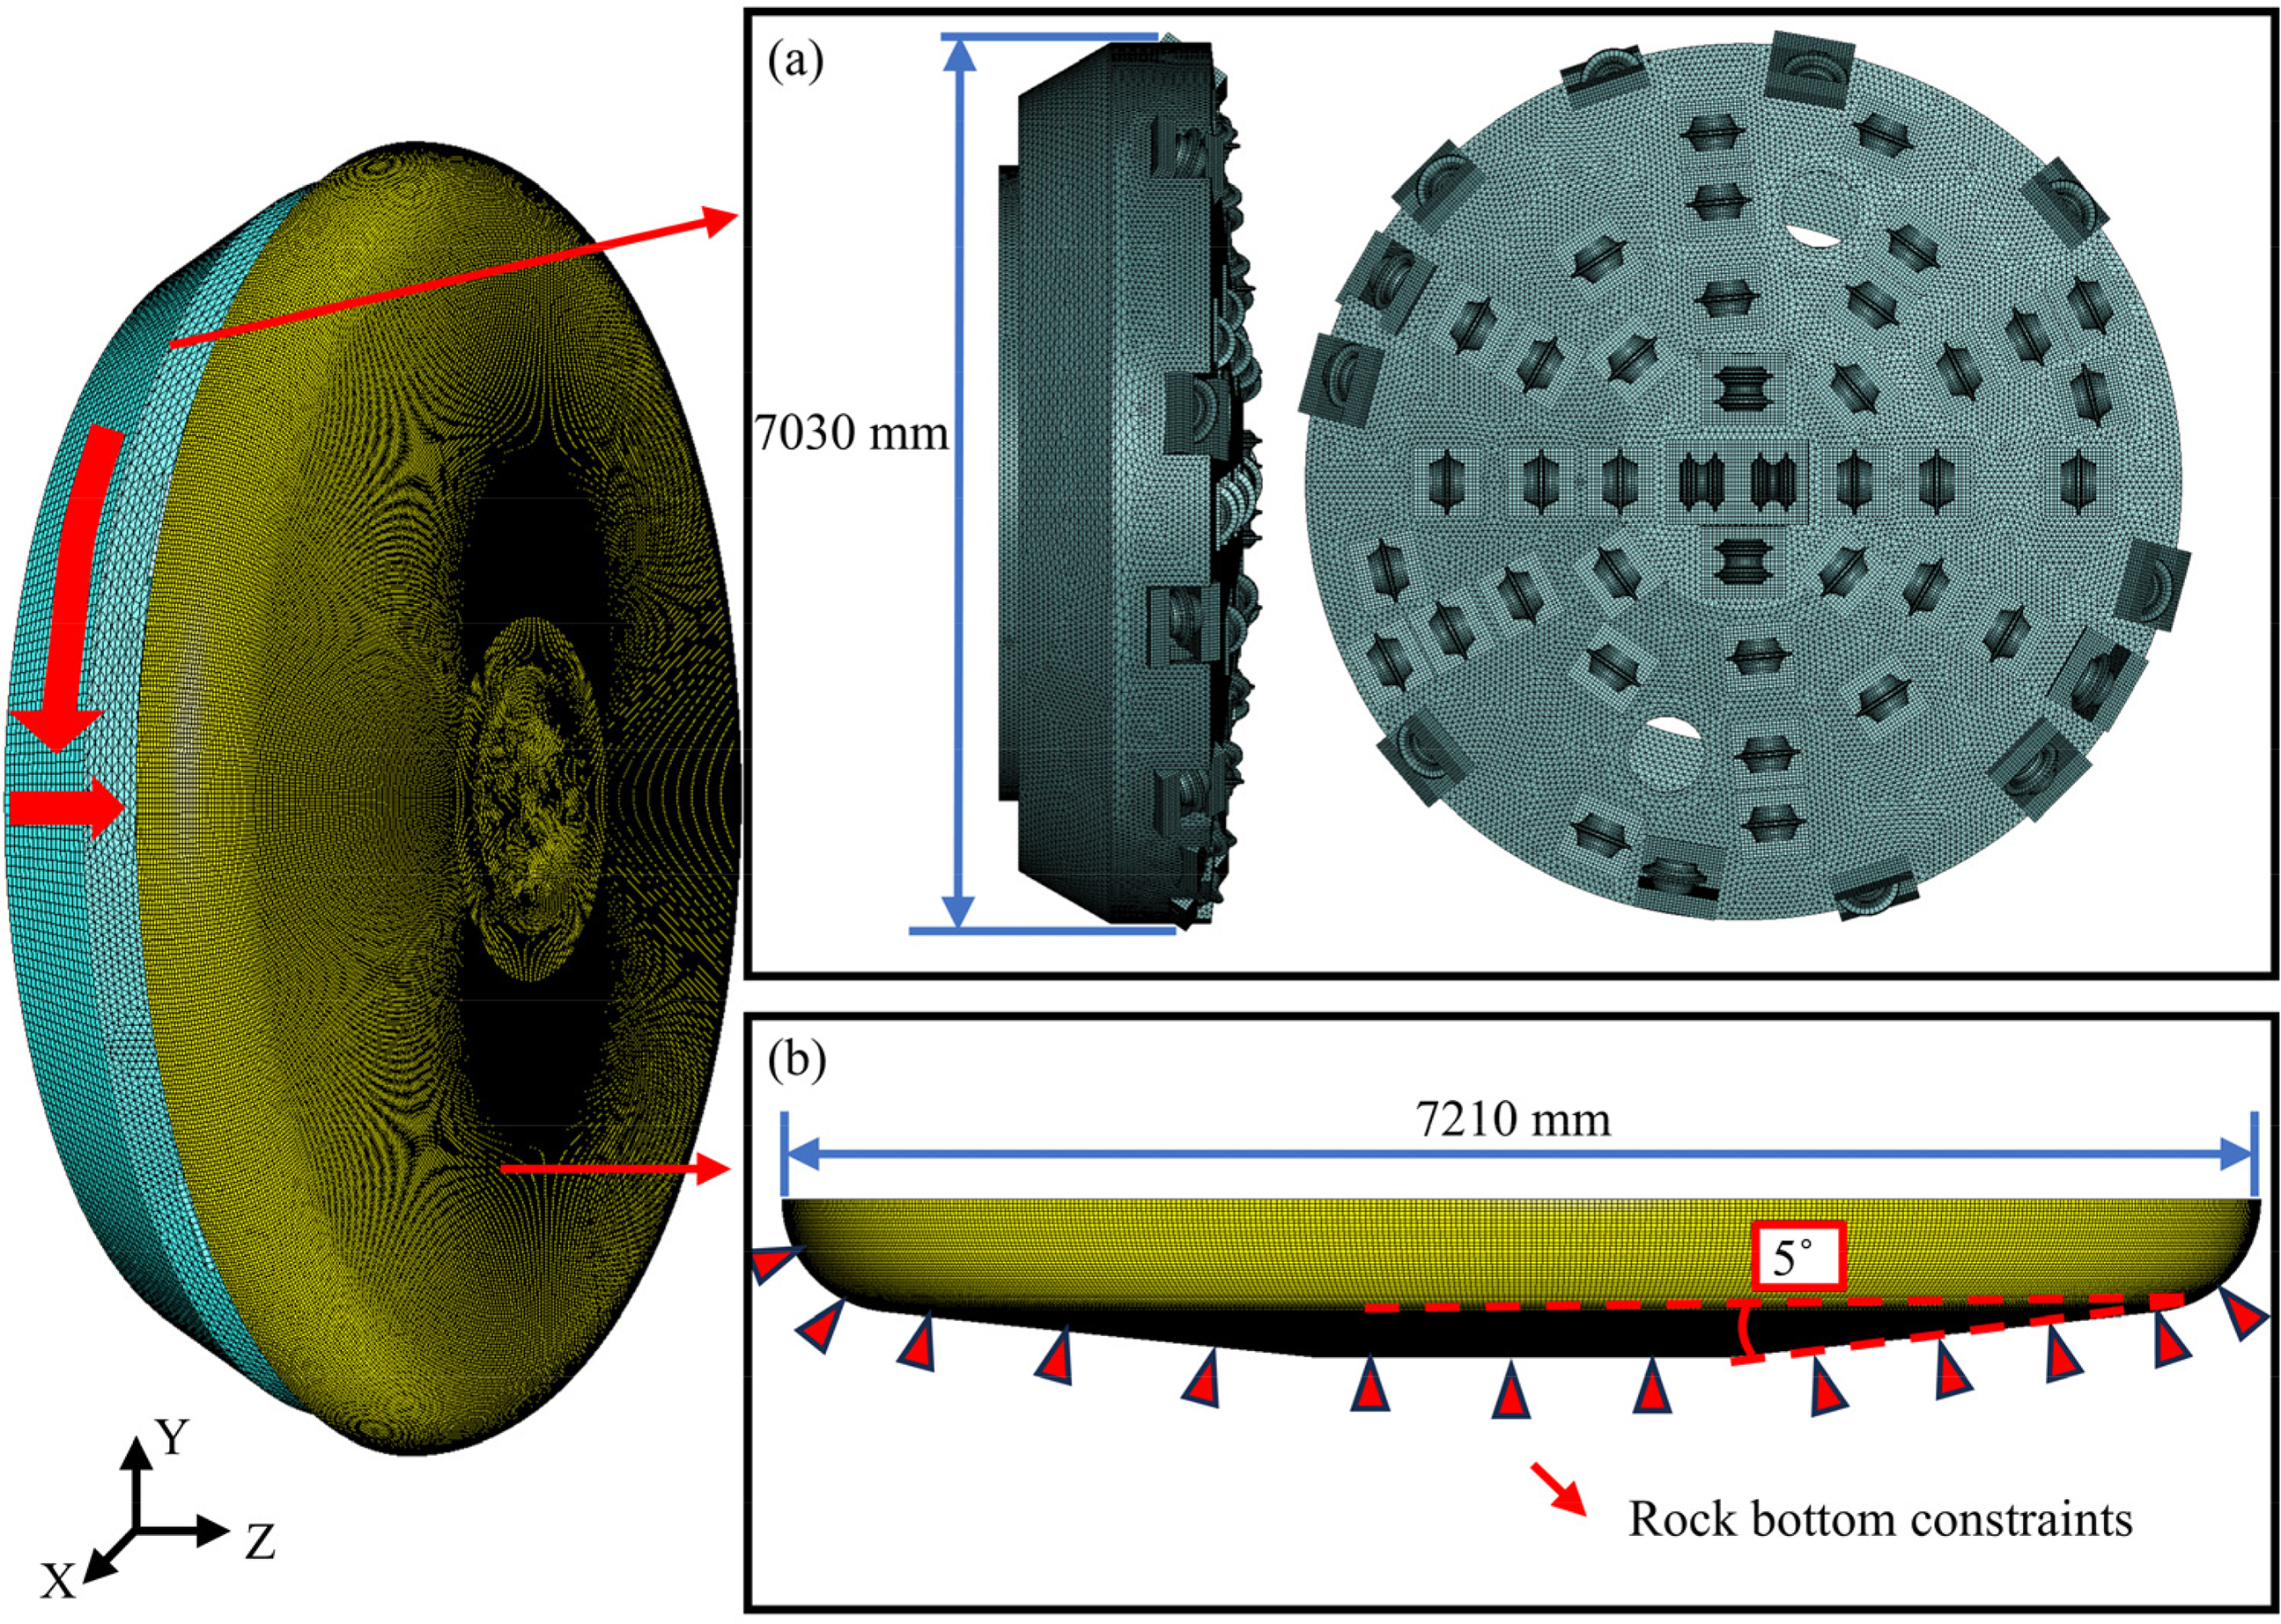
Cone-shape cutterhead tunnelling simulation model.
Numerical simulation scheme.
Cutterhead thrust
A simulation case is carried out by applying with the rotation speed of 4.5 r/min and penetration depth of 4 mm/r. As shown in Figure 9(a), the curve of the cutterhead thrust shows the characteristics of rock leap forward crushing. After the cutterhead comes into contact with the rock, the disc cutter on the cutterhead continuously cut the rock, and the cutterhead thrust will rapidly increase. After the cutterhead cuts to a certain depth, the thrust increases to the maximum value at that stage, and then the rock suddenly breaks, forming new fracture surfaces and fracture zones. At this time, the cutterhead thrust will quickly decrease to a lower value. The process of leap forward tunneling is repeated, leading to a stepwise characteristic of cutterhead thrust. The mean of cutterhead thrust is 14649 kN when the penetration depth is 4 mm/r. To reveal the distribution characteristics of the cutterhead thrust, K-S experiment is carried out on the simulation data, and it can be seen from Figure 9(b) that the cutterhead thrust obeys the normal distribution approximately.

Curve of cutterhead thrust over time and frequency distribution of cutterhead thrust.
Damage on the tunnel face
During simulation process, the rock is subjected to the cutting and erosive action of the cutterhead. When the damage threshold of rock model is reached, the rock mesh is deleted and the rock is damaged. Therefore, the damage level characterizes the degree of rock fragmentation. The statistics of the simulation results in after the second circle is relatively stable, which has been collected for analysis. The different regions of the rock damage level are demonstrated in Figure 10. It can be observed from Figure 10 that after the disc cutter intrudes into the rock, the rock under the disc cutter reaches its ultimate strength and is destroyed, then the damage spreads to both sides. The cutter cutting marks in the center area of the tunnel face is not penetrated, indicating a relatively low rock-breaking efficiency in this area. The rock damage in the front area extends to the free side, where the rock fragments are more likely to peel off from the tunnel face in front area, resulting in a continuous large-area damage area. The cutterhead rock-breaking efficiency is higher than the other areas. As shown in Figure 11, in order to monitor the rock-breaking effect on different areas of the tunnel face, the center of tunnel face is chosen as the origin point to arrange the C1–C7 spatial monitoring ring areas during simulation, with the radius of 0.5, 1, 1.5, 2, 2.5, 3, and 3.5 m, respectively. The rock damage levels of central disc cutter area (C1 and C2), frontal disc cutter area (C3, C4, C5, and C6), and edge disc cutter area (C7) are compared. As shown in Figure 12, the rock damage level in the center area is the lowest among all areas, with a mean of damage level of 0.0757. Due to the adoption of the cone-shape cutterhead design in the front rock-breaking area as shown in Figure 1(c), a free surface is formed between the cutterhead and the disc cutter, compared with the traditional plane cutterhead. Therefore, the tunneling efficiency of the frontal disc cutter area under extremely hard rock is enhanced, and the rock mass damage level is improved, with a mean of 0.0989, which is 30.6% higher than the central area. The rock damage level in the edge rock-breaking area is the highest due to the reduction of the cutter spacing in this area, and the rock damage level reaches 0.109. The frontal rock-breaking area is the largest and the rock damage level is relatively high at the same time. This indicates that the cone-shape disc cutter arrangement in the frontal rock-breaking area can improve the tunneling efficiency compared with the traditional cutterhead.

Equivalence surface map of rock damage level.

Distribution of rock damage monitoring areas.

Damage level of rock in different areas.
Calculation of rock-breaking volume and efficiency
The theoretical rock-breaking volume Vt at each moment of the cutterhead can be calculated by equation (1):
where D is the diameter of tunneling, unit mm; n is the rotation speed of the cutterhead, unit r/min; P is the penetration depth of the cutterhead, unit mm/r; t is the tunneling time, unit s; α is the theoretical rock-breaking efficiency. The rock-breaking volume in kth time step under the numerical simulation can be calculated by equation (2) as follows:
where v is the cell grid volume in m3; mi is the number of grids deleted by the cutterhead tunneling in the ith time step. The error between theoretical and actual volume can be calculated as following equation:
The curve of the rock-breaking volume with time is displayed in Figure 13. The rock-breaking volume gradually increases in the first 15 s. The simulated rock-breaking volume is smaller than the theoretical volume, which accounts for about 4.8% to 56.2% of the theoretical volume. After 45 s, the simulated rock-breaking volume accounts for about 94.5% to 99.3% of the theoretical rock-breaking volume. Because of the existence of 5° cone-shape surface of cutterhead, the center disc cutters are the first to contact with the rock and break the rock, which create a free surface for the front disc cutter to facilitate subsequent rock breaking. The rock-breaking volume at this time accounted for a small proportion in simulation because only the central cutters cut the rock. Then, the cutters in the frontal area penetrate into the rock, and the proportion of rock-breaking volume in this time gradually increased. After 45 s, most of the disc cutters penetrates into the rock, and a kind of stable tunneling process is reached. The difference between the theoretical and simulated rock-breaking volume decreases until it is close to 0. The rock-breaking volume at each time step in the simulation results is statistically calculated and linearly fitted in Figure 13(b). From equation (1), it can be seen that the slope of the fitted line represents the rock-breaking efficiency. The decision coefficient R2 for the linear fitting curve is 0.99125, indicating a high degree of linear fit. From Figure 13, the simulated rock-breaking efficiency is obtained as 0.01314 m3/s, when the rotation speed is 4.5 r/min and the penetration depth is 4 mm/r. The theoretical value of TBM rock-breaking efficiency is calculated using equation (1), and its value is 0.0122 m3/s. The error between theory and simulation is about 7.15%, indicating that simulation can accurately reflect the changes in TBM excavation efficiency.

Variations of rock-breaking volume and efficiency with time.
Effect of tunneling parameters on TBM performance
Effect of penetration depth on TBM tunneling performance
Thrust index analysis
The field penetration index (FPI) is a suitable metrics used to measure the tunneling performance of TBM cutterhead, as the tunneling thrust is increased with the increase of the penetration depth.27,28 The FPI is calculated as shown in equation (4):
where F is the cutterhead thrust, unit kN, P is the penetration depth, unit mm/r, and N is the number of disc cutters.
The load fluctuation of the cutterhead directly affects its stability and service life. Excessive load fluctuation of the cutterhead will lead to severe vibration during tunneling, greatly influence the wear of cutterhead and cutters. Therefore, the thrust fluctuation coefficient σ is introduced to describe the smoothness of the load fluctuation, which is calculated by equation (5):
In simulation, the cutterhead penetration depth was set to 2, 3, 4, 5, and 6 mm/r, respectively, while the cutterhead rotation speed was held constant at 4.5 r/min. The relationship between the thrust force and penetration depth was obtained and depicted in Figure 14 with the forms of violin, where the white point represents the median value of thrust, the top and bottom of the box represent the upper quartile Q3 and the lower quartile point Q1, respectively. And the upper and lower whiskers represent the upper and lower limits of normal data range, while the outer shape of the violin plot represents the kernel density estimate. As the cutterhead penetration depth increases, the median, upper quartile, and lower quartile of the thrust increase rapidly. At a penetration depth of 2 mm/rev, the median and upper quartile thrust values are the smallest, at 0.79 × 10⁴ kN and 1.13 × 10⁴ kN, respectively. Conversely, at 6 mm/rev penetration depth, these values are the largest, reaching 1.97 × 10⁴ kN (median) and 2.29 × 10⁴ kN (upper quartile). With increasing penetration depth, the distance between the top and bottom of the box (i.e. the interquartile range, IQR) decreases. The number of thrust values exceeding the upper whisker limit (positive outliers) increases, while the amount of data concentrated around the median decreases. The peak of the thrust distribution shifts upwards. These trends indicate that anomalous peak thrust events on the cutterhead become more likely. As shown in Figure 15, the FPI and Variation of regional damage

Violin plot of cutterhead thrust with different penetration depths.

Thrust fluctuation factor and FPI variation with different penetration depths.
The rock damage level in each monitoring area under different penetration depths is depicted in Figure 16, where C1–C7 correspond to the monitoring ring regions in Figure 11. The damage values for each ring under different penetration depths were collected and calculated to represent the damage level. The damage level in each monitoring ring exhibits a consistent trend with penetration depths that it initially decreases, then increases, reaching its maximum within the C4 monitoring ring. Specifically, the rock damage level for C4 at penetration depths of 2, 3, 4, 5, and 6 mm/rev is 0.116, 0.136, 0.163, 0.141, and 0.132, respectively. Beyond C4, the damage level decreases before rising again in the edge areas. Figure 17 shows the mean rock damage level across the entire tunnel face area for different penetration depths. There is a free surface between the cutters in the frontal rock-breaking area for conical cutterhead, where this area exhibits the highest rock damage level among all regions. The mean rock damage levels in the central monitoring area at penetration depths of 2, 3, 4, 5, and 6 mm/r are 0.027, 0.029, 0.035, 0.028, and 0.031, respectively. In contrast, the corresponding mean levels in the frontal monitoring area are 0.050, 0.053, 0.058, 0.052, and 0.051. These frontal area values represent increases of 85.2%, 82.8%, 65.7%, 85.7%, and 64.5% over the central area values, demonstrating that the free surface generated by the conical cutterhead significantly enhances rock mass damage in the frontal rock-breaking zone. Notably, when the cutterhead penetration depth is 4 mm/r, the maximum frontal damage level of 0.058 is achieved. It means that the tunneling performance of the whole cutterhead is the best and the tunneling efficiency is the highest.
Variation of rock-breaking volume and efficiency

Damage level of rock in each area with different penetration depths.

Mean of damage level of rock with different penetration depths.
As shown in Figure 18, the rock-breaking volume achieved during the 60 s simulation period under different penetration depths was statistically analyzed and subjected to linear fitting. The rock-breaking volume increases approximately linearly with increasing penetration depth. At penetration depths of 2, 3, 4, 5, and 6 mm/r, the simulated rock-breaking volumes are 0.35, 0.54, 0.73, 0.92, and 1.13 m3, respectively. It indicates an approximately linear relationship between penetration depth and rock-breaking volume. The rock-breaking efficiency obtained from numerical simulations under different penetration depths with the theoretical values calculated using equation (1) are compared, as shown in Figure 19. The linearly fitted rock-breaking efficiency from the simulations is slightly higher than the theoretical efficiency. The mean error of the simulated efficiency values relative to the theoretical values is 5.14%, with individual errors ranging from 0.65% to 9.01%. The primary reasons for the discrepancy between simulation and theoretical values are the idealized conditions in the simulation model, including the simplified cutterhead layout, the assumption of homogeneous (or simplified anisotropic) rock properties, the simplified disc cutters, and the difficulty in replicating actual stratigraphic conditions and in-situ ground stress states. Nevertheless, the numerical modeling results are broadly consistent with the theoretical predictions, and the errors are within permissible limits. It validates the reliability of the numerical model for simulating rock breaking with the conical cutterhead.

Volume of rock breaking with different penetration depths.

Comparison of simulated and theoretical rock-breaking efficiency with different penetration depths.
Effect of rotation speed on TBM tunneling performance
Thrust index analysis
To investigate the effect of rotation speed on TBM tunneling performance, simulations were conducted with the cutterhead rotation speed set to 3.5, 4.0, 4.5, 5.0, and 5.5 r/min, while penetration depth keep the constant at 4 mm/r. The variation in thrust force with rotation speed is shown in Figure 20 using violin plots.
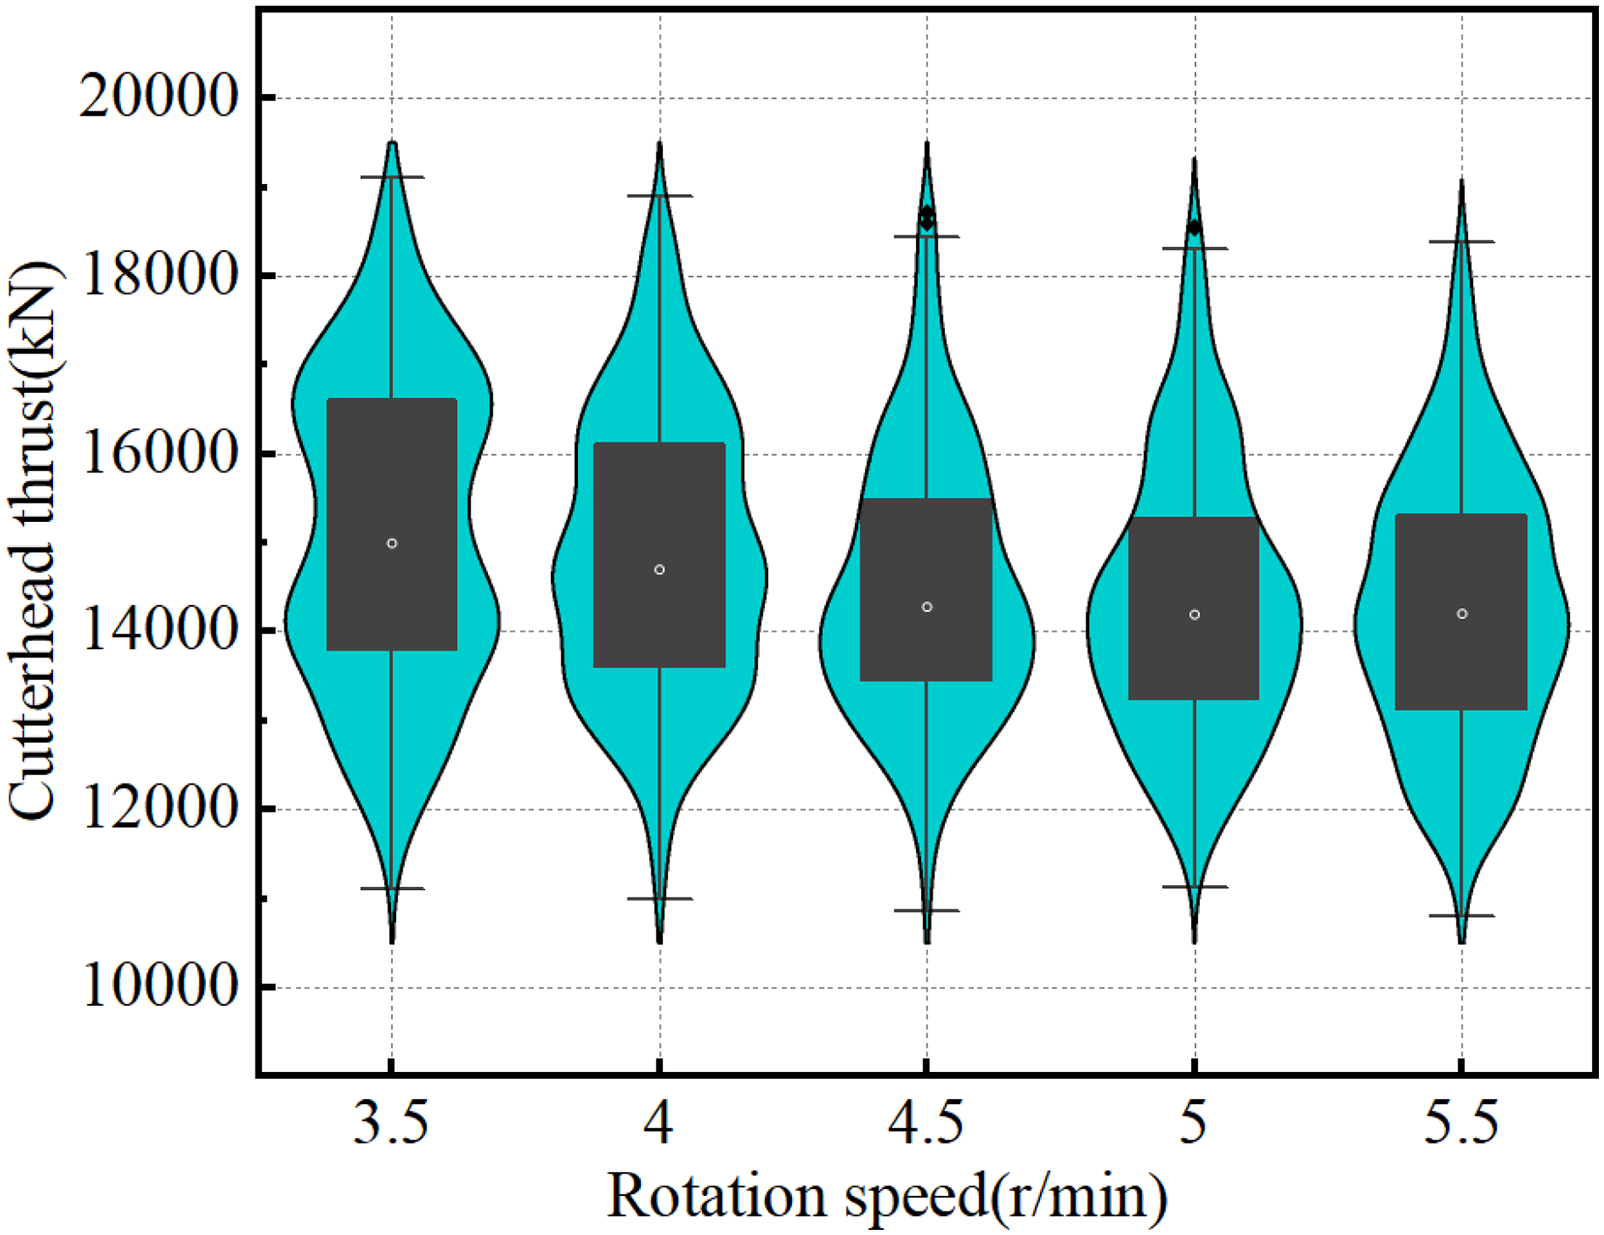
Violin plot of cutterhead thrust with different rotation speeds.
Overall, thrust force exhibits minimal change with increasing rotation speed. However, the median, upper quartile, and lower quartile of the thrust display a pattern of gradual decrease followed by a slight increase. The smallest thrust values occur at 5.0 r/min, with an upper quartile of 1.82 × 10⁴ kN and a median of 1.16 × 10⁴ kN. Conversely, the largest values occur at 3.5 r/min, with an upper quartile of 1.88 × 10⁴ kN and a median of 1.50 × 10⁴ kN. As rotation speed increases, the distance between the top and bottom of the box (IQR) initially narrows slightly and then slowly widens. Except at 3.5 rev/min, thrust values exceeding the upper whisker limit (positive outliers) are infrequent, and most data points are concentrated below the median. This indicates that higher cutterhead rotation speeds reduce thrust fluctuation and shift the peak of the thrust distribution downward. The FPI and Variation of regional damage
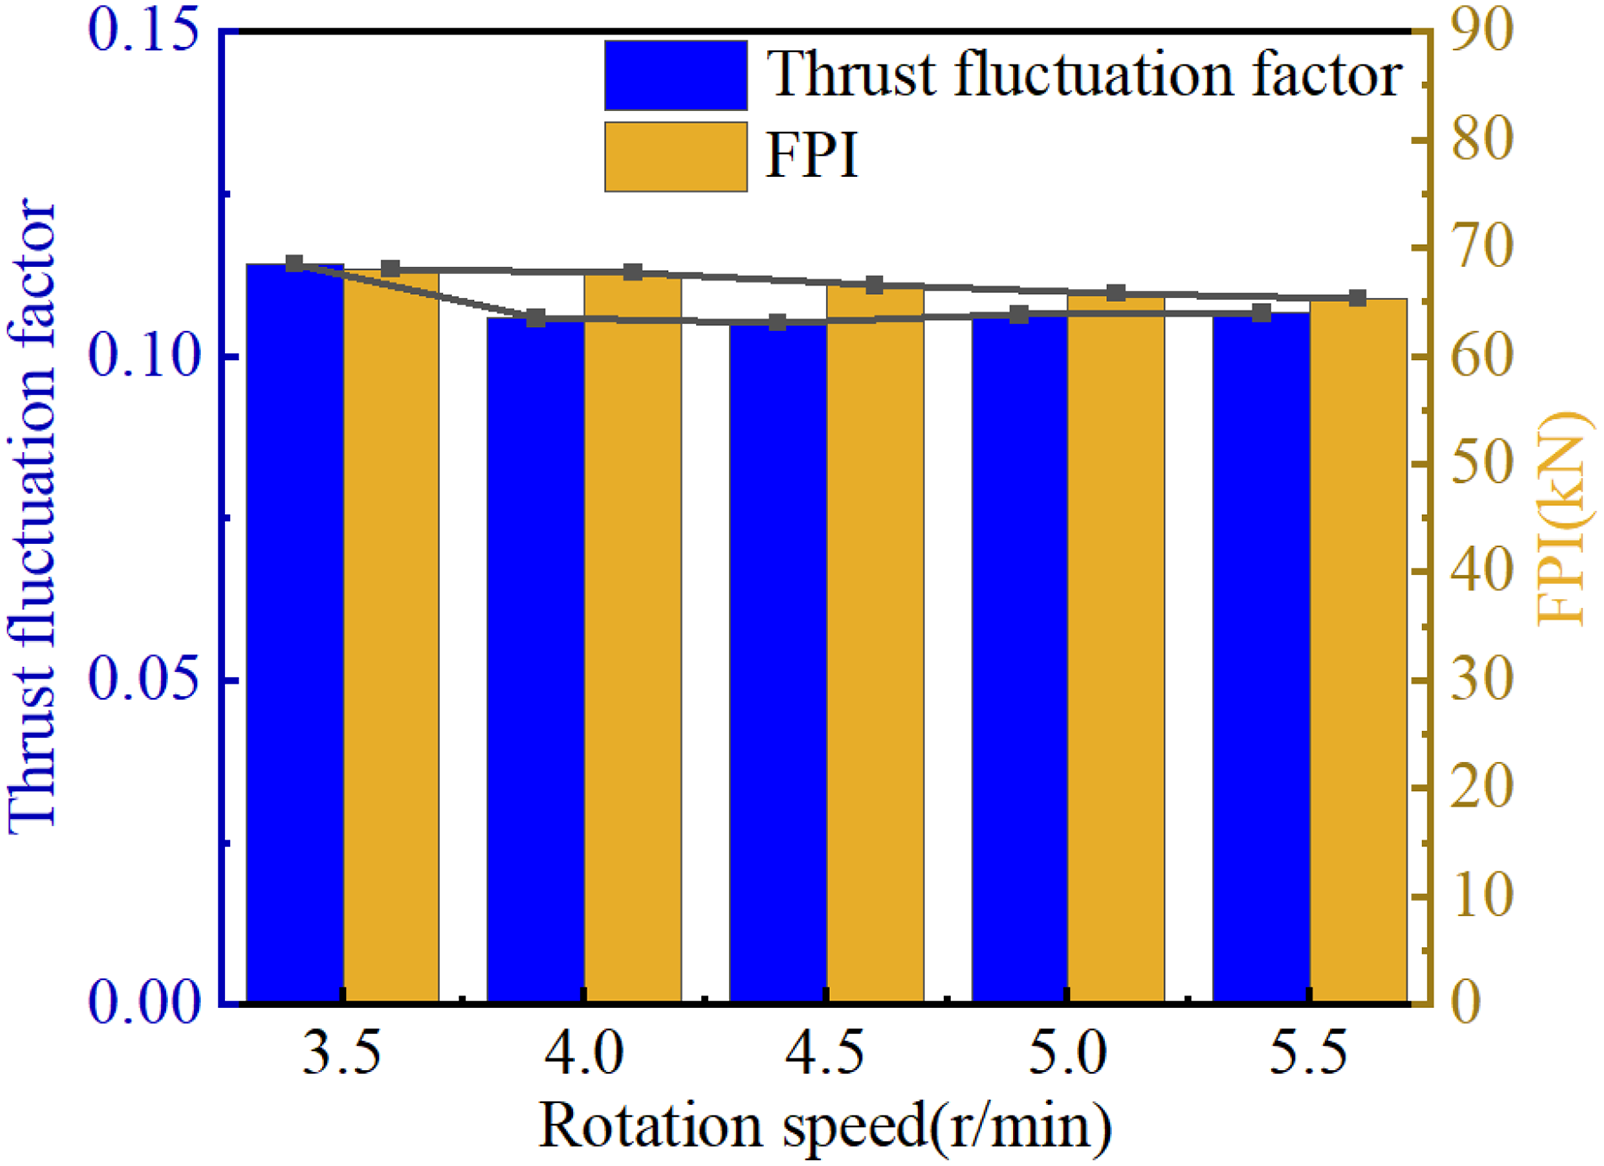
Thrust fluctuation factor and FPI variation with different rotation speeds.
The rock damage level in each monitoring area under different cutterhead rotation speeds is shown in Figure 22. The trend in damage level across rotation speeds follows a similar pattern to that observed under varying penetration depths. However, compared to penetration depth, rotation speed has a much smaller effect on the damage level at each monitoring point. Consistent with the penetration depth results, the damage level of the monitoring rings decreases initially and then increases, peaking at the C4 ring. At rotation speeds of 3.5, 4.0, 4.5, 5.0, and 5.5 r/min, the rock damage level at C4 is 0.147, 0.149, 0.162, 0.151, and 0.151, respectively. Conversely, the damage level is minimized at the C2 monitoring ring, with values of 0.0166, 0.0179, 0.0289, 0.0205, and 0.0197 at the corresponding speeds. On average, the damage level at C2 accounts for approximately 15% of the value at C4. Figure 23 shows the mean rock damage level under different rotation speeds. In the central monitoring area, the mean damage levels are 0.03795, 0.0406, 0.04635, 0.0415, and 0.04325 at 3.5, 4.0, 4.5, 5.0, and 5.5 rev/min, respectively. The corresponding mean damage levels in the frontal monitoring area are higher: 0.07123, 0.07205, 0.07463, 0.07363, and 0.07498. It indicates that rotation speed has less influence on damage levels in the frontal and edge areas compared to the central area. Notably, the maximum rock damage level occurs at a cutterhead speed of 4.5 rev/min, indicating that the cutterhead has the best excavation performance.
Variation of rock-breaking volume and efficiency

Damage level of rock in each area with different rotation speeds.
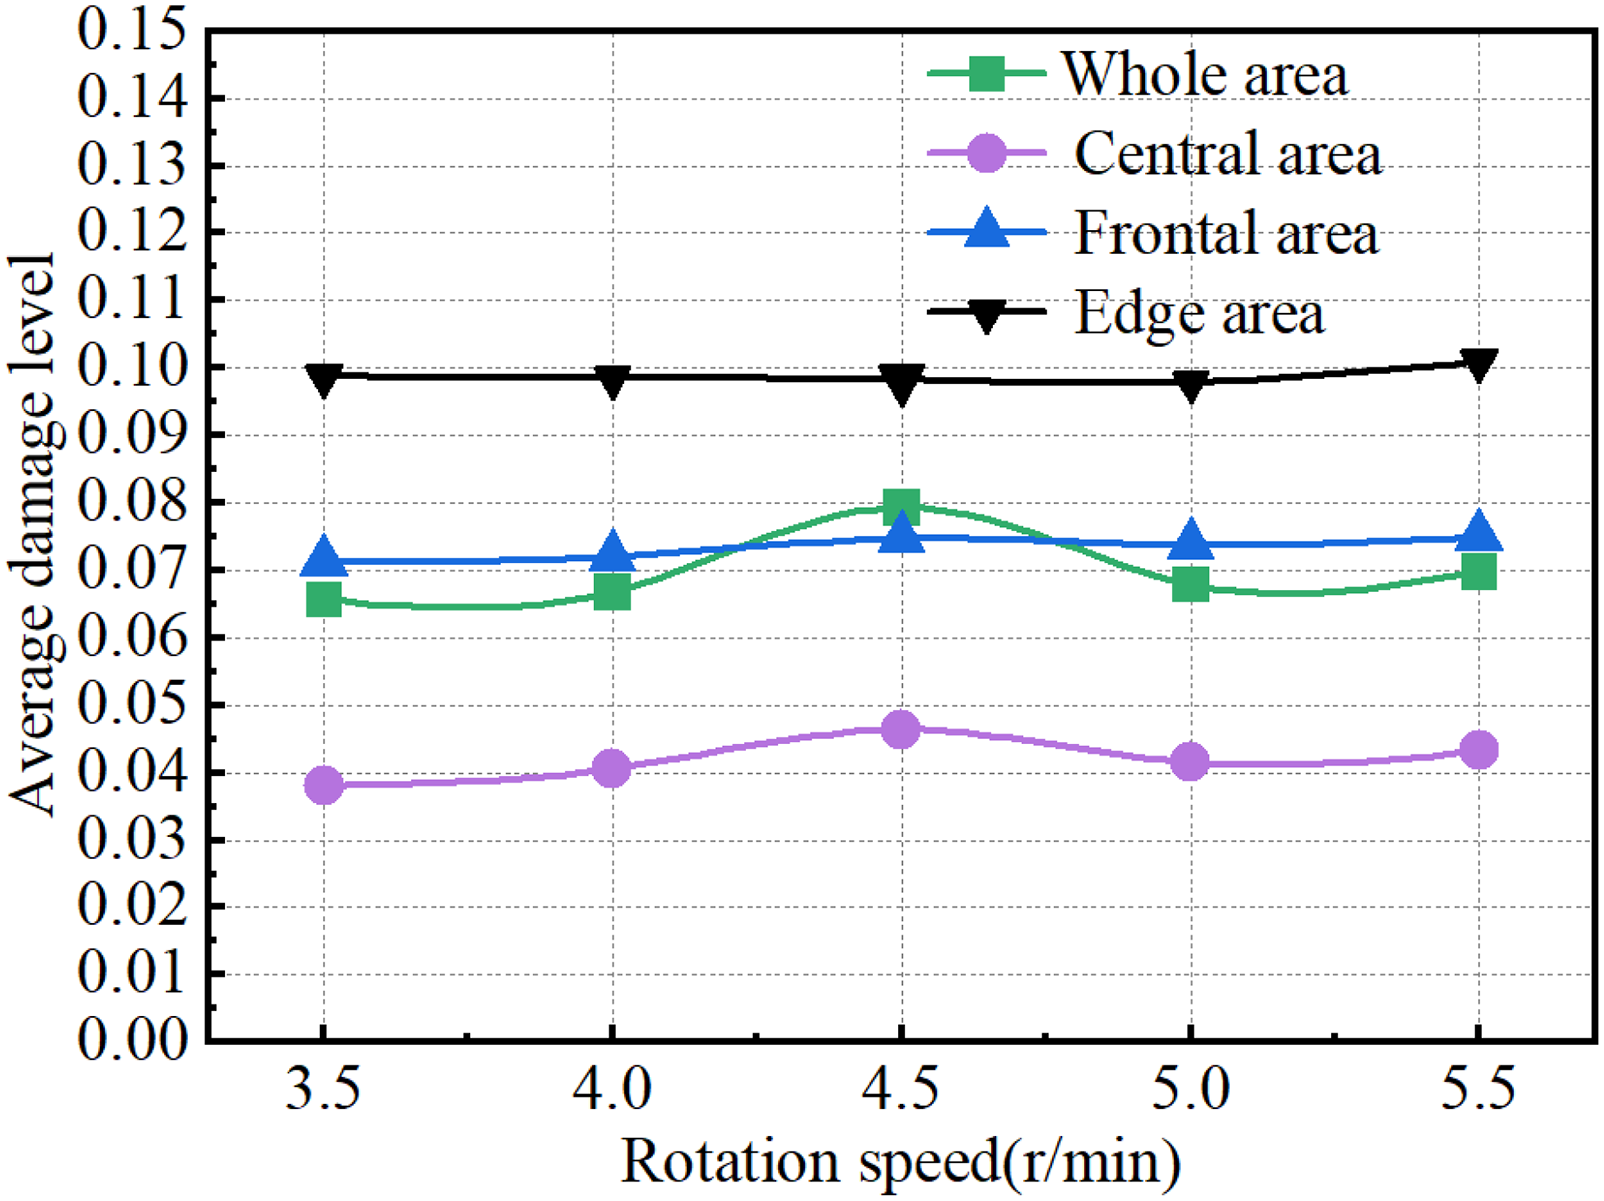
Mean of damage level of rock with different rotation speeds.
Figure 24 presents the simulated rock-breaking volume under different rotational speeds, along with its linear fit. The rock-breaking volume increases approximately linearly with increasing rotation speed. Comparison with Figure 18 reveals that the influence of rotation speed on rock-breaking volume is less pronounced than that of penetration depth. Specifically, the simulated volumes are 0.55, 0.65, 0.73, 0.82, and 0.92 m3 at rotation speeds of 3.5, 4.0, 4.5, 5.0, and 5.5 r/min, respectively. Figure 25 compares the simulated and theoretical rock-breaking efficiencies. The linearly fitted efficiency values from the numerical simulations consistently exceed the theoretical efficiencies. The corresponding errors are 1.75%, 5.14%, 6.77%, 7.67%, and 8.33%, yielding a mean error of 5.93%. At the maximum tested speed of 5.5 r/min, the cutterhead achieves peak rock-breaking efficiency (0.0163 m3/s) and maximum volume per unit time. However, excessively high rotation speeds should be avoided in practice, as thrust fluctuation and energy consumption require simultaneous optimization.

Volume of rock-breaking different rotation speeds.

Comparison of simulated and theoretical rock-breaking efficiency different rotation speeds.
Engineering validation
In order to verify the reliability and usability of the simulation, this paper compares the cutterhead thrust obtained from simulation with the thrust in an actual project. As shown in Figure 26, the tunneling data from January 24, 2023 to March 28, 2023 were intercepted. The monitoring values of the cutterhead thrust at the mean of penetration of 3 mm/r and 5 mm/r were compared with the cutterhead thrust in the corresponding simulation. The mean of values of the cutterhead thrust from the actual engineering data are 12,531 kN and 18,291 kN, respectively, while the means of values of the thrust in simulation are 11,827 kN and 17,702 kN. The errors with the engineering site are 5.6% and 3.2%, respectively, showing the simulation is very similar to engineering data. The failure status of the tunnel face in the simulation is compared with the engineering site, as shown in Figure 27. In both simulation and actual engineering, the tunnel face forms concentric ring-shaped damage effect, the distribution of grooves in the central rock-breaking area is relatively sparse. The distribution of grooves in the frontal rock-breaking area is relatively dense, which further shows that the free surface effect of the cone-shape cutterhead is significant for the enhancement of the tunneling efficiency. In summary, the cutterhead thrust values obtained from numerical simulations, as well as the damage to the tunnel face, show a high degree of consistency with the actual engineering site conditions, which verifies the reliability of the rock material constitutive model and further verifies the accuracy of cone-shape cutterhead simulation model.

Comparison of numerical simulation and engineering actual cutterhead thrust.

Comparison of rock damage state between engineering site and numerical simulation.
Conclusion
In this paper, a numerical simulation model of cone-shaped cutterhead cutting the tunnel face was established, where the cutterhead thrust, tunnel face damage and rock-breaking efficiency under different tunneling parameters are analyzed. The effectiveness and reliability of the simulation model was verified by cutter-breaking cone-shape rock experiment and engineering data from TBM construction site. Optimal tunneling parameters of cone-shape cutterhead are proposed with excellent rock-breaking performance of TBM. The main conclusions are as follows:
A series of numerical simulations of cone-shaped cutterhead cutting the tunnel face under different penetration depth and rotation speed have been conducted, and the influence laws of penetration depth and rotation speed on the rock-breaking performance of cutterhead has been obtained. It indicates that penetration depth has a greater impact on FPI, thrust fluctuation index and rock damage than those of rotation speed. And the cutterhead thrust is more prone to abnormal peaks when penetration depth increases. When the rotation speed increases, the probability of extreme abnormalities in the cutterhead thrust is relatively low. When the penetration depth and rotation speed increase, the amount of rock fragmentation increases linearly and the efficiency improves.
Through a series of simulation analysis of the 5° cone-shape cutterhead breaking extremely hard granite with 169.5MPa strength, the optimal tunneling parameters combination of conical cutterhead can be obtained. When the penetration depth and rotation speed of the cone-shape cutterhead is set as 4 mm/r and 4.5 r/min, respectively, the thrust fluctuation is minimum, and overall damage of tunnel face reaches is maximum, and the rock-breaking efficiency is the highest.
The rock-breaking performance optimization method through simulation of conical cutterhead proposed in the paper can be adopted to other TBM project. The rock-breaking performance laws of cutterhead with different cone angle, tunneling parameters under different rock strength can be explored, and the optimal tunneling parameters combination of conical cutterhead with different cone angles under different strength rock can be obtained. Furthermore, the rock-breaking performance of the cutterhead in complex and variable strata can also be simulated, and the optimal tunneling parameters for rock-breaking performance can be obtained.
The interaction between the penetration depth and rotational speed is critical to TBM rock-breaking performance. In the future study, the coupled effect of penetration depth and rotational speed on the rock-breaking performance would be investigated. Furthermore, during a long-distance excavation of TBM, complex rock boundary situation, geological conditions, rock properties, and the wear of disc cutter will change over time, which effecting the tunneling performance together. It is necessary to further study the coupled effect of rock boundary situation, geological conditions, rock properties and tunneling parameters on the rock-breaking performance of cutterhead. Moreover, comprehensive and objective evaluation method is needed to make decision of cutterhead tunneling parameters in real time and dynamically.
Footnotes
Funding
The author(s) disclosed receipt of the following financial support for the research, authorship, and/or publication of this article: This work was supported by the Independent Exploration and Innovation of Graduate Students of Central South University, Natural Science Foundation of Hunan Province, CAEA Innovation Center for Geological Disposal of High-Level Radioactive Waste Foundation, the Postgraduate Scientific Research Innovation Program of Hunan Province, (grant number 2023ZZTS0285, 2023JJ40757, CXJJ21102203, CX20230355).
Declaration of conflicting interests
The author(s) declared no potential conflicts of interest with respect to the research, authorship, and/or publication of this article.
Availability of data and materials
All data generated or analyzed during this study are included in this published article.