
Abstract
Sand transport is the main manifestation of sand damage in the arid and semiarid regions globally. It is a huge challenge to stabilize mobile sandy and change them into stable productive ecosystems. The establishment of simulated shrubs is one of the most effective measures to solve the above difficulties as a novel sand-barrier. To clarify simulated shrubs’ role in the process of ecological restoration. It will be greatly helpful to incorporate the shelter device proposed in the present work into landscape models for aeolian soil transport, to optimize the parameters associated with the sand-barrier characteristics for aeolian soil stabilization at the field scale. A series of wind tunnel experiments were conducted to analyze the variations of soil grain-size of simulated shrubs with different spatial configurations, row spaces, and net wind speeds. Further, the soil grain-size parameters were calculated by the classic method proposed by Folk and Ward to clarify the change of soil particles resulted from the blocking effects. The average grain-size content of simulated shrubs with different spatial configurations, row spaces, and net wind speeds was dominated by medium sand and fine sand, and the total percentage was more than 90%. Moreover, the sand deposition of simulated shrubs with different spatial configurations increased with the improvement of wind speeds. The average sand deposition of spindle-shaped simulated shrubs in 17.5 × 17.5 cm and broom-shaped simulated shrubs in 17.5 × 26.25 cm under different net wind speeds was the least. The effects of row spaces on average grain-size parameters increased with the improvement of net wind speeds. By calculating the correct characteristics of specific shelter devices proposed in the present work, all of these findings suggest that the application of simulated shrubs will be an important component to further extend ecological engineering projects in arid and semiarid regions.
Keywords
Introduction
Researches on reducing sand blow have gained increasing worldwide attention as a response to land desertification and climate change.1,2 Many sand-control engineering techniques (e.g. straw-checkerboard, stone-checkerboard, hole plated-type, Salix psammophila, sand fence, HDPE (High-density Polyethylene), and clay sand-barriers are produced to protect oil field installations, roads, and living facilities from being buried by sand blow. In the long-term field application, it is found that the traditional sand-barrier layer commonly suffers from short life, weak durability, poor effect, serious pollution, and other restrictions. Based on this, simulated shrubs used in this study offer a long using-life, recycle material, and great effects to successfully manage the near-surface sand flow. Moreover, the simulated shrubs are designed which have a three-dimensional, flexible, directly-use, and characteristic breaking through the bottleneck of complicated installation and poor effect in fields with traditional sand-barriers. Besides, it has beautiful visual effects while playing key roles in sand-fixation.3–7
The field measurement, wind tunnel experiments, and numerical simulations have been contributing to acquiring a better quantitative understanding of the turbulent wind field over sand-barriers erected to stabilize aeolian soil. And the soil grain-size is considered as one of the major parameters described when the development of aeolian soil.8–10 The grain-size strongly affects aeolian particle transport and makes grain-size analysis an important tool of aeolian research.11–13 Grain-size parameters and sorting variations of sediments can provide important information about aeolian depositional processes and the associated environment. At present, 9 the horizontal and vertical characteristics of soil grain-size are the two main research aspects of aeolian soil.14,15 Finer crest, coarser crest, and no difference are three models that are used to describe mean grain-size patterns for sediments in deserts. Lancaster 16 and Dong et al. 17 found that the mean grain-size and sorting became finer when transport distances increased. However, Qian et al. 18 found that the mean grain-size did not change with distance changed in the Badain Jaran Desert, and Chen 19 found that there was no relationship between the soil grain-size and transport distance. Moreover, Zhang et al. 20 found that grain size distribution in barchan dune fields can include a broad range of particle sizes, from fines to gravel-sized particles. So findings related to soil grain-size haven’t yet been agreed upon, and it should be gained increasing studies. The soil grain-size distribution and protective effect of sand-barriers depend on their geometric design, covering height, length, width, porosity, opening size, hole distribution, row spaces, etc.21,22 Among these factors, geometric design (spatial configurations) and row spaces are the main structural characteristics influencing the protection efficiency of sand-barriers and are also the factors that the present work focuses on.23–26 Extensive types of research and encouraging results about all kinds of sand-barriers have been done, including soil grain-size variation, sediments transportation, and their effectiveness. Yet, simulated shrubs as one of the novel sand-barriers, little is known concerning the sand deposition around simulated shrubs with different spatial configurations and row spaces. Therefore, based on a series of wind tunnel experiments, the variations of soil grain-size of simulated shrubs with different spatial configurations, row spaces, and net wind speeds were studied in detail to optimize the parameters associated with the sand-barrier characteristics for aeolian soil stabilization that yield the most effective protection. By calculating the “correct” characteristics of specific shelter device proposed in the present work, all of these findings suggest that the application of simulated shrubs will be an important component to further extend ecological engineering projects in arid and semiarid regions.
Methods
Set-up of wind tunnel experiment
The wind tunnel experiment was conducted in the Key Laboratory of Desert and Desertification of the Chinese Academy of Sciences, Lanzhou, China. The wind tunnel consists of six sections:
(1) Air inflow, (2) impeller, (3) flow stabilization, (4) flow contraction, (5) test section, and (6) outflow diffusion section. The wind tunnel is 37.78 m long totally and the size of the test section is 16.23 m (Length) × 1 m (Width) × 0.6 m (Height). This is a non-circulating blow-type wind tunnel, which wind speeds ranges from 1 to 40 m/s (turbulence intensity <0.4%). The thickness of the boundary layer in the test section is more than 120 mm. The arrangement of simulated shrubs and instruments in the test section of the wind tunnel is shown in Figure 1. According to the continuously adjustable imported wind speed, the study of soil grain-size and sand deposition of simulated shrubs with different spatial configurations under different row spaces and net wind speeds can be carried out.
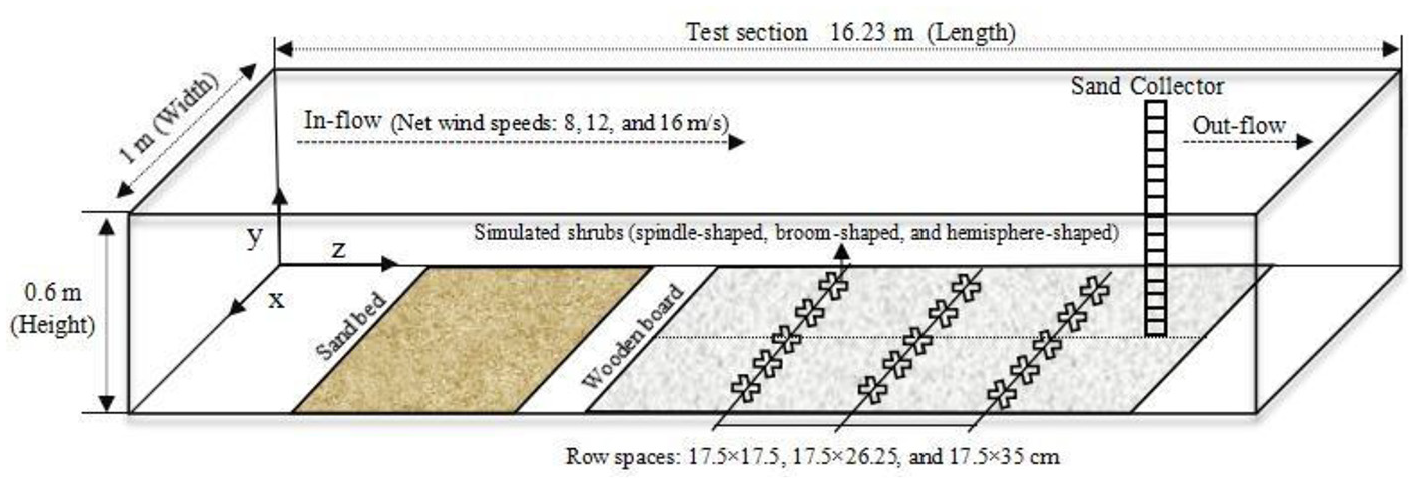
Arrangement of simulated shrubs and instruments in the test section of the wind tunnel.
Structure of simulated shrubs
Before the wind tunnel experiment, the height, canopy dimension, and canopy porosity of annual Nitraria tangutorum in the field were measured. As shown in Table 1, the canopy dimension was calculated by the long diameter × width diameter × thickness of the leaf. 27 The optical porosity of the canopy was obtained by using the ERDAS IMAGINE 9.2 and then analyzed by an unsupervised classification method of canopy photographs. Accordingly, the simulated shrubs used in this study were at a scale of 1:4 (simulated shrubs:field shrubs), and the geometric morphology and canopy porosity of simulated shrubs are the same as field shrubs (Nitraria tangutorum).
The morphological characteristics of the field and simulated shrubs.
The simulated shrubs consist of new material that is polymerized by anti-aging polymer compounds. Compared with the materials of traditional sand-barriers, the using-life of simulated shrubs is longer than 15 years. To make the simulated shrubs keep upright under different net wind speeds, the simulated shrubs are made of iron wires wrapped in plastic and were fixed in the wooden board of the test section of the wind tunnel. The overall height of simulated shrubs is 22 cm, of which the height above the wooden board is 17.5 cm, the height below the wooden board is 4.5 cm. The number of main branches for every simulated shrub is 8–10. Each main branch contains 10–15 leaves which are flat and obovate with 3 cm in length, 1.5 cm in width, and 0.1–0.2 mm in thickness. Based on the features of branches and leaves of Nitraria tangutorum in the fields, three spatial configurations of spindle-shaped, broom-shaped, and hemisphere-shaped shrubs were made. Simulated shrubs with different spatial configurations (left) and a schematic diagram of simulated shrubs fixed in the test section of the wind tunnel (right) are shown in Figure 2.

Simulated shrubs with different spatial configurations (left) and a schematic diagram of simulated shrubs fixed in the test section of the wind tunnel (right).
Collection of aeolian soil
A sand collector with 15-layer stepped was placed behind the last row of simulated shrubs about 50 cm and the entrance section of each layer of the sand collector is 1 cm (Width) × 2 cm (Height), layer numbers of the sand collector (1–15) represents the height of sand collector with 2, 4, 6, 8, 10, 12, 14, 16, 18, 20, 22, 24, 26, 28, and 30 cm, respectively. 28 The bottom of the sand collector flushed with the bottom of the wind tunnel. The sand transported from Ulan Buh Desert was laid 50 cm in front of the first row of simulated shrubs, and the thickness of the sand layer was 8–10 cm to ensure a sufficient and stable supply of sand sources. The sand layer was re-arranged after every wind experiment. In this work, three net wind speeds with 8, 12, and 16 m/s were performed. Among them: 8 min at 8 m/s, 4 min at 12 m/s, and 2 min at 16 m/s. Further, the row space was 17.5 × 17.5 cm, 17.5 × 26.25 cm, and 17.5 × 35 cm, respectively. Moreover, the experiment without simulated shrubs was used as a control (CK) to clarify the sand blocking effects of simulated shrubs with different spatial configurations, row spaces, and net wind speeds.29,30
To determine the dynamic similarity in the wind tunnel experiment, the Reynolds number (Re) was calculated using the method proposed by Wu and Yang. 29 The calculated Re is 6.9 × 10⁴–12 × 104, which means that a self-similarity requirement with a fully turbulent flow environment for the wind tunnel experiment was achieved.
Analysis of soil grain-size
Air drying, sieve off impurities, and desalt of sediment samples were conducted in the Key Open Laboratory of National Forestry Administration for the Protection and Cultivation of Biological Resources in Sandy Land of Inner Mongolia Agricultural University. First, we used an electronic scale with an accuracy of 0.01 g to weigh the soil samples. Next, we passed the soil samples by using a shaker through sieves ranging from −2Φ to 6.64Φ (10–4000 μm) in size, at intervals of 1/3Φ, 9 and the results were expressed as the weight percentage. Then,31,32 each 5 g soil sample was fully heated by adding 10 ml Hydrogen Peroxide and 10 ml Hydrochloric Acid. And distilled water was used to completely remove carbonate from soil samples. After 24 h, the pH value was tested repeatedly until it was between 6.5 and 7.0. Finally, 33 the soil grain-size distributions were measured using a Malvern MasterSizer 3000 (Malvern Instruments Ltd., Malvern, UK), combined with Hydro LV large capacity pool. 34 The measurement accuracy is 0.6%. Each soil sample was repeated three times and its arithmetic average value was calculated.
Further,35,36 the proportions of gravels, sands, silts, and clays were made according to the Udden-Wentworth grain-size classification method. The soil grain-size was divided into seven grades: extremely coarse sand (ECS) (2000–1000 μm), coarse sand (COS) (1000–500 μm), medium sand (MS) (500–250 μm), fine sand (FS) (250–100 μm), extremely fine sand (EFS) (100–50 μm), silt sand (SS) (50–2 μm), and clay sand (CS) (<2 μm), respectively. Moreover, four soil grain-size parameters were calculated according to the method proposed by Folk and Ward 37 : the mean grain-size (Mz), sorting (δ), skewness (Sk), and kurtosis (Kg). The gradation of soil grain-size parameters is shown in Table 2.
Gradation of soil grain-size parameters.

Results and analysis
The average percentage content of soil grain-size
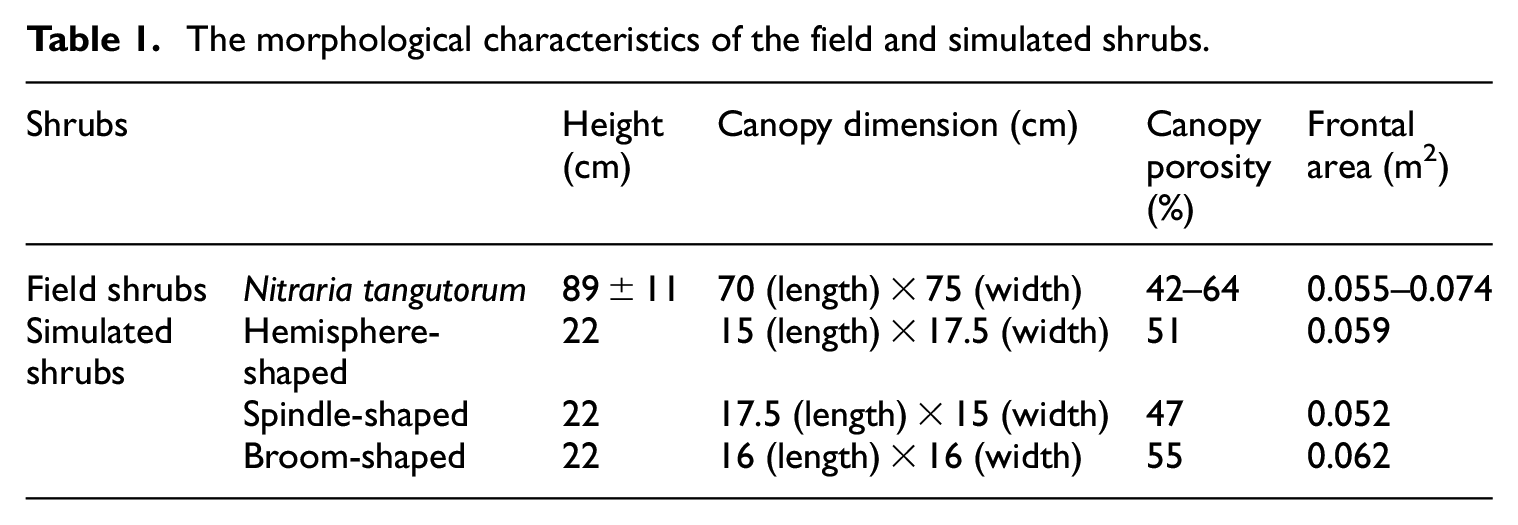
Figure 3 shows the average soil grain-size content among the simulated shrubs of different spatial configurations (hemisphere-shaped, spindle-shaped, and broom-shaped), row spaces (17.5 × 17.5 cm, 17.5 × 26.25 cm, and 17.5 × 35 cm), and net wind speeds (8, 12, and, 16 m/s). The average soil grain-size content was dominated by medium sand ranging from 250 to 500 μm, followed by fine sand ranging from 100 to 250 μm. And there were less in other average soil grain-size content and these were almost the same. The percentage of the medium sand and fine sand was more than 90%, while the other soil grain-sizes were less than 10%. Moreover, the clay sand was the smallest with a varied range of 0.01%–0.05%. All in all, there was less variation of average soil grain-size content among the simulated shrubs of different spatial configurations, row spaces, and net wind speeds.
Average soil grain-size content among the simulated shrubs of different spatial configurations (hemisphere-shaped, spindle-shaped, and broom-shaped), row spaces (17.5 × 17.5 cm, 17.5× 26.25 cm, and 17.5 ×35 cm), and net wind speeds (8, 12, and 16 m/s) (COS, SS, EFS, FS, MS, CS, and ECS represent coarse sand, silt sand, extremely fine sand, fine sand, medium sand, clay sand, and extremely coarse sand, respectively).
Characteristics of sand deposition
Figure 4 shows characteristics of sand deposition among the simulated shrubs of different spatial configurations (hemisphere-shaped, spindle-shaped, and broom-shaped), row spaces (17.5 × 17.5 cm, 17.5 × 26.25 cm, and 17.5 × 35 cm), and net wind speeds (8, 12, and 16 m/s). The sand deposition of simulated shrubs with the different spatial configurations increased with the improvement of wind speed, but there was no obvious difference in a sand deposition under different row spaces. The variation range of sand deposition under simulated shrubs with different spatial configurations and row spaces under 8 m/s was between 3.19 and 28.04 g, while the variation range of sand deposition under 12 and 16 m/s was 7.27–48.46 g and 6.98–51.33 g, respectively. Moreover, the sand deposition of simulated shrubs with different spatial configurations presented first increasing and then decreasing with the improvement of sand collector heights. The sand deposition within 2–4 cm of broom-shaped simulated shrubs in 17.5 × 17.5 cm reached a maximum compared with other simulated shrubs. At the same time, the sand deposition of simulated shrubs with the different spatial configurations above 10 cm increased obviously.

Variation of sand deposition among simulated shrubs of different spatial configurations (hemisphere-shaped, spindle-shaped, and broom-shaped), row spaces (17.5 × 17.5 cm, 17.5 × 26.25 cm, and 17.5 × 35 cm), and net wind speeds (8, 12, and 16 m/s) (Layer number of the sand collector (1–15) represents the height of sand collector with 2, 4, 6, 8, 10, 12, 14, 16, 18, 20, 22, 24, 26, 28, and 30 cm, respectively).
To find out the sand-fixation effect of simulated shrubs with different spatial configurations, the average sand deposition in different sand collector height was calculated (Figure 5). The average sand deposition of spindle-shaped simulated shrubs in 17.5 × 17.5 cm under different net wind speeds was the least, while the average sand depositions of broom-shaped and hemisphere- shaped simulated shrubs were less different. Moreover, the average sand deposition of broom-shaped simulated shrubs reached the lowest value in 17.5 × 26.25 cm, followed by spindle-shaped and hemisphere-shaped shrubs. There was less variation for simulated shrubs with different spatial configurations in 17.5 × 35 cm under 12 and 16 m/s. However, the sand deposition of broom-shaped simulated shrubs under 8 m/s had the minimum, followed by spindle-shaped and hemisphere-shaped shrubs.

Variation of average sand deposition of simulated shrubs with different spatial configurations (hemisphere-shaped, spindle-shaped, and broom-shaped), row spaces (17.5 × 17.5 cm, 17.5 × 26.25 cm, and 17.5 × 35 cm), and net wind speeds (8, 12, and 16 m/s).
Distribution of grain-size parameters
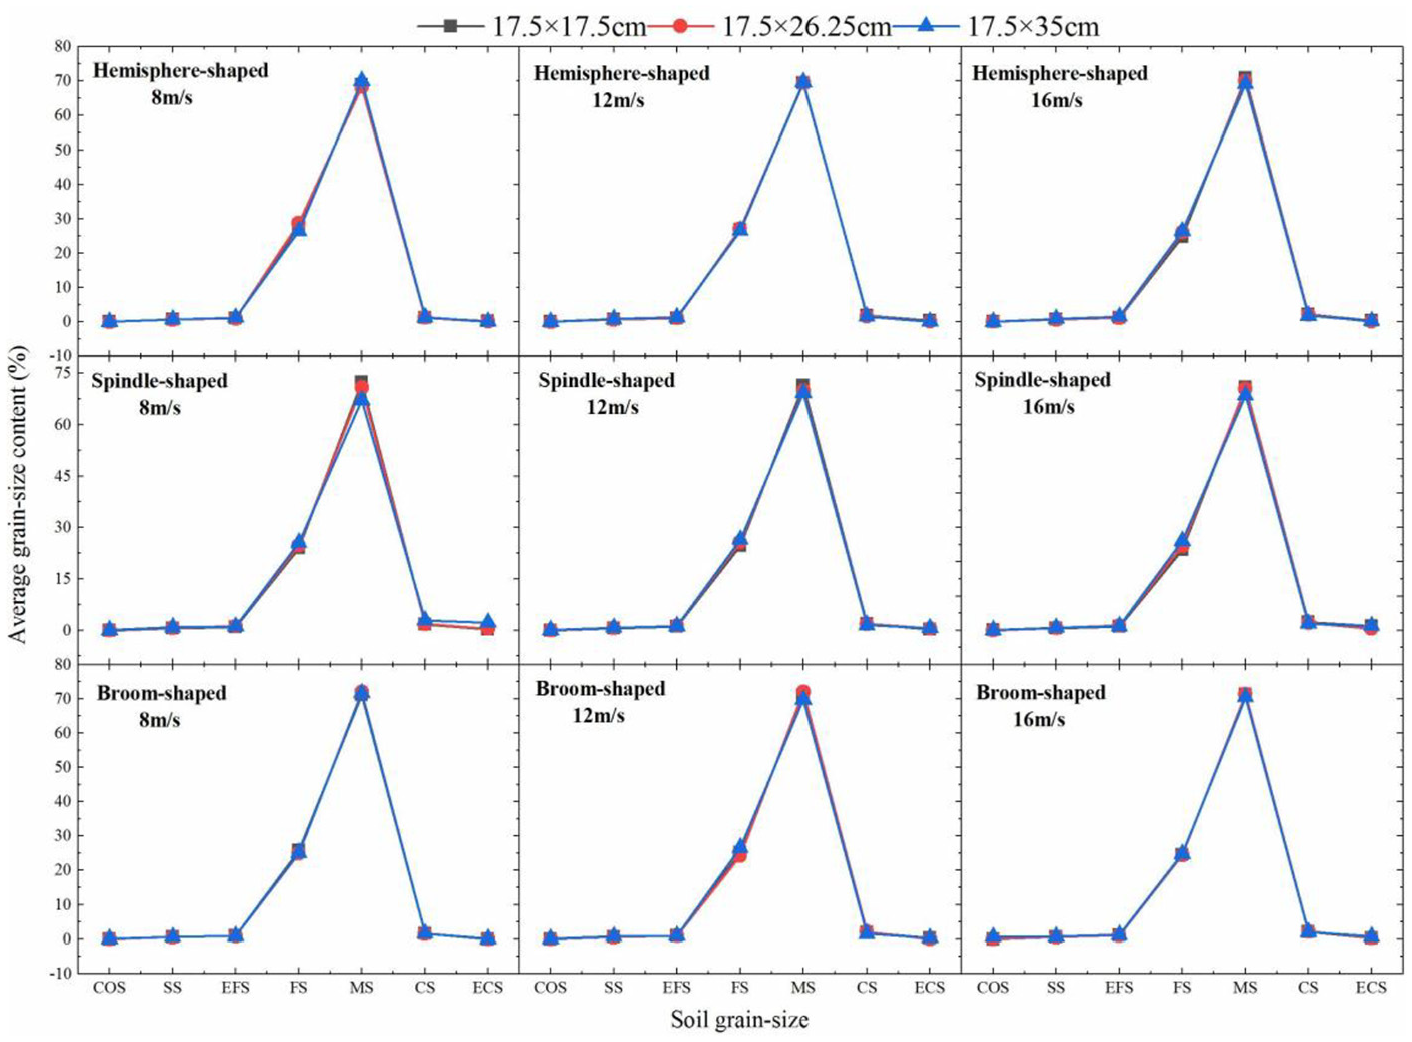
Figure 6 presents the characteristics of four grain-size parameters among the simulated shrubs with different spatial configurations (hemisphere-shaped, spindle-shaped, and broom-shaped), row spaces (17.5 × 17.5 cm, 17.5 × 26.25 cm, and 17.5 × 35 cm), and net wind speeds (8, 12, and 16 m/s). The mean grain-size ranging from 0.6Φ to 2.1Φ, dominated by fine sand and medium sand. And the change tendency was significantly obvious in 17.5 × 17.5 cm under 16 m/s and in 17.5 × 35 cm under 8 m/s for the spindle-shaped simulated shrubs, and in 17.5 × 17.5 cm under 16 m/s for the broom-shaped simulated shrubs. There was less variation of mean grain-size among the simulated shrubs with different spatial configurations, row spaces, and net wind speeds.
Variation of the grain-size parameters among the simulated shrubs of different spatial configurations (hemisphere-shaped, spindle-shaped, and broom-shaped), row spaces (17.5 × 17.5 cm, 17.5 × 26.25 cm, and 17.5 × 35 cm), and net wind speeds (8, 12, and 16 m/s) (Layer number of the sand collector (1–15) represents of the height of sand collector with 2, 4, 6, 8, 10, 12, 14, 16, 18, 20, 22, 24, 26, 28, and 30 cm, respectively).
The sorting coefficient showed a change from well-sorted to be moderate ranged from 0.4Φ to 1.1Φ. The sorting coefficient showed from well-sorted to be moderate ranged from 0.4Φ to 1.1Φ. The sorting coefficients of the spindle-shaped simulated shrubs in 17.5 × 35 cm below 8 cm and 17.5 × 17.5 cm under 16 m/s below 4 cm were different from other simulated shrubs. Besides, there was little difference among the simulated shrubs with different spatial configurations, row spaces, and net wind speeds.
The skewness values ranging from 0.08 to 0.43, representing a skew trend ranged from symmetrical to extremely positive. Further, the skewness values above 4 cm in 17.5 × 17.5 cm under 16 m/s of the spindle-shaped simulated shrub were the highest and the grain-size distribution was positive. And there was an obvious change for the spindle-shaped simulated shrubs in 17.5 × 35 cm below 8 cm. Furthermore, the skewness values for other simulated shrubs were almost the same and maintained a straight line.
The kurtosis coefficient ranged from 0.9 to 1.7 represented medium to very narrow to sharp distribution. The kurtosis coefficients for the spindle-shaped simulated shrubs in 17.5 × 35 cm below 8 cm and 17.5 × 17.5 cm under 16 m/s below 4 cm were different from other simulated shrubs. Also, there was little difference among the simulated shrubs of different spatial configurations, row spaces, and net wind speeds.
Variation of average grain-size parameters
Figure 7 shows the variation of the average grain-size parameters among the simulated shrubs of different spatial configurations (hemisphere-shaped, spindle-shaped, and broom-shaped), row spaces (17.5 × 17.5 cm, 17.5 × 26.25 cm, and 17.5 × 35 cm), and net wind speeds (8, 12, and 16 m/s). The mean grain-size of hemisphere-shaped simulated shrubs under 8 m/s in different row spaces was the highest, followed by the broom-shaped and spindle-shaped shrubs, which became coarser first and then finer. The mean grain-sizes of hemisphere-shaped and spindle-shaped simulated shrubs were higher than broom-shaped shrubs under 16 m/s besides 17.5 × 17.5 cm. Moreover, the mean grain-size of broom-shaped simulated shrubs under 12 m/s was the lowest. The effect of row spaces on mean grain-size increased with the improvement of wind speeds.

Variation of the average grain-size parameters among the simulated shrubs of different spatial configurations (hemisphere-shaped, spindle-shaped, and broom-shaped), row spaces (17.5 × 17.5 cm, 17.5 × 26.25 cm, and 17.5 × 35 cm), and net wind speeds (8, 12, and 16 m/s) (HS, BS, and SS presents hemisphere-shaped, broom-shaped, and spindle-shaped, respectively).
Sorting coefficients of broom-shaped simulated shrubs in 17.5 × 26.25 cm and 17.5 × 35 cm under 8 and 12 m/s were the lowest, followed by hemisphere-shaped and spindle-shaped shrubs, which was well-sorted first and then poorly sorted. And the changing trend in 17.5 × 17.5 cm under 16 m/s was the same as the above. However, the sorting coefficients of spindle-shaped simulated shrubs in 17.5 × 17.5 cm under 8 and 12 m/s were lower than other simulated shrubs. The sorting would be affected by strong wind speeds.
The skewness value of broom-shaped simulated shrubs in 17.5 × 26.25 cm was the lowest, followed by hemisphere-shaped and spindle-shaped shrubs. There was a decreasing tendency for simulated shrubs with different spatial configurations in 17.5 × 35 cm under 12 and 16 m/s. And the skewness value of hemisphere-shaped simulated shrubs in 17.5 × 17.5 cm was the highest. In summary, the skewness value of the hemisphere-shaped simulated shrubs was greater than other shrubs. The wind speed had an obvious effect on skewness.
Kurtosis values under 8 m/s were different from 12 to 16 m/s. Under 8 m/s, the broom-shaped simulated shrubs showed the lowest value in 17.5 × 17.5 cm and 17.5 × 26.25 cm. And it presented a decreasing tendency from hemisphere-shaped to broom-shaped and spindle-shaped simulated shrubs in 17.5 × 35 cm under 8 m/s. In terms of 12 m/s, the kurtosis of spindle-shaped simulated shrubs in 17.5 × 26.25 cm and 17.5 × 35 cm reached the highest value, however hemisphere-shaped had the lowest value in the same condition. In addition, the broom-shaped in 17.5 × 17.5 cm reached the lowest value. And there was less variation under 16 m/s compared with 12 m/s.
Discussion
Compared with widely used straw-checkerboard sand-barriers
Vegetation restoration is one of the important sand-control approaches which has been proved to be greatly effective in the long-term applied.38,39 However, 40 it is almost not feasible for accomplishing vegetation restoration to control sand in arid and semiarid regions because of the extremely limited water. Based on this, the results showed that simulated shrubs proposed in this study had obvious sand-fixation effects without any water, which can solve the above difficulties. And to optimize the parameters associated with the sand-barrier characteristics for aeolian soil stabilization that yield the most effective protection, the variations of soil grain-size of simulated shrubs with different spatial configurations, row spaces, and net wind speeds were studied in detail. Our results show that the average grain-size content was dominated by medium sand and fine sand, and the total percentage was more than 90% (Figure 3). The average grain-size content for other soil grain-sizes was almost the same and the proportion was less than 10% (Figure 3). Moreover, the sand deposition of simulated shrubs with different spatial configurations increased with the improvement of wind speeds (Figure 4).
The straw-checkerboard sand-barrier has been widely used on railway and post-mining landscapes protection in arid and semiarid regions in China since the 1950s. Meanwhile, the protective efficiency and soil grain-size of straw-checkerboard sand-barrier have been studied. The results presented by Guo et al. 41 reveal that the fine soil particles increased greatly in the straw-checkerboard area. Similarly, Li et al. 34 present that after sand stabilization by straw-checkerboards and revegetation, the proportions of clay and silt changed remarkably over time. And the silt and clay content increased from 1.00% ± 0.07% and 0.88% ± 0.44% in the beginning to 24.60% ± 1.57% and 11.00% ± 1.11% in the end stage, respectively. These results are consistent with our study that the simulated shrubs with the same geometric configuration as field plants as a novel sand-barrier also made an important contribution to the accumulation of fine-grained materials. Most importantly,34 soil crusts can form on the soil surface as a result of the continuous deposition of fine particles. Thick soil crusts can increase significantly the surface stability. However,2 in terms of installation labor and materials consumption, the straw-checkerboard sand-barriers are proved to be expensive, and it provided poor effect because of rapidly buried by sand. In contrast, the simulated shrubs can be an important part of further extend ecological engineering projects in arid and semiarid regions, and the contribution of simulated shrubs is worthy of gaining increasing attention.
Sediment grain-size parameters
Sand particles are transported by the wind and directly determined by the grain-size and wind intensity. 42 The grain-size parameters showed in Figure 7 that there were obvious differences in mean grain-size, sorting, skewness, and kurtosis at different heights of sand deposition. The sorting values decreased with the improvement of heights but the vertical variation of skewness with symmetrically distributed sands was very slight in Williams’s 43 studies. However, Li et al. 44 found that sorting values increased with the improvement of heights. Van 45 presents that there was no obvious vertical variation in the standard deviation, skewness, or kurtosis of collected sands. It is consistent with our finding that the skewness, kurtosis, mean grain-size, and sorting values of simulated shrubs were almost the same and maintained a straight line. And there was less variation of mean grain-size among the simulated shrubs with different spatial configurations, row spaces, and net wind speeds. More specificity,46,47 the elasticity of surface properties affects particles’ rebound after striking the bed. In this study, the branches of simulated shrubs are made of iron wires wrapped in plastic, and this is probably one of the reasons why the soil grain-size distribution of the simulated shrubs differed from that of the previously studied. And field measurements of simulated shrubs need to be a further study in future works, while this study is based on a wind tunnel experiment.
Sand deposition resulted from airflow field variation
Ma et al. 27 showed that the blocking effect by the canopy of the windbreaks resulted in that part of the flow was deflected upward and passed over the windbreaks when the airflow approached the windbreaks. The other airflow was forced to enter the windbreaks, which could be distinguished into “bleeding-flow” at the canopy height, and “through-flow” under the canopy. This above conclusion further resulted in our result as shown in Figure 4, in which the sand deposition of different spatial configurations with simulated shrubs presented first increasing and then decreasing with the improvement of sand collector heights. Moreover, the sand deposition of simulated shrubs with the different spatial configurations above 10 cm increased obviously. Further, Ma et al. 27 presented that the speed of the bleeding-flow decreases markedly on the near windward side. Due to the discontinuous blocking of plant rows, the speed of bleeding-flow decreases in a fluctuating way within the canopy and reached the minimum on the leeward side. Moreover, 7 incoming velocity and turbulence intensity can influence the shelter effect and/or trapping effect of the fence, but that influence is generally secondary to that of fence geometry. Based on the features of branches and leaves of Nitraria tangutorum in the fields, three spatial configurations of spindle-shaped, broom-shaped, and hemisphere-shaped shrubs were made and used in this study. Therefore, these three spatial configurations were extremely helpful to trap the sand compared with the sand-barriers with single spatial configuration. Therefore, there was little possibility for simulated shrubs where deposition did not occur at all.
Factors affecting sand-retaining and protective efficiency of sand-barriers
Dong et al. 48 described the evolution patterns of the vortex zone of a vertically-holed sand fence and presented that fence porosity is the most important affecting factor. They showed that, with all else being equal, there was a fence porosity that provided an optimal sheltering effect with the effects on shelter distance. The optimal porosity proposed by Dong et al. 48 is around 0.2 or 0.3, which corresponds to a critical porosity above which bleed flow dominates and below which reversed flow becomes significant. Qu et al. 2 presented that the key to protecting sand using checkerboard sand-barriers depended on the development of a stable concave surface within the cells of the grid. And they pointed out, the ratio of the length of its sides to the depth of wind erosion in 1.0 × 1.0 m sand-barriers was about 1:7, while this ratio was about 1:9 in 1.5 × 1.5 m and 2.0 × 2.0 m. Also, the protective effects of similar sizes of checkerboard sand-barrier are different if topography conditions are not the same. Therefore, there are different factors for different kinds of sand-barriers.
As a novel sand-barriers, there is a lack of systematic studies in more detail on factors affecting sand-retaining and protective efficiency. Our findings showed that spatial configuration and row space were important factors affecting the sand-retaining efficiency of simulated shrubs. With researches on protection efficiency being constantly deepened, exploring the optimal characteristics of sand-barriers has become a direction for our current and future work. Further studies will reveal in-depth the effects of simulated shrubs with different spatial configurations on wind-sand flow fields to further optimize the spatial configuration of simulated shrubs and improve the sand-retaining effects.
Conclusions
Based on the wind tunnel experiment, we analyzed the variations of soil grain-size of simulated shrubs with different spatial configurations, row spaces, and net wind speeds. Our analysis revealed that the average grain-size content was dominated by medium sand ranging from 250 to 500 μm, followed by fine sand ranging from 100 to 250 μm. The percentage of the medium sand and fine sand was more than 90%. The average grain-size content for others was almost the same and the proportion was less than 10%. Moreover, we found that the sand deposition of simulated shrubs with different spatial configurations increased with the improvement of wind speeds, but there was no obvious difference in a sand deposition under different row spaces. And the average sand deposition of spindle-shaped simulated shrubs in 17.5 × 17.5 cm and broom-shaped simulated shrubs in 17.5 × 26.25 cm under different net wind speeds was the least. However, there was less variation for simulated shrubs with different spatial configurations in 17.5 × 35 cm under 12 and 16 m/s.
Furthermore, the soil grain-size parameters presented that the mean grain-size ranging from 0.6Φ to 2.1Φ (220–460 μm), dominated by fine sand and medium sand. The sorting coefficient changed from well-sorted to be moderate ranging from 0.4Φ to 1.1Φ. Skewness values ranging from 0.08 to 0.43, represented a skew trend ranging from symmetrical to extremely positive. And kurtosis coefficient presented from medium to very narrow and sharp distribution ranging from 0.9 to 1.7. In summary, there were fewer changes of four soil grain-size parameters among the simulated shrubs with different spatial configurations, row spaces, and net wind speeds. The effect of row spaces on average grain-size parameters increased with the improvement of wind speeds.
As one of the key measures for control desertification in arid and semiarid regions, all of these quantitative findings suggest that the application of the simulated shrubs will be an important component of efforts to further extend ecological engineering projects in arid and semiarid desert regions.49–51 It would be interesting to incorporate the shelter device proposed in the present work into landscape models for aeolian soil transport and dune migration, with the aim of optimizing the parameters associated with the windbreak characteristics for aeolian soil stabilization at the field scale.
Footnotes
Declaration of conflicting interests
The author(s) declared no potential conflicts of interest with respect to the research, authorship, and/or publication of this article.
Funding
The author(s) disclosed receipt of the following financial support for the research, authorship, and/or publication of this article: This research was financially supported by the National Key Research and Development Programme of China (Grant No. 2018YFC0507101).