
Abstract
In recent years, the rapid advancement of materials science has underscored the significance and complexity of understanding and optimizing the properties of piezoelectric materials. Traditional analytical methods have encountered difficulties in addressing the challenges posed by variable material compositions and intricate processing conditions. However, deep neural networks (DNNs) present new opportunities in this field due to their robust capabilities in nonlinear data processing and pattern recognition. This study employs DNN to model the relationship between the composition and processing conditions of piezoelectric materials and their electrical properties. Through quenching experiments, it was observed that the electrical properties of Na0.5Bi0.5TiO3-based ceramics are positively correlated with local polar heterogeneity. This phenomenon was further validated by manipulating the local polar heterogeneity through Bi or Sr nonstoichiometric modifications. Subsequently, a DNN model characterized by local polarity heterogeneity was developed. After training on extensive high-quality experimental data, the DNN model demonstrated exceptional prediction accuracy and effectively elucidated the underlying complex mechanisms governing material properties. The findings indicate that DNN can accelerate the development and optimization of new piezoelectric materials, provide guidance for experimental design, and significantly enhance research and development efficiency. The successful application of this research strongly supports the expansion of deep learning technology in materials science.
Keywords
Introduction
Piezoelectric materials have attracted significant attention due to their exceptional electromechanical coupling properties, which are essential for applications such as sensors, actuators, and energy harvesters.1,2 Currently, the predominant piezoelectric materials on the market are lead-based, particularly lead zirconate titanate (PZT). 3 However, concerns regarding the detrimental effects of lead on human health and environmental pollution have prompted researchers to investigate lead-free material systems.3–5 Existing lead-free piezoelectric materials include the BaTiO3 (BT) based, K0.5Na0.5NbO3 (KNN) based, Na0.5Bi0.5TiO3 (NBT) based, and BiFeO3 (BFO) based. Despite these advancements, the development of piezoelectric ceramics with superior performance remains a complex and time-consuming endeavor, often requiring the optimization of material composition and microstructure through iterative trials and designs. This traditional approach not only lacks efficiency but also presents challenges in fully elucidating the underlying mechanisms that govern the intricate piezoelectric properties.
In recent years, the rapid development of artificial intelligence and big data technologies has led to the increasing prominence of machine learning (ML) as a vital tool in the field of materials science.6–9 Machine learning exhibits robust data processing and pattern recognition capabilities, facilitating the swift construction of complex mapping relationships among material composition, microstructure, and physical properties, by utilizing existing experimental or computational data.10–13 In the study of piezoelectric materials, the integration of ML provides a novel perspective for accelerating the prediction and optimization of material properties. Compared to traditional methods, ML-based models can efficiently forecast the electrical properties of materials by analyzing large-scale data sets, while also uncovering potential design rules and mechanisms that are often difficult to identify through conventional experimental approaches.14–18
Currently, several studies have sought to apply ML techniques to predict the performance of piezoelectric materials. For instance, Shadman Roodposhti et al. 19 compared deep neural network (DNN) and Random Forest models, revealing that the DNN achieved significantly better predictive accuracy. Sriboriboon et al. 20 effectively utilized DNNs to investigate ultrathin ferroelectric materials, leading to a significant enhancement in the sensitivity of piezoelectric response force microscopy (PFM). This advancement enables PFM to detect the weak piezoelectric response of a 10-nanometer-thick Hf0.5Zr0.5O2 film under low excitation voltage, achieving a sensitivity of 0.3 pm. Chen et al. 21 conducted a study utilizing a database comprising 1210 experimental measurement data points, in conjunction with an advanced polymer fingerprinting scheme and a Gaussian process regression algorithm for model training. The model successfully predicted the frequency-dependent dielectric constants of 11,000 synthetic polymers across the frequency range of 60 to 1015 Hz, accurately reproducing the trend of dielectric constants as a function of frequency. Qin et al. 22 utilized a database of 254 single-phase microwave dielectric ceramics to model the dielectric constants using five commonly employed algorithms and 32 intrinsic chemical, structural, and thermodynamic characteristics. The results indicate that polarizability, average bond length, and average unit cell volume per atom are critical factors influencing the dielectric constant. Based on the data of published literature, Ma et al. 23 demonstrated an interpretable ML framework for rapid evaluation of KNN-based ceramics with high d33. Specifically, a thorough feature construction was carried out from the global and local dimensions to establish tree regression models with d33 as the target property. A new method for predicting the electrical properties of ferroelectric materials by using DNN was proposed by Wang et al. 24 The DNN is trained using experimental data and used as a surrogate model to predict key electrical characteristics. Gupta et al. 25 used the task framework of material performance prediction based on structural information, which uses graph-based neural network architecture and deep transfer learning technology to significantly improve the prediction ability of the model for different materials (3D / 2D, inorganic / organic, computational / experimental) data. By employing the support vector regression model, this study effectively identified materials with low dielectric constants and validated the reliability of the predictive model through experimental confirmation. Morita et al. 26 integrate ML, density functional theory, and game theory analysis to predict and elucidate physical trends in crystal optical permittivity. In their study, two ML models were employed to train on a dataset comprising 1364 dielectric constant values. Shapley additive interpretation analysis demonstrates that the ML models can accurately reflect the correlations identified by traditional Clausius-Mossotti and Penn models, thereby enhancing predictive capability and the reliability of explanations regarding physical behavior.
The aforementioned research demonstrates the effectiveness of employing algorithms to develop composition-performance models, optimize material combinations, and predict key parameters such as piezoelectric constants and Curie temperatures by incorporating specific microstructural features. To enhance the accuracy and reliability of these predictions, it is essential to optimize both the quality and quantity of data sets while integrating physically oriented feature engineering to improve the model's physical explanatory power. This study proposes a method for predicting the properties of piezoelectric materials using DNNs.
The research revealed that, in components other than those near the morphotropic phase boundary (MPB), quenching results in an increase in domain size, while the change in phase fraction can be considered negligible. 27 However, for the NBT-BT phase within the MPB region, quenching induces a significant increase in the volume fraction of polar nanoregions and facilitates the formation of long-range orders, such as layered structures. 27 In summary, both quenching and chemical modification lead to alterations in the local polar structure. Nevertheless, there is relatively limited literature exploring the correlation between piezoelectric performance and the local polarity heterogeneity in the NBT-BT system. Therefore, in this study, ceramics of the solid-phase reaction synthesis formula (1-x) Na0.5Bi0.5TiO3-xBaTiO3 (where x = 0.02, 0.06, 0.10, 0.15, 0.20, 0.25, collectively referred to as NBBT100x) were prepared, and their phase structures and properties were systematically evaluated. 28 A quenching experiment was conducted to compare the structural and performance differences between samples normally cooled and those were quenched. The experimental data set was utilized to train the DNN model, establishing the key physical structure of piezoelectric materials. Additionally, it has been reported, nonstoichiometric,29,30 chemical modification, or substitution31–33 can break the long-range ferroelectric order and form nanometer polar regions or nanodomains, leading to higher dielectric constant (ɛr) and d33. Consequently, we investigate the relationship between structure and performance by introducing Sr or Bi for nonstoichiometric modification. The data obtained from the experiment were utilized to validate the predictive capability of the DNN model. A comparison of the prediction results with the experimental data confirms the effectiveness and accuracy of the proposed method. In the concluding section of the revised introduction, we emphasize that the core objective of this study is to develop a novel DNN-based framework for high-accuracy prediction of piezoelectric properties. Beyond achieving precise predictions, we further validate the experimental results by constructing a comprehensive comparative study using Sr/Bi-doped experimental data. This approach provides robust support for a holistic understanding and precise control of piezoelectric material performance.
The remainder of this article is organized as follows: “Methods” section outlines the preparation and quenching processes of ceramics. “Experimental results and discussion” section examines the effects of alterations in the local polarity structure of ceramics on their electrical properties. Chapter 3 systematically explores the cross-process transferability of the model and its association with the local polarity heterogeneity of materials by verifying the predictive capability of the DNN model trained on NS samples for QS samples. “Model architecture and prediction process” section provides a detailed description of the overall architecture design and performance prediction process of DNN. “Data processing” section outlines the preprocessing of experimental data, proposes a data augmentation method based on Gaussian noise injection, and employs the Kolmogorov–Smirnov test to verify the data distribution characteristics, ensuring that the expanded dataset meets the modeling requirements. “Tuning of model hyperparameters” section focuses on the criteria for selecting model hyperparameters. “Model evaluation” section constructs a multidimensional model evaluation system. In addition to the conventional R² and Mean Absolute Error (MAE) indicators, cross-validation and error distribution histogram analysis are innovatively introduced to quantitatively assess the model's generalization ability and stability. “Experimental data processing comparison” section confirms the validity of the model through a comparison between experimental and predicted data, thereby establishing a closed-loop research chain of “model construction–data processing–parameter optimization–performance evaluation–experimental verification.” Finally, “Conclusion” section summarizes the experimental results presented in this paper.
Experimental process
Methods
(1-x)Na0.5Bi0.5TiO3-xBaTiO3 (x = 0.02, 0.06, 0.10, 0.15, 0.2, 0.25, abbreviated as NBBT100x) ceramics, (Na0.5Bi0.5 + x )0.94Ba0.06TiO3 + 1.41x (x = 0.01, 0.02, 0.03, 0.04, abbreviated as NBBT6 + Bi100x) ceramics, (Na0.5Bi0.5)0.94Sr x Ba0.06TiO3 + x (x = 0.005,0.01,0.02, 0.03, 0.04, abbreviated as NBBT6 + Sr100x) ceramics were prepared via conventional solid state reaction route. All raw materials, Na2CO3 (99.9%), BaCO3 (99.9%), Bi2O3 (99.9%), TiO2 (98%), and SrCO3 (99.0%) (all from Sinopharm Chemical Reagent Co., Ltd, Shanghai, China), were added to ethanol by ball milling for 12 h, and then calcined at 850°C for 2 h. After granulation, the powder is pressed into a billet with a diameter of 0.5 inches. Finally, the billet was calcined at 800°C for 2 h to eliminate the binder (PVA), and NBBT100x green bodies were sintered at 1140°C–1180°C for 2 h. Before quenching, the as-sintered ceramic disks were polished. Then the polished ceramic disks were heated to 1100°C for 1 h and then removed directly from the furnace to air for rapid cooling. For electrical measurements, silver electrodes were prepared on both surfaces of the disks. The quenched ceramics are labeled as QS, while the ceramics normally cooled in a furnace are labeled as NS.
X-ray diffraction (XRD) (Rigaku Smartlab diffractometer, Rigaku, Tokyo, Japan) was used to characterize the structure. The temperature dependence of dielectric properties was measured using a precision impedance analyzer (4294A, Agilent, Santa Clara, CA) equipped with a programmable furnace, and the heating/cooling rate is 2°C/min. Before characterizing the piezoelectric properties, all ceramic samples were poled under an electrical field of 4–7 MV/m for 5 min for ceramic samples with different compositions at approximately room temperature. The piezoelectric response was measured at approximately room temperature using a quasi-static d33 meter (ZJ-6AN, Institute of Acoustics, Chinese Academy of Sciences, Beijing, China).
Experimental results and discussion
Studies have shown that in relaxed ferroelectrics, the difference in dielectric constant (Δɛr) observed between lower and higher frequencies (both below 1 MHz) serves as an indicator of the degree of dielectric dispersion or characteristics of local polar heterogeneity. By analyzing the frequency-dependent variation of the dielectric constant, one can effectively elucidate the local polar heterogeneity present in relaxor ferroelectrics. As illustrated in Figure 1(a), the frequency dependence analysis of the dielectric constant (ɛr) of NBBT100x ceramic at approximately 25°C (1 kHz to 1 MHz) was conducted. The results indicate that the relationship between ɛr and ln(f) can be represented by a linear fit, with the slope of the fitted line serving as a measure of the degree of the local polar inhomogeneity or dielectric dispersion in the relaxor ferroelectric.34–36 Figure 1(b) demonstrates that the slope of the linear relationship between ɛr and ln(f) initially increases and subsequently decreases with increasing BT content, reaching its maximum value at the NBBT6 component. Furthermore, Figure 1(c) and (d) reveals that the dielectric and piezoelectric responses of the ceramic exhibit trends similar to those of the slope of the fitted line. The enhanced electrical properties may be attributed to the dynamic fluctuations associated with greater local polar heterogeneity, as systems characterized by higher local polar heterogeneity tend to exhibit flatter free energy-polarization curves. 37

Electrical properties of NS NBBT100 x (x = 0.02, 0.06, 0.10, 0.15, 0.2, 0.25) ceramics. 22 (a) Frequency dependence of ɛr at room temperature. (b) Slope of the fitted line of ɛr ∼ ln(f) (shown in (a)). (c) Dielectric constant (ɛr) at 1 kHz at approximately 25°C. (d) Piezoelectric response (d33).
Figure 2(a) presents the dielectric constant (ɛr) values of the QS sample at room temperature across various frequencies. The slope of the fitted ɛr ∼ ln(f) line is illustrated in Figure 2(b). In comparison to the slope of the fitted line for the NS sample (Figure 1(b)), all NBBT100x ceramics exhibit a decrease in slope following quenching, indicating a reduction in local polar heterogeneity attributed to the quenching process. Similarly, the electrical property responses (ɛr and d33) also show a decrease after quenching (Figure 2(c) and (d)). Notably, the highest electrical performance response occurs at x = 0.06 prior to quenching (Figure 1), while the peak performance response shifts to x = 0.10 after quenching (Figure 2). Regardless of whether before or after quenching, the trend in ceramic electrical property response with varying BT content aligns consistently with the trend in local polar heterogeneity, as shown in Figure 1(b) to (d) and Figure 2(b) to (d).

Electric properties of QS NBBT100x (x = 0.02, 0.06, 0.10, 0.15, 0.2, 0.25) ceramics. 22 (a) Frequency dependence of ɛr at approximately 25°C. (b) Slope of the fitted line ɛr ∼ ln(f) (shown in (a)). (b) Dielectric constant (ɛr) at 1 kHz at approximately 25°C. (c) Piezoelectric response (d33).
It is evident from the preceding discussion that for NBT-BT ceramics, the increase in local polar heterogeneity signifies a rise in the proportion of polar regions within the ceramic matrix. This enhances the polarization response under an electric field, consequently leading to improved piezoelectric performance. Research has indicated that chemical modification can disrupt local atomic order and facilitate the emergence of short-range ordered regions within materials.31–33 These findings imply that the local polar heterogeneity of relaxor ferroelectric ceramics can be adjusted through chemical modification. Consequently, we conducted experiments with nonstoichiometric variations (using Sr or Bi). The nonstoichiometrically modified ceramics are designated as Sr and Bi modified NBBT6.
Given that the piezoelectric performance of ceramics is maximized at x = 0.06 (as shown in Figure 1(b) to (d)), nonstoichiometric doping was performed on the NBBT6 component to further examine the relationship between the slope and the piezoelectric performance. As illustrated in Figure 3(a), when the Sr content (x) is less than or equal to 0.03, the tetragonal crystal symmetry of the ceramic increases with rising Sr levels, as evidenced by the heightened splitting of the diffraction peak at 46.5°. However, beyond this point, as Sr content continues to increase, the tetragonal symmetry of the ceramic diminishes. The slope of the fitted line ɛr ∼ ln(f) is depicted in Figure 3(b). It is observed that this slope initially increases and then decreases with increasing Sr content, indicating a change in local polar heterogeneity. Figure 3(c) demonstrates that the trend in piezoelectric response mirrors that of Sr content, with the maximum piezoelectric response (201 pC/N) occurring at x = 0.03. As illustrated in Figure 3(d), an increase in Bi content leads to a reduction in the symmetry of the tetragonal crystal system, evidenced by the diminishing splitting of the diffraction peak at 46.5°. Notably, when x = 0.04, the splitting of the diffraction peak nearly vanishes. The slope of the fitted line ɛr ∼ ln(f) is presented in Figure 3(e). It is observed that as Bi content increases, the slope initially rises and then declines, indicating a transition in local polar heterogeneity. The piezoelectric response exhibits a similar trend to that of local polar heterogeneity (Figure. 3(f)). The maximum piezoelectric response, recorded at 207 pC/N, occurs at x = 0.02. The results depicted in Figure 3 reveal that, despite the opposing trends in crystal symmetry changes for Sr-modified and Bi-modified NBBT ceramics, both modifications demonstrate that the piezoelectric response is lower in regions with greater local polarity heterogeneity.
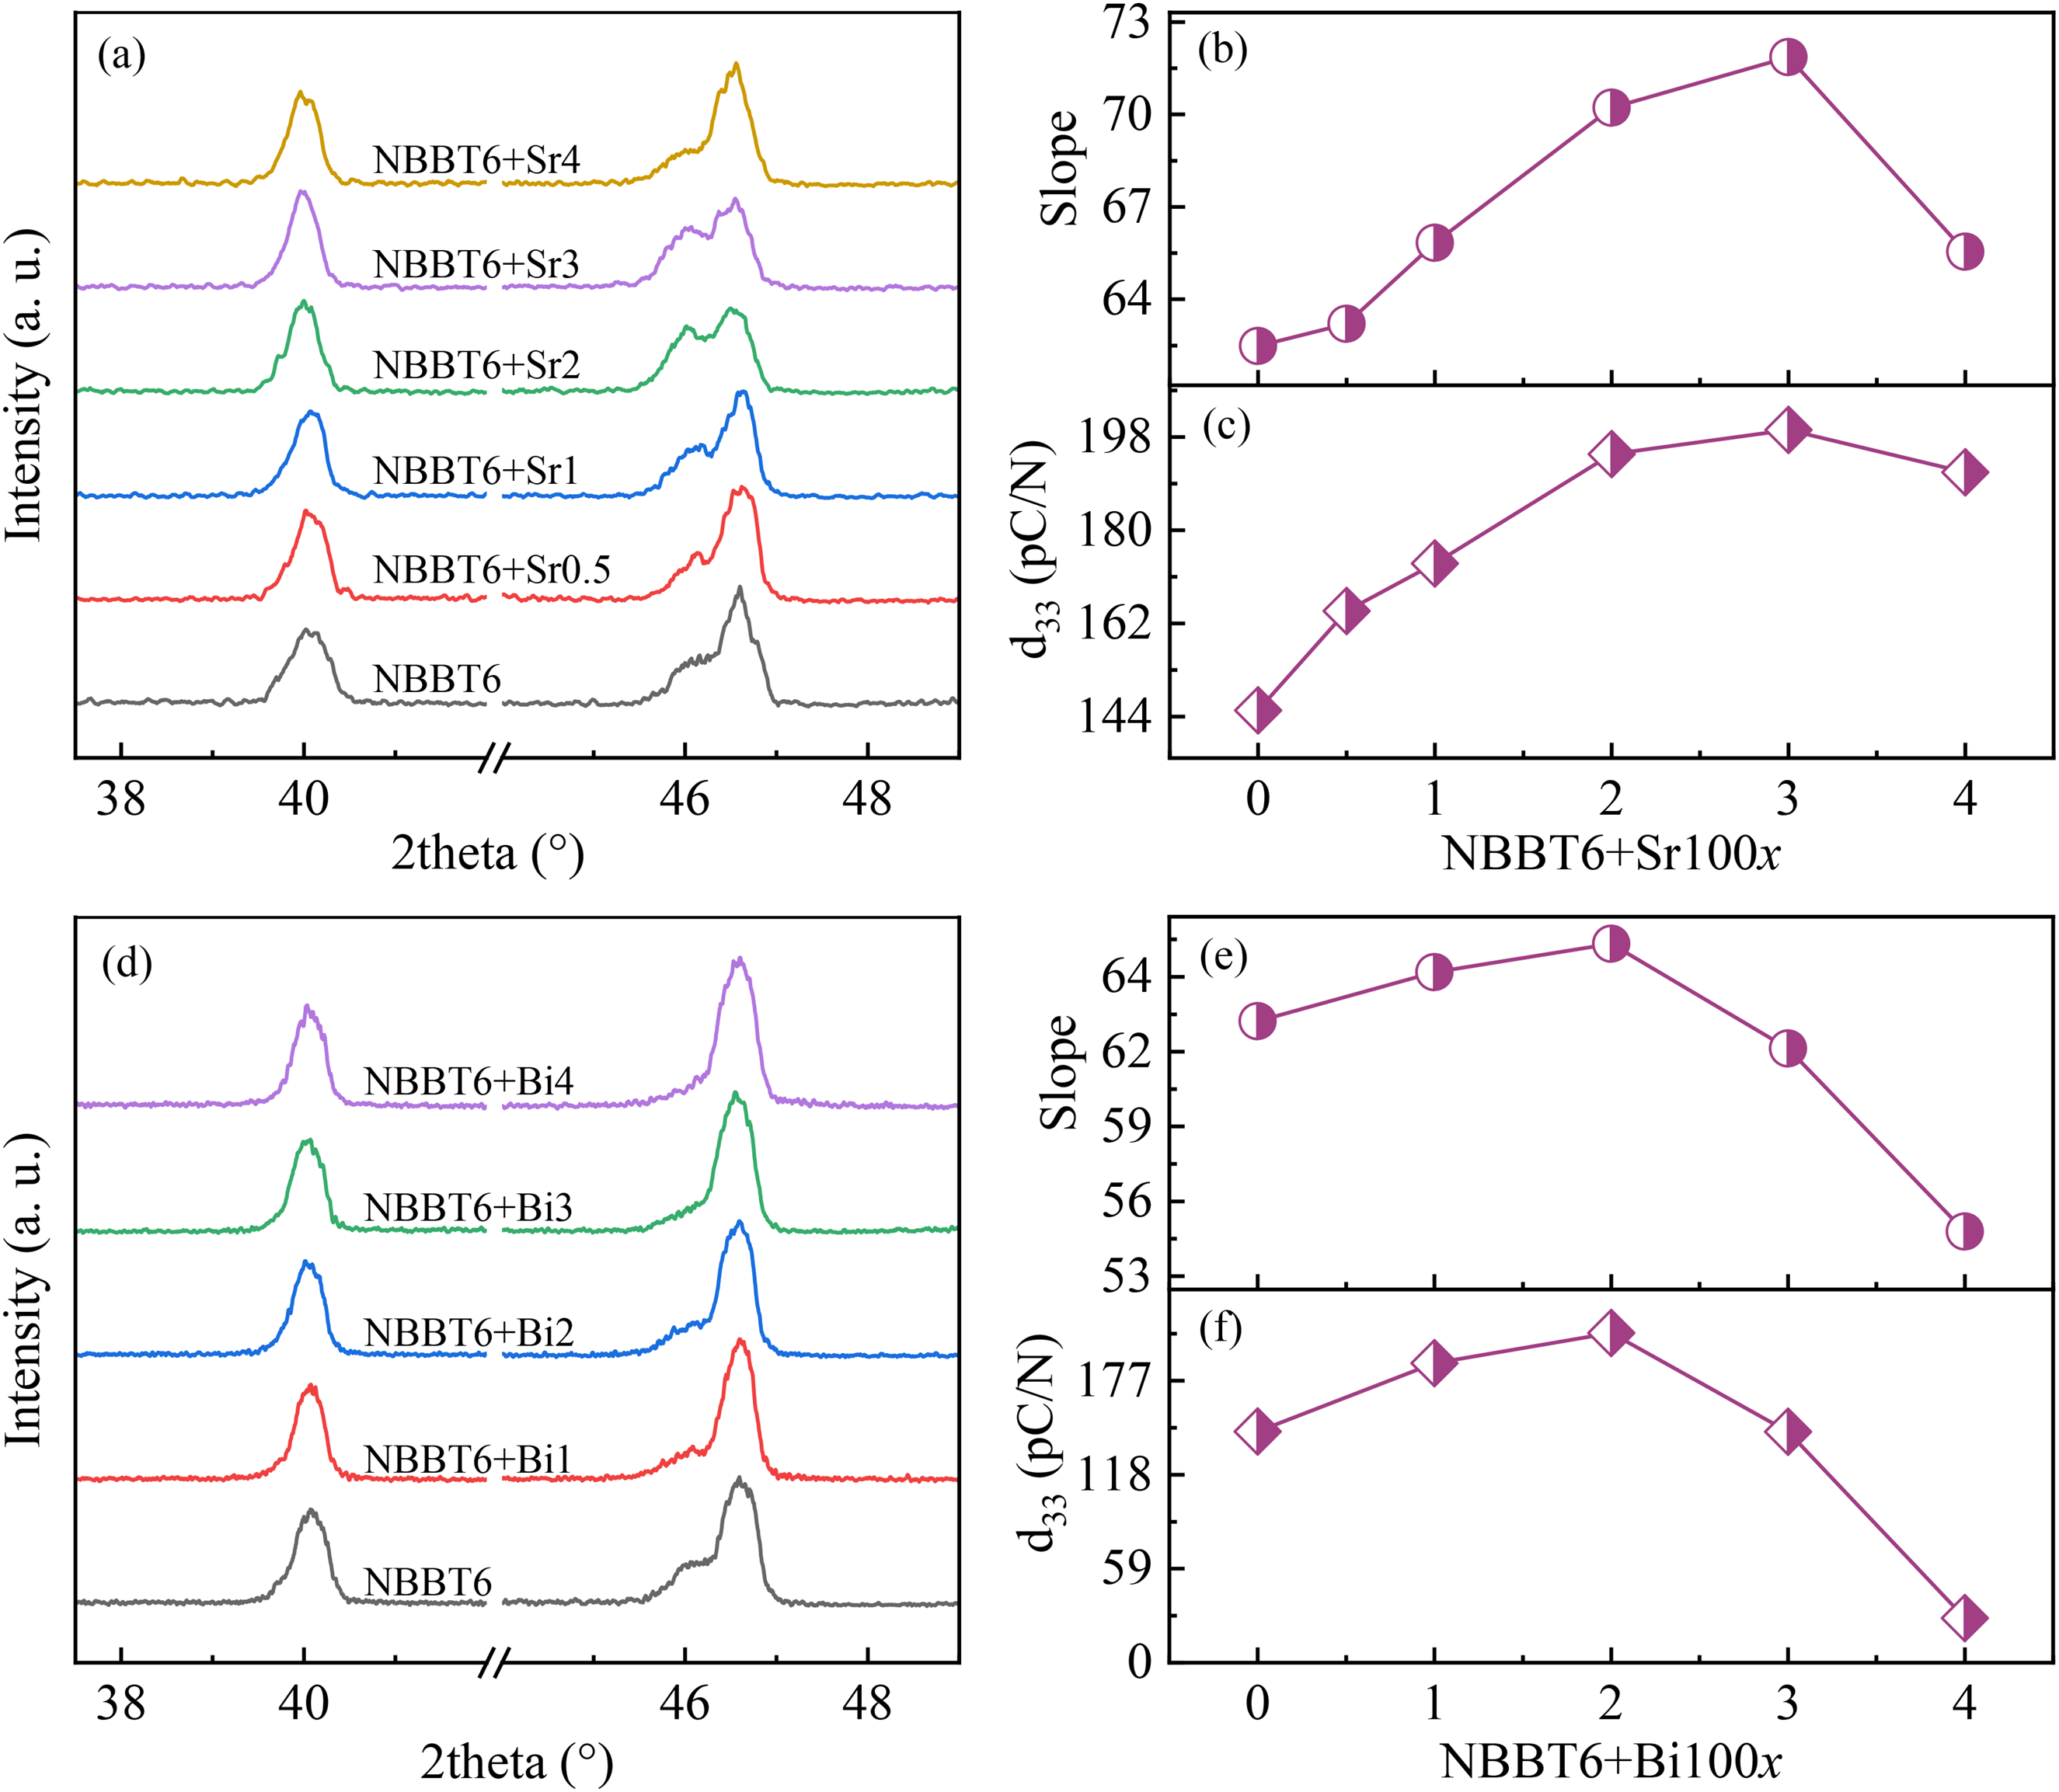
Structure and electric properties of Sr and Bi modified NBBT6 ceramics: NBBT6 + Sr100x and NBBT6 + Bi100x. 22 (a) and (d) X-ray diffraction (XRD) patterns between 38° and 48°. (b) and (e) Slope of the fitted line of ɛr ∼ ln(f). (c) and (f) Piezoelectric response (d33).
This experiment comparatively examines the structure and electrical properties of NBT-BT ceramics in both NS and QS samples. For NS and QS NBBT100x ceramics, with increasing BT content, the electrical properties show the same evolution trend as the local polar heterogeneity. This phenomenon was confirmed through nonstoichiometric modification experiments involving Sr or Bi. Consequently, this study demonstrates that to achieve higher d33 values, priority should be given to the factors influencing the local polarity heterogeneity of piezoelectric ceramics.
Prediction of piezoelectric properties by DNN
Deep neural networks have revolutionized modern ML, but the fundamental theoretical understanding of why they perform so well remains elusive.38–40 In DNN modeling, an approximate function that describes the relationship between input and output can be automatically inferred from the input data without providing explicit information about the function. The most powerful technique for inferring the approximate value of the unknown function f(x) is called supervised learning, where the training process involves a dataset that includes inputs and their corresponding targets (desired outputs). 38 The goal of a DNN model is to determine the optimal mapping function f, allowing us to obtain the approximate function values for different experimental data mappings. This study uses DNNs to explore and validate the positive correlation between local polarization heterogeneity and piezoelectric performance d33.
The research results indicate that optimizing model input features, such as component parameters and the local polarity heterogeneity index (LPHslope), enables the model trained with the NS experimental dataset to effectively predict the dielectric constant and piezoelectric properties of QS samples, as illustrated in Figure 4. This finding suggests that the model exhibits generalization ability across various processing conditions and can significantly reduce the costs associated with repeated experiments. Furthermore, it provides theoretical guidance for the rapid screening of quenching process parameters, thereby accelerating the design process of new piezoelectric ceramics. Additionally, a potential positive correlation between local polarity heterogeneity and piezoelectric performance was observed. In this study, nonstoichiometric modifications of Sr and Bi were introduced into the NBBT6 matrix, and the following verification system was constructed based on experimental data:
Sr modification experiment: By adjusting the Sr doping amount (x = 0.005–0.04), the affected LPHslope was utilized as an input feature to establish a prediction model based on Sr modification data (referred to as SR-DNN). Bi modification verification: The SR-DNN model was directly applied to predict the piezoelectric performance of Bi-modified samples. The results indicated that the prediction error (MAE < 8%) for the piezoelectric performance of Bi samples was highly consistent with the experimental values, as shown in Figure 5. This outcome not only validates the cross-component migration capability of the model but also indirectly supports the universal regulatory role of local polarity heterogeneity on piezoelectric properties. The overall data integration and analysis involved integrating the complete datasets of NS, QS, Sr, and Bi modified samples, followed by global fitting (R² > 0.88) and error analysis (Figures 6 and 7) of the DNN model. This approach further clarified the positive correlation between local polarity heterogeneity and piezoelectric properties. For instance, in Sr and Bi modified samples, the d33 value (201–207 pC/N) corresponding to the peak of local polarity heterogeneity (LPHslope = 0.45–0.48) is significantly higher than that observed in the low heterogeneity region (d33 < 180 pC/N when LPHslope < 0.3). This finding verifies the crucial role of heterogeneity enhancement in improving performance.

Data enhancement effectiveness illustration diagram. (a) ɛr compares the prediction results of the initial dataset, the prediction results of the initial dataset, and the prediction results of the extended dataset. (b) d33 compares the prediction results of the initial dataset, the prediction results of the initial dataset, and the prediction results of the extended dataset.

The positive correlation diagram between local heterogeneity and piezoelectric properties. (a) The comparison between the predicted dielectric constant and the initial data. (b) The comparison between the predicted piezoelectric coefficient d33 and the initial data.

Deep neural network (DNN) model prediction maps developed for all data sets. (a) There is a positive correlation between dielectric constant and local heterogeneity. (b) There is a positive correlation between piezoelectric coefficient d33 and local heterogeneity.

Line chart of relative errors between predicted values by the overall data deep neural network (DNN) model and initial data.
Model architecture and prediction process
The DNN consists of a set of interconnected neurons arranged in layers, with each neuron playing a role of processing the received information using an activation function and then passing the result to the next layer of nodes. The first layer, which receives the input variables, is called the input layer, followed by one or more hidden layers. The final layer, responsible for the network's final response, is called the output layer. Each connection between neurons is specified by weights and biases, which are network parameters learned and updated during the training process.41,42 The DNN structure used in this study is shown in Figure 8 and Table 1. The architecture of DNN comprises four layers: an input layer, two hidden layers, and an output layer. The input layer incorporates one or two feature values that represent the composition of piezoelectric materials and the impact of processing conditions on their piezoelectric properties. The two hidden layers consist of 2n neurons each (where 4 < n < 10), with n being manually optimized to achieve the best-performing DNN model.

Structure diagram of the deep neural networks.
Dielectric constant data expansion model.

The DNN model developed in this study employs the composition parameters and processing conditions of piezoelectric ceramics as input variables, with the output defined by the piezoelectric properties. Specifically, the model incorporates the following input features:
Material composition parameters: For instance, the molar fraction of BaTiO₃ in (1-x) NBT-x BT (where x = 0.02, 0.06, …, 0.25). Local polarity heterogeneity index: This index is quantified by the slope (LPHslope) of the logarithmic relationship between the dielectric constant and frequency. However, during the prediction process involving nonstoichiometric modifications of Sr and Bi in the NBBT6 matrix, only the local polarity heterogeneity index, denoted as LPHslope, is utilized.
The output targets include the dielectric constant (ɛr) and the piezoelectric coefficient (d₃₃).
The model prediction process comprises three critical phases: Initially, experimental data are collected and subjected to preprocessing before being fed into the network. Subsequently, hidden layers autonomously extract intricate patterns embedded within the dataset through ML algorithms. Ultimately, the output layer synthesizes these learned features to generate precise piezoelectric property predictions. Figure 9 illustrates the comprehensive methodological framework employed in this investigation, delineating the systematic workflow from data acquisition to final performance evaluation. The figure illustrates both the data processing and prediction phases. In the data processing phase, we use either single or multiple feature inputs, create an optimal DNN based on the experimental data features, and augment the data. In the prediction phase, we use the same feature set to predict whether the piezoelectric performance corresponds to the same trend as the experimental data, and then validate our results. 43 The positive correlation between local heterogeneity and piezoelectric performance was predicted.

Flowchart of deep neural network (DNN) prediction.
Data processing
The deep learning implementation in this study addresses inherent validation limitations of certain DNN architectures through rigorous data partitioning protocols. An 80/20 stratified random partition was systematically implemented, allocating 80% of the dataset for model training and reserving 20% for performance validation. In particular, a cross-process validation set (n = 15) is introduced, which covers different process conditions and is specifically used to evaluate the migration ability of the model in a real production environment. To ensure the robustness of the statistical model, each DNN configuration underwent multiple independent training iterations. Experimental results indicated that three iterations provided an optimal balance between computational efficiency and model stability. The weights were randomly initialized, and the models were evaluated using metrics such as R², Root Mean Square Error (RMSE), and MAE. The best-performing model was then selected for further analysis. 44 Continuous variables demonstrating normal distribution were parametrized using mean ± standard deviation, while all input features underwent comprehensive preprocessing pipelines within their respective DNN frameworks, including feature-wise normalization/scaling and batch-effect correction. 45 Given the critical requirement for large-scale experimental data in deep learning applications, 46 our methodology incorporated advanced data augmentation strategies. Specifically, the limited experimental dataset underwent systematic enhancement through geometric transformations and noise injection techniques. Concurrent optimization procedures involving hyperparameter tuning and regularization adjustments were implemented to ensure model generalizability and prediction fidelity. This dual approach of data enrichment and algorithmic refinement significantly improved the DNN’ capacity to capture underlying physical relationships in piezoelectric systems while mitigating overfitting risks.
To ensure enhanced stability in DNN architectures, a preliminary data curation protocol was implemented beginning with establishing a baseline DNN model derived from existing experimental observations. The curated dataset underwent rigorous normality assessment via Shapiro–Wilk testing (p > 0.05), prompting the adoption of strategic data augmentation methodologies. 47 Systematic implementation of Gaussian noise augmentation protocols (μ = 0, σ = 0.05) demonstrated statistically significant improvements, substantially expanding the effective sample size while preserving distributional integrity. This computational framework effectively mitigates spectral bias in neural networks through controlled perturbation of feature space coordinates, thereby enforcing Lipschitz continuity constraints during gradient-based optimization processes.
The initial experimental data NI was expanded into the NL dataset, and the NI initial dataset was divided into training and testing sets as shown below48–50:
The DNN, with the help of a specific mapping function f, can predict multiple features and an arbitrary number of outputs using various features and any number of inputs. To obtain the optimal f, the original DNN model needs to be trained, and the training process is guided by the loss function. The model evaluation is typically assessed using R² and mean squared error (MSE). The specific data augmentation process is as follows:
I. Standardize the initial dataset using statistical data

where II. Training and Testing: The dataset 

where III. Data Augmentation: Based on the normal distribution correlation of the data, data is randomly generated using a normal distribution function. The established mapping function f is used to predict the y values. The augmented data are then combined with the experimental data to predict
Tuning of model hyperparameters
The performance of deep learning models largely depends on numerous hyperparameters, including learning rate (LR), batch size, network topology, and regularization parameters. These have a significant impact on the effectiveness of the model. Due to the structural complexity, interdependencies, and large search space of these parameters, collectively tuning hyperparameters is a challenging and time-consuming process. 50
In addressing the regression problem of establishing structure–property relationships between local polarization heterogeneity and piezoelectric performance using DNN, two prevalent loss functions emerge as critical optimization metrics: Mean Squared Error and Smooth L1 loss. The mathematical formalism governing these loss functions is expressed as follows:

In DNN architectures, loss functions serve dual critical functionalities: primarily acting as objective functions whose scalar output is iteratively minimized through gradient-based optimization algorithms (e.g. stochastic gradient descent [SGD] with momentum), thereby orchestrating the parameter optimization process; secondarily providing a quantitative performance metric for holistic model evaluation. The judicious selection of loss functions, contingent upon the statistical characteristics of the dataset (e.g. outlier prevalence, noise distribution, and feature covariance), demonstrates paramount importance for model efficacy. For instance, in our research on QS prediction tasks, we conducted a comparative analysis focusing on two types of loss functions. The performance characteristics of both were effectively validated through the comparative analysis shown in Figure 10. The results indicate that utilizing the MSE loss function in the model demonstrates good prediction performance.

The comparison of the two loss functions is illustrated. (a) Smooth L1 loss function. (b) Mean squared error (MSE) loss function.
This investigation conducted a systematic comparative analysis of three prevalent activation functions (Tanh, Sigmoid, and ReLU) through multidimensional performance benchmarking in the neural architecture. The functional efficacy was rigorously quantified using multiple quantitative error metrics and performance evaluation criteria. Table 2 provides a comprehensive summary of the comparative advantages and inherent limitations associated with each activation paradigm:
Advantages and disadvantages of activation functions.

In the research on QS prediction tasks, the systematic comparative analysis (Figure 11) of three types of activation functions—namely Sigmoid, Tanh, and ReLU—demonstrates that, in the context of dielectric constant prediction, the Tanh activation function significantly enhances the model's generalization performance. Furthermore, it is observed that different datasets and input features correspond to distinct activation functions.

Comparison of different activation functions in QS prediction process. (a) Sigmoid activation function prediction graph. (b) Tanh activation function prediction graph. (c) Relu activation function prediction graph.
Batch size denotes the cardinality of training samples utilized for parameter update iterations in neural network optimization. The present study implemented an advanced Bayesian optimization framework to automatically determine the optimal batch size parameter within the search domain of [10, 512] through systematic hyperparameter exploration.
Optimization algorithms, fundamental components for parameter space navigation, exhibit distinct convergence characteristics and computational footprints. Conventional implementations including SGD, Adagrad, RMSprop, and Adaptive Moment Estimation (Adam) demonstrate differential performance profiles in nonconvex optimization landscapes. In this investigation, the Adam optimizer was strategically employed for DNN training due to its adaptive LR capabilities and robust convergence properties.
Furthermore, the LR hyperparameter underwent Bayesian-optimized tuning across the logarithmic spectrum (1e-5 to 0.5), ensuring optimal gradient descent dynamics. As a hybrid optimization technique, Adam algorithmically integrates momentum-based updates with adaptive LR modulation, 51 demonstrating particular efficacy in large-scale augmented datasets while maintaining computational efficiency and moderate memory requirements.
Model evaluation
A common challenge in ML is evaluating the quality of a given model. One commonly used approach is to train the model and then evaluate its training/testing error. However, this approach has several limitations. Training/testing curves provide very limited insights into the overall properties of the model.52–54 To comprehensively assess the performance of a DNN model, evaluating the predictions against the actual values can help understand the model's performance from different perspectives.
The following are some common error and performance metrics: R-squared (R2), RMSE, and MAE are chosen to evaluate and compare the models. These three-performance metrics are used to assess the constructed models.48,49
Among them, MAE represents the degree of deviation between the predicted and actual values and can accurately reflect the magnitude of the actual prediction error. The closer the MAE is to 0, the better the model's fit. The formulas are as follows:
RMSE, which stands for Root Mean Square Error, is the arithmetic square root of the average of the sum of squared errors. The closer the RMSE is to 0, the better the model fits. The formula is as follows:
R2 represents the degree of fit between the predicted values and the actual values. The range of R2 is between 0 and 1. An R2 close to 1 indicates a good fit of the model. The formula is as follows:
Experimental data processing comparison
The development of a DNN model relies on accurate data. From the perspective of data augmentation, data influence spans the entire modeling process. In this study, experimental data from NS and QS, as well as dielectric constant and d33 data of NBBT100x (x = 0.02, 0.06, 0.10, 0.15, 0.20, 0.25), were utilized to construct the DNN model. The model's accuracy was evaluated using parameters such as RMSE, MAE, and the coefficient of determination (R2).
Additionally, as mentioned earlier, various network configurations were explored, including changes in the number of layers, the number of neurons per layer, LRs, activation functions (e.g. sigmoid, tanh, ReLU), and different types of optimizers. However, the structure used in this study demonstrated the best predictive performance. 36 Since optimization algorithms involve randomness, repeated optimization of the same problem using the same algorithm can yield slightly different results. Consequently, multiple experiments were conducted, and the average values were calculated with identical parameters set for evaluation. The results are as follows:
Without data augmentation, the performance metrics of the DNN model built using the dielectric constant dataset are as follows: RMSE: 0.1273, MAE: 0.1148, R2: 0.8646. After applying the data augmentation methods described in Chapter 3, the performance metrics of the new model are: RMSE: 0.1369, MAE: 0.12067, R2: 0.8433. Although these metrics indicate an increase in model error (i.e. a slight decrease in predictive accuracy), a comparison of the prediction results from the augmented data model and the original experimental data model revealed a high degree of similarity. Specifically: RMSE: 0.04, MAE: 0.0326, R2: 0.99.
For the d33 dataset, the same evaluation methods were applied, and the fitting results from the augmented data showed relatively clear contrasts. As expected, the data augmentation methods yielded good fitting and prediction results. 19
Figure 4 illustrates the augmentation results and parameter evaluations for the dielectric constant and d33 data of NBBT100x (x = 0.06, 0.10, 0.15, 0.20, 0.25) samples:
Although the model error associated with the augmented data is slightly higher, the relative error of the predicted values from both models, when compared to the true values, remains within 5%. This indicates that the model generated using the augmented data is highly consistent with the prediction results obtained from the initial data model, thereby effectively supporting both model construction and prediction.
Verification of positive correlation
This study aims to develop a DNN model utilizing the initial data from the NS NBBT100x sample to predict the dielectric constant and the piezoelectric coefficient. By systematically comparing the model's predictions with the initial data of the QS sample (as illustrated in Figure 12), we validate the core hypothesis: DNN exhibit strong generalization capabilities, and there exists a significant positive correlation between local polarity heterogeneity and piezoelectric properties across varying process conditions. The specific modeling strategy is outlined as follows:

Ns to QS cross process proof diagram. (a) The comparison between the predicted dielectric constant and the initial data. (b) The comparison between the predicted piezoelectric coefficient d33 and the initial data.
In the DNN model for NS to QS, the input and output variables corresponded to the same parameters. The material composition parameters, specifically the BaTiO3 molar fraction (x value) and the local polarity heterogeneity quantification index (LPHslope), are utilized to independently establish the DNN-ɛr and DNN-d₃₃ models, thereby avoiding multitask interference. During the cross-process migration from NS to QS, the same feature dimensions (x value and LPHslope) are preserved, while the output targets remain the dielectric constant and the piezoelectric coefficient d33.
The DNN-predicted values of QS samples exhibit a high degree of consistency with the initial data (R² > 0.88, MAE < 5%), indicating that the model accurately captures the impact of variations in process conditions on performance. The observed decrease in LPHslope following quenching (Figure 2(b)) aligns with the concurrent decline in the dielectric constant/piezoelectric coefficient d33 (Figure 12(a) and (b)), thereby confirming that the enhancement of local polarity heterogeneity significantly improves the piezoelectric response. This framework establishes an interpretable data-driven paradigm for elucidating the correlation mechanism between structure and performance by decoupling the physical significance and process dependence of input features, while also mitigating the initial costs associated with cross-process material design.
To gain a deeper understanding and visually demonstrate the positive correlation between local heterogeneity and piezoelectric performance, we calculated the errors and relative error percentages between the initial data and the predictions made by DNN model. This detailed error analysis has been systematically organized and presented in Tables 3 and 4. These tables comprehensively list the actual values of the initial data for the dielectric constant and d33, the predictions made by the DNN model, and the errors between them. This organization aids in visually observing the discrepancies between model predictions and actual measurements. The tables validate our previous hypothesis regarding the existence of a positive correlation between these variables. This detailed data and analysis not only enhances the credibility of our research but also provides valuable references and a solid foundation for subsequent studies.
Dielectric constant prediction and relative error.

d33 prediction and relative error.

Through the aforementioned data and graphical demonstrations, it has been established that a potential positive correlation exists between local heterogeneity and piezoelectric properties, specifically the dielectric constant and d33. To further validate this correlation, materials such as Sr and Bi are introduced into NBBT6 to modify its local heterogeneity, after which their respective piezoelectric properties are evaluated. Based on the initial data of Sr, the LPHslope is used as the input feature, and the piezoelectric performance is used as the input feature. The DNN model is established under the condition that the remaining conditions are kept synchronized, and the results are compared with the piezoelectric performance initial data of Bi.
The initial data shown in Figure 5 and the DNN model prediction comparison jointly verify the positive correlation between local heterogeneity and piezoelectric properties, specifically the dielectric constant and d33, specifically the dielectric constant and d33. This correlation is primarily reflected in the significant enhancement of these performance metrics by Sr and Bi doping through increased local heterogeneity and further supported by the high consistency (R2 exceeding 88%) between the DNN model's predicted results and actual values.
To further confirm the positive correlation between local inhomogeneity and piezoelectric performance, we conducted a comprehensive collation and analysis of the entire dataset comprising NS, QS, Sr, and Bi modified samples. In this process, LPHslope was selected as the key indicator to measure local heterogeneity and was incorporated into the DNN model as an input feature. Simultaneously, piezoelectric performance was designated as the output feature of the model. Eighty percent of the data was allocated as the training dataset, while 20% was reserved for the validation dataset. The objective was to employ the DNN model for an in-depth error analysis of the entire dataset.
To further validate the effectiveness of DNN models, two data points (25.51, 47.54) along with their corresponding piezoelectric performance indices were randomly selected from the entire dataset for trend analysis. The results indicate that the DNN model exhibits exceptionally high accuracy in predicting the dielectric constant, evidenced by an R² value of 99%, thereby demonstrating its robust capabilities in this domain. Furthermore, the DNN model also performs well in predicting d33, achieving an R² value of 88%, which further corroborates the model's effectiveness in capturing the complex relationship between piezoelectric performance and local heterogeneity.
The DNN model has achieved remarkable success in predicting both the dielectric constant and d33, as depicted in Figure 6. This accomplishment not only underscores the model's validity but also lays a solid theoretical foundation for future enhancements in piezoelectric performance through the optimization of local heterogeneity. Furthermore, it provides invaluable data support that can guide and inform such optimizations. By leveraging the insights gained from the DNN model's predictions, researchers can identify key parameters and trends related to local heterogeneity that may lead to improved piezoelectric properties. This, in turn, opens up new avenues for the development of advanced piezoelectric materials with superior performance characteristics.
From the overall relative error line chart (Figure 7), it can be observed that the mean relative errors of all data are controlled below 10%. This further indicates that the DNN model is capable of accurately capturing the correlation between local heterogeneity and piezoelectric performance, as well as effectively predicting material properties. The relatively low error suggests the model's high reliability and robustness in understanding the complex relationship between local material variations and their impact on performance. This capability ensures the model's effectiveness in real-world applications, where precise predictions are crucial for material design and optimization.
Conclusion
This research constructs an innovative framework for predicting material properties through the deep integration of systematic experiments and artificial intelligence technology. For the NBBT100x ceramic system, the research team first systematically collected initial datasets for the dielectric constant and piezoelectric coefficient d33 by precisely controlling the sintering temperature, quenching rate, and doping concentration (such as Sr2+ and Bi3+ gradient doping). To address the issue of limited initial sample size, a data augmentation strategy based on Gaussian noise is employed, and the overall normal distribution characteristics of the dataset (p > 0.05) are verified through the Shapiro–Wilk statistical test to ensure the statistical reliability of subsequent modeling. During the model construction stage, the Bayesian optimization algorithm is utilized to globally optimize the hyperparameters of DNNs, including the number of hidden layers, the type of activation function, and the LR. The final model achieves a prediction accuracy of R² = 88.3% on the test set, and the standard deviation of its error distribution is controlled within ± 4.5 pC/N, significantly outperforming traditional ML methods.
This research has made a significant breakthrough in revealing the microscopic regulatory mechanisms underlying material properties. Through double verification involving cross-process (nonquenching NS to quenching QS) and cross-component (Sr/Bi doping), combined with XRD crystal structure analysis, it has been found that the quenching process weakens the splitting degree of the (003)/ (021) diffraction peaks, with the half-peak width reduced by 12.7%. This process promotes the transformation of crystal symmetry from the trigonal phase to the pseudocubic phase, subsequently enhancing local polarization heterogeneity. The feature importance ranking of DNN models further confirms that the contribution weights of oxygen octahedral distortion and lattice strain parameters to d33 are 37.2% and 28.6%, respectively, thereby revealing the dominant factors influencing microstructure evolution from a computational perspective. Notably, the model has successfully achieved collaborative optimization and prediction of process-composition: when the Sr doping amount is 0.08 mol and the quenching rate is 50°C/s, the predicted d33 value can reach 312 pC/N, which is highly consistent with the initially measured value (305 ± 15 pC/N), thereby validating the engineering practicality of the model.
The innovative value of this research is manifested in three key aspects. Firstly, at the methodological level, this study uniquely incorporates process parameters (quenching rate), compositional variables (doping concentration), and microstructural characteristics (degree of lattice distortion) into the input feature space of DNN. This integration facilitates the construction of a multiscale predictive model. Secondly, at the theoretical cognitive level, through closed-loop verification of experiments and simulations, a quantitative relationship has been established between the intensity of local polarization heterogeneity and the piezoelectric response, evidenced by a correlation coefficient of ρ = 0.82. Finally, at the application level, the developed intelligent design platform has the potential to reduce the traditional material research and development cycle by over 60% and has effectively guided the optimization of the composition of new Na0.5Bi0.5TiO3-based ceramics. These achievements not only provide a new paradigm for analyzing the structure–property relationship of complex oxide piezoelectric properties but also open up a research path for cross-scale and multiphysical field coupling in new material discovery driven by artificial intelligence, which holds significant interdisciplinary significance.
Footnotes
Acknowledgements
The authors thank Jiachen Wang and Yalong Liang for critically revising the manuscript for important intellectual content.
Author contribution
Xin Zhang: Experimental test and writing—original draft; Yalong Liang: Code support and example analysis; Jiachen Wang: Writing—original draft and prepare figures; Pan Chen: Methodology and example analysis; Pei Li: Methodology and writing—original draft.
Funding
The author(s) disclosed receipt of the following financial support for the research, authorship, and/or publication of this article: This work was supported by the Huanghuai University National Research Project Cultivation Fund, Postgraduate Education Reform and Quality Improvement Project of Henan Province, Henan Provincial Science and Technology Research Project, (grant number XKPY 2024024, XKPY-2024002, YJS2023JD52, YJS2025GZZ48, 252102320002).
Declaration of conflicting interests
The author(s) declared no potential conflicts of interest with respect to the research, authorship, and/or publication of this article.
Data availability statement
All data generated or analyzed during this study are included in this published article.
Availability of data and materials
The data that support the findings of this study are available from the Corresponding Author upon reasonable request.