
Abstract
In the realm of optomechanical joints, the roughness of the component frequently limits the bonded joint's stability and dependability. This study investigates the failure mechanisms and interfacial stress transfer characteristics of bonded structures with six controlled roughness levels to elucidate roughness-dependent adhesion behavior. Shear experiments have been carried out to analyze the failure mechanisms of bonded joints. The results indicate that when roughness increases, shear strength first rises and subsequently falls. When the surface roughness of the duralumin alloy is 4.2 ± 0.75 μm, the shear strength reaches its maximum value of 11.97 MPa. After analyzing the surface characteristics of substrates with various degrees of roughness, the results show that increasing surface roughness can significantly change the substrate's surface energy, wettability, and contact area while also greatly changing the bonding quality. The fractographic evaluation identified interfacial debonding and cohesive-adhesive hybrid failure as the predominant fracture mechanisms. Specimens exhibiting hybrid failure demonstrated enhanced interfacial load transfer capability through synergistic contributions from both adhesive-substrate bonding and bulk adhesive deformation. This research offers an important reference for the manufacture and application of epoxy adhesive and duralumin alloy joints. It has a guiding significance for improving the performance and reliability of joints.
Introduction
Different optomechanical components must be in contact with each other, supported, and restrained during the assembly process of optical components to guarantee an acceptable position and attitude. In recent years, the adhesive technology of metal structures has been successfully applied to the design of space telescopes and is playing an increasingly important role. 1 Compared with traditional joining methods, adhesive bonding technology has the merits of large bearing capacity, even stress distribution, high specific strength, and design flexibility.2–4 Bond strength can be improved by modifying the adhesive. However, for specific adhesives and bonding substrates, the interfacial integrity and mechanical properties of the bonded joints depend primarily on the surface topography of the substrate.5,6 Consequently, surface pretreatment protocols governing substrate bonding regions constitute a critical determinant in enhancing the ultimate performance of adhesive joints.
Surface pretreatment facilitates contaminant removal, tailoring of surface topography, maximization of effective contact area, and optimization of surface wettability in adhesive bonding substrates.7,8 After surface pretreatment, it is necessary to ensure that the adhesive surface is clean. The literature has shown that the bond strength of samples contaminated with fingerprints after surface pretreatment is reduced by 20%. 9 Liu et al. 10 roughened the surface of the aluminum alloy substrate. This effectively increases the contact area between the adhesive and the substrate, promoting the mechanical interlocking effect between the adhesive and the substrate. The fabrication of high-performance adhesive joints fundamentally requires intimate interfacial contact between the adhesive and substrate surfaces,11,12 where optimized surface interactions synergistically enhance mechanical interlocking efficacy and chemical bonding formation. According to the different failure locations, it can be divided into substrate failure, interface failure, cohesive failure, and hybrid failure.13,14 Adhesive failure and cohesive failure are two typical failure modes. 15 Pan et al. 16 explored the effect of roughness on the bonding strength of the clay-concrete interface. The results show that the existence of roughness is conducive to improving the shear strength of the interface. At higher normal stress levels, roughness has a greater effect on the interfacial strength. The presence of various fracture modes is often associated with the compatibility between the base material and adhesive, and how the load is applied. 17 Surface roughness elevation has been demonstrated to significantly enhance the interfacial load-bearing capacity of adhesive joints.
The mechanical lapping constitutes a feasible methodology for surface roughness enhancement. The utilization of sandpapers with controlled grit sizes enables precise regulation of substrate surface roughness parameters through systematic abrasion processes. 18 To form a suitable adhesive joint with a high load-bearing capacity, most of the adhesives require sufficient contact with the adhesive surface. 19 This both increases the contact area and improves the substrate wettability. Joint failure occurs when the bond quality of the joint is not strong enough to endure outside loads. According to the different failure locations, it can be divided into substrate failure, interface failure, cohesive failure, and hybrid failure. 20 The presence of various fracture modes is often associated with the compatibility between the base material and adhesive, and how the load is applied. 21 Many researchers have studied the adhesion properties of different substrates at different roughness. Shear strength is the most vital index to evaluate the adhesion quality of adhesive joints. Leena et al. 22 applied three different surface treatments to the same substrate to obtain different surface roughness. The impact of the three process methods on the bond strength was compared. The results of the investigation showed that the joints with the highest surface roughness also had the maximum bonding strength. Budhe et al. 23 studied the impact of varying roughness on the quality of bonding, primarily focusing on aluminum alloy joints and wooden structure joints. The best roughness of surface amounts can be achieved in the range of 1.68 ± 0.14 μm and 1.64 ± 0.2 μm for aluminum alloy and wood structure, respectively. In addition, the increased roughness leads to lower bond strength for wooden materials. Gülçiçek et al. 24 ground the surface of the aluminum alloy, and the lap shear strength of the aluminum alloy and different adhesives (BPA/F-based, cyanoacrylate-based and BPA-based adhesives) could be increased by 47%, 54%, and 72%, respectively, when the surface roughness of the aluminum alloy reached 5.64 μm. As roughness increases, it becomes more difficult for the adhesive to come off the substrate due to mechanical locking effects. Tiwari et al. 25 also used grinding to explore the changes in the bond strength of aluminum alloys with different roughness and (2C) epoxy adhesive. At a roughness of 4.01 ± 0.21 μm, the shear strength can reach a maximum value of 27.15 ± 1.84 MPa. The removal of oxides and the formation of grooves effectively increase the contact area of the adhesive with the substrate. Safari et al. 26 examined the impact of roughness on the bonding quality of aluminum alloy. The findings showed that a well-planned roughness is a helpful element in raising the shear force. At the same time, it was found that the proportion of cohesive failure in the sample with the best roughness reached the maximum value. As a result, studying the adhesive joint failure mechanisms is a crucial step toward strengthening the joint. The quality of the adhesive bond can be used to forecast the difficulty of failure, and the type of failure can be used to examine the adhesive bond's quality. 27 It can be concluded that changing the roughness of the substrate has a tremendous impact on the bonding effect. Despite the significant efforts made in current research to clarify the impact of surface roughness on the mechanical performance of adhesive joints. Limited attention has been directed toward elucidating the mechanical behavior of adhesive joints made from duralumin alloy in the existing literature. The surface roughness of different substrates has different optimal surface roughness ranges between different adhesives.28,29 Therefore, it is necessary to study the interface and failure characteristics of aluminum alloy substrate and epoxy adhesive under different surface roughness.
Based on the above, this study will establish six distinct types of adhesive joints that were created using 2A12 duralumin alloy as the substrate with varying surface roughness. The wetting behavior and surface energy of the 2A12 aluminum alloy were characterized, and the quality of the bonding was evaluated. Meanwhile, the shear failure experiments were carried out, and the macroscopic fracture morphology of the joint was analyzed. The joint failure modes are obtained as a reference for the surface treatment and application of duralumin alloys for space lenses.
Materials and experimental processes
Materials
During the experiment, 2A12 duralumin alloy was used as the bonding material. The size of the substrate is 10 mm × 10 mm × 5 mm. In this paper, we refer to the standard GBT 1031–2009 and use three types of roughness: Low (Ra < 3.2 μm), medium (3.2–6.3 μm), and high (Ra > 6.3 μm). P800, P400, and P180 sandpaper are used for grinding on the surface of aluminum alloy. Considering that the roughness varies in the preparation process, two roughness levels are selected under each type. These two roughnesses correspond to grinding times of 5 min and 10 min, respectively. There are altogether six kinds of surface roughness, and the specific roughness is obtained in Table 1. As shown in Table 2, the duralumin alloy substrate 2A12 has the following chemical components. 30 The Scotch-WeldTM 2216 epoxy adhesive of 3M Company was used. This adhesive consists of two parts, A and B, and the ratio between them is 7/5. Diiodomethane and distilled water were used as reference liquids. Acetone as a surface cleaning agent.
Six different surface roughness levels were prepared on the surface of aluminum alloy.

Chemical components of 2A12 duralumin alloy.

Experimental processes
Wettability and surface energy
The base material surface roughness was assessed with the use of a large-depth three-dimensional (3D) microscopic system VHX-7000 (Keyence, Japan). We used a contact angle measuring instrument JC2000CS (Powereach, China) to obtain the angle of contact on the surface of the substrate. Prepare the 2A12 duralumin alloy substrate depicted in Figure 1(a), and the numbers in the figure are consistent with those in Table 1. All substrate sizes are shown in Figure 1(b). The surface is then cleaned and degreased using acetone. The surface energy of an aluminum alloy substrate is calculated by two different reference liquids (polar and non-polar). Distilled water is generally used as a polar liquid, and diiodomethane is used as a non-polar liquid. A schematic diagram of the contact angle test is shown in Figure 1(c). The volume of the reference liquid was 3 μL to ensure the accuracy of the experiment. Work of adhesion (

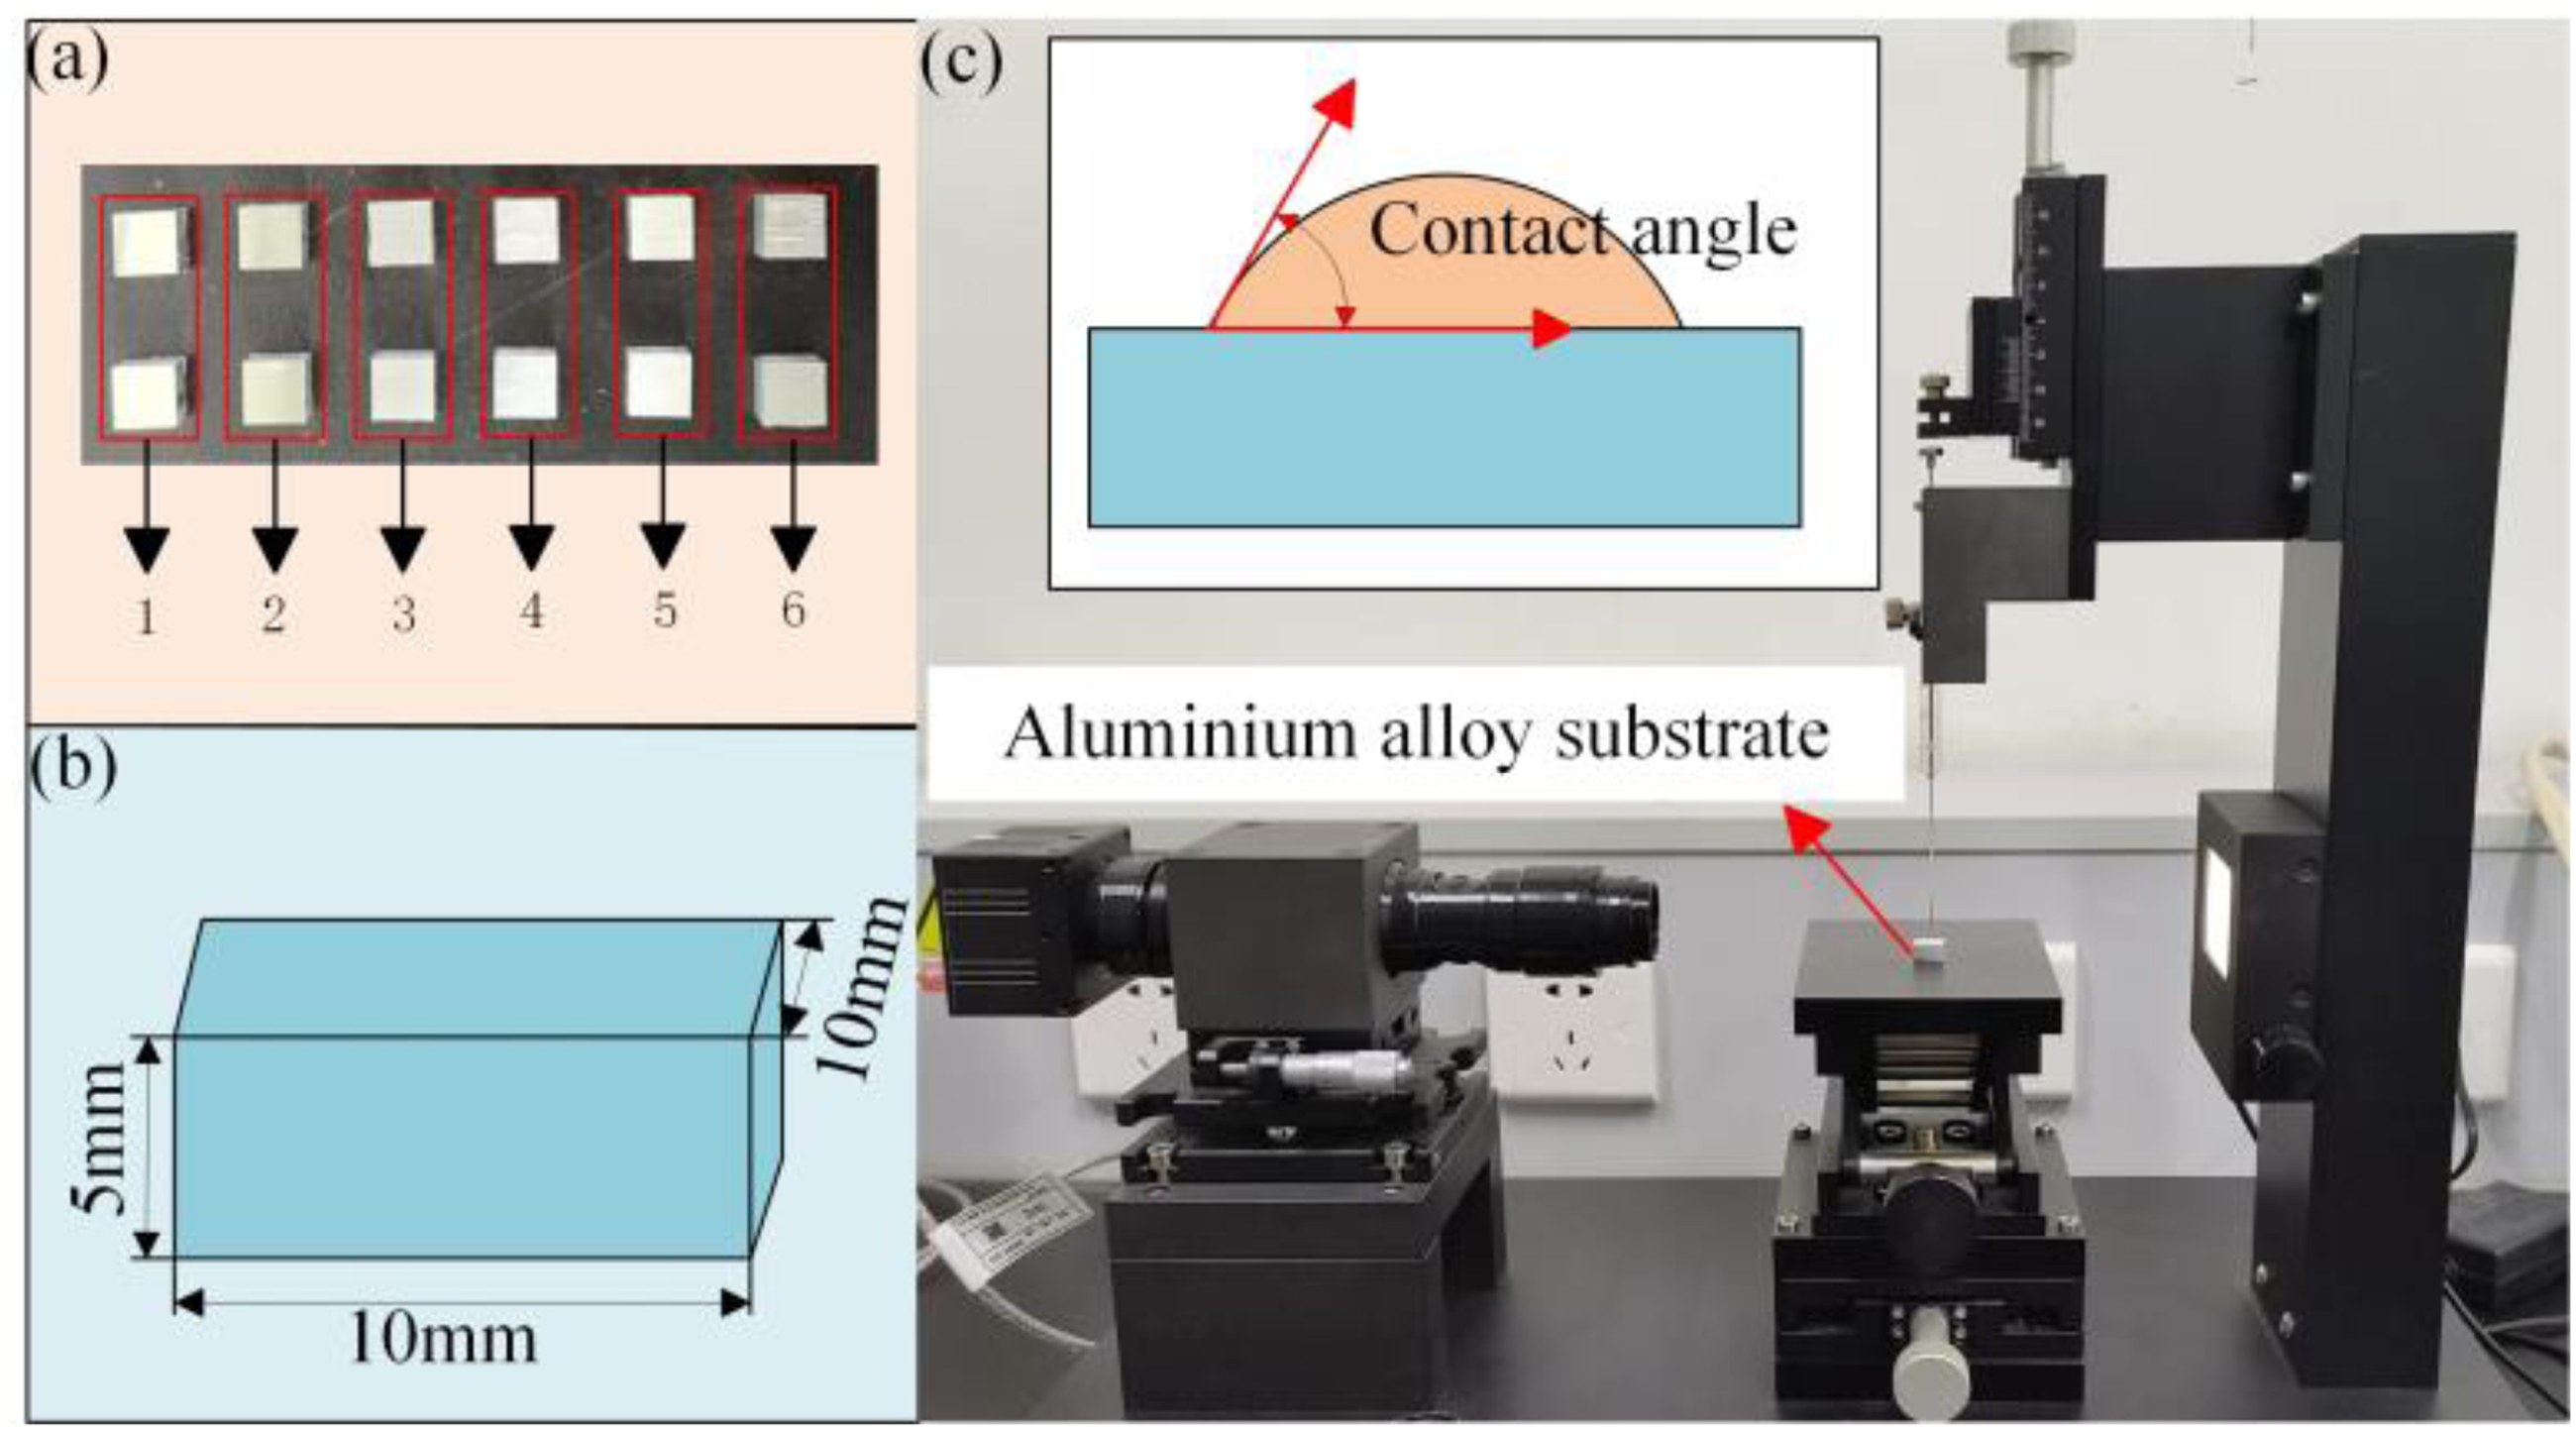
(a) Substrate preparation; (b) size of the substrate; (c) test contact angle.
Surface tension components and surface energy of reference liquids.

In addition, Scotch-WeldTM 2216 epoxy adhesive was tested for its contact angles on aluminum alloy surfaces with different surface roughness due to its fluidity. The test volume is 5 μL because the adhesive must take into account its cohesion. Record and compare the change in the adhesive's contact angle from the beginning to the time it cures. Observe the wetting behavior of the adhesive on the surface of a duralumin alloy with different roughness. The contact angle measurement direction before and after curing is consistent to ensure the accuracy of the data.
Joint structure and interface observation
As depicted in Figure 2, we prepared aluminum alloy substrates of different roughness and cleaned their bonding surfaces with acetone. Then let it dry before bonding. The butt joint is chosen for production based on its intended purpose, as seen in Figure 2(a). Apply the adhesive evenly to the lap base material. Meanwhile, a 0.2 mm-diameter wire was put in the adhesive layer to regulate the line's thickness of the adhesive throughout the experiment. The adhesive is fully cured after the joint is constructed. Finally, the adhesive quality was assessed by polishing the interface and evaluating the characteristics with scanning electron microscopy (SEM) JSM-7610FPlus (JEOL Ltd, Japan).
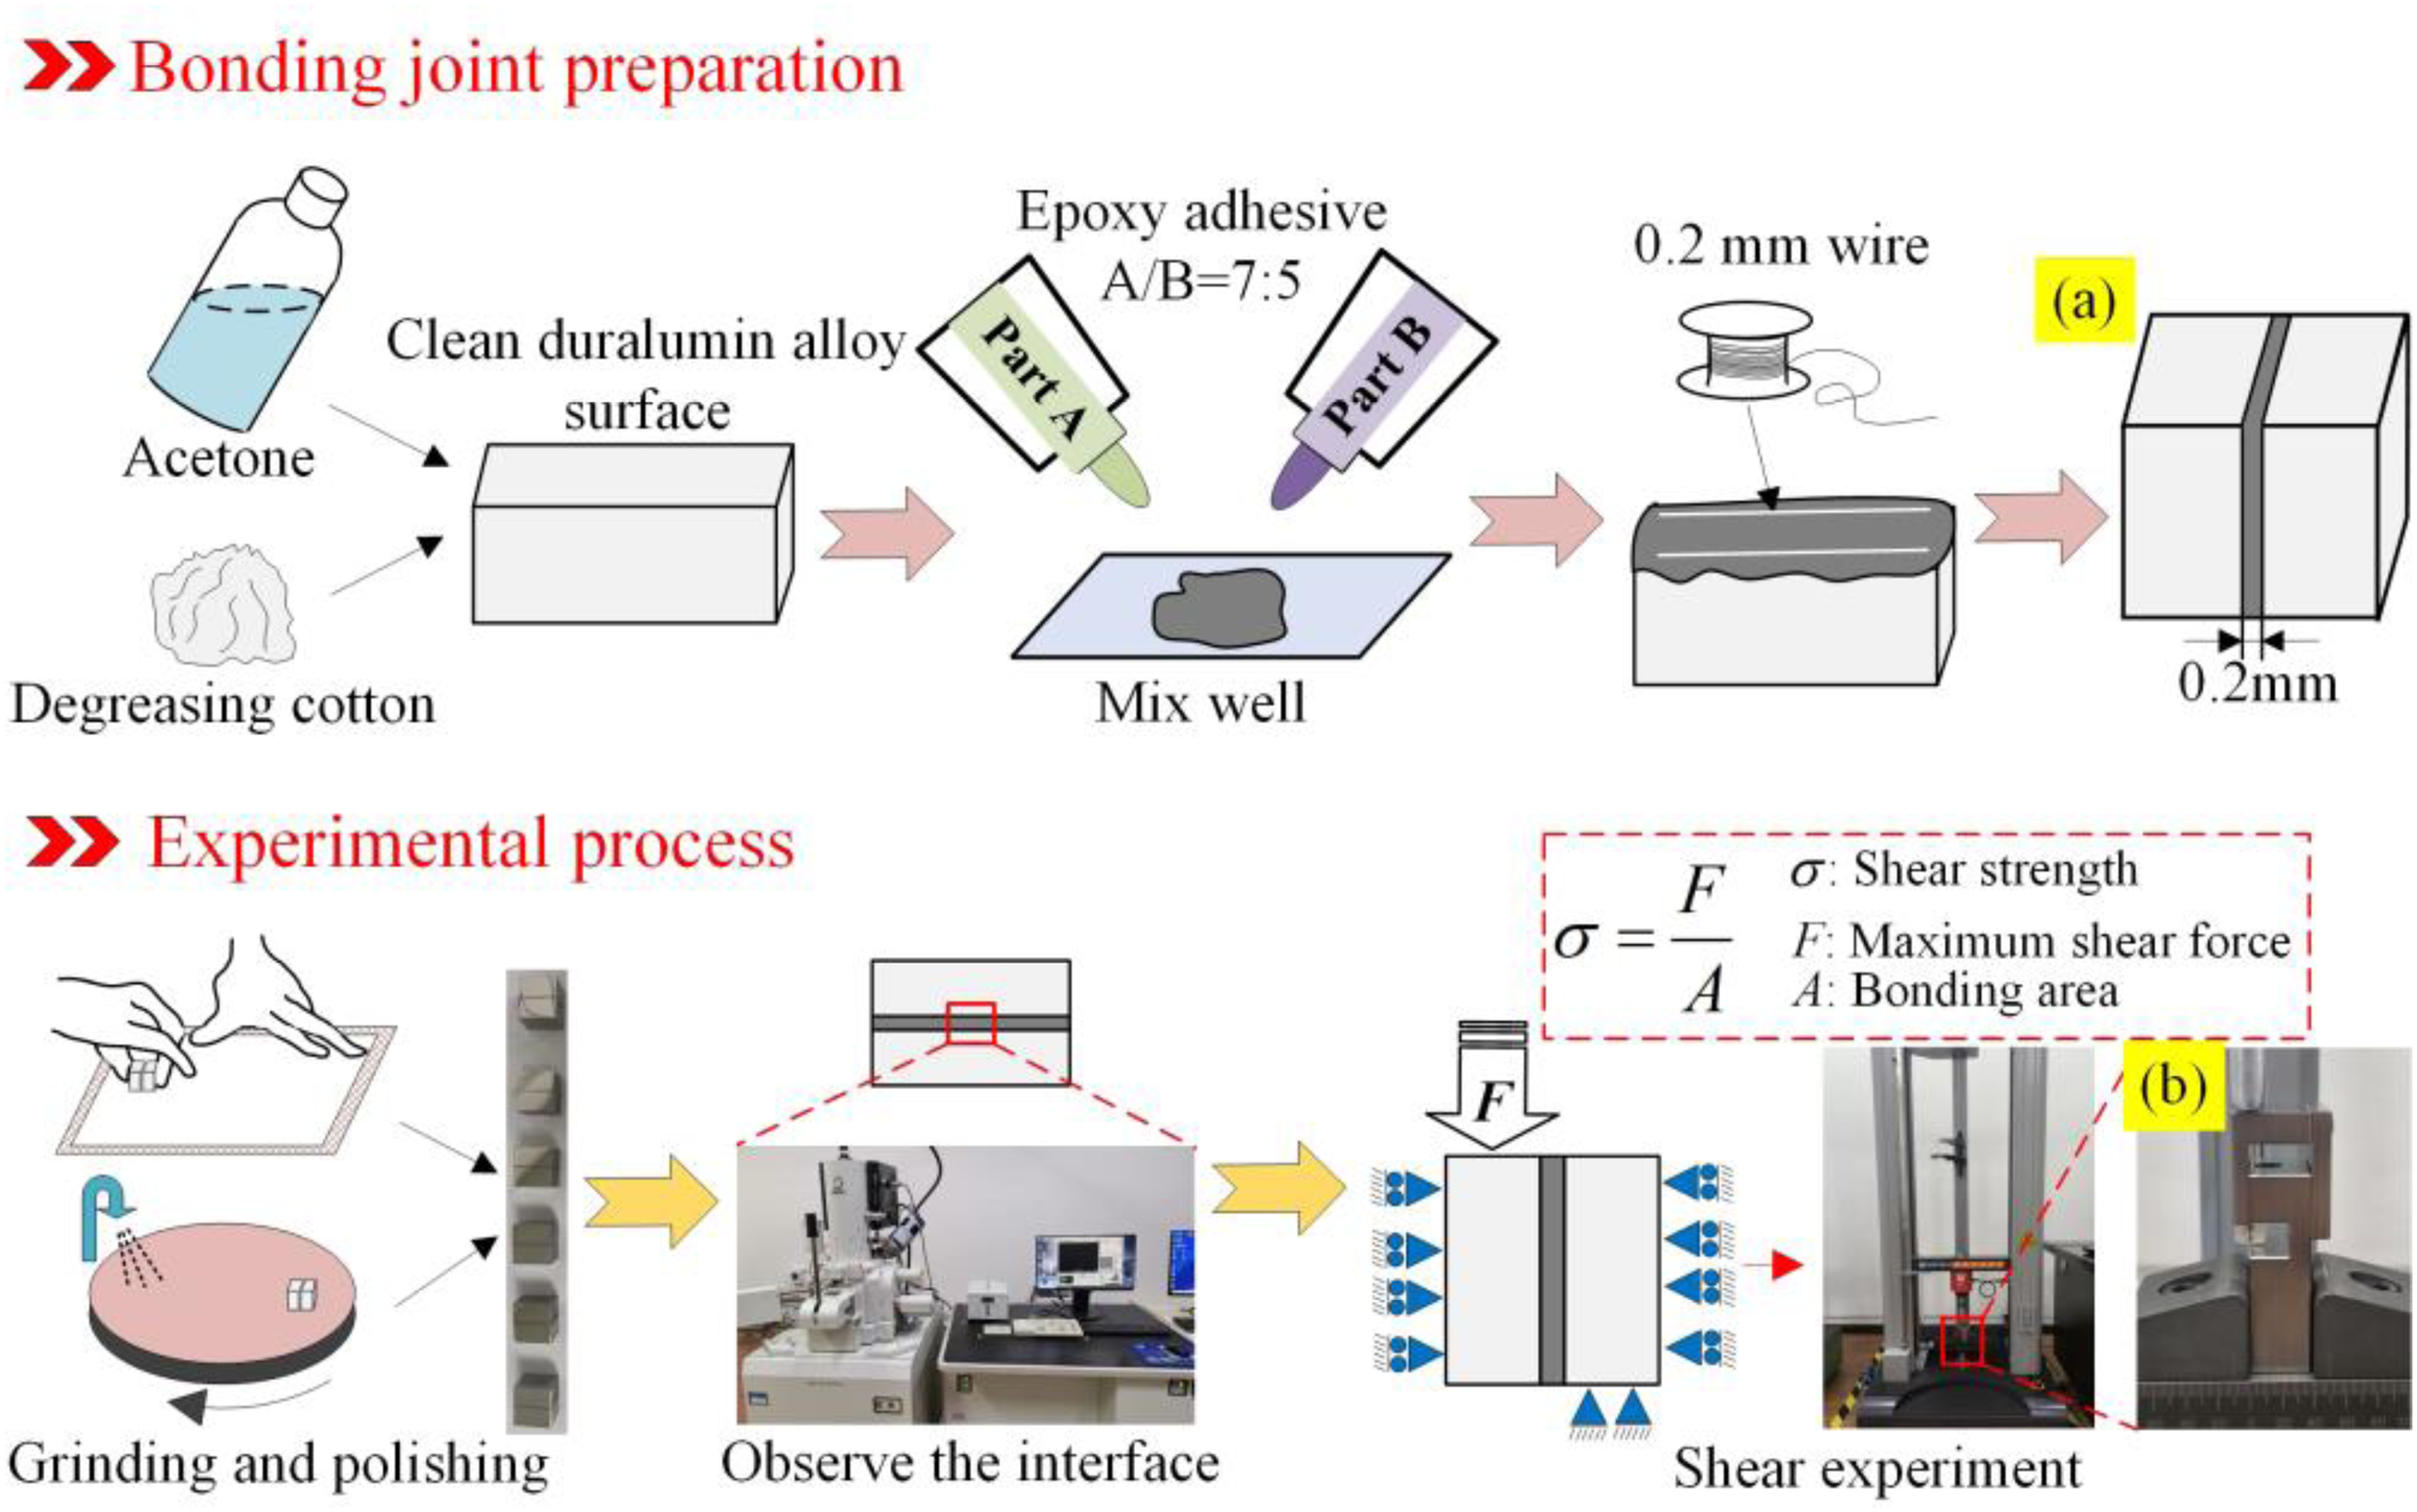
Experimental processes. (a) Adhesive joint and (b) shear clamp.
Bonding strength test
To assess the bonding strength, shear experiments were carried out on aluminum-epoxy adhesive-aluminum alloy joints. A tensile testing machine A1-7000-MU2 (GOTECH, China) was used to test the shear strength. The experiment was performed using the gripper seen in Figure 2(b) and a loading speed of 5 mm/min. The shear strength is acquired based on the highest load, and thus the shear characteristics for different surface roughness are obtained. Three joints were tested for each sample and averaged as the final strength. Optical microscopy was used to obtain the macroscopic crack structure of the sample, and the failure mode was compared and analyzed. A more detailed examination of the fracture surface was carried out using SEM. All experiments were performed at an identical temperature of 25 ± 0.5 °C to guarantee the experiments’ correctness. To ensure the accuracy and reliability of the results, each experiment was conducted in triplicate. Meanwhile, all tests were conducted at 25 ± 0.5 °C to reduce the influence of temperature on the experimental results.
Results discussion
Bonding strength
The shear strength of the bonded joints was determined under the same experimental circumstances, and the results are depicted in Figure 3. Shear strength progressively rises with growing roughness in samples 1, 2, and 3. Samples 2 and 3 increase by about 32% and 52% in bonding strength, respectively. It is essential to note that sample 1 shows the smallest bonding strength of only 5.41 MPa. As the roughness rises in samples 4, 5, and 6, the shear strength progressively drops. Samples 5 and 6 are reduced by about 16% and 21% in bonding strength, respectively. However, the increase in roughness has an essential impact on the enhancement of the quality of the joint, compared with samples 1, 2, and 3. Among them, the shear strength in sample 4 reaches the maximum value of 11.97 MPa, which is increased by 121% compared with the minimum bonding strength. It can be demonstrated that the magnitude of bonding strength has a great correlation with the surface of the substrate with diverse surface roughness. In addition, the correlation between bonding strength and surface roughness is not linear, and too small or too large roughness will affect the bonding performance. The main reasons for this phenomenon will be analyzed in the “Interface analysis” section.

Average shear strength under different roughness.
The one-way analysis of variance (ANOVA) method was used to analyze the effects of six different surface roughness on shear strength. Three samples were used in each group. A one-way ANOVA was performed in Figure 3 and the results are shown in Table 4. Since the F-value (40.95) is greater than the critical value Fcrit (3.106) and the P-value is less than the threshold of .05, the surface roughness has a significant effect on the shear strength.
A one-way analysis of variance (ANOVA) was conducted in Figure 3.
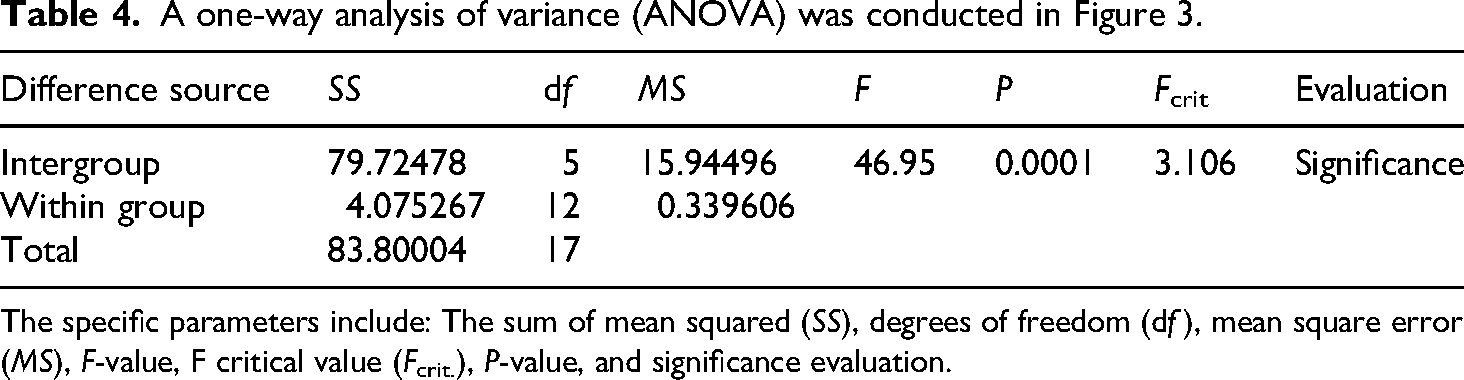
The specific parameters include: The sum of mean squared (SS), degrees of freedom (df), mean square error (MS), F-value, F critical value (Fcrit.), P-value, and significance evaluation.
Surface energy and wettability
The adhesion generated at the interface can enable the adhesive to bond to the base material. 33 According to adsorption theory, intermolecular forces are the main force for bonding, and surface energy is a measure of the interactions between these atoms or molecules. 34 The water contact angle diminishes first and then grows with the enhanced roughness, reaching a minimum value of 56° in sample 4, as displayed in Figure 4(a). The diiodomethane contact angle decreases from 46.25° to 31° and then increases to 43.25°, as shown in Figure 4(b). The contact angle of water and diiodomethane showed the same trend on the substrate, both of which decreased first and then increased. Substituting the above results into the equation in the “Wettability and surface energy” section to calculate the surface energy, the consequence is shown in Figure 5. It is apparent that the surface energy first rises and subsequently falls with the increase in roughness, reaching the maximum value of 49.7 mJ/m2 in sample 4. The enhanced surface energy means that the intermolecular forces are more pronounced. Combined with Figure 3, it can be noted that their curves show the same trend, and the sample with the highest bonding strength also has the greatest surface energy. As a result, the substrate's surface energy changes in response to changes in surface roughness.

Contact angle of substrates with different roughness. (a) Water and (b) Diiodomethane.

Surface energy of substrates with different roughness.
Wetting is a prerequisite for the formation of the bonding action. The wettability of the adhesive can be assessed more accurately by testing its contact angle. The contact angle before curing revealed a tendency of first growth and then decline except for sample 4, as shown in Figure 6. It can be noticed that the contact angle before curing is significantly reduced to 78.5° in sample 4, which is relevant to the uniformity of the roughness. After curing, the contact angle tended first to drop and then grow, reaching a minimum value of 41.5° in sample 4. At this time, the wettability is optimal because the adhesive has more contact area with the substrate. Therefore, this sample has the optimal shear strength. However, the contact angle after curing becomes larger, and the wettability deteriorates as the roughness increases further.
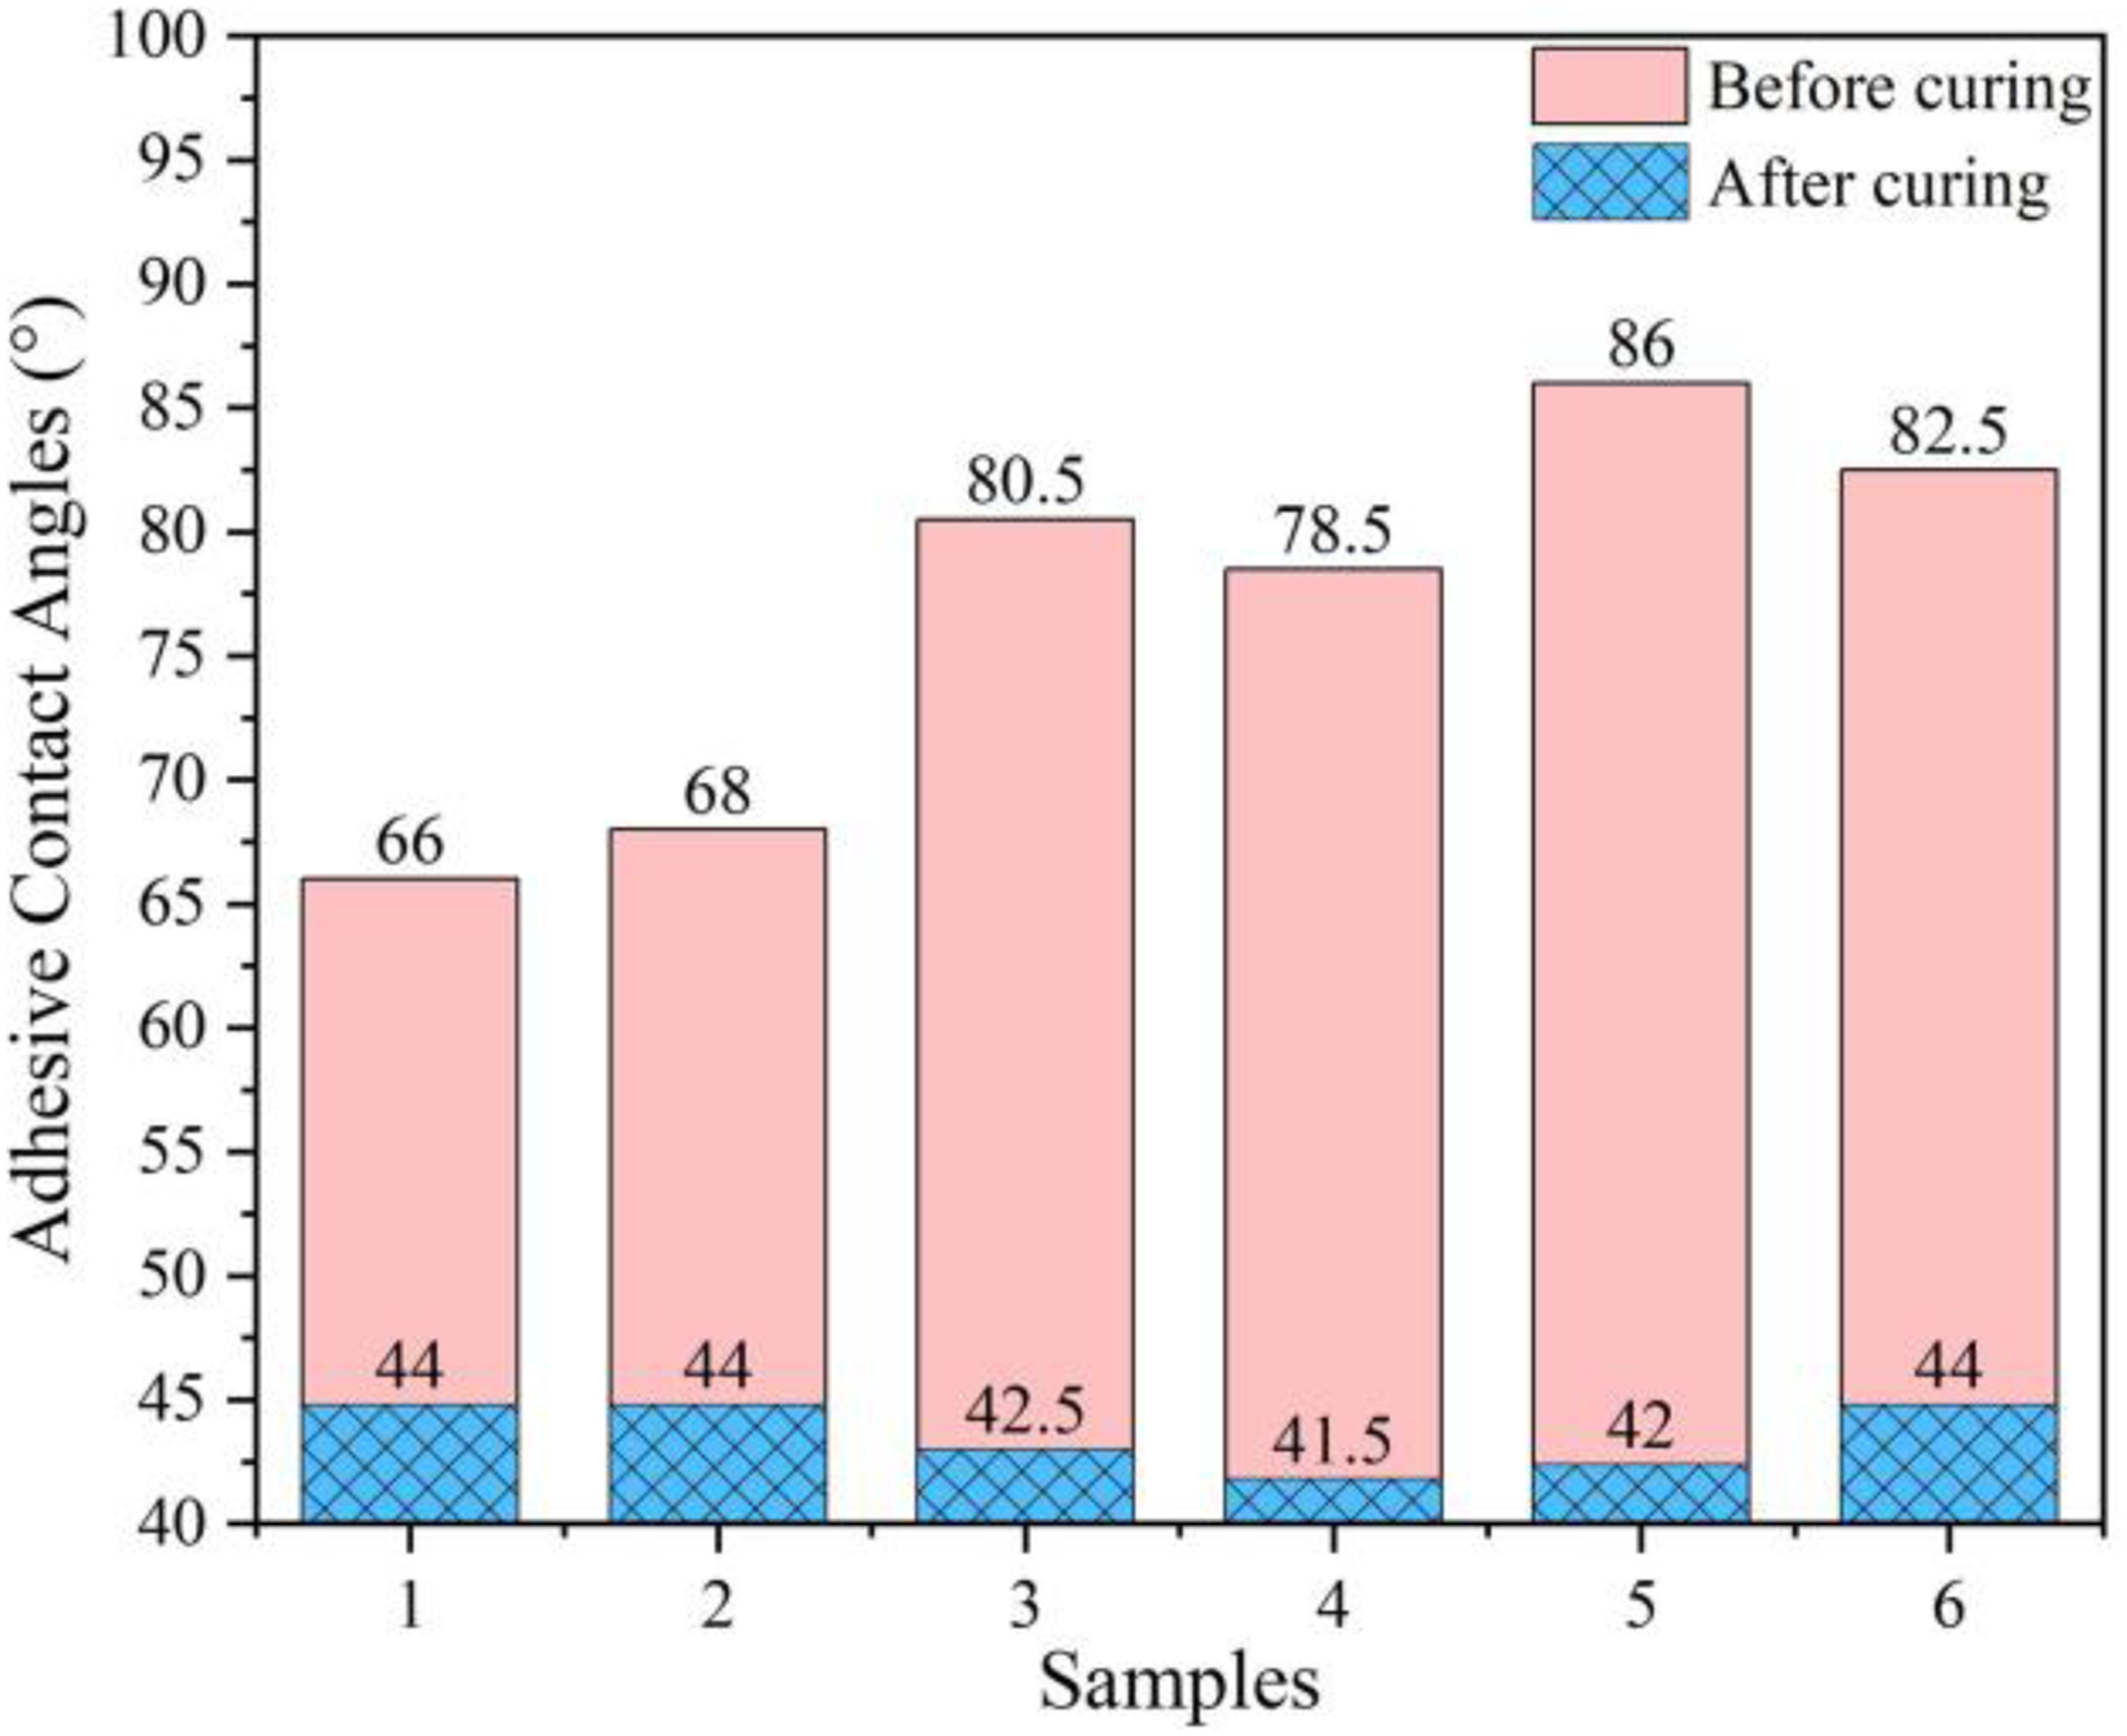
Adhesive contact angle with different roughness.
Figure 7 is an explanation of the wettability. When the adhesive is in contact with the substrate before curing, the roughness of the substrate will reduce the contact region between the base material and the adhesive, compared to the smoother surface, as shown in Figure 7(a) and (b). When the adhesive is cured, the rough surface will reduce the angle of contact between the adhesive and the base material, compared to the smooth surface. Due to the fluidity of the adhesive during the solidification process, it can fill the surface of the substrate, resulting in a decrease in contact angle, as depicted in Figure 7(c) and (d). However, when the roughness elevates to a certain level, the adhesive will not be able to fully contact the substrate due to the force of the adhesive itself, as shown in Figure 7(e). And in the upper right corner of Figure 7(e), it is obvious that there are voids in the enlarged image. As a result, the contact angle increases as the roughness continues to increase. These results revealed that the wettability of duralumin alloy substrates is not the same depending on the roughness.

State of adhesive on substrates. (a) Before curing and small roughness. (b) Before curing and proper roughness. (c) After curing and small roughness. (d) After curing and proper roughness. (e) After curing and large roughness.
Interface analysis
Figure 8(a)–(c) shows the 3D surface topography of the aluminum matrix of samples 1–3. The surface of the aluminum matrix can be found to have grooves due to the grinding process as the surface roughness increases, and the bumps and pits increase accordingly. The presence of this surface property increases the attachment path of the liquid, which makes it easier for the liquid to fully contact the aluminum matrix, ultimately reducing the contact angle (see Figure 4). To better observe and analyze the joint interface, the cross-section of the bonded sample was polished. The adhesive interfaces of different samples were characterized by SEM testing. The microscopic morphology of the bonding interface of samples 1–3 is shown in Figure 8(a1)–(c2). No visible defects can be found at the bond interface, and the adhesive and substrate are in close contact with the substrate and have no defects in the interfacial bonding. There is an obvious dividing line at the bonding interface of sample 1, and the dividing line is approximately a straight line. The epoxy adhesive and the aluminum matrix do not form an obvious mechanical locking structure, as shown in Figure 8(a1) and (a2). As the surface roughness increases, the contact lines of samples 2 and 3 appear as wavy lines due to the presence of grooves bumps, and pits on the surface of the substrate, as shown in Figure 8(b1)–(c2). This phenomenon increases the contact area between the substrate and the adhesive. Meanwhile, this suggests that the change in surface topography provides more adhesion paths for epoxy adhesive. The bonding area between the adhesive and the substrate is improved, which is conducive to the formation of a mechanical locking structure. As a result, the bond strength of the sample increases with the increase in surface roughness, as shown in Figure 3.

Three-dimensional (3D) surface topography and joint section topography. (a-a2) Sample 1 (b-b2) sample 2 (c-c2) sample 3.
As the roughness continues to increase, irregular protrusions and depressions appear on the surface of the aluminum matrix, resulting in uneven surface morphology. This hinders the flow and spread of the liquid on the surface of the aluminum matrix, which ultimately prevents the sample surface from being adequately wetted. 35
The bonding interface of sample 4 is shown in Figure 9(a), and the dividing line of the bonding part between duralumin alloy and epoxy adhesive is not obvious compared with Figure 8. Figure 9(a1) is a larger view of Figure 9(a). It can be observed that there are microscopic cracks in the bonding interface in this sample. Figure 9(b) displays the bonding interface of sample 5. The enlarged image is shown in Figure 9(b1). Large cracks can be observed at the bonding interface, which is relatively obvious compared to sample 4. However, the largest crack can be observed in sample 6 compared to the other samples, as shown in Figure 9(c) and enlarged in Figure 9(c1). Combined with Figure 3, this phenomenon is detrimental to improving the bonding strength. This is because the roughness is too large, resulting in a gradual deepening of the grooves on the base material. The adhesive is unable to fully contact the substrate due to its cohesion, as depicted in Figure 7(e). This situation becomes more pronounced after sample 4 and affects the ability of the bonded part to sustain the load.
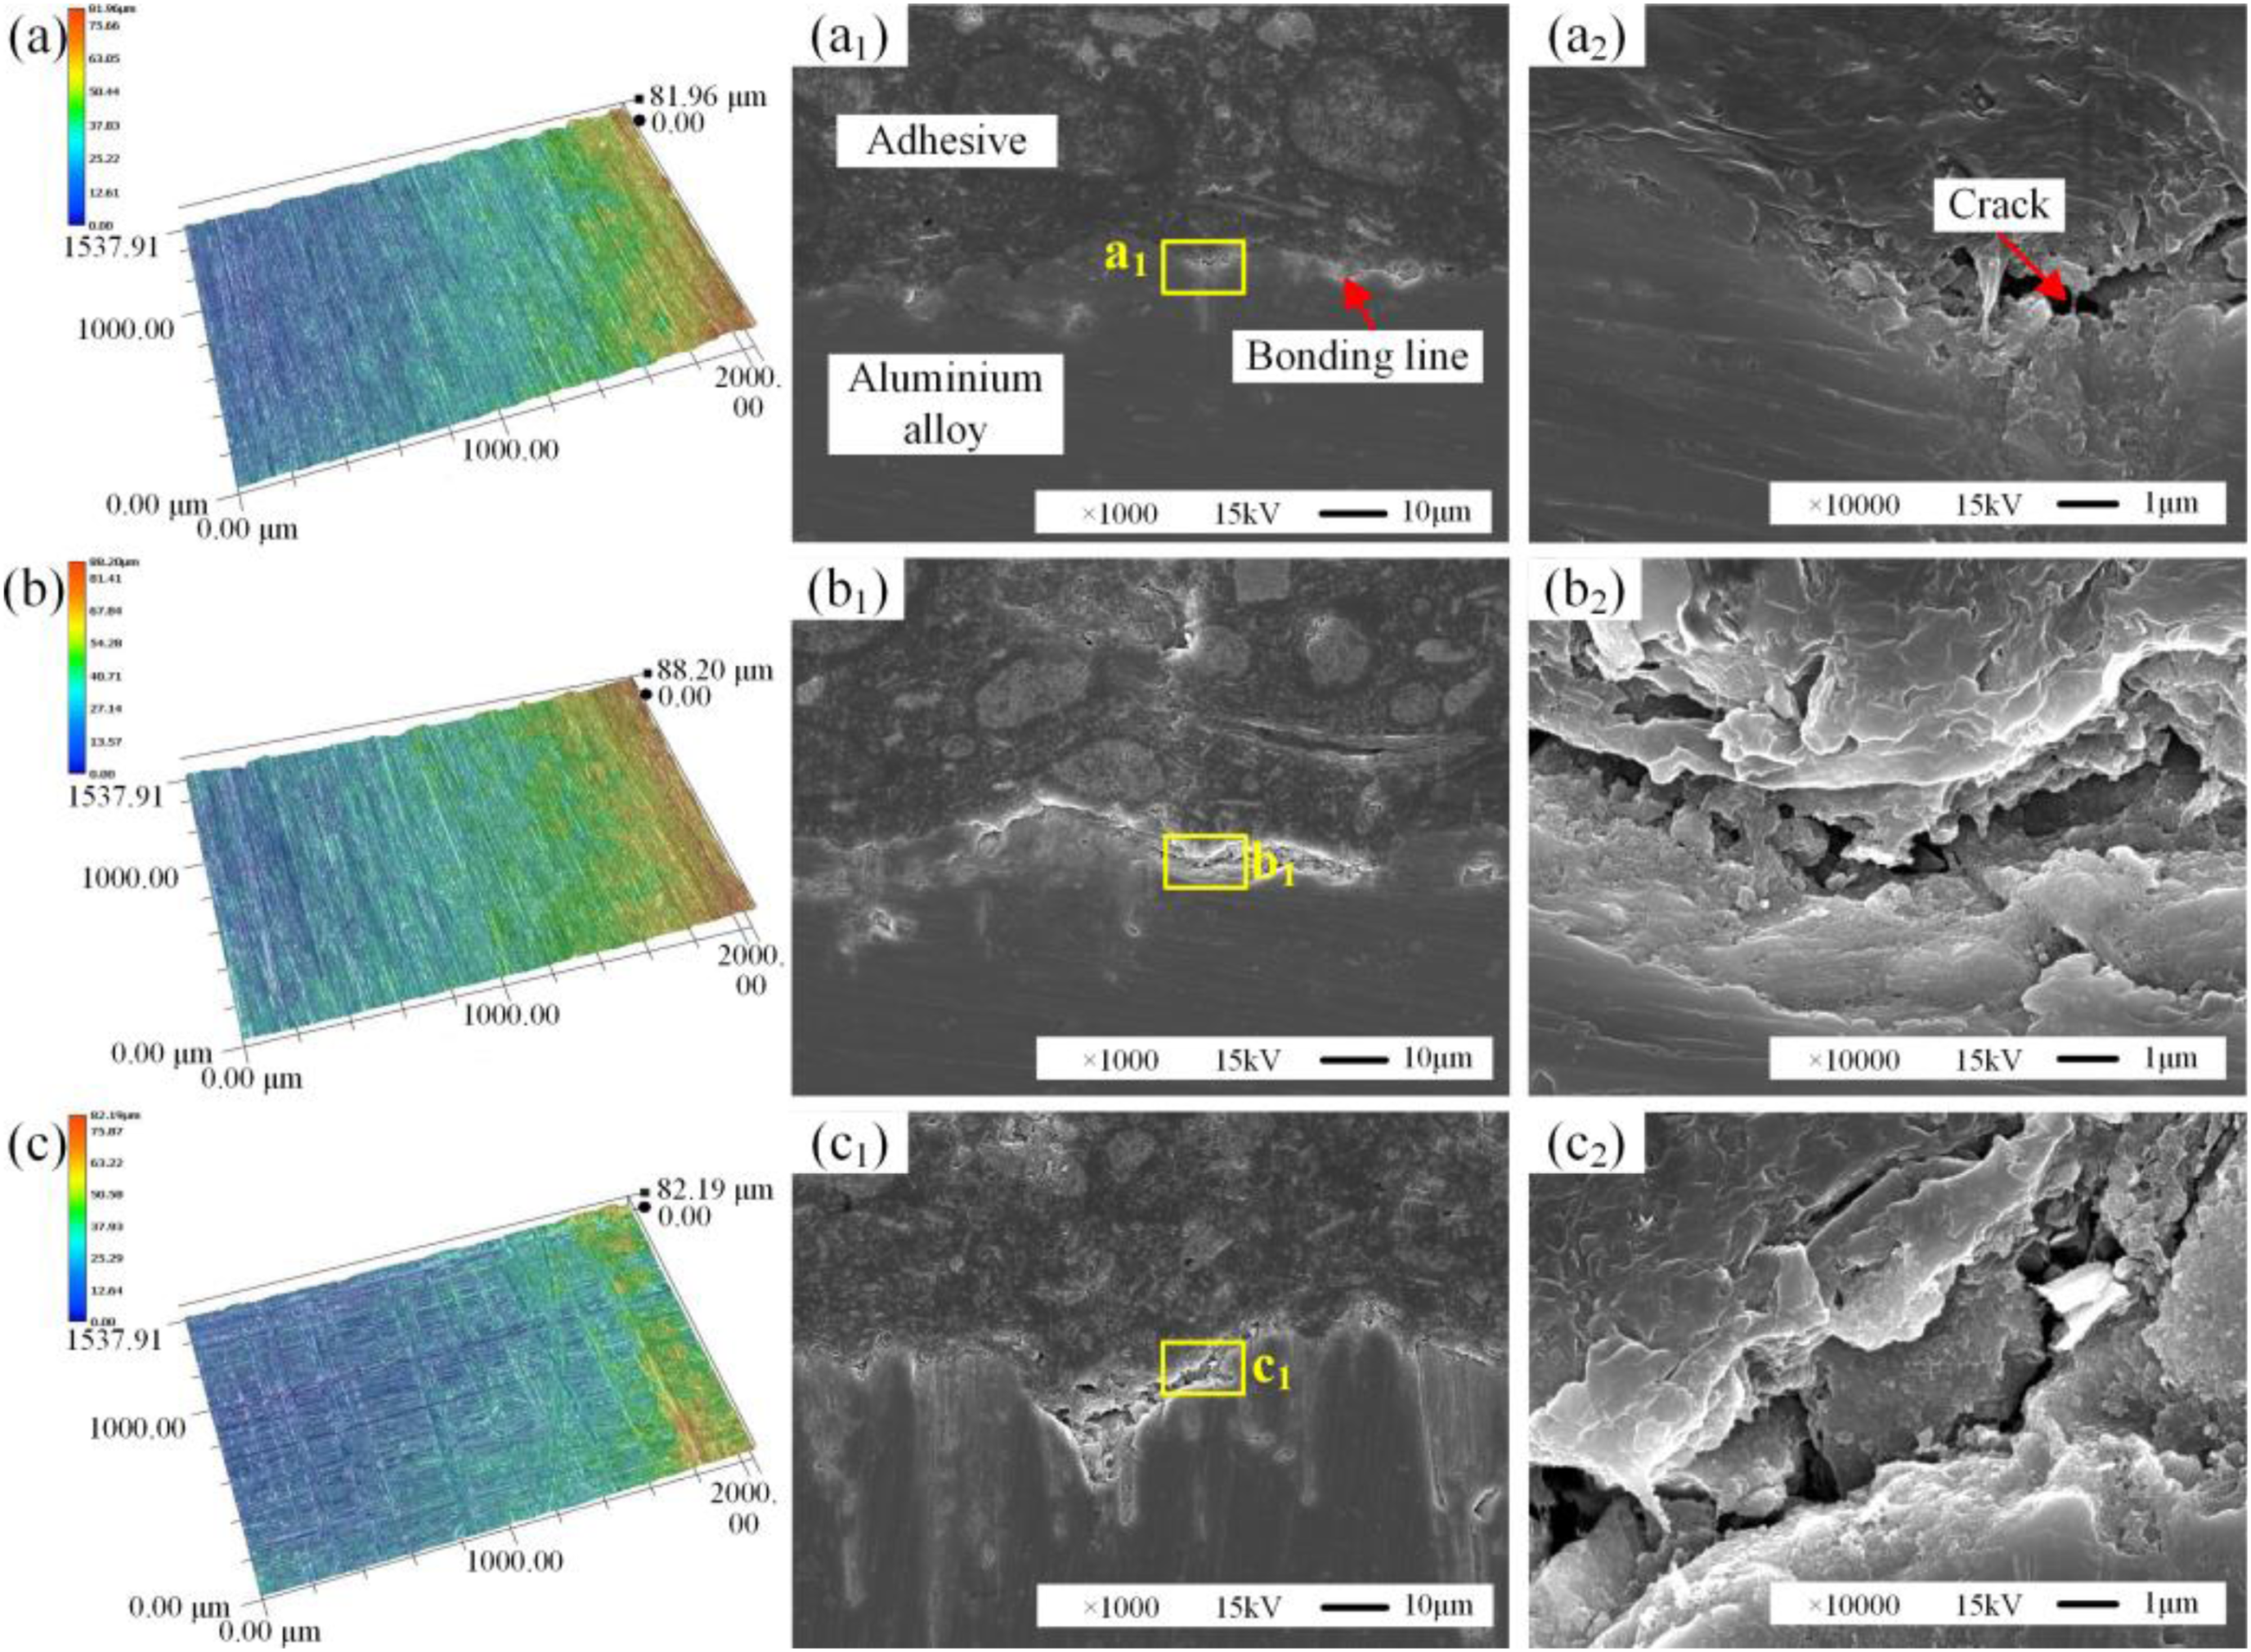
Three-dimensional (3D) surface topography and joint section topography. (a-a2) Sample 4 (b-b2) sample 5 (c-c2) sample 6.
It is evident from the study above that an appropriately rough surface has a positive influence on improving the bonding quality. A lower surface roughness (Ra < 3.4 μm) cannot allow the aluminum matrix to form a sufficient number of mechanical interlocks with the epoxy adhesive. A higher surface roughness (Ra > 9.5 μm) affects the bonding degree between the aluminum matrix and the epoxy adhesive. Both of these have a negative impact on the bonding quality. Therefore, manufacturing a suitable surface roughness is a critical step when it comes to improving bond strength.
Fracture failure analysis
For further study of the failure characteristics, several typical macroscopic failure morphologies were chosen for examination, as seen in Figure 10. The macroscopic fracture topography of sample 3 is seen in Figure 10(a). It can be observed that the entire epoxy adhesive is detached from the substrate. It is worth noting that both sample 1 and sample 2 exhibit similar fracture morphology to sample 3. This indicates that most of the destruction occurs at the bonding line between the substrate and the adhesive. It was also confirmed that the weak interfacial behavior at this roughness led to the low bonding quality of the epoxy adhesive and the duralumin alloy substrate. The adhesion layer of samples 1, 2, and 3 is completely detached from one adhesion surface. However, in samples 4, 5, and 6, the adhesive layer falls off at different adhesion surfaces, as displayed in Figure 10(b), (c), and (d). This means that more adhesion needs to be overcome during the process of the adhesive layer peeling off. As a result, the overall shear strength will be greater than that of samples 1, 2, and 3. However, there is a difference in the degree of fracture damage between them. Among them, a thin layer of adhesive and a thick layer of adhesive can be found in sample 4, as shown in the left picture in Figure 10(b). The thin adhesive layer may exist in the form of a mixed failure. Combined with Figure 3, it can be seen that there is a higher shear strength in this case.

3D and 2D topography of typical samples after fracture (a) sample 3; (b) sample 4; (c) sample 5 and (d) sample 6. 3D: three-dimensional; 2D: two-dimensional
Combined with SEM to find information at the microscopic scale. Figure 11(a) is a microscopic view of the purple box portion of Figure 10(b). To verify that the thin layer adhesive exists in a hybrid form, elemental analysis was performed in Figure 11(a), (b), and (c) present the findings. As can be revealed from the elemental analysis, the presence of numerous carbon elements proves the presence of the adhesive. However, the presence of aluminum can also be found, which proves that there is also a substrate in this part. This phenomenon may be credited to the mechanical locking between the adhesive and the rough substrate, which has been mentioned in other literature. 36 At the thin layer adhesive is a mixed failure that contains both bond layer cohesion failure and interfacial failure, as depicted in Figure 11(d). In addition, it is found that cracks appear in samples 4, 5, and 6 at the fracture layer, as depicted in Figure 11(e), (f), and (g). This is one of the important causes of bond failure.
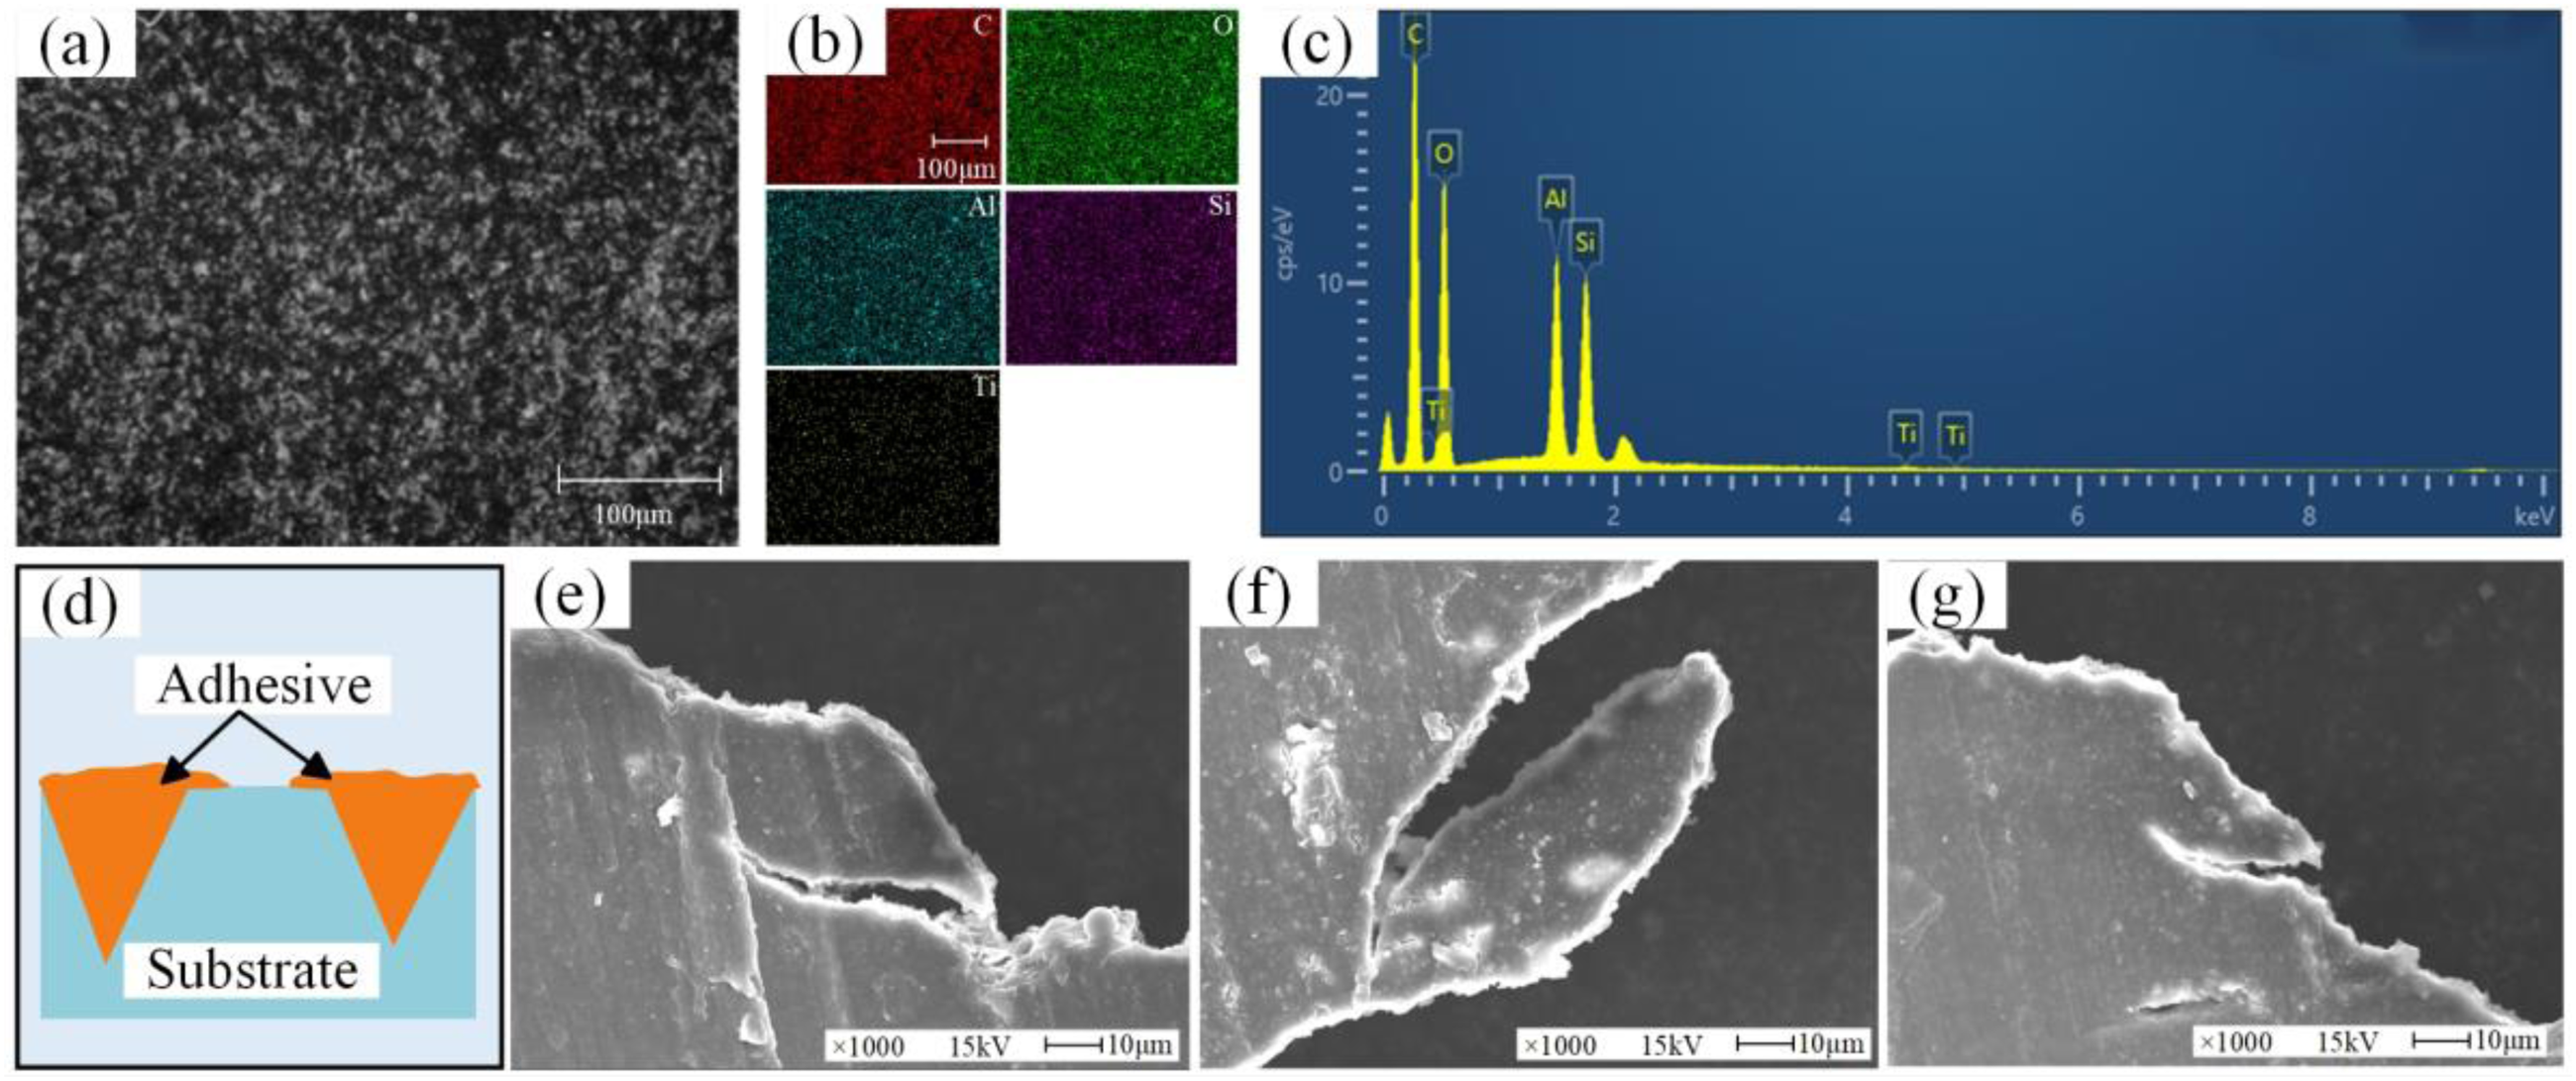
Microscopic characteristic (SEM) and elemental analysis (EDS). (a) Enlarged view of the purple box in Figure 10(b); (b) is the EDS map of (a); (c) is the EDS data of (a); (d) the hybrid interface mechanism diagram at (a); (e) fracture adhesive layer of sample 4, (f) sample 5 and (g) sample 6. SEM: scanning electron microscopy; EDS: energy dispersive x-ray spectroscopy.
Through the above analysis of the fracture morphology, there are two main failure modes in all samples. A schematic diagram of the shear failure process on a sample is shown in Figure 12. Each of the samples 1, 2, and 3 has weak adhesion to the bonding interface layer. Cracks begin at the point of bonding between the adhesive and the base material and then spread throughout the interface. Therefore, an interfacial failure occurs between the base material and the layer of adhesive, and the failure mode is depicted in Figure 12(a). In sample 4, the crack first appears inside the adhesive layer. This demonstrates cohesive failure, which occurs when the adhesive's force is insufficient to overcome the bonding force between the base material and the adhesive. At the same time, some interfacial failures were also observed, which were caused by the transfer of cracks from the adhesive layer to the bonding line of the base material. Interfacial failure appears because the adhesion of the interface is less than the cohesion of the adhesive layer. Therefore, sample 4 is a mixed failure mode with both cohesive and interfacial failures, as shown in Figure 12(c). In samples 5 and 6, the adhesion layer is detached from the different adhesion surfaces. This is another interface failure mode, as shown in Figure 12(b). Compared with detaching the adhesive layer from the same surface, this requires more adhesion to be overcome, resulting in higher shear strength. Through the above analysis of the fracture interface, there are two main failure modes in all specimens: interfacial failure and hybrid failure. In a defect-free adhesive layer, hybrid failure characterized by cohesive failure and interfacial failure has higher mechanical properties than interfacial failure. This is because the presence of a cohesive failure indicates that the load can be effectively transferred to the inside of the adhesive, causing the adhesive itself to break. At this point, the adhesive dissipates more strain energy. 37

Shear schematics and destruction patterns (a) the first interface failure; (b) the second interface failure; (c) hybrid failure.
It is not difficult to find that with the increase in roughness, the failure modes change from adverse bonding to beneficial bonding by comparing the failure modes of different joints. Meanwhile, the damage degree of the interface increases. But it turns into an unfavorable bond when the roughness is too high. As mentioned in the “Bonding strength” section, higher roughness will prevent the adhesive from fully contacting the substrate, thereby reducing the bonding force between the base material and the adhesive.
Conclusion
For the bonding of 2216 epoxy adhesive to 2A12 duralumin alloy, the roughness adjustment of the base material plays an important part in the bonding quality. The relevant conclusions are summarized below:
A suitable surface roughness is the key to improving shear strength. The bonding strength first rises and subsequently falls with the increase in roughness. Sample 4's surface roughness of the duralumin alloy is 4.2 ± 0.75 μm, the shear strength up to its highest value of 11.97 MPa. With the enhanced roughness of the duralumin alloy, the surface energy first increases and then decreases. The wetting angle of the adhesive on the base material decreases first and then increases. It has been proven that different surface roughness treatments can change surface energy and wettability. Suitable roughness can enhance the contact area by the adhesive on the base material, which increases the adhesion of the liquid to the adherend. Too much roughness or too little roughness will weaken the adhesion. The fracture characteristic of the joint changes from interface failure to hybrid failure with the increase in roughness. Among them, the joint has better bonding quality under the mixing failure. However, it can change from a hybrid failure to an interface failure when the roughness increases to a certain level.
Footnotes
Author contributions
Xiangke Zheng contributed to experimental data analysis and writing manuscript. Ning Hu contributed to the conception of the study and structured the manuscript. Dacheng Zhang helped perform the analysis and provided reviews of the manuscript. Zhengshang Da and Linsen Shu performed shear experiments. Zhiguo Li and Xinyu Cang helped perform the analysis.
Funding
The authors disclosed receipt of the following financial support for the research, authorship, and/or publication of this article: The authors were gratefully supported by the National Natural Science Foundation of China (No. 51505268), key project of Chinese Academy of Sciences (No. E25552Z1), key project of Shaanxi province of Qin-chuang-yuan “scientist and engineer” team construction (No. 2023KXJ-123).
Declaration of conflicting interests
The authors declared no potential conflicts of interest with respect to the research, authorship, and/or publication of this article.
Data availability statement
The data that support the findings of this study are available from the corresponding author upon reasonable request.