
Abstract
Shear key joints are commonly used in constructions of precast concrete segmental bridges. Most researches focused on shear performance of the dry joints with the identical-strength concrete, leaving a research gap on that of composite joints between different concrete segments. This research aims to investigate shear behavior of shear key joint between reactive powder concrete and high strength concrete. Totally 12 specimens of single-keyed dry joint were tested, with the parameters of concrete compressive strength, steel fibers, and confining stress. The experimental results indicated that shear failure was observed, but crushing phenomenon occasionally occurred in composite joints in testing, which was confirmed by stress distribution from numerical simulation. In terms of shear capacity of composite joint, peak shear loads of reactive powder concrete specimens without steel fibers were enhanced by 10%–12% as increasing of concrete compressive strength, while those with steel fibers achieved 22%–25% enhancement. Nevertheless, a slight reduction of normalized shear strength was obtained because of its lower volume fraction of coarse aggregate. In numerical simulation, as increasing the concrete compressive strength of convex part, peak shear load was enhanced, but the increment rate of peak shear load decreased. Shear design formulae underestimated shear capacity of reactive powder concrete specimens with steel fibers, but the models proposed by Buyukozturk and Rombach gave accurate predictions on those without steel fibers.
Keywords
Introduction
Precast concrete segmental bridges were widely accepted due to the rapid development of construction technology. The precast segments are usually made of high strength concrete (HSC), thus shear key joints between the adjacent concrete segments are approximately the identical strength. That is identical-strength joint called in this study, as shown in Figure 1. However, the mid-span closure segments are generally cast in place with another concrete like reactive powder concrete (RPC). Consequently, shear key joints between the cast-in-place segments and precast segments are composited of RPC and HSC, which is defined as composite joint in this study.

Illustration of joints between adjacent segments: (a) overall diagram, (b) identical-strength joint, and (c) composite joint.
The mechanical behavior of the identical-strength joint depends on the shear keys in precast concrete segmental bridges. Shear stress transfer leads to the simultaneous appearance of compression stresses in the keys, restraining the appearance of tensile stresses within the keys and increasing their load-carrying capacity. 1 Failure of shear keys, as illustrated in Figure 1, was attributed to the fracture of concrete along the joints.2,3 The crack propagation criteria were proposed which are based on mixed mode of opening and shearing. 4 Another explanation for shear failure was the opening mode of fracture propagation with assumed crack orientation. 5 Nevertheless, shear-keyed joint specimens, subjected to pure bending moment, pure shear force, or a combination of moment and shear, would appear different fracture phenomena. 6 Jointed concrete structures might also be damaged as a result of the tearing model of fracture.7–9
For identical-strength joint, the significant parameters affecting shear behavior were the number of shear key, coating epoxy, prestressing level, concrete materials, and so on. Shear keys provided an improved interlocking performance. Average shear stress transferred across the joint decreased as the keys number increased. 10 Assembling multiple-keyed joints might lead to fitting imperfection. Coating epoxy on the joints could mitigate the imperfection, meanwhile the epoxy enhanced ultimate shear strength. 11 However, epoxied joints performed a more brittle failure than dry joints.11,12 The initial stiffness of epoxied joints did not change as confining stress increased, but the vertical displacement at the peak load increased. 13 Prestressing made an active contribution to shear resistance of shear key joints,14–16 but the contribution of friction in the total shear capacity decreased with an increase in confining pressure. 17
In terms of the concrete materials using in shear key joints, considerable researches have been conducted. In the past, normal strength concrete under 50 MPa was generally used in the bridge construction. Shear capacity was enhanced by 17% as increasing 50% concrete compressive strength of normal strength concrete. 18 Gradually, HSC was increasingly accepted in engineering constructions because of the higher compressive strength and better durability than normal strength concrete. An investigation on HSC in the rang of 50–70 MPa indicated that ultimate loads and normalized ultimate shear stress could be effectively strengthened via the higher concrete strength in terms of single-keyed and three-keyed specimens. 15 Turmo et al. 2 believed that the utilization of steel fiber–reinforced concrete did not provide a higher peak shear load or a higher ductility for the joints in the panel test. However, the opposite results demonstrated that steel fiber reinforcement could not only enhance shear capacity and ductility of specimens but also effectively delay cracking. 16 A numerical investigation on the effect of increasing concrete tensile strength in the range of 7.5%–10% compressive strength found a remarkable improvement on shear capacity and the stiffness of the joints. 13 In recent decades, engineering construction preferred the concrete with ultra-high compressive strength. A research on the concrete compressive strength ranged from 42–118 MPa revealed that shear capacity of the joint increased significantly by increasing strength up to 70 MPa, but the enhancement in shear capacity was not large enough beyond that. 19
RPC, as high strength cement-based composites that achieve high levels of compressive strength, has been introduced as a structural material for bridge engineering applications.20,21 By optimizing packing density of concrete mixture and using highly refined silica fume to improve the microstructure of hydrated cement pastes, RPC performs the advance mechanical and physical properties.22–24 It also helps improve seismic performance by reducing inertia loads, allowing larger deflections, and providing higher energy absorption. 25
Composite joint, whose shear performance remains unknown, probably differs from that of identical strength. Failure of structures with composite joints such as between HSC and lightweight concrete26,27 or between normal strength concrete and ultra-high performance concrete28,29 might tend to occur in the weaker parts. It is crucial to conduct a research on push-off specimens to clarify shear mechanism of composite joint with shear keys by cracking patterns and stress distribution, and figure out the influences on shear capacity.
In this research, composites joints with a shear key between RPC segments and HSC segments were tested by push-off tests. It presented an analysis on shear capacity including peak shear load and normalized shear strength in terms of composite joints. Shear capacities of composite joints were also compared with shear design formulae to validate the prediction accuracy. A numerical model was set up utilizing the finite-element analysis package ABAQUS, versus 6.14, modeling the concrete compressive strength in range of 40–120 MPa. The numerical results would discuss the contribution of compressive strength of the convex and concave parts, respectively, on shear capacity and stress distribution. Based on cracking patterns from experimental tests and stress distribution from numerical simulation, shear mechanism of composite joints was demonstrated.
Experimental investigation
Description of testing
Twelve push-off specimens were tested, which were constructed by two components (concave and convex parts) with a thickness of 100 mm, as illustrated in Figure 2. The concave part of composite joint specimens was first fabricated with HSC and then taking it as a mold to construct the convex part with RPC. The control specimen was also fabricated using HSC in both concave part and convex part.

Experimental specimens’ dimensions of front view (unit: mm).
As listed in Table 1, the nomenclatures of all specimens are generally as S1-Cx-y, where S1 represents the single-keyed dry joint; Cx is the concrete strength identifier of the convex parts, the numeral following C denotes the sequence number of concrete type; the last number y indicates the confining stress acting on a horizontal orientation, including 0.5, 1.0, and 2.0 MPa. For example, S1-C0-0.5 identifies a single-keyed joint specimen, whose convex part is fabricated with C0 concrete, initially acting a horizontal confining stress of 0.5 MPa.
Parameter of specimens.

# in specimens is represented for confining stress, corresponding to 0.5, 1.0, and 2.0 MPa.
To perform a direct shear transferring through the shear key, a typical push-off test setup was designed as illustrated in Figure 3. Vertical load was applied to the convex part of the specimens by a hydraulic jack, which was monitored by a load sensor. The gaps between two segments and the hinge made it possible to allow the convex part slipping down. Besides, the vertical displacement was acquired via two linear variable displacement transducers. The horizontal apparatus with another hydraulic jack provided the initial confining stress, monitored by a digital monitoring device of force.
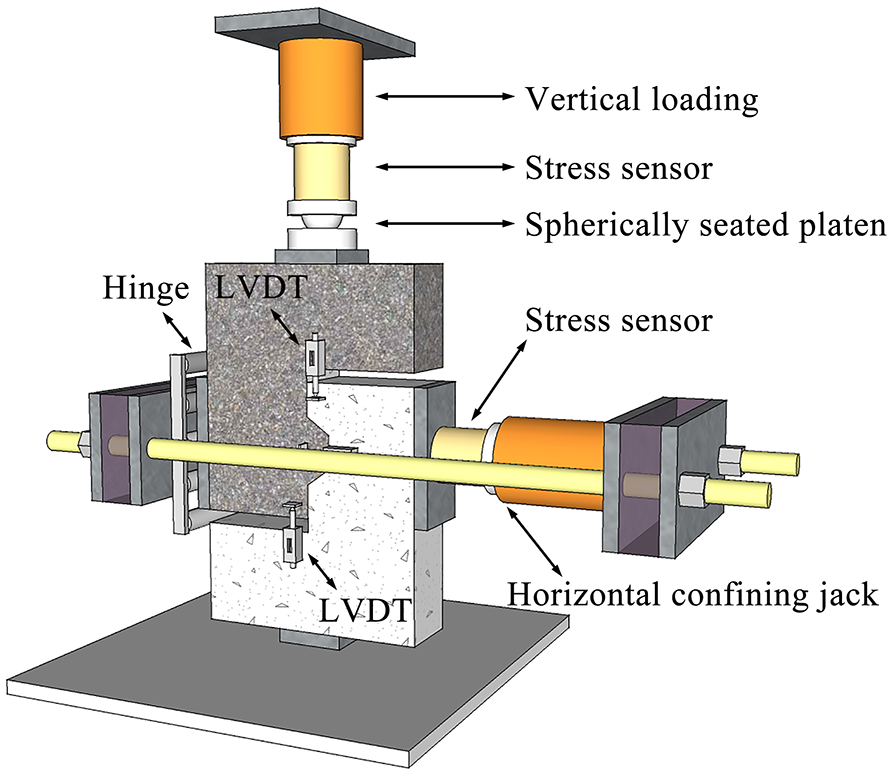
Schematic of test setup and instrumentation (rear view).
Materials properties
Four mixtures are listed in Table 2. C0 concrete is defined as HSC, whose target compressive strength is 65 MPa at 28 days. C1–C3 concretes are adopted as RPC, on account of adding mineral reactive powders. Mineral reactive powders include fly ash from local power plant and silica fume from smelting metal silicon plant. Their chemical constituents are shown in Table 3.
Design mix proportions of concrete.
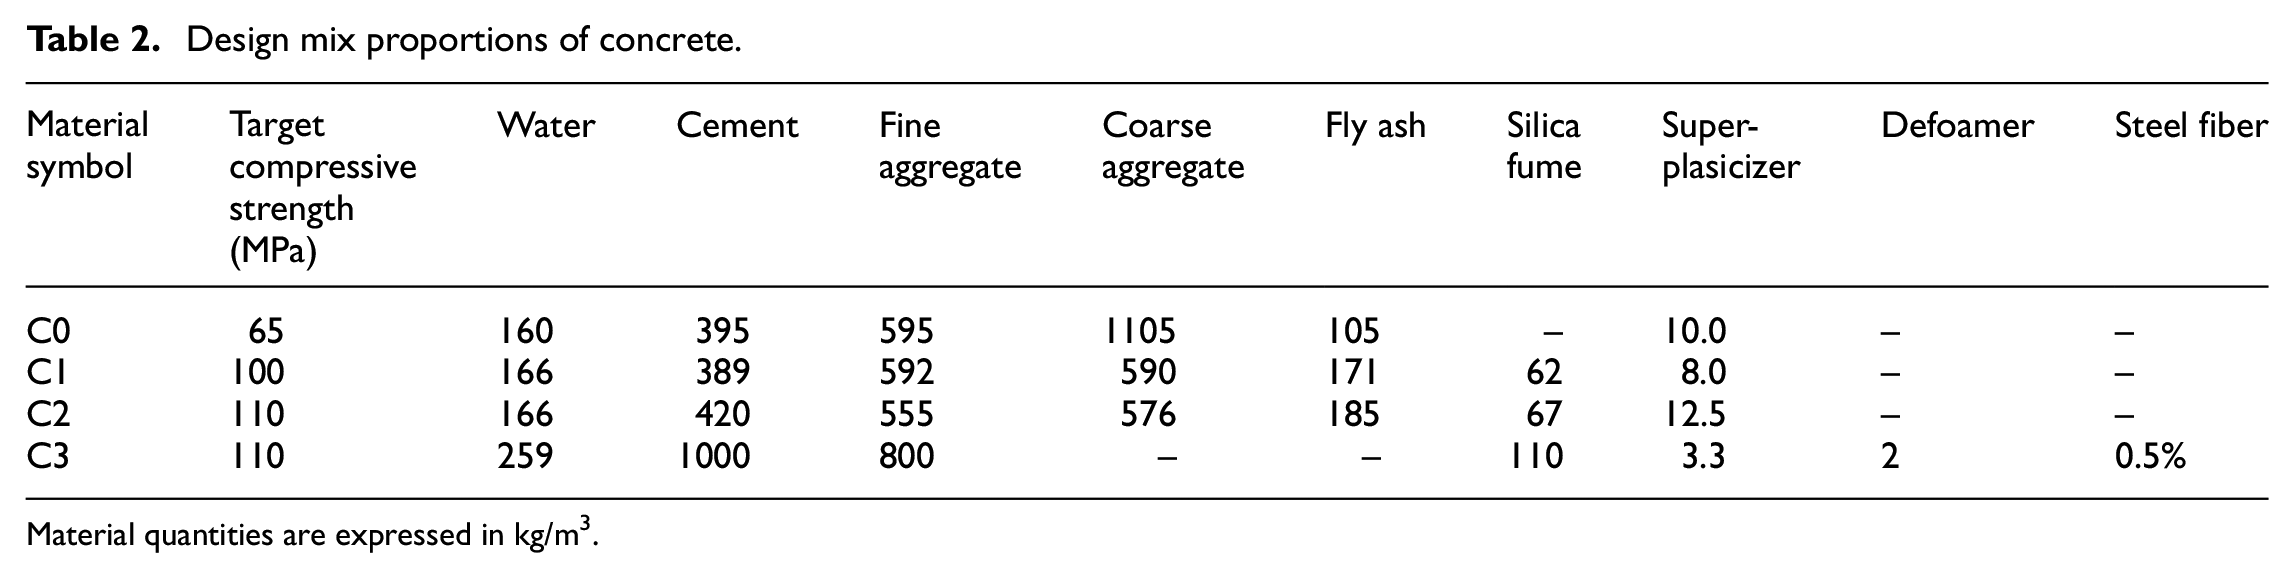
Material quantities are expressed in kg/m3.
Chemical constituents of fly ash and silica fume (%).

For C0 concrete, crushed granitic coarse aggregate with a blended grading of 90% passing a 19-mm sieve and less than 5% passing a 9.5 mm sieve was used. While crushed granitic coarse aggregate with more than 95% passing a 9.5-mm sieve and less than 5% passing a 4.75-mm sieve was chosen for C1 and C2 concretes. Before mixing concrete, all coarse aggregates were washed to remove silt and dust, and then sun-dried. The maximum diameter of fine aggregate was 2 mm, which was sun-dried river sand.
The concave parts of all specimens were fabricated with C0 concrete, while C0-C3 concretes were used in the convex parts. C0 samples were cured with tap water at ambient temperature during the first 7 days, covered by an impermeable plastic film, whereas C1–C3 samples were cured with 70°C water to promote hydration for higher strength. After that, all samples were left outside the laboratory in natural environment until testing.
The testing results of concrete properties were the average value of three standard cylinder specimens each group at 28 days according to ASTM codes. Three specimens were tested for measuring cylinder compressive strength, 30 three for splitting tensile strength, 31 and another three for Young’s modulus and Poisson’s ratio. 32
These testing values are shown in Table 4. As expected, compressive strength of C0 concrete was up to approximately 65 MPa. C1 concrete got a higher compressive strength of about 100 MPa, resulted from adding silica fume and curing by hot water. C2 concrete achieved nearly 10% higher compressive strength up to about 110 MPa than C1 concrete due to its lower water/cement ratio. C3 concrete without coarse aggregate but with considerable cement and fine aggregate got a compressive strength of about 114 MPa, and a highest tensile strength of approximately 7 MPa among the four mixtures due to mixing steel fibers of 0.5% volume fraction.
Mechanical properties of concrete.

To measure the axial strains and lateral strains, the cylinder specimen was installed with two 100-mm-long strain gauges and two 80-mm-long strain gauges at mid-height, respectively. The stress–strain relationships are plotted in Figure 4. C1–C3 concretes performed a similar stiffness, and higher than C0 concrete.
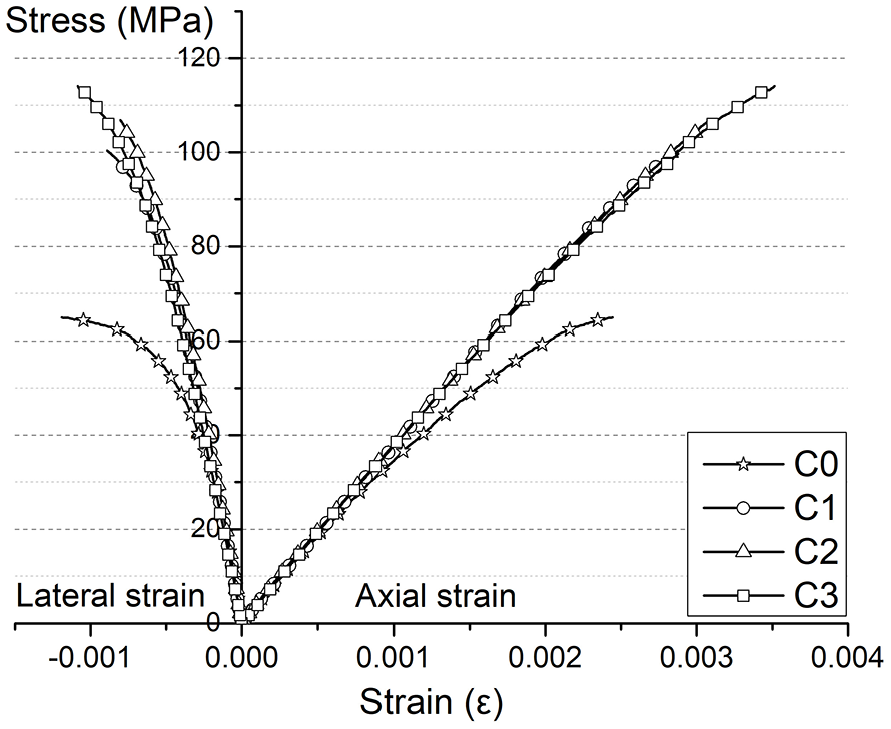
Stress–strain relations of all concrete materials.
Cracking patterns and cracking process zone
Fracture zone
Shear key permits the shear transfer through the joint, similar to the performance of a small plain concrete corbel. As illustrated in Figure 5, a curvilinear crack initiated from the bottom corner of the shear key. And it formed a fracture process zone at the crack tip, at which stress concentration would occur. With shear displacement increasing, the energy dissipation significantly increased, thus the crack followed a curved path to extend rapidly. The crack orientation tended to extend toward a low stress zone, eventually the curvilinear crack stops while releasing little strain energy.

Cracking patterns and cracking process zones.
The wedge crack model reasonably accounted for the formation of the curvilinear crack. 33 This representative crack model was applied to the actual wedging action on the shear key shown in Figure 6. Both the vertical and the horizontal stresses acting on the shear key could be lumped to the edge of the crack. It is assumed that both opening and shearing fracture modes revealed the cracking direction during the initiation and propagation. For the shear key with steel fibers, the fibers across the crack transmitted stress to the separated surface. Hence, the fiber bridging accounts for the inhibition of cracking extension and propagation.

Wedge crack model accounts for the appearance of curvilinear crack.
Shear zone
With further shear loading, a shear zone is formed along the shear key base, where the intensive but short cracks generated. These short cracks would be coalesced because of the high strain distribution in the shear zone as increasing shear load. Eventually, the final shear failure of the key was observed in the shear zone.
For specimens without steel fibers (C0, C1, and C2), aggregates protruded from the cracking interface, thus leading to a micro-roughened contact between aggregate and the matrix, as shown in Figure 7. This aggregate interlock resistance would result in whether these be aggregate fracture, matrix plastic deformation, crack dilatancy, and frictional contact slip. After the failure of the shear key, the interface roughness caused a frictional resistance, while confining stress perpendicular to the interface provided realistic predictions on shear friction.
Aggregate interlock effect in the cracking surface.
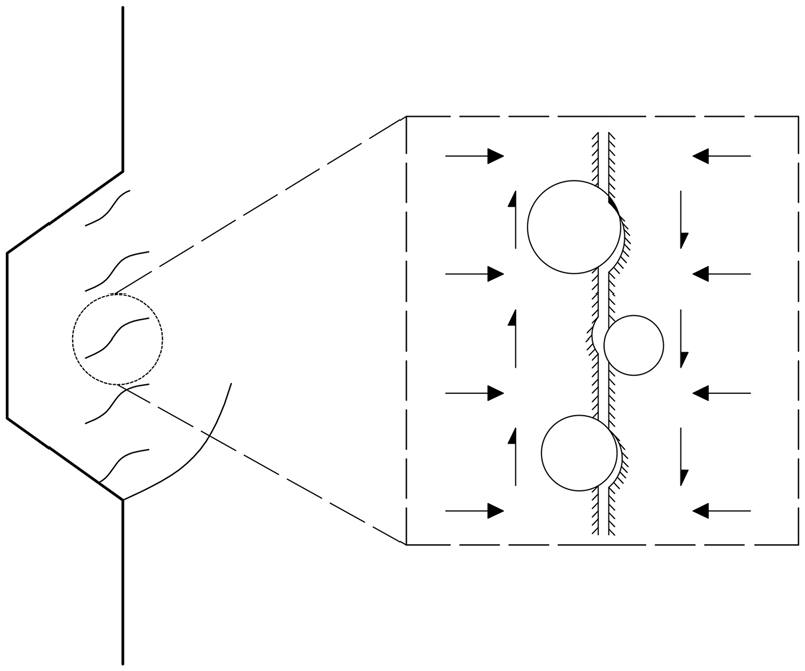
For specimens with steel fibers (C3), the distinct characteristic was that steel fibers performed an additional bridging contribution to resist shear failure. As illustrated in Figure 8, fiber bridging inhibited the propagation of the crack, alleviated the stress concentration at the crack tip, and delayed the shear failure. Following shear failure, the shear resistance became weaker as continuously pulling out of the fibers.

Effect of steel fibers on cracking propagation and stress distribution.
Crushing zone
It is worth noting that a crushing phenomenon in the concave part near the shear key bottom was observed among C1–C3 specimens, as shown in Figure 5. Because concrete compressive strength of the concave part was much lower than that of the convex part. A higher concrete compressive strength of the convex part could significantly enhance shear resistance of specimens. Consequently, shear load transmitted to the shear key bottom might exceed the compressive resistance of the concave part due to its fabrication with a lower compressive strength concrete. However, the crushing phenomenon did not appear in C0 specimens. An acceptable explanation is that both convex and concave parts were fabricated with the identical-strength concrete. Prior to crushing concrete in the concave part, shear key of convex part of C0 specimens could not resist shear load any more.
Shear resistance versus slippage response
Shear response is illustrated by the curve of shear resistance and vertical displacement in Figure 9. The shear resistance was acquired from the force sensor on the top of the specimen. The vertical displacement was the average of the two vertical linear variable displacement transducers. In order to eliminate the effect of concrete compressive strength, shear load is converted into the normalized shear stress, which is defined as the vertical shear load divided by the product of shear plane area and
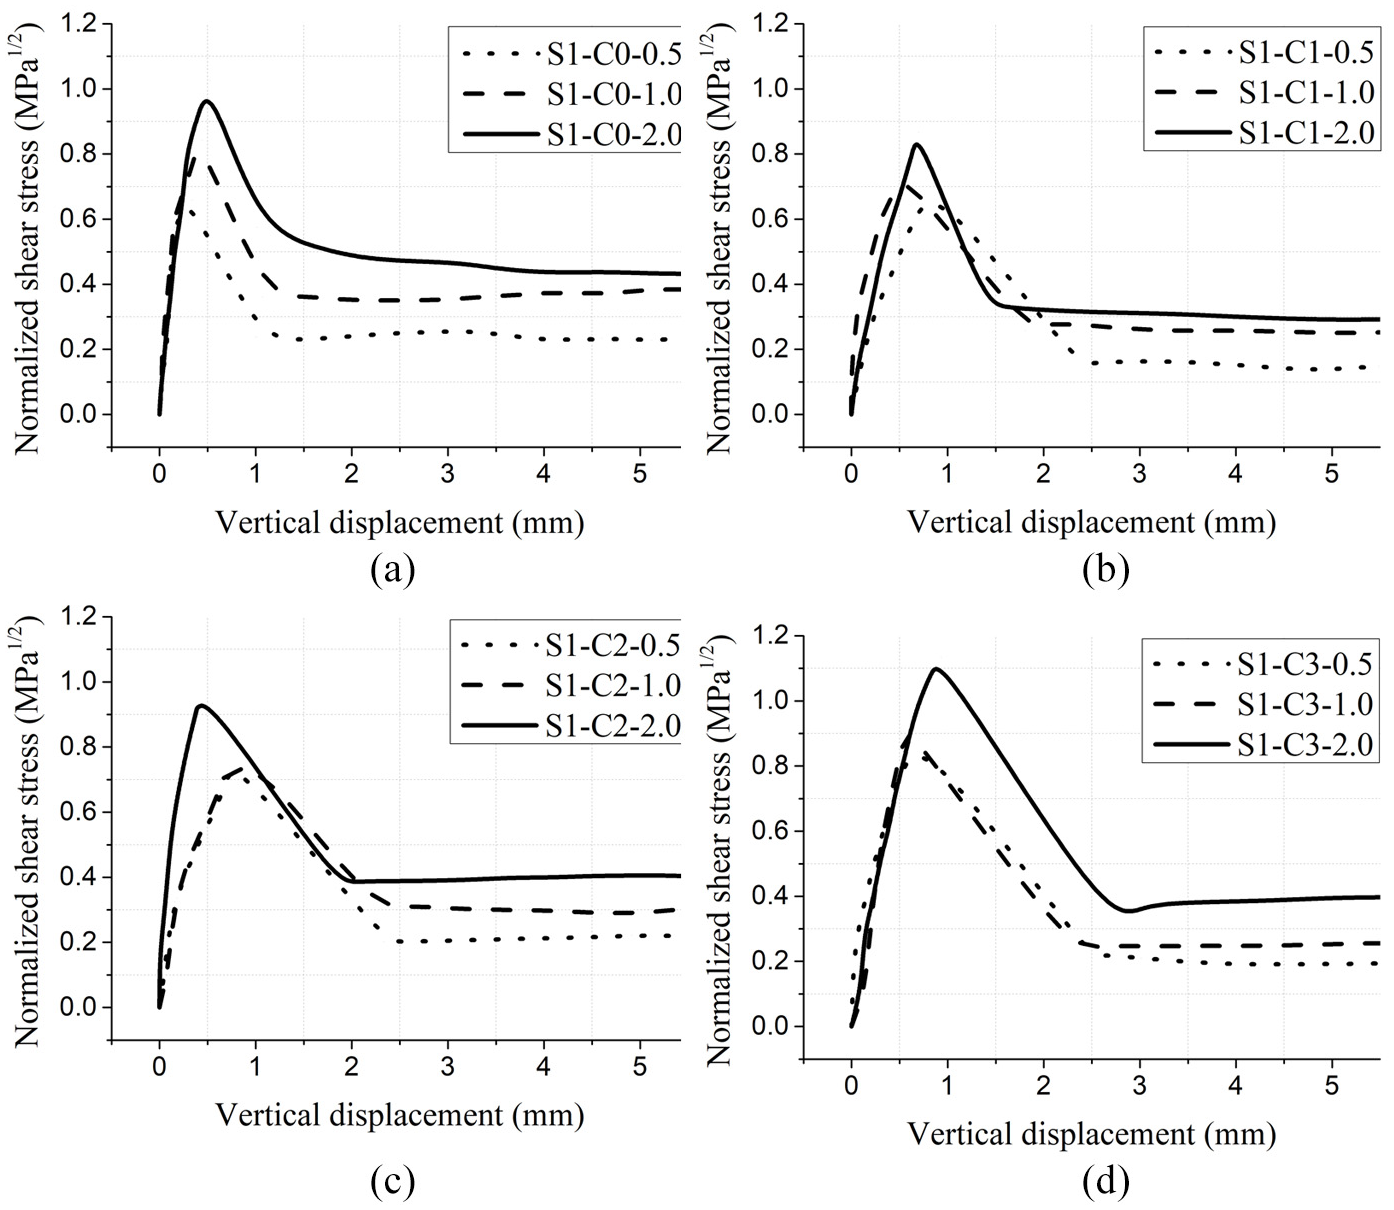
Normalized shear stress–vertical displacement relations.
An approximately straight ascent reached up to the peak, in which the shear key provided shear resistance like a corbel. This straight ascent phase indicates that the stiffness of the specimens remained nearly unchanged before the cracking formation. Although the propagation of the curvilinear crack would cause a decreasing of stiffness, but shear resistance kept rising. In the case of C0 and C3 specimens, they had almost the same inclination in the ascending curves, respectively, irrespective of confining stress level. In terms of C1 and C2 specimens, however, the stiffness performed irregular with different confining stresses in the uncracking phase.
A plunging reduction of shear strength was observed corresponding to the failure of the shear key. Among all specimens, shear failure of C0 specimens took place before the vertical displacement of 0.5 mm, demonstrating the most brittle behavior. C1–C3 specimens performed a larger deformation, whose ductility might be improved by the mineral reactive powders and steel fibers. Then, shear resistance kept constant, which was residually sustained by the friction from the cracked interface, as well aggregate interlock or fibers bridging.
Shear capacity
Both peak shear load and normalized shear strength are important criteria for evaluating shear capacity of key joints in precast concrete segmental bridges. These results are presented in Table 5. In Figure 10, the solid lines illustrate the effect of concrete strength on the peak shear load, while the dash lines represent that on the normalized shear strength.
Shear capacity and confining force of specimens.


Shear load and shear strength influenced by concrete materials.
Peak shear load
Peak shear load was enhanced with an increasing of concrete compressive strength, as well with the enhancing of confining stress. For the cases of RPC without steel fibers, peak shear loads of C1 specimens marked an increase by 6%–8% compared with those of C0 specimens (distinctively, 33% increment under 0.5 MPa). The increments of peak shear load from C1 to C2 specimens were 10% to 12%. One of the important shear mechanism of shear key joint is its support contribution, whose value is positively related with concrete compressive strength. Namely, increasing concrete compressive strength could strengthen the support contribution of shear key.
Regarding RPC with steel fibers, peak shear loads of C3 specimens are 22%–25% higher than that of C2 specimens. Their capacities are mainly controlled by the tensile strength of concrete. C3 concrete obtained a higher splitting tensile strength than C2 concrete, despite both their compressive strength were almost identical. Tensile strength had a significant influence on peak shear load as well, because steel fibers provided the additional shear contribution.
Normalized shear strength
In terms of normalized shear strength, however, it showed a dramatical reduction of shear strength from C0 to C1 specimens under 1.0 and 2.0 MPa, corresponding to 13% and 15% reductions, respectively. It reveals that shear stress per compressive strength might decrease, even though a higher compressive strength concrete was provided. The amount of coarse aggregate might account for the descending shear strength. It is figured out that fracture energy increased as increasing volume fraction of aggregate. 34 It is more likely for C0 specimen to restrain the cracking propagation because its content of coarse aggregate was two times as much as that of C1 specimen.
Conversely, shear strength kept an upward tendency for C1, C2, and C3 specimens. Normalized shear strength of C2 specimens increased by approximately 4%–6% than that of C1 specimens. Significantly, there was a considerable increment exceeding 20% from C2 specimens to C3 specimens, owing to the bridging contribution of steel fiber in C3 specimens.
Prediction accuracy of shear design formulae
Six typical equations for predicting shear capacities of the shear key joints are summarized in Table 6. By means of the regression analysis on test data, Buyukozturk et al. 12 proposed an empirical formula for evaluating shear capacity of shear-key dry joints. The mostly accepted model in AASHTO 35 provisions considered the contribution of both shear keys and friction. Rombach 36 proposed a formula based on a finite-element-analysis research on shear capacity of multiple-keyed joints, considering the friction of the whole surface along the shear key joint. A predicted model using HSC with a compressive strength exceeding 50 MPa was proposed by Turmo et al., 3 considering the characteristic lower bound concrete tensile strength proposed in Eurocode 2. Considering the number of shear key in the joint, shear design formula was modified by Alcalde et al. 10 As a popularized use of ultra-high performance concrete in practice, a derived formula was suggested by Liu et al. 20 to assess the joint fabricated with ultra-high performance concrete.
Typical models for shear capacity of shear key joint.
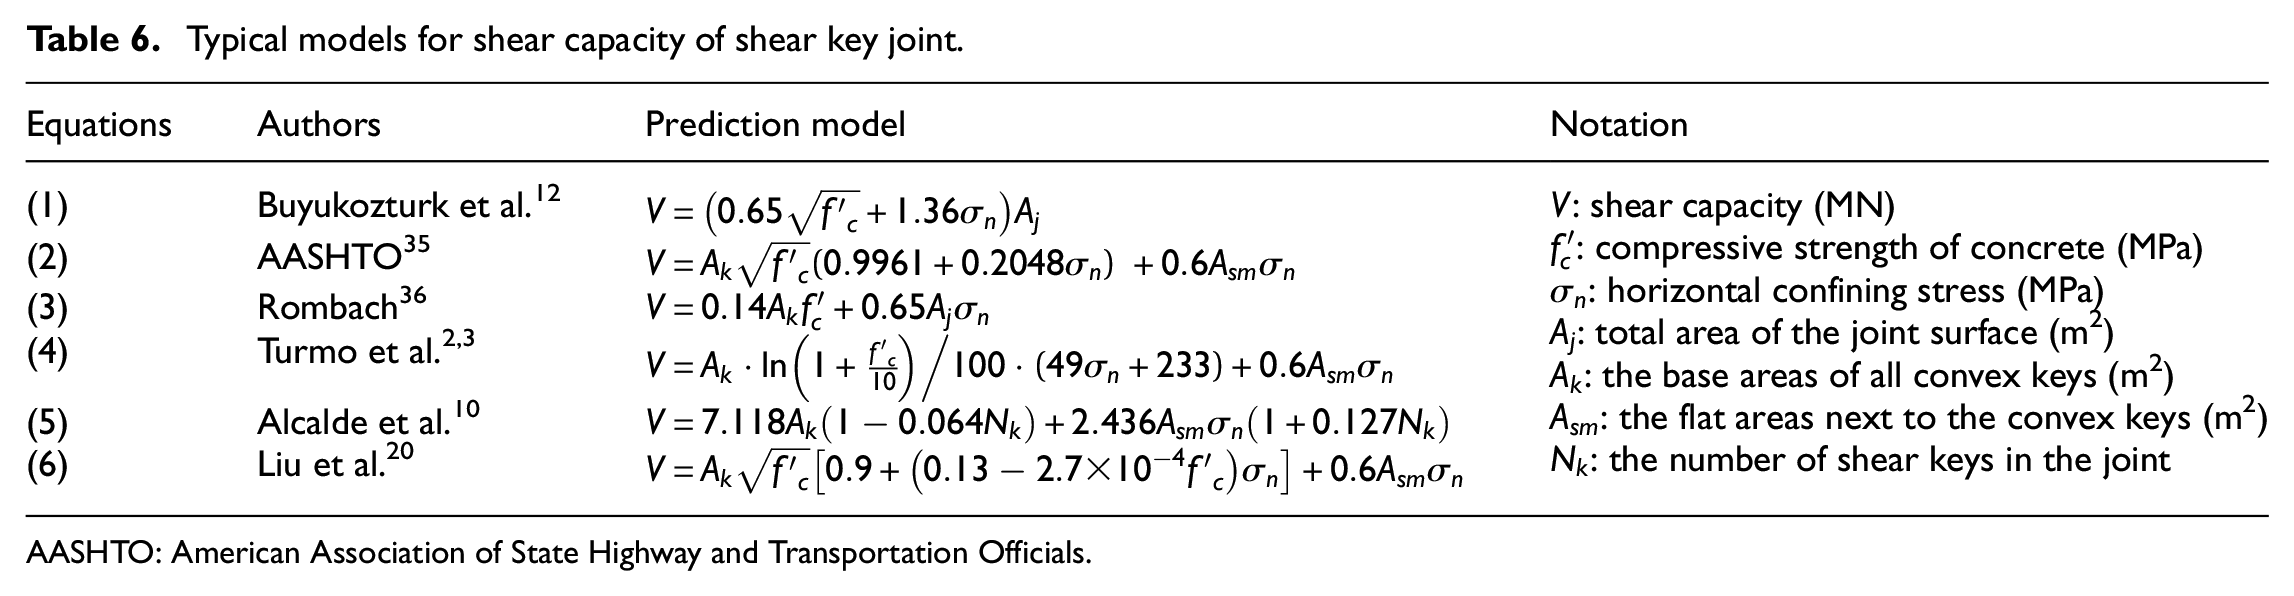
AASHTO: American Association of State Highway and Transportation Officials.
Verification from experimental results
In order to identify the applicability of the previous models, the calculated data by the equations are listed in Table 7. As can be seen from Figure 11, Buyukozturk formula and Rombach formula gave the most accurate predictions on those shear key joint specimens fabricating with RPC without fibers. It can be noted that the ratios of the experimental results to the formula predictions were with the average value of 1.05 and 1.12, and the standard deviation (SD) of 0.12 and 0.16, respectively. The conservative predictions of AASHTO formula, with the mean of 1.30 and SD of 0.15, resulted from that the reliable values of shear capacity are recommended for bridge engineering to ensure safety in design.
Evaluations by the existing design formulae.

SD: standard deviation.
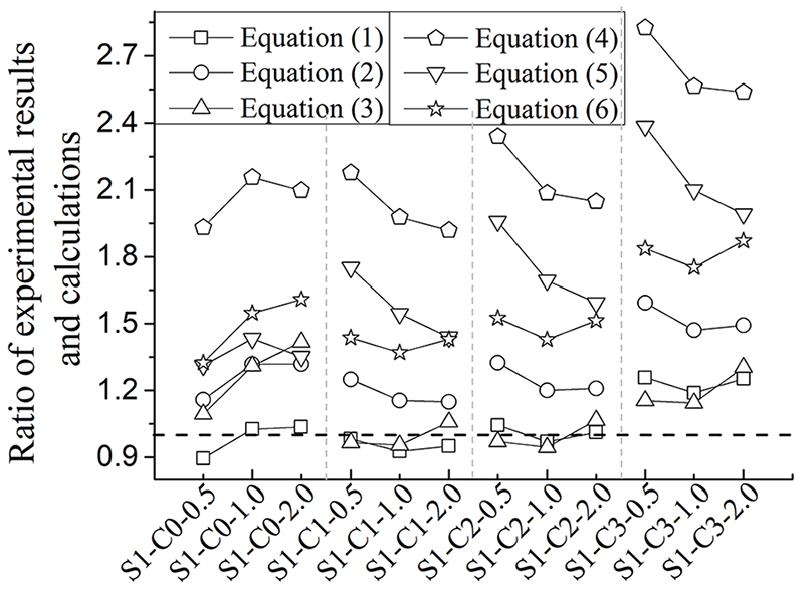
Ratio of experimental results and calculations.
Most importantly, all formulae gave the obviously conservative predictions on C3 specimens, resulting from the neglect of fibers’ contribution on shear capacity. In the past researches on dry joint, the specimens were usually constructed with normal concrete. Those shear design formulae were deduced by mechanical properties of normal concrete, but adding steel fibers into RPC would significantly change its mechanical properties, such as the delayed propagation of cracks due to the bridging contribution of fibers.
Verification from referenced results
Shear capacity of the joint obtained from the literature11,15,16,37 are also compared with these design formulae to validate the prediction accuracy, as illustrated in Figure 12. The open symbol represents for single-keyed dry-joint specimens, while the solid ones for multiple-keyed.

Evaluation of existing shear formulae with related references’ data.
Single-keyed dry joint: Buyukozturk formula gave the best estimation on shear capacity of single-keyed dry joint specimens, whose average ratio was 0.95 and SD 0.13, but showing a slight overestimation. The others underestimated shear capacity with the average ratio in the range of 1.17 and 1.99. The conservative estimations on single-keyed dry joint meant that it is reliable for shear design with an enough safe factor.
Multiple-keyed dry joint: both Rombach formula and Alcalde formula provided the nearly accurate predictions on shear capacity of multiple-keyed dry joint specimens, whose average ratios were 1.04 and 1.03, and SD of 0.21 and 0.24, respectively. Alcalde formula gave the most accurate predictions on both single-keyed and multiple-keyed specimens. The support effect of shear keys would be strengthened as increasing keys number, resulting in a higher shear capacity of the multiple-keyed specimen than the single-keyed ones.
Numerical simulation
Description of the model
In the parametric study, a numerical model was set up utilizing the finite-element analysis package ABAQUS, version 6.14. In order to allow the definition of inelastic behavior of concrete in both compression and tension, the concrete damage plasticity (CDP) model was chosen in this study for simulating concrete cracking. The compressive damage parameter
Information about the numerical model.

CDP: concrete damage plasticity.
In the model, the concrete was simulated with solid element (C3D8R), and the reinforcement was simulated with truss elements (T3D2). The element grid division of specimen used 8-mm fine grid for the shear key and 10-mm coarse grid for the rest of the model. Total number of nodes was 14,128. A surface-to-surface contact interaction was developed, and the hard contact model was chosen to model the contact in the surface normal direction. The friction coefficient between concrete surfaces was assumed as 0.6. It was based on the experimental results 14 and recommendations referring to AASHTO, 35 ACI 318-14, 39 and fib Model Code 2010. 40 The given values were as follow: Jiang et al.: 0.6, AASHTO: 0.6, ACI: 0.6, fib Model Code: 0.5-0.7. The horizontal confining force was modeled with surface pressure, which was exerted on the exterior plane of the specimens.
Calibration of the model
Comparisons of the load–displacement curves
The load–displacement curves of the simulated results and experimental ones are illustrated in Figure 13. The solid lines represent numerical results, while the scattered dots indicate the experimental results. Obviously, the experimental data points were distributed near the simulation curve. In the ascending stage, the acceptable stiffness deviations probably resulted from the neglect of aggregate interlock under shear action. In the descending stage, dropping of the curve also matched the large plastic deformation and material damage. The load–displacement curves predicted by the numerical model coincided with those obtained by the experiments.
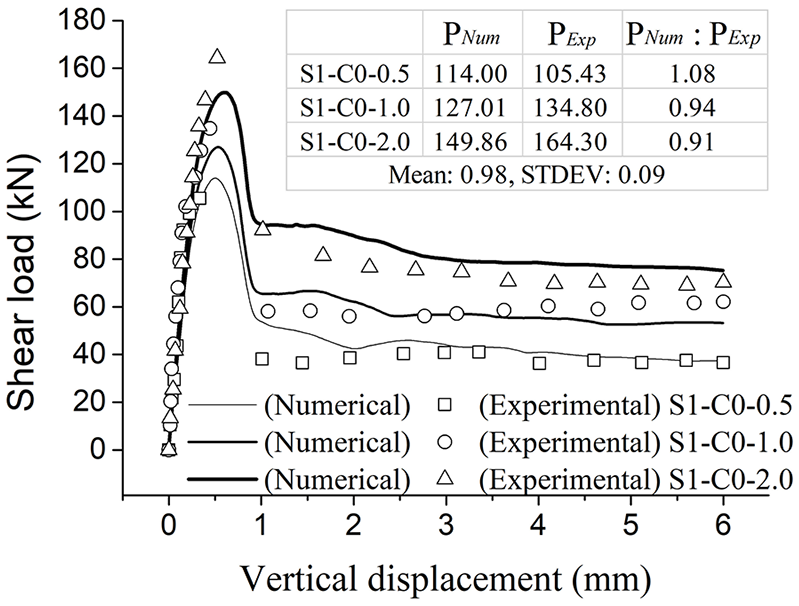
Load–displacement curves of simulated results and experimental ones.
Comparison of peak shear loads
The numerical values of the peak shear load of the single-keyed dry joints are labeled in Figure 13, along with the corresponding experimental values. The average ratio of peak shear load in simulation to experimental ones and the SD were 0.98 and 0.09, respectively. It indicates that the simulations were in good agreement with the tests. Therefore, the model used in the analysis was reliable, and it was generally conservative in predicting the peak shear load of a single-keyed dry joint.
Comparisons of crack propagation
Figure 14 represents the crack propagation of S1-C0-1.0 from the numerical analysis, which demonstrated the cracking patterns in different stages at the applied loads of 95 and 127 kN, respectively. The crack propagations obtained from numerical analysis were highly similar to those observed in the experiments. Comparisons indicate that the cracking pattern depicted by the numerical model could reflect the cracking propagation from experimental tests.

Cracking patterns obtained from experimental test and numerical analysis.
Contribution of concrete compressive strength
To explore the contribution of concrete compressive strength on shear capacity, the concrete compressive strength in range of 40–120 MPa were applied in the convex and concave parts, respectively. The confining stress of 1.0 MPa was chosen. The numerical results of peak shear load and the corresponding stress distribution are presented in figures.
Effect of concrete strength of convex part on shear capacity
As depicted in Figure 15(a), peak shear load achieved a significantly upward trend as increasing the concrete compressive strength of convex part, from approximately 95–160 kN, corresponding to C40–C120 concrete, respectively. As shown in Table 9, concrete compressive strength of convex part showed a positive contribution on peak shear load due to its enhancement on the support contribution of shear key, similar to previous statement on experimental test. The increment rate of peak shear load of C100–C120 was approximately a half of that of C40–C60. Nevertheless, as the concrete compressive strength of convex part increases, the increment rate of peak shear load decreased from about 27 to 10 kN.
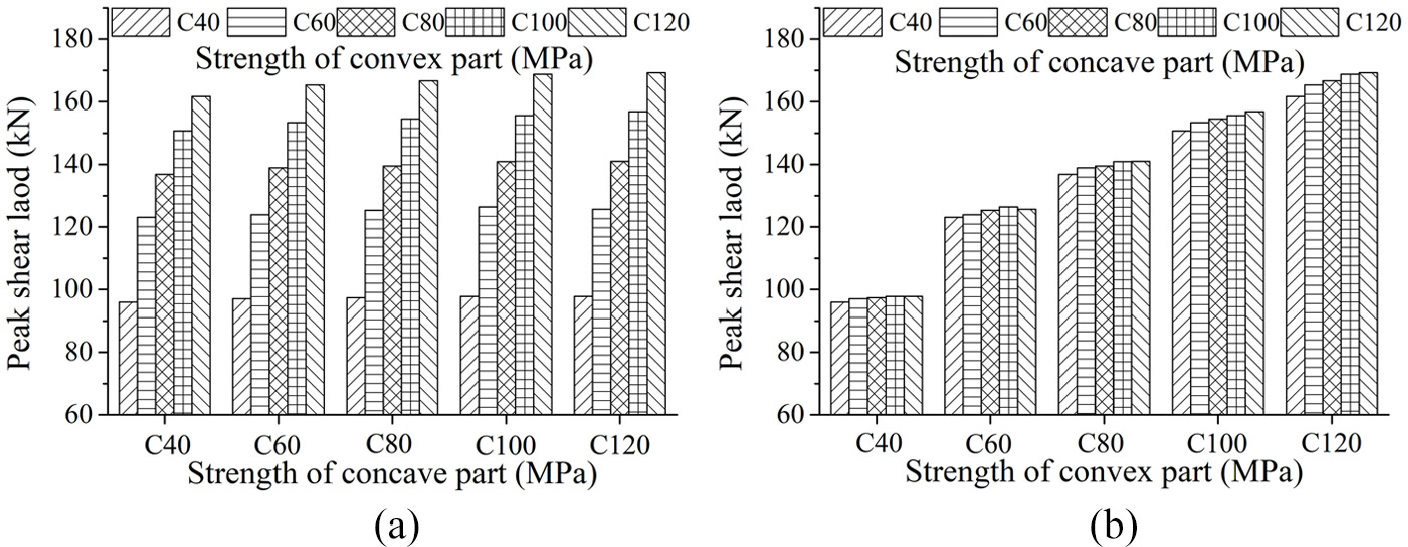
Effect of concrete strength of (a) convex part and (b) concave part.
Increment of peak shear load (kN) while increasing per 20 MPa in the concrete compressive strength.

Effect of concrete strength of concave part on shear capacity
Another purpose of the numerical simulation is to investigate the influence of the concrete in concave part by increasing its compressive strength. As shown in Table 9, a slight increment of peak shear load within 4 kN was observed as increasing the concrete compressive strength of concave part. As depicted in Figure 15(b), the increment of shear capacity was inapparent and negligible. The slight enhancement might be related to the stiffness caused by concrete material. The stiffness would be strengthened because increasing the concrete compressive strength of concave part resulted in a higher elastic modulus, which constrained the deformation of the shear key. The restrained deformation could lead to a slight enhancement on peak shear load.
Effect of concrete strength of convex part on stress distribution
It can be observed from Figure 16(a) when increasing concrete compressive strength of the convex part, the stress on the bottom of shear key increased and its area also expanded, where was defined as crushing zone. Comparing the C40–C120 model (C40 for concave part, C120 for convex part) and C40–C40 model, as compressive strength of the convex part increased, shear resistance was enhanced from approximately 95–160 kN. A higher shear load transferred from the convex part to the concave part, thus stress on the concave bottom significantly increased. This phenomenon usually occurred in the case that concrete compressive strength of convex part was higher than that of the concave part.
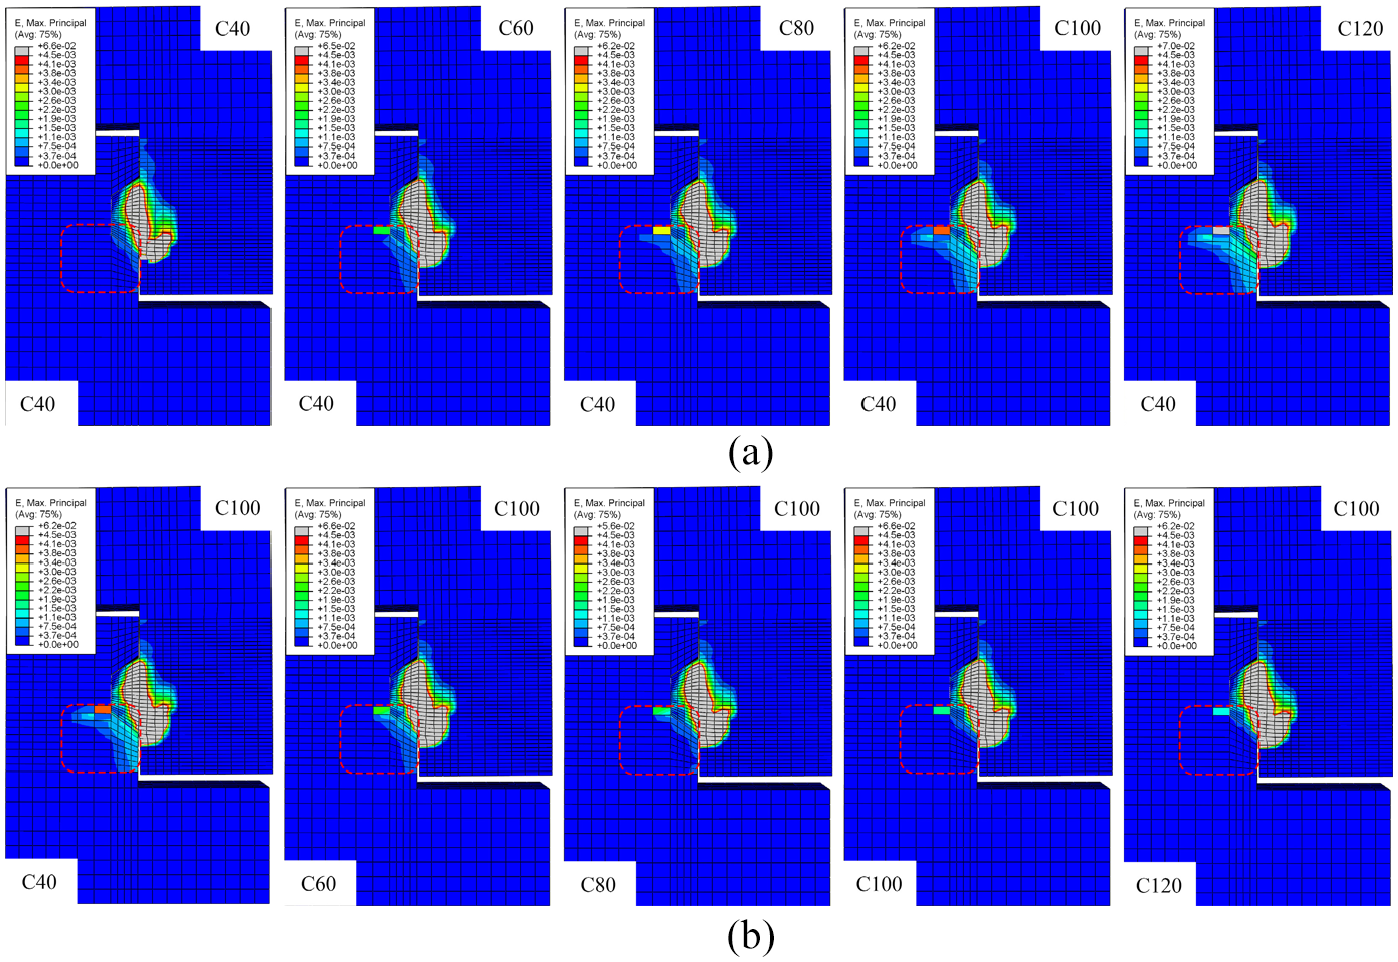
Stress distribution of specimens with different concretes. (a) effect of concrete strength of convex part, (b) effect of concrete strength of concave part Note: 1) the label at top left corner shows the value of maximum principal stress; 2) the label at top right corner shows concrete compressive strength of convex part; 3) the label at lower left corner shows concrete compressive strength of concave part.
The numerical results of stress distribution confirmed the possibility that the aforementioned crushing phenomenon in the concave part from the experimental test did result from the stress exceeding the compressive strength. The crushing zone would occur in those models with higher concrete compressive strength in convex part.
Effect of concrete strength of concave part on stress distribution
Another important finding comes from increasing concrete strength of concave part, as shown in Figure 16(b). As can be seen in C40–C100 model and C120–C100 model, stress concentration on crushing zone markedly alleviated as a result of increasing concrete strength of concave part. The alleviated stress concentration was also observed in the analogous models, thus increasing concrete strength of concave part could prevent shear key joint from failure in crushing zone. In the modeling specimens whose concave part was fabricated with higher concrete compressive strength, or those specimens were constructed with identical-strength concrete, it is less likely to occur the concrete crushing in the concave part.
Conclusion
In order to investigate the shear performance of adjacent segments fabricated with different types of concrete, the experimental tests on push-off specimens were carried out. Based on the observations of cracking patterns, experimental results, and numerical simulations, the conclusions could be drawn as follows:
Findings about shear capacity:
Experimental tests: in terms of specimens without steel fibers, peak shear load was enhanced in the range of 6%–12% as increasing concrete compressive strength, which strengthened the support contribution of shear key. Regarding the specimens with steel fibers, peak shear load would increase exceeding 20% than those without fibers. It is fibers’ shear contribution that significantly increased shear resistance. However, there were 13% and 15% reductions in normalized shear strength of some specimens.
Numerical simulations: peak shear load achieved a significantly upward trend as increasing the concrete compressive strength of convex part. However, as the concrete compressive strength of convex part increased, the increment rate of peak shear load decreased.
Findings about cracking patterns and stress distribution:
Experimental tests: inferring from cracking patterns, an unexpected crushing phenomenon in the concave part took place in composite joint. It is because shear load transferred to the concave part was high enough and exceeded its compressive strength.
Numerical simulations: the crushing phenomenon usually occurred in the case that concrete compressive strength of convex part was higher than that of concave part. A higher shear load transferred from the convex part to the concave part, thus stress on the concave bottom significantly increased. Conversely, stress concentration on crushing zone markedly alleviated as a result of increasing concrete strength of concave part.
Evaluated by shear design formulae:
Six design formulae were utilized to validate the strength prediction accuracy with the testing data in this research. Predictions via Buyukozturk formula and Rombach formula approximated the experimental results of those fabricating with RPC without fibers, but all formulae underestimated shear capacity of specimens with fibers because of neglecting the shear contribution provided by steel fibers.
Footnotes
Author’s Contribution
The authors confirm contribution to the paper as follows: study conception and design: Jiahui Feng; data collection: Weibin Liang, Chengwang Huang; numerical simulation: Jingyuan Zhang; Jiahui Feng; draft manuscript preparation: Haibo Jiang, Jiahui Feng; project advisors: Haibo Jiang. All authors reviewed the results and approved the final version of the manuscript.
Declaration of conflicting interests
The author(s) declared no potential conflicts of interest with respect to the research, authorship, and/or publication of this article.
Funding
The author(s) disclosed receipt of the following financial support for the research, authorship, and/or publication of this article: The research presented was sponsored by the National Natural Science Foundation of China (grant no. 51778150), the Natural Science Foundation of Guangdong Province in China (grant no. 2016A030313699), the Science and Technology Planning Project of Guangzhou city in China (grant no. 201804010422), and the Science and Technology Innovation Strategy Special Foundation of Guangdong Province in China (grant no. pdjh2020b0179).