
Abstract
The shaping and drying of ceramics are a critical yet complex process that directly influences ceramic materials’ final properties and performance. Predicting key parameters such as the coefficient of plasticity, mass loss during drying in the air at the critical point, and shaping moisture is essential for optimizing these processes. This study analyzes the dataset of the clays of various chemical compositions to predict and reveal the most important influences on the shaping and drying parameters in producing ceramic tiles. The data are then employed to develop and compare four advanced machine learning models. The models were evaluated using the most important performance metrics such as the coefficient of determination (R²), mean absolute percentage error (MAPE), mean absolute error (MAE), and root mean squared error (RMSE). Extreme Gradient Boosting (Gradient Boosting) emerged as the most reliable model, with 0.9871 R², 0.2672 RMSE, 0.2086 MAE, and 1.61% MAPE. Support vector regression and artificial neural networks also delivered strong performances, while random forest, though competitive, was slightly less accurate. Furthermore, model interpretation methods in machine learning analysis provided valuable validation of the predictive capabilities of the models and the influence of key input features. The advanced machine learning techniques in optimizing ceramic shaping processes offer a robust predictive toolkit for enhancing efficiency, reliability, and sustainability in ceramic materials engineering. It is seen that the Al2O3 levels up to 23% had little effect on plasticity and drying susceptibility, with significant changes occurring above 28%. The critical Fe2O3 content is found between 1.5% and 1.7%, and SiO2 of up to about 62%. The findings of this study offer valuable decision-support tools for ceramic manufacturers, raw material suppliers, and process engineers, enabling more informed material selection, reduced waste, and improved product consistency across the industry.
Keywords
Introduction
Ceramic materials development and optimization have long been the strength of industrial and technological advancement, with applications ranging from traditional pottery to cutting-edge aerospace components. The selection and use of ceramics are due to their exceptional mechanical, thermal, and chemical properties,1–3 but ceramics processing, particularly during the shaping stage, remains a complex and multifaceted challenge. The ceramics shaping phase is critical in that it directly influences the final materials’ properties and performance.4,5 However, this process has some difficulties, including balancing plasticity (PC), moisture content, and drying behavior to prevent cracking or warping. Factors such as the inherent variability in raw materials and the sensitivity of ceramics to processing conditions are some of the reasons for the challenges.6–9 As a result, one of the main areas of research now focuses on forecasting and managing the characteristics of ceramics during shaping. Considerable work has been done over the years to comprehend the basic processes that control the shaping and drying of ceramics.10–12 For instance, the PC of ceramic bodies is a critical property that determines their ability to be molded without cracking or deformation.13–15 Factors such as particle size distribution, clay mineralogy, and additives are the main reasons for these defects. Similarly, the drying process, particularly at the critical point where moisture removal transitions from constant to falling rate periods, is a delicate phase that can lead to mass loss and structural defects if not properly managed.16–19 The careful control of shaping moisture (SM) content is essential to ensure optimal workability while preventing excessive shrinkage or deformation during drying. Despite abundant empirical knowledge over years of practice, the interaction between these features is still poorly understood, calling for a more methodical and predictive approach.
To address the limitations, computational models and machine learning techniques are proposed by researchers to predict and optimize the properties of various kinds of ceramic materials.20–25 The traditional methods, such as empirical correlations and phenomenological models, have provided valuable insight. Their prediction accuracy and generalizability are often limited. The complex, nonlinear interactions between processing parameters and material properties may now be captured with AI by employing mathematical modeling.26–31 Their applications are being introduced to various aspects of ceramic processing, such as in predicting sintering behavior, mechanical properties, and thermal conductivity.21,22,24 Applying models to the parameters that describe the shaping and drying stages is still comparatively understudied.
Various studies32–35 have revealed a growing interest in leveraging advanced modeling techniques to address the challenges in the shaping of ceramics. Machine learning algorithms have been used to predict clay-based materials’ drying kinetics and shrinkage behavior.36,37 However, the integration of several prediction models to fully address the interconnected characteristics of PC, mass loss, and SM during the shaping of dry-pressed ceramic tile remains noticeably lacking, notwithstanding recent advancements. In addition, most existing studies focus on specific ceramics or processing conditions, limiting their applicability to this sector.38–41
This study seeks to address the elaborated gaps by applying and comparing four models for predicting the key properties of ceramics during shaping: coefficient of PC, mass loss during drying in the air at the critical point, and SM. To optimize the shaping operations of ceramic tiles, the study intends to create a strong prediction framework by utilizing a wide range of data covering different chemical and processing conditions. Its comprehensive methodology, which assesses each model's performance and looks at its limitations and synergies in expressing the intricate relationships between the properties under study, makes this work novel. In addition, this study provides insights into the relative strengths and weaknesses of different modeling approaches. Overall, the advancements needed in ceramic tile production are achieved by offering predictive models that can contribute to a more effective and reliable ceramic shaping process.
Experimental details: Samples and methodology
Experimental procedures
The ceramic raw materials included 97 raw clay samples. The samples employed were constituted mainly of quartz and illite/kaolinite and were previously demonstrated to be effective in producing ceramic tiles with various characteristics.42–44 After the collection, the samples were dried, ground, and homogenized. The material was finely ground using a ball mill and then sieved through a 0.5 mm sieve. The remains on the sieve were ground again to ensure that all the material was used. The samples were consequently dried to a constant mass.
The chemical composition was determined by the energy-dispersive X-ray fluorescence (ED-XRF), employing a Spectro Xepos instrument, using a fired pressed pellet preparation method and a series of certified reference materials. 45 During the firing, the loss on ignition at 1000°C is owed to the dehydration and dihydroxylation of clay minerals, burning of organic components, and the degradation of a low amount of carbonates. To obtain a comprehensive XRF analysis, this parameter is essential as it is used in the recalculation of the resulting chemical composition. This value is derived by weighing the specimens before and after firing.
The particle size analysis was estimated using a standard-defined method that combines wet and dry procedures. 46
The mineralogical composition was detected by X-ray diffraction analysis (XRD) with Philips 1050. The mineral patterns were identified using the PDF-2 database, and a semiquantitative analysis was performed. Based on the obtained results, the mineral composition is presented by the sum of clay minerals, then quartz and feldspars, and in the end, carbonates.
To test the characteristics of the samples related to the shaping phase in the process, they were moistened to obtain a mass suitable for hand-shaping. Thus, the sensitivity to drying is obtained by using a baraletograph and drawing a Bigot`s curve where a critical point relates to the ending of the sensitive part of the drying process. 47 The critical point coordinates include drying shrinkage (dSk) and mass loss (dGk). After drying the test samples to a constant mass, the SM is calculated in percentage. Further, the PC is evaluated based on the method by Pfefferkorn, 48 which divides clays related to the height of a moist-shaped clay cylinder after applying a dropping weight over it. This way, a coefficient of PC is obtained.
Dataset and AI employed
The dataset includes a wide range of input and output variables essential for comprehending and forecasting the characteristics of ceramic tiles during the shaping and drying processes. The obtained data were studied and used for modeling by employing MATLAB and Python programs.
The input features include the percentages of sand-, silt- and clay-sized particles, the share of oxides (SiO2, Al2O3, Fe2O3, CaO, MgO, Na2O, K2O, SO3, P2O5, MnO, and TiO2), and the proportions of clay minerals, quartz, feldspars, and carbonates. These characteristics are crucial for capturing the diversity of raw materials and their effects on the shaping and drying behavior of the ceramic tiles. As important markers of the workability, drying behavior, and general quality of the ceramic products, the output variables of interest are the SM, mass loss during drying at the critical point (dGk), and coefficient of PC.25,49
The descriptive statistics of the results obtained (Table 1) indicate a satisfactory variability within the dataset. For instance, the mean percentage of sand-sized particles in the samples was 20.5% with a standard deviation of 11.07%. This represents a relatively high degree of variability, as reflected by the coefficient of variation (CoV = 54.03%). Similarly, the silt- and clay-sized particles` content exhibit mean values of 49.67% and 29.82%, respectively, with moderate variability (CoV = 16.71% and 32.61%). The compositional oxides, such as SiO2 and Al2O3 show mean values of 62.93% and 22.38%, respectively, with relatively low variability (CoV = 9.31% and 12.01%). On the other hand, minor components like CaO and SO3 exhibit higher variability, with coefficients of variation reaching 76.71% and 242.32%, respectively. This broad range of variability highlights the complexity of the dataset and the requirement for strong modeling techniques to capture the complicated interactions between the chemical composition and the behavior in shaping and drying of raw clay materials.
Descriptive statistics of the dataset.

The output variables, PC, dGk, and SM, also display significant variability, reflecting the diverse range of ceramic properties observed. The coefficient of PC has a mean value of 26.28% with a standard deviation of 3.78%, indicating moderate variability (CoV = 14.40%). The mass loss produces a significant coefficient of variation (CoV = 78.77%) during drying at the critical point (dGk), with a mean value of 8.15% and a greater standard deviation of 6.42%. This wide range of variations suggests that the composition significantly affects the shaping and drying properties of ceramics. Similarly, the SM exhibits a mean value of 21.42% with a standard deviation of 2.42%, indicating relatively low variability (CoV = 11.31%).
The heatmap with the annotated correlation matrix and statistical significance (Figure 1) visually represents the relationships between the input features and the output variables. Strong and statistically significant correlations exist between certain input features. The share of SiO2 and Al2O3 is negatively correlated implying the presence of quartz in the samples. Furthermore, SiO2 is correlated to K2O (positively), Qz + feldspars (positively), LOI (negatively), and TiO2 (negatively), which shows its presence in potassium feldspars and the absence from the clay minerals as expected. On the other hand, Al2O3 is statistically significantly and positively correlated to LOI, Fe2O3, and TiO2, while a negative relation is found, besides SiO2, to K2O and Qz + feldspars. The results suggest the presence of Al2O3 mainly in clay minerals. Other very strong and significant positive correlations are seen between pairs CaO–carbonates and Fe2O3–LOI, explaining the appearance of the oxides in adequate minerals. The strongest negative correlations are observed between Qz + feldspars–LOI, K2O–LOI, K2O–TiO2, and clay-sized particles–sand-sized fraction.

Heatmap with annotated correlation coefficients with a statistical significance of p < 0.05 (Sand part: sand-sized particles; Silt: silt-sized particles; Clay: clay-sized particles; LOI: loss on ignition).
The frequency distribution of input parameters (Figure 2) further illustrates the variability in the dataset, with some features, such as sand- and clay-sized particle content, showing a wide range of values, while others like MnO and TiO2, are more narrowly distributed. The relationship between the input and output data is illustrated in Figure A1 (Appendix).
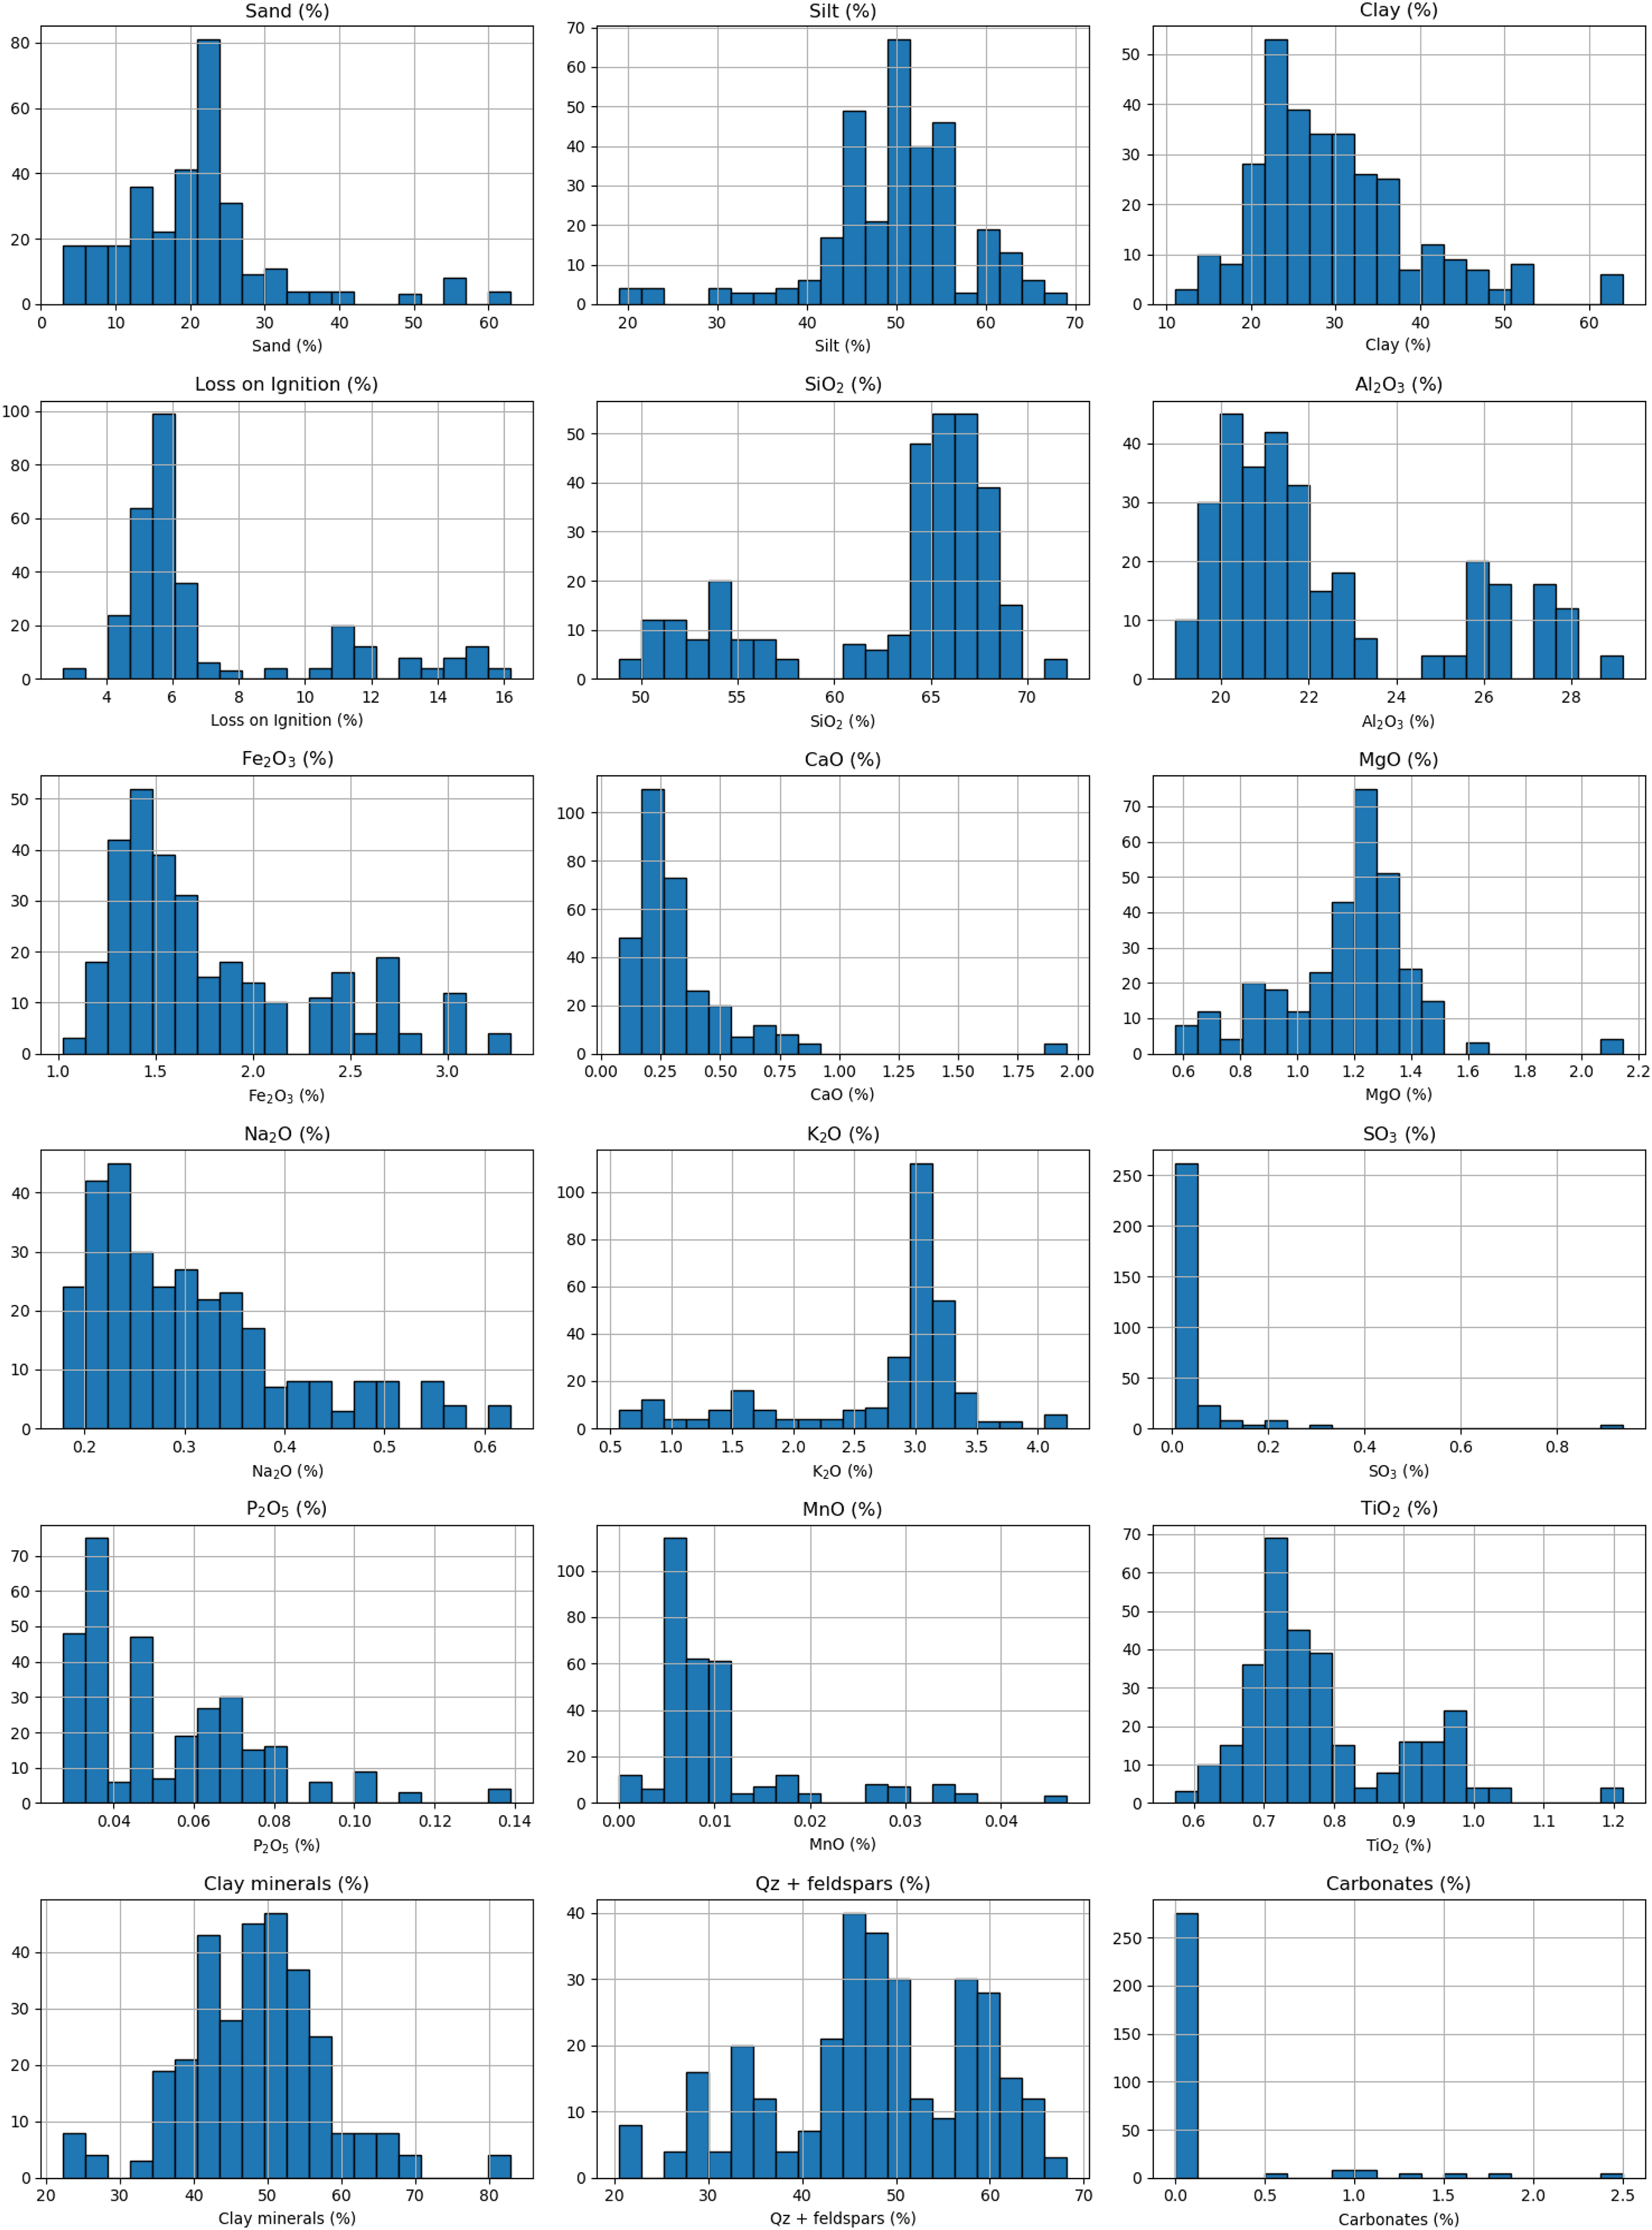
Frequency distribution of the inputs.
Theoretical framework of the models
The theoretical foundation of this study is built upon four advanced modeling techniques: Artificial Neural Networks (ANN), Support Vector Regression (SVR), Extreme Gradient Boosting (Gradient Boosting), and Random Forest (RF). The models operate on distinct mathematical principles and algorithmic frameworks, yet all aim to capture nonlinear relationships between input and output variables. 50 The theoretical frameworks and key equations associated with each model are presented to provide a comprehensive understanding of their mechanisms and applicability to ceramic properties during shaping and drying.
Artificial neural networks
ANN are computational models inspired by the structure and function of biological neural networks. ANNs consist of interconnected layers of neurons, which process input data through weighted connections and nonlinear activation functions.51,52 The most often employed structure of the ANN contains an input, one or more hidden, and an output layer. Each neuron in a hidden layer transforms its input using a weighted sum followed by an activation function. The network output is computed as a function of the final layer's activations. The training process involves minimizing a loss function, such as mean squared error (MSE), through iterative optimization techniques like gradient descent. Mathematically, the output of a neuron in a hidden layer can be expressed as:
Where yj is the output of the jth neuron, f is the activation function, wij represents the weight connecting the ith input to the jth neuron, xi is the ith input, and bj is the bias term. The predictions obtained by the network are refined using several techniques, like backpropagation when the loss function is iteratively computed and updated.
Support vector regression
SVR is a supervised learning algorithm derived from Support Vector Machines (SVM) principles. SVR aims to find a function f(x) that approximates the relationship between input variables x and output variables y while minimizing prediction error. Unlike traditional regression methods, SVR introduces an epsilon-insensitive tube around the predicted function, within which errors are not penalized. This approach enhances the model's robustness to outliers and noise.53,54 The SVR optimization problem can be formulated as:

Subject to:


Extreme gradient boosting (gradient boosting)
Extreme Gradient Boosting (Gradient Boosting) is an enhanced form of gradient boosting machine. They are engineered for superior efficiency and performance. Gradient Boosting constructs a series of decision trees sequentially, with each tree addressing the errors made by its predecessors.55,56 The model refines a regularized objective function that combines a loss function with a complexity penalty term. The objective function for Gradient Boosting is given by:
Where L(
In this context, T represents the number of “leaves” in the tree, w denotes the vector of “leaf” weights, and γ and λ serve as regularization parameters. Gradient Boosting utilizes gradient descent to minimize the objective function. Each newly added tree in the ensemble focuses on correcting the residual errors from the previous trees. This iterative process persists until a predefined stopping criterion is reached.
Random forest
RF is a learning technique that builds numerous decision trees during the training process and minimizes overfitting. Each tree in the forest is trained using a bootstrap sample of the training data, and at each split in the tree, a random subset of features is taken into account.
57
This randomization fosters diversity among the trees, thereby boosting the model's ability to generalize. The final prediction of the RF is obtained by averaging the predictions of all individual trees for regression tasks. Mathematically, the prediction 
Where B is the number of trees in the forest, and Tb(x) represents the prediction of the bth tree for the input x. The strength of Random Forest lies in its ability to handle high-dimensional data, capture complex interactions, and provide estimates of feature importance.
Performance evaluation of the models
The performance of the predictive models ANN, SVR, Extreme Gradient Boosting (Gradient Boosting), and RF was rigorously evaluated using four key metrics: the coefficient of determination (R²), Mean Absolute Percentage Error (MAPE), Mean Absolute Error (MAE), and Root Mean Squared Error (RMSE). These metrics thoroughly evaluate the models’ accuracy, precision, and capacity to generalize to new data. Each metric captures a different aspect of model performance, providing a detailed understanding of how effectively the models can predict the parameters of interest: the coefficient of PC, mass loss during drying at the critical point (dGk), and SM.
The coefficient of determination, R², measures the proportion of variance in the dependent variable that is predictable from the independent variables. It shows how well the model fits the observed data. R² ranges from 0 to 1, where a value closer to 1 indicates that the model explains a large portion of the variance in the target variable. The equation for R² is given by:
Where yi represents the actual value,
MAPE quantifies the average difference between predicted and experimentally obtained values, thus presenting a relative measure of the forecasting accuracy of the model. MAPE is especially useful for understanding the size of errors relative to the actual values. The equation for the calculation of MAPE is: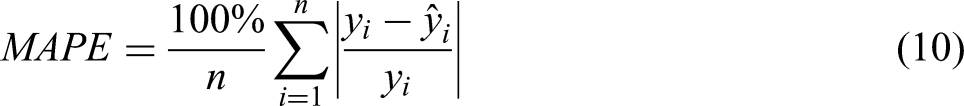
Where yi is the actual value,
MAE measures the average absolute difference between predicted values and obtained results, offering a clear assessment of prediction error. Unlike MAPE, MAE is not expressed as a percentage and is less sensitive to outliers. The equation for MAE is:
Where yi is the actual value,
The RMSE calculates the square root of the mean squared discrepancies between predicted and actual values, capturing the magnitude of prediction errors. RMSE is particularly sensitive to large errors because squaring the residuals emphasizes the influence of outliers. The equation for RMSE is:
Where yi is the actual value,
The sensitivity analysis
SHAP (Shapley Additive exPlanations) values are a theoretic approach to explain the output of machine learning models. They are based on the Shapley value concept from cooperative game theory, which assigns a value to each player (or feature) based on their contribution to the overall outcome.
SHAP values do not introduce infinitesimal changes to the inputs. Instead, they analyze all possible input combinations and assess the contribution of each feature to the prediction. This is done by comparing the model's output with and without the feature in question, across all possible subsets of features. The average contribution of the feature across all these subsets is the SHAP value. In essence, SHAP values quantitatively measure the significance of each input parameter in a model's prediction by considering the marginal contributions of each of them across all possible combinations. 58
Results and discussion
The results of this study provide a comprehensive evaluation of the predictive performance of four advanced machine learning models, ANN, SVR, Extreme Gradient Boosting (Gradient Boosting), and RF, in forecasting key ceramic properties during the shaping and drying processes. These properties include the coefficient of PC, mass loss during drying at the critical point (dGk), and SM. The analysis is supported by a detailed examination of model performance metrics, residual plots, partial dependence plots (PDPs), and SHAP (SHapley Additive exPlanations) analysis.
Comparison of the experimental and predicted values
To validate the accuracy of the models, a direct comparison between experimental and predicted values was performed (Figure 3) and serves as a validation of the model's performance. Scatter plots of experimental versus predicted values for PC, dGk, and SM revealed strong linear relationships, with data points closely aligned along the 45-degree line. This indicates that the models used could accurately predict the target variables across various values as stated previously.59,60

Comparison of experimental and predicted values between the four mathematical models: (a) ANN, (b) SVR, (c) Gradient boosting, and (d) Random forest.
The Gradient Boosting model exhibited the closest alignment between experimental and predicted values across all variables, with minimal scatter around the 45-degree line. The SVR and ANN models also showed strong alignment but with slightly more dispersion in the upper and lower ranges. While still accurate, the RF model exhibited the most dissipation, particularly for extreme values of the studied parameters, further highlighting its limitations in handling outliers.
Model performance metrics
Figure 4 illustrates a comprehensive comparison of the model performance metrics. The assessment of model performance utilized four primary metrics (R², MAPE, MAE, and RMSE). Collectively, these metrics evaluate the models’ accuracy, precision, and generalization capabilities. 61

Model performance evaluation: (a) RMSE, (b) R2, (c) MAE, and (d) MAPE (ANN: artificial neural network, SVR: support vector regression).
The Gradient Boosting model emerged as the best-performing one, achieving the highest R² value of 0.9871, indicating its exceptional ability to explain the variance in the target variables. This model also demonstrated the lowest RMSE (0.2672), MAE (0.2086), and MAPE (1.61%), reflecting its superior precision in minimizing prediction errors. The Gradient Boosting Model is considered the most reliable for predicting the properties followed in this study.
The SVR model also performed exceptionally well, with an R² value of 0.9653, slightly higher than ANN's. SVR achieved an RMSE of 0.4134, MAE of 0.3677, and MAPE of 3.47%. While its RMSE and MAE were higher than those of Gradient Boosting, SVR's performance is commendable, particularly in handling high-dimensional data and minimizing large errors. This suggests that SVR is highly effective in capturing the underlying patterns in the data, although it may struggle slightly with extreme values or outliers.
The ANN model delivered a strong predicting capability, with an R² value of 0.9631, RMSE of 0.4680, MAE of 0.3310, and MAPE of 2.64%. However, its performance was slightly inferior to that of Gradient Boosting and SVR, particularly regarding RMSE and MAE. This suggests that while ANN is a powerful model, it may require more extensive tuning or larger datasets to achieve the same level of precision as Gradient Boosting.
While competitive, the RF model exhibited slightly lower performance than the other models. It achieved an R² value of 0.9611, RMSE of 0.4816, MAE of 0.3453, and MAPE of 2.62%. These results indicate that RF is a robust model for predicting ceramic properties, but its performance is marginally less accurate than that of Gradient Boosting, SVR, and ANN. The ensemble nature of RF allows it to generalize well to unseen data, but it may struggle with capturing certain complex interactions present in the dataset.
Residual analysis
The residual plots for all models are presented in Figure 5. Residual plots were employed to assess the distribution of prediction errors for the models. These plots offer insights into the models` capacity to make unbiased predictions and detect possible systematic errors. For all models, the residuals were roughly normally distributed around zero, suggesting that the predictions were unbiased and devoid of systematic errors. However, slight deviations were observed in the tails of the residual distributions for SVR and RF, suggesting that these models may struggle with extreme values or outliers in the dataset.

Residual plots for: (a) ANN, (b) SVR, (c) Gradient boosting, and (d) Random forest.
The gradient-boosting model exhibited the most consistent residual distribution, with minimal deviations across the range of predicted values. This further corroborates its superior performance and ability to handle the dataset's variability. The ANN model also showed a well-behaved residual distribution, with only minor upper and lower tail deviations. These findings align with the performance metrics, reinforcing the robustness of Gradient Boosting and ANN in predicting the shaping and drying properties of the ceramics.
Partial dependence plots
Figure 6 shows the PDPs for the Gradient Boosting model. PDPs were generated to visualize the relationship between the inputs and the predicted outputs, providing valuable insights. For the Gradient Boosting model, PDPs revealed that the shares of clay-sized particles and SiO2 had the most significant impact on the outputs. A higher clay-sized particle content led to increased PC and sensitivity to drying, which is a well-known effect. 62 The effect is vice-versa in terms of the sand-sized fraction. Loss on ignition showed a critical effect on the behavior during shaping and drying to a level of up to about 5%. This could be attributed to weight loss due to dehydroxylation of clay minerals which are one of the most important factors in the processes followed. The levels of Al2O3 of up to 23% did not significantly affect the PC and drying susceptibility, while the highest influence is observed for the share of Al2O3 above 28%. The most critical contents of Fe2O3 are in the range of 1.5–1.7%. SiO2 was the most influential in quantities of up to 62%.

Partial dependence plots for gradient boosting model.
The PDPs also highlighted the nonlinear relationships between input features and output variables. For instance, the relationship between the outputs and total clay minerals contents exhibited a threshold effect, where the outputs increased sharply up to a 40.6% of the clay minerals before plateauing. These findings underscore the importance of feature engineering and the need to consider nonlinear interactions in predictive modeling.
SHAP sensitivity analysis
SHAP analysis was conducted to quantify the contribution of inputs to the model's predictions. SHAP summary plots (Figure 7) present values for a specific data point. Input parameters are typically ordered by importance, with the most important feature at the top. A positive SHAP value means the feature has a positive impact on the predicted output value (increasing it), while a negative SHAP value means it has a negative impact. This approach provides a unified framework for interpreting model outputs and identifying the most influential parameters. 63

SHAP sensitivity analysis (Sand: sand-sized particles; Silt: silt-sized particles; clay: clay-sized particles).
The quantity of sand-sized particles was determined to be the most influential to PC and SM. The effect is reflected in lowering the PC and SM, with the increased coarse particles share. On the other hand, the susceptibility to drying reflected in the parameter dGk is mostly affected by the clay-sized particles. The total carbonates share showed the lowest influence to all the parameters, due to their low presence in the tested materials.
For the PC predictions, SHAP values indicated that clay-sized particle content and the share of SiO2 were the most influential, contributing approximately 40% and 30% to the predictions, respectively. This aligns with the PDP findings and highlights the critical role of these features in determining PC. Considering the well-known fact that the clay mineral presence is directly related to PC 62 and that these are present in the finest particle fraction, these results were expected.
On the other side, for dGk, SHAP analysis revealed that Al2O3 and Fe2O3 contents were the dominant features, accounting for nearly 50% of the prediction variance. Thus, although PC and dGk are related to each other and expectedly depend on the contents of clay minerals and SM present, the dGk seems primarily related to those clay minerals containing Fe2O3 (illite, chlorite, and smectite).
Similarly, for SM, clay minerals and quartz + feldspars content were identified as the most influential features, contributing approximately 35% and 25% to the predictions, respectively.
The SHAP analysis also provided insights into the interactions between features. For example, the combined effect of clay content and SiO2 percentage on PC was greater than the sum of their contributions, indicating a synergistic relationship. These findings highlight the importance of considering feature interactions in predictive modeling and provide valuable guidance for optimizing ceramic formulations.
Conclusions and recommendations
This study demonstrates the effectiveness of advanced machine learning models in predicting key ceramic properties during the shaping process. Among the four models evaluated: ANN, SVR, Gradient Boosting, and RF, the Gradient Boosting model emerged as the most accurate and reliable, achieving the highest R² value (0.9871) and the lowest prediction errors (RMSE: 0.2672, MAE: 0.2086, MAPE: 1.61%). Its ability to capture complex, nonlinear relationships and interactions in the dataset makes it particularly well-suited for predicting ceramic properties. SVR and ANN also delivered strong performances, with SVR slightly outperforming ANN in terms of R², while RF, though competitive, exhibited slightly lower accuracy.
The residual analysis revealed that all models produced unbiased predictions, with Gradient Boosting and ANN showing the most consistent error distributions. PDPs and SHAP analysis provided valuable insights into the influence of key input features on the predicted properties, such as clay-sized particles content, SiO2 percentage, and Al2O3 content. These findings underscore the importance of feature engineering and the need to consider nonlinear interactions in predictive modeling.
The study revealed nonlinear relationships between input features and output variables, such as the threshold effect of clay minerals on the parameters concerning PC and drying susceptibility. These findings underscore the need to consider nonlinear interactions in predictive modeling.
The predictive models developed in this study have significant potential for industrial applications, particularly in optimizing ceramic shaping and drying processes. Their integration into real-time monitoring and control systems could enhance process efficiency and product quality.
The predictive models developed in this study have significant potential for industrial applications, particularly in optimizing ceramic shaping and drying processes. Future work should focus on integrating these models into real-time monitoring and control systems to enhance process efficiency and product quality.
Footnotes
Acknowledgements
The authors gratefully acknowledge help and support from the Ministry of Science, Technological Development and Innovation of the Republic of Serbia (Contract number 451-03-136/2025-03/ 200012). The authors are grateful to University North, Croatia for financial support within the project “Sustainable Building Composites.”
Author contributions
M. V. Vasić: writing—original draft, writing—review & editing, visualization, supervision, investigation, funding acquisition. Paul O. Awoyera: writing—original draft, writing—review & editing, formal analysis, visualization, supervision, investigation. Keneddy C. Onyelowe: writing—original draft, writing—review & editing. Md Azree Othuman Mydin: writing—original draft, writing—review & editing. I. Barišić: writing—original draft, writing—review & editing. I. Netinger Grubeša: writing—original draft, writing—review & editing.
Funding
The authors received no financial support for the research, authorship, and/or publication of this article.
Declaration of conflicting interests
The authors declared no potential conflicts of interest with respect to the research, authorship, and/or publication of this article.
Data availability statement
The main data that support the findings of this study are available within the article. However, all data that support the findings of this study are available from the corresponding author upon reasonable request.
Use of generative AI and AI-assisted technologies in the writing process
During the preparation of this work the authors used Copilot Microsoft tool to improve parts of the text for the purpose of improved writing. After using this tool, the authors reviewed and edited the content as needed and take full responsibility for the content of the publication.