
Abstract
Objective
Nonpuerperal mastitis (NPM) is an inflammatory condition, including periductal mastitis (PDM) and granulomatous lobular mastitis (GLM). The clinical manifestations of PDM and GLM are highly similar, posing significant challenges in their differentiation. Currently, there is a paucity of diagnostic models for distinguishing PDM from GLM. The objective of this research is to create and verify a model that can distinguish between PDM and GLM.
Methods
This study retrospectively collected laboratory data from 60 patients with PDM and 60 patients with GLM, and randomly assigned these patients into a training group (80%) and a testing group (20%). Additionally, 20 patients with NPM from another center were included as an external validation group. Five machine learning (ML) algorithms (Logistic Regression, XGBoost, Random Forest, AdaBoost, GNB) were combined to differentiate PDM from GLM. The performance of the models was evaluated using the area under the curve (AUC), and the model with the highest AUC in the testing group was selected as the best model.
Results
The logistic regression model emerged as the optimal ML approach for distinguishing PDM from GLM, primarily utilizing six variables (RDW, mean platelet volume, C4, IFN-γ, PT, and DD). In the training group, the model achieved an AUC of 0.827, and similarly, in the testing group, it yielded an AUC of 0.807. Addition, both the training and testing groups achieved an accuracy, sensitivity, and specificity of over 0.7. Notably, the model also performed effectively in the external validation group, with an AUC of 0.750.
Conclusion
This study established a hematological model to distinguish PDM from GLM, facilitating early diagnosis and reducing misdiagnosis in NPM patients.
Keywords
Introduction
Nonpuerperal mastitis (NPM), which is less common, mainly impacts women who are not currently breastfeeding and are aged between 30 and 40 years old. 1 NPM patients suffer from adverse reactions to clinical treatments, long treatment cycles, and recurrent episodes of the disease, which all negatively impact their quality of life. In some cases, NPM can also coexist with breast cancer. 2 NPM is primarily comprised of periductal mastitis (PDM) and granulomatous lobular mastitis (GLM). 3 PDM, also known as “plasma cell mastitis,” 4 primarily affects the large ducts in the nipple area, while GLM mainly affects the breast lobules and is characterized by non-caseating granulomas centered on the lobules. 5 The clinical features of both PDM and GLM are varied and intricate, posing challenges in differentiating them solely based on imaging characteristics and clinical presentations. Most patients may not be willing to undergo a biopsy to obtain a pathological diagnosis, which is considered the gold standard. 3 The treatment approaches for PDM and GLM differ. PDM is primarily managed surgically, however, the likelihood of the condition recurring following surgery can reach 43%. 6 It has been verified that ductal lavage is effective in treating PDM. 7 Treatment for GLM typically involves the use of antibiotics, steroids, immunosuppressive medications, and surgical intervention. 8 For patients with GLM, a preferred treatment option may be a steroid-based combination therapy, with an integrated strategy combining local and systemic steroids along with surgery offering the best therapeutic outcomes. 9
Machine learning (ML) is capable of efficiently analyzing vast amounts of clinical laboratory data, revealing complex patterns and trends, and providing objective interpretations of clinical data. 10 ML could provide more accurate and automated predictions of disease sensitivity, diagnosis, and prognosis, enabling clinical decision-making. However, there is currently a lack of diagnostic models specifically designed to distinguish between PDM and GLM. From the perspective of macroscopic immune cells, GLM patients may experience a decrease in the number of Th cells and Treg cells, accompanied by an increase in the number of cytotoxic T lymphocytes, macrophages, neutrophils, and NK cells. In contrast, PDM patients show an increase in the number of B cells and macrophages. At the microscopic cytokine level, GLM patients may undergo suppression of Th1 cell activity and an increase in the number of Th17 cells, while PDM patients may face overactivation of Th1 cells. 11 Ongoing research has revealed notable disparities between PDM and GLM to lipoprotein (α), lactate dehydrogenase, creatine kinase, and total cholesterol. 12 These evidence support the notion that there are distinct hematological differences between PDM and GLM. Given the differences in pathogenesis and treatment approaches between these two diseases, inaccurate diagnosis can lead to the selection of inappropriate treatment methods and poor prognosis. Therefore, we believed that there were hematological parameter differences between PDM and GLM, and we could utilize ML techniques to establish diagnostic models, aiding clinicians in differentiating between PDM and GLM.
Methodology
Patient involvement
This study was conducted in accordance with the principles outlined in the Helsinki Declaration of 1975, as revised in 2024, ensuring ethical considerations in research involving human subjects. On 29 April 2024, the Ethics Committee of the First Affiliated Hospital of Zhejiang Chinese Medical University granted approval to this study, assigning the ethics approval number 2024-KL-337-01. Being a retrospective study, it did not entail the gathering of human specimens from patients. Consequently, we sought and obtained a waiver for patient consent from the ethics committee. And the reporting of this study conforms to STROBE guidelines. 13
Between April 2024 and June 2024, we retrospectively collected data on 60 patients diagnosed with PDM and 60 patients diagnosed with GLM at the Hubin Center of the First Affiliated Hospital of Zhejiang Chinese Medical University, from January 2022 to July 2023. These patients’ diagnoses were consistent with the “Clinical Practice Guidelines for Diagnosis and Treatment of Patients with Non-Puerperal Mastitis: Chinese Society of Breast Surgery (CSBrS) Practice Guideline 2021” 3 and were confirmed through pathological diagnosis. Additionally, we included 14 patients with PDM and six patients with GLM from March to July 2023 at the Qiantang Center of the First Affiliated Hospital of Zhejiang Chinese Medical University were included as an external validation group.
The following criteria were used to exclude patients: (1) Patients who are pregnant and breastfeeding; (2) Patients with severe liver or kidney dysfunction; (3) Age < 18 years; (4) Patients with severe conditions such as heart disease, diabetes, or uremia; (5) Patients with breast cancer or breast tuberculosis; (6) Patients with incomplete clinical data.
Data collection and statistical analysis
Baseline information encompassing age, BMI, childbearing history, and disease triggers, along with clinical laboratory data, were gathered from the electronic medical records of the patients. And we have deidentified all patient details. The laboratory data included 55 hematological parameters, including routine blood tests, reproductive hormones, immunologic parameters, and coagulation tests. An analysis of the data was performed using SPSS 26.0 and R 4.3.1 software. Categorical variables were presented as frequency, percentage, or mean and standard deviation. To identify noteworthy distinctions between the PDM and GLM groups, independent sample t-tests or Wilcoxon tests were utilized, where a p-value below .05 was regarded as statistically significant. Utilizing logistic regression for variable set scoring and select the optimal variable set for inclusion in the model.
Machine learning
The Beckman Coulter DxAI platform was utilized for model development, comparison, assessment, and the creation of online access links to the model. A total of 120 patients with nonpuerperal mastitis (NPM) were divided into a training group (80%) and a testing group (20%) through random assignment with a random seed value (seed value = 42) to guarantee the reproducibility of the randomization process. Through five-fold cross-validation, five models were built and validated in the training cohort using laboratory tests and ML techniques. To select the best model among the five, the area under the curve (AUC) was used, and the final best model was further validated with external validation cohorts. The logistic regression model was found to be the most effective model in this study and its performance was evaluated using accuracy, sensitivity, specificity, ROC, AUC, DCA, and calibration curves. The Shapley Additive Explanations (SHAP) plots were used for interpreting the model.
Results
Baseline data
As indicated in Table 1, there were no notable disparities in age, BMI, childbearing history, or disease triggers between the two study groups.
Patient characteristics of nonpuerperal mastitis.

PDM: periductal mastitis; GLM: granulomatous lobular mastitis.
Comparison of hematological parameters between patients with PDM and GLM
A comparison of 55 hematological laboratory test data from 120 patients was conducted in this study, and the results are presented in Table 2. Table 2 clearly showed that there were notable distinctions between the two groups in nine factors: RDW, mean platelet volume (MPV), NLR, C4, IFN-γ, NK cells, PT, FIB, and DD (p < .05).
Comparison of hematological parameters between PDM and GLM.

WBC: leukocyte count; NE: neutrophil; LY: lymphocyte; MO: monocyte; EO: eosinophil; BA: basophil; RBC: red cell count; HGB: hemoglobin; HCT: hematocrit; MCV: average red blood cell volume; MCH: average red blood cell hemoglobin content; MCHC: average red blood cell hemoglobin concentration; RDW: red blood cell volume distribution width; PLT: platelet; MPV: average platelet volume; PDW: platelet volume distribution width. NLR: neutrophil to lymphocyte ratio; PLR: platelet to lymphocyte ratio; CRP: C reactive protein; FSH: follicle-stimulating hormone; LH: luteinizing hormone; PRL: prolactin; E2: estradiol; P: progesterone; T: testosterone; IL: interleukin; TNF-α: tumor necrosis factorα; IFN-γ: interferon γ; Treg cell: regulatory T cell; PT: prothrombin time; FIB: fibrinogen; TT: thrombin time; APTT: activated partial thromboplastin time; DD: D-dimer.
Areas under ROC
Figure 1 presented the ROC curves and AUC values for nine impact factors, which significantly indicate the occurrence of PDM and GLM in the two groups. Among them, C4 exhibited the highest efficiency (AUC = 0.633), followed by NK cell count (AUC = 0.632) and PT (AUC = 0.627).

ROC curve of nine impact factors.
Selection of the optimal variable set
Using logistic regression, the nine impact factors were ranked based on their importance, as shown in Figure 2(A). Figure 2(B) compares the ROC-AUC of models built using different variable sets through a line chart representation. Based on Figure 2(B), we found that the optimal variable set consists of eight variables. According to the one-10th rule, there are a maximum of six variables that can be included in the model. Furthermore, we conducted a correlation analysis on these six indicators. Figure 3 demonstrated that there was no correlation among them, indicating their suitability for use in modeling. Therefore, six variables were ultimately included in our model.

(A) feature importance of nine impact factors. (B) Comparison of scores across different variable sets.

Heat map of correlation of six impact factors.
Comparison of the five models and verification of the optimal model
Table 3 displayed the AUC values obtained from the five-fold cross-validation of the five ML algorithms on the training cohort. Upon evaluation of the testing group, the AUC values for the various algorithms were as follows: logistic regression achieved 0.797, XGBoost recorded 0.684, Random Forest scored 0.683, AdaBoost reached 0.744, and GNB exhibited an AUC of 0.763. Among the range of models tested, the logistic regression model displayed the highest level of predictive performance.
Comparison of the five models.

Evaluation and interpretability of best model for ML
As can be seen from Table 4 and Figure 4, the logistic regression model demonstrated strong capability in distinguishing between PDM and GLM. Figure 5 illustrated that the model achieved an AUC, accuracy, sensitivity, specificity, and negative predictive exceeding 70%. Within the training group, the model attained an AUC of 0.827, while in the testing group, it likewise achieved an AUC of 0.807. Figure 4(A) and (B) present the ROC curves about the training and test groups, respectively. Figure 4(C) presented the calibration curve, exhibiting a robust correlation between the actual probabilities and those predicted, indicative of excellent calibration for the model. Figure 4(D), on the other hand, illustrated the DCA curve, highlighting the significant clinical utility of the model.

Diagnostic efficacy of logistic regression models. (A) The training group's ROC curve; (B) The testing group's ROC curve; (C) Calibration curve; (D) Decision curve analysis.

The SHAP values plot for the logistic regression model. (A)The SHAP analysis yielded the ranking of the importance of various features. (B) The SHAP value, which quantifies the extent of its influence on the outcome, is depicted on the horizontal axis for each individual feature. Each dot represents a specific sample. The color intensity, ranging from red to blue, corresponds to the increasing or decreasing value of the feature, with red indicating a higher value and blue indicating a lower value. (C) The SHAP force plot for patients with PDM. (D) The SHAP force plot for patients with GLM.
Diagnostic value of the logistic regression model.
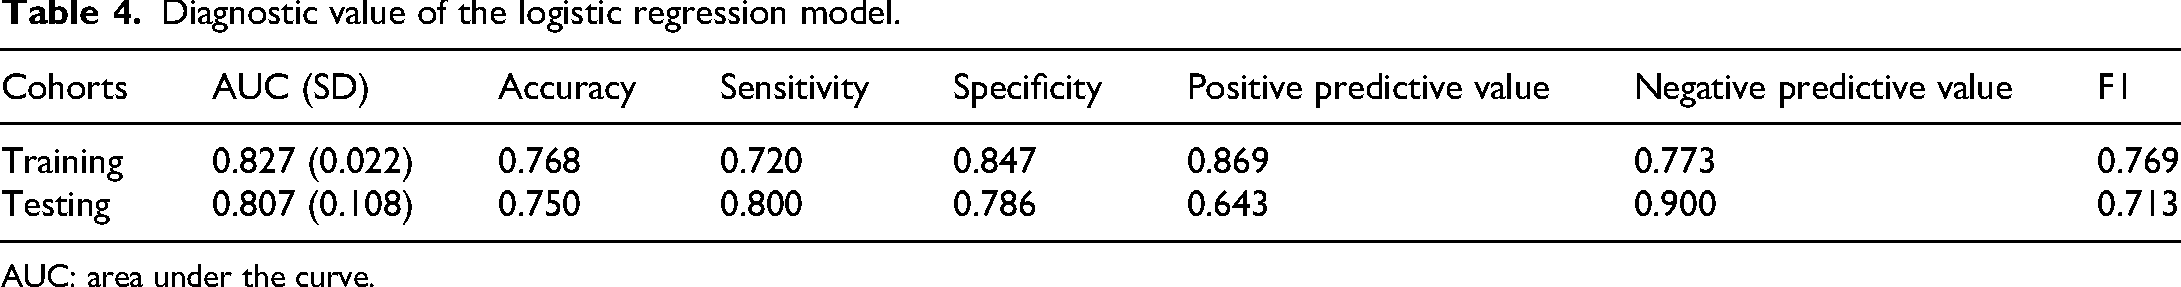
AUC: area under the curve.
As shown in Figure 5(A), the SHAP algorithm-based interpretation of the logistic regression model ranked by feature importance indicates that PT, MPV, IFN-γ, RDW, DD, and C4 are the most influential features in distinguishing the effects of NPM. Figure 5(B) illustrated the relationship between the observed values and SHAP values for the six most relevant features selected. The larger the Shapley value of a feature, the greater its importance in model prediction. Utilizing the SHAP plot, the study graphically represents the Shapley values of each feature, revealing the extent to which each feature positively or negatively influences the model's predictions. Figure 5(C) and (D) displayed the individual force plots for PDM patients and GLM patients, respectively. Features that contribute to an increased prediction value are represented in red, whereas those that lead to a decreased prediction value are depicted in blue. The length of the arrow in the SHAP plot directly corresponds to the magnitude of a feature's impact on the model's output. The scale values along the x-axis indicate the extent of this impact, whether it is an increase or decrease.
External validation of the logistic regression model
Using data from 14 PDM patients and six GLM patients collected from another hospital center as an external validation group, the newly constructed model achieved an AUC of 0.750, as depicted in Figure 6. This external validation step demonstrated the model's generalization ability to unseen data from a different setting, further supporting its reliability and accuracy in discriminating between PDM and GLM.

ROC for external validation of logistic regression model.
Discussion
NPM is a chronic inflammatory condition of the breast that occurs outside of lactation and is prone to recurrent episodes. It makes up about 4–5% of all benign breast abnormalities. 14 NPM is characterized by its diverse types, prolonged course, and high recurrence rate, especially in refractory cases, which pose significant clinical concerns and challenges. 15 Our knowledge of NPM is still at an early stage, and we do not have a clear differentiation between PDM and GLM. The primary symptoms of PDM typically involve the presence of one-sided breast lumps and redness, along with discomfort, nipple inversion, and the development of abscesses. GLM is typically characterized by unilateral masses with tenderness, nipple discharge, and skin changes. Some patients may also present with nodular erythema of the lower extremities. 16 Currently, there is no established model to distinguish between PDM and GLM. Therefore, there is an urgent need to develop a discrimination model that can assist clinicians in making early diagnoses and initiating prompt treatment. Such a model has the potential to significantly enhance patient outcomes and alleviate the burden associated with recurrent disease.
The research found no statistically significant disparities in age, BMI, childbearing history, and disease triggers between the two groups (p > .05). In this study, patients with NPM were predominantly aged between 29 and 34, and most had a history of childbirth, which is consistent with previous research.1,17–19 However, NPM can also occur in adolescent females without any history of pregnancy. 20 However, it is noteworthy that the BMI values exceeded the normal standard range (18.5–23.9 kg/m2), indicating that obesity may be a contributing factor to the occurrence of NPM in women of reproductive age. This finding aligns with prior research indicating that obesity can directly influence the production of estrogen and inflammation within the local breast tissue. 21 Additionally, a high BMI is also a risk factor for the recurrence of NPM. 22 In addition, our study also identified several potential predisposing factors for NPM, including overexertion, the use of psychiatric medications, oral contraceptives, trauma, emotional abnormality, and COVID-19 infection. However, most patients have no apparent predisposing factors. Previous studies have identified smoking, bacterial infections, and reproductive factors as high-risk factors for PDM. 23 For GLM, risk factors include emotional distress, the intake of psychotropic drugs, the use of oral contraceptives, blunt trauma, and corynebacterium infection.24,25 Notably, there is currently no research exploring the correlation between COVID-19 infection and NPM. Previous literature has reported cases of NPM occurring in women after COVID-19 infection. 26 A deeper investigation into the impact of COVID-19 on NPM is deemed necessary.
Through a comprehensive analysis of 55 hematological laboratory indicators, including blood routine tests, reproductive hormones, immunologic parameters, and coagulation function, this study identified nine significantly different factors between the PDM and GLM patient groups. These factors are RDW, MPV, NLR, C4, IFN-γ, NK cells, PT, FIB, and DD. Notably, reproductive hormones did not demonstrate a clear distinction between PDM and GLM. However, studies have shown that excessive prolactin (PRL) can bind to PRL receptors on breast epithelial cells, promoting processes such as fatty acid formation, leading to abnormal proliferation of breast alveolar cells and inducing inflammation. 27 Compared to the GLM group, patients with PDM exhibited higher levels of RDW, C4, IFN-γ, and NK cells, while showing lower values for MPV, NLR, PT, FIB, and DD. The identification of these differentially expressed markers provides valuable insights into the pathophysiological differences between PDM and GLM. Among these factors, RDW, MPV, and NLR have previously been recognized as auxiliary diagnostic tools for various diseases.28,29,30 NLR, the neutrophil-to-lymphocyte ratio, serves as a reliable inflammatory marker, reflecting the balance between inflammatory and antiinflammatory responses. It has been demonstrated that NLR exhibits a correlation with the recurrence of NPM. 31 Furthermore, the complement system, an essential part of both the innate and adaptive immune systems, has a key role in protecting the body against foreign invaders. 32 The cytotoxicity exhibited by NK cells is modulated by a diverse array of cytokines, among which IFN-α and IFN-γ play pivotal roles. NK cells can detect intracellular pathogens and transformed or stressed cells, exerting crucial cytolytic effects. 33 There is a close relationship between inflammation and coagulation function. When the body is inflamed, the release of a large number of inflammatory cytokines can directly activate the coagulation cascade, affecting the normal function of the coagulation system. 34 FIB is an acute-phase reactant protein that can reach several times its normal plasma concentration during inflammation, serving as a biomarker for both inflammation and coagulation.35,36 Velidedeoglu 31 found that FIB levels were significantly elevated in patients with NPM and were associated with recurrence.
In our study, the logistic regression model primarily utilized six variables: RDW, MPV, C4, IFN-γ, PT, and DD. These variables may potentially serve as predictors for diseases. RDW, which stands for red cell distribution width, measures the size variation of red blood cells. Studies have shown that RDW can be an independent predictor of mortality following amputation due to diabetic foot. 37 Meanwhile, RDW can also serve as a prognostic biomarker for the occurrence of stroke-associated pneumonia and mortality in acute ischemic stroke patients who have undergone thrombolytic therapy at admission. 38 MPV, or mean platelet volume, represents the average size of platelets. In the study by Yuan J et al., MPV can be used as a predictive indicator for preeclampsia. 39 C4 is a crucial component of the classical complement activation pathway, and typically, lower levels of C4 are associated with increased disease activity. The research conducted by Li J et al. suggested that C4 could serve as a diagnostic and prognostic indicator for GLM. 40 IFN-γ, also known as interferon-gamma, is secreted by a range of cells, including NK cells, helper T cells, monocytes, and macrophages, among others. 41 IFN-γ is a versatile cytokine that possesses antiviral, anticancer, and immune-regulating abilities. It triggers monocytes and macrophages to destroy pathogens and prompts cytotoxic T lymphocytes to eradicate infected cells. 42 Liu L et al. found that the expression of IFN-γ was significantly increased in the breast tissues of patients with PDM. 43 PT is useful for assisting in the diagnosis of liver diseases, inherited coagulation factor deficiencies, vitamin K deficiency, antiphospholipid syndrome, and for monitoring warfarin dosage. 44 In this study, PT was identified as the most significant factor in establishing the model. PT has been found to be useful for modeling to predict preoperative deep venous thrombosis in elderly anemic patients undergoing total hip arthroplasty. 45 DD is used to evaluate thrombotic activity, but it can also be elevated in conditions other than thrombosis, such as infection and trauma. 46 Future research could explore the mechanistic links between these markers and the development of PDM and GLM, as well as the potential therapeutic implications of modulating their expression.
ML algorithms consist of various computational techniques that empower computers to build predictive models. In the medical field, ML techniques have been applied in diverse ways, including but not limited to predicting disease classification, discovering biomarkers, predicting drug responses, and identifying pathogenic genetic variations. 47 As part of the clinical support team in a hospital, our goal is to utilize ML to establish models that assist clinicians in distinguishing between PDM and GLM.
In this study, we identified and utilized RDW, MPV, C4, IFN-γ, DD, and PT as key parameters in the development of a predictive model. Through the evaluation using AUC values, calibration plots, and DCA curves, it was found that the model exhibited excellent discrimination and calibration abilities in predicting PDM and GLM patients. The DCA plot further demonstrated its good performance and high clinical utility. Furthermore, the model proved its effectiveness in both the test group, achieving an AUC of 0.807, and the external validation group, with an AUC of 0.750. The significance of these findings lies in the potential for clinical application. By incorporating this model into clinical practice, doctors can gain additional insights and decision-making support when diagnosing PDM and GLM. The model's ability to accurately distinguish between these two conditions can lead to more targeted and effective treatment plans, potentially improving patient outcomes. However, there has been no study exploring the differences in routine blood tests, reproductive hormones, immune function tests, cytokines, and coagulation function between PDM and GLM. Furthermore, no discrimination model has been established to distinguish between these two diseases. In this study, we constructed a hematological parameter model with an AUC of 0.827 to distinguish PDM from GLM. According to our present knowledge, this model represents a preliminary attempt to discriminate between PDM and GLM using hematological parameters.
Limitations
The present study is retrospective and involves a small sample size of case-control design, which limits the validity of its results. We have only included a total of 120 patients who have been diagnosed with NPM in our study. Additionally, our model was developed and validated using data from China, lacking confirmation across different countries and ethnicities. Furthermore, we only employed hematological parameters to develop the model, whereas PDM and GLM may also exhibit differences in imaging modalities such as breast ultrasonography, CT, and MRI. In the future, we plan to incorporate a larger number of patients and consider a wider range of hematological parameters to optimize and refine our model. If possible, we will also incorporate imaging characteristics into our model to further enhance its reliability.
Conclusion
In summary, a model for discriminating PDM from GLM based on hematological parameters has been constructed. Six factors (RDW, MPV, C4, IFN-γ, DD, and PT) were filtered and used to build the model. Five ML models (Logistic regression, XGBoost, Random Forest, AdaBoost, GNB) were employed on the same dataset to distinguish between PDM and GLM. Among the various models tested, the logistic regression model demonstrated the most optimal predictive performance. Additionally, this model was externally validated using data from a different center. The model demonstrates excellent discrimination and calibration capabilities, indicating its potential for application in clinical practice.
Footnotes
Ethical considerations and informed consent
This retrospective study, which has been approved by the Ethics Committee of the First Affiliated Hospital of Zhejiang Chinese Medical University with the approval number 2024-KL-337-01, has applied for a waiver of patient informed consent as it does not involve the collection of patient specimens.
Author contributions/CRediT
GL: writing—original draft preparation; YQ: formal analysis; LZ: writing—review and editing; YY: writing—review and editing, and project administration.
Funding
The author(s) received no financial support for the research, authorship, and/or publication of this article.
Conflicting interests
The author(s) declared no potential conflicts of interest with respect to the research, authorship, and/or publication of this article.
Data availability
The data that support the findings of this study are available from the corresponding author upon reasonable request.