
Abstract
Exploring the wax removal process by numerical simulation is beneficial for guiding field operations. In this paper, enthalpy-porosity and volume of fluid (VOF) methods were adopted to simulate the melting process of wax in the crude oil gathering pipeline. The melting patterns and liquid fraction of the wax were used to validate the mathematical model. The results show that the wax melts quickly before the liquid fraction reaches 80%, while the remaining 20% melts very slowly. Since the water with higher density sinks to the lower part of the pipeline, the wax in the lower part of the pipeline melts first, while the wax in the upper part of the pipeline melts slowly. The water temperature and flow rate disproportionately affect the melting process. Increasing the water temperature and flow rate can accelerate the melting process, but the effects on shortening the melting time of wax gradually decrease. Increasing the flow rate, the heat transfer rate and the melting rate are increasing progressively, the change of flow rate also affects the outlet temperature of the pipeline.
Introduction
Most of the crude oil produced in China contains significant quantities of wax. The wax deposition has been a frequent problem during the pipeline transportation of crude oil.1–3 Due to the solubility of wax in crude oil is a decreasing function of temperature, the dissolved wax starts to precipitate out as wax crystals as the temperature drops below the wax precipitation point during transportation.4,5 When the wax crystal reaches a certain amount, they may interact with each other to form a three-dimensional network, and as a result the oil loses its overall flow ability. 6 Challenges triggered by wax deposition include the increased resistance, the narrowed flow channel, the reduced production rate and so forth. 7 The wax deposition is a major operational hazard in production and transportation of crude oil, which brings a critical operational challenge for the petroleum industry, and millions of dollars are spent dealing with the deposition related problems each year.8–11 Therefore, it is of great significance to remove the wax deposition to reduce the production cost of crude oil.
Wax remediation can be accomplished by mechanical pigging, chemical injection, inductive heating and biological treatment. 4 In the above method, the thermal washing is widely used due to its simple operation, low cost and rich experience. In recent years, scholars have carried out researches on the application of thermal washing in pipelines. Shi and He 12 conducted the gradual heating for the Wanzhou pipeline. By comparing the change of the pressure, temperature and flow rate before and after the operation, the effect of wax cleaning was judged. Yang 13 compared the pressure and flow rate after the operation to verify the effect, mainly by comparing the pressure at the same flow rate and the flow rate at the same pressure. Yuan 14 injected high-temperature oil into the pipeline to remove the wax, found the equivalent diameter of the pipeline change from 41 mm to 100 mm, close to the inner diameter of the pipeline.
It is clear from the literature reviewed above that there are few researches has been carried out on investigating the process of thermal washing for wax cleaning in pipeline. To date, Researchers through experiments to measure the changes in the flow rate, pressure and diameter of the pipeline to judge the effect. However, the long operating time and numerous influencing factors have hindered the study of the impact of water temperature and flow rate on the process. Only by taking experiments to obtain the internal heat transfer characteristics of wax and analyze the influence of various factors on the washing process will be very difficult. Therefore, it is necessary to carry out the numerical simulation of the process of wax removal to obtain the effects of different parameters on the wax removal process, which is beneficial for guiding wax removal in oil field.
The wax is melted by absorbing the heat of high-temperature water during the process of thermal washing, which the process is a typical phase change process. For the process of the wax phase transition in pipelines, it is mainly applied in the shell-and-tube heat exchanger, which uses wax as phase change material (PCM). In recent years, there has been a significant amount of researches into investigating the thermal behavior of the shell-and-tube heat exchanger. Fang and Chen 15 proposed a theoretical model which used multiple wax as PCM, it was found that there is an optimum proportion between multiple PCMs to obtain the maximum thermal energy charging rate. Kibria et al. 16 numerically investigated the effects of HTF inlet temperature, mass flow rate, the thickness and radius of inner tube. The numerical results demonstrated the effects of HTF inlet temperature and radius of the inner tube have more impact on the thermal performance of the storage unit. Pahamli et al. 17 studied the impact of eccentricity on the thermal performance of the system, the results showed that the effect of natural convection in the melting process is more pronounced with an increase in the convection dominated area, which in return intensifies the melting rate. Wang et al. 18 concluded that the main heat transfer mechanisms in the shell-and-tube heat exchanger have dominated by convection, a mix of convection and conduction, and conduction. Seddegh et al. 19 numerically investigated the thermal behavior and heat transfer characteristics in the horizontal and vertical shell-and-tube thermal energy storage systems. It was concluded that natural convection has a strong effect on the melting process of the wax on the upper part when placing the heat exchanger in a horizontal position than a vertical one. Hosseini et al. 20 studied the effect of HTF inlet temperature on the melting process. They found that by increasing the inlet temperature from 70°C to 75°C and 80°C, the efficiency in charging and discharging processes rises from 81.1% to 88.4% and from 79.7% to 81.4%, respectively. In addition, there has been plenty of studies on improving heat transfer within the wax by using fins,21–24 employing excessive tubes, 25 and adding nanoparticles.26,27 It is clear from the literature reviewed above that many numerical studies have been conducted on the phase change heat transfer process of wax in shell-and-tube heat exchanger. However, for the shell-and-tube heat exchanger, the wax and HTF are placed in containers respectively, the heat transfer between the two mediums needs to pass through the wall of the inner tube. The melted wax does not flow with the heat transfer fluid.
In this paper, the enthalpy-porosity and volume of fluid methods were applied to simulate the melting process of wax and the flow of molten wax with hot water, respectively. The melting process of wax in the pipeline were investigated and studied. The simulation results were validated using experimental results. The effects of water temperature and flow rate on the melting process were investigated.
Model description
Physical model
Schematic view of the physical model is displayed in Figure 1. The length and diameter of the pipeline are 1000 mm and 53 mm, respectively. The wax with a thickness of 10 mm is evenly on the inner surface of the pipeline, and the water flows in from the inlet and flows out from the outlet. The thickness of the pipeline is ignored. Heat is transferred from high-temperature water to wax by forced convection, the wax starts to melt after absorbing heat and flows out of the pipeline with water.

The physical model.
The wax in crude oil is mainly composed of n-alkanes, isoalkanes and naphthenes, among which n-alkanes account for about 90∼92%. In this paper, it was assumed that the wax is composed of n-alkanes. Figure 2 shows the carbon composition of wax in Daqing crude oil. The parameters such as the phase change point and latent heat of n-alkanes increase as the carbon number increase. Therefore, the heat and time required for the phase transition process increase. According to the figure, the content of C16-C25 accounts for 52.95%, and the content of C26-C48 accounts for 47.05%. In order to make the heat absorbed by the selected wax closer to the wax in crude oil during the melting process, the C25 in the middle of the total content was used to represent the wax. The thermal properties of C25 are shown in Table 1.

The distribution of carbon number of the wax in Daqing crude oil.
Thermophysical properties of C25.

Governing equations
The numerical solution is obtained by using the enthalpy-porosity and volume of fluid methods. In order to describe the wax-water system with a moving internal interface but without interpenetration of the two media, the VOF method has been used. In the VOF model, if the nth fluid’s volume fraction in the computational cell is denoted as αn, the fraction of volume is applied in the following three conditions. αn = 0, the cell is empty of the nth fluid; if αn = 1, the cell is full of the nth fluid; if 0<αn<1, the cell contains the interface between the nth fluid and one or another fluid. 28 The governing equations are elaborated as follows:
Continuity equation:

Momentum equation:


where the coefficient A (β) is the “porosity function” defined by Brent et al. 29 :

where the constant ε is a small number used to avoid division by zero. C is the mushy zone constant which is typically varied from 104 to 107. In the current study, this value is set to 105.
Energy equation:

The enthalpy of the material is defined as:

where href is the reference enthalpy, Tref is the reference temperature, cp is the specific heat, L is the latent heat of fusion, the liquid fraction β is defined by the following equations:
In the VOF method, the volume is conserved by using continuity equation:

where αn is the volume fraction of the nth fluid in the computational cell, ui is the fluid velocity.
The density (ρ), viscosity (μ) and thermal conductivity (k) of mixture are calculated as follows:

The RNG k-epsilon can be written as follows:
k-equation:

ε-equation:

where the turbulent viscosity has been expressed as follow:

The turbulent kinetic energy Gk can be expressed by the equation:

For the constants the following default values have been used:
C1ε=1.42, C2ε=1.68, Cμ=0.0845, σk=σε=0.7179.
Boundary and initialization conditions
In this model, the boundary condition on the surface of the pipeline was made adiabatic to simulate insulation. The inlet boundary was set to the inlet of the water by applying a constant temperature and flow rate. The outlet boundary was set to the outflow. At the initial time, the wax was maintained at 20°C.
Mesh and time step evaluation
In this study, a commercial CFD program Fluent was used to carry out the numerical study. The momentum, continuity and energy equations were solved using the SIMPLE pressure-velocity coupling scheme. Discretization scheme used were PRESTO for pressure, second order upwind for momentum and energy. The convergence was checked at each time step and the convergence criterion for the scaled residuals of continuity equation, momentum equation and energy equation are 10−3, 10−3 and 10−6, respectively.
The effects of gird size and time step on the solution were examined in preliminary calculations, as presented in Figure 3. Figure 3(a) shows the simulation results for three different mesh sizes namely, 38106, 46560 and 81324 cells. It was found that the differences of the liquid fraction of the wax are rather small for the whole melting process as the number of grids increasing from 46560 to 81324. As can be seen from Figure 3(b), the time steps of the 0.002 s and 0.005 s produced a similar variation of the liquid fraction of the wax. However, there was a significant difference when the time step is increased to 0.01 s. On the basis of the above gird and time independent tests, 46560 grids and 0.005 s were chosen in the present numerical calculation.

Time step and grid dependence of the numerical solution.
Model verification and validation
In order to verify the numerical model, an experimental setup was developed as shown in Figure 4. The wax which has a melting temperature of 58°C was evenly bonded on the surface of the cylinder, and the thickness was 5 mm. The heating stirrer was used to heat and stir the hot water in the beaker. A numerical simulation with the same experimental conditions was carried out to observe the melting state of wax. Figure 5 shows typical results of visualization for wax melting at 60, 120, 180 and 233 s since the start of the process. As can be seen, the melting tendency of wax in the experiment and simulation were consistent. Figure 6 shows the simulated and measured liquid fractions of wax during the melting process. It was observed that the melting time was lightly shorter in the simulation. This is because the water temperature was set to 75°C in the experiment, the heating stirrer adjusted the heating power according to the actual temperature. In the simulation, the temperature of the heating wall was set to a constant temperature. This made the water temperature lower than it was in the experiment, and causing the wax to melt more slowly.
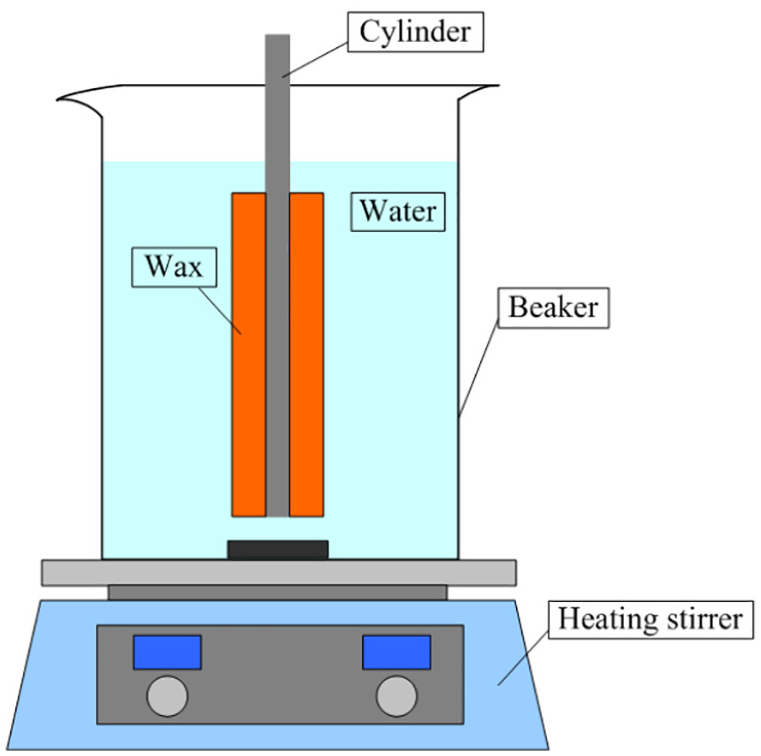
The experimental system.

Experimental and numerical melting patterns.

Comparison of the experimental and numerical liquid fractions.
Results and discussion
The melting process of the wax
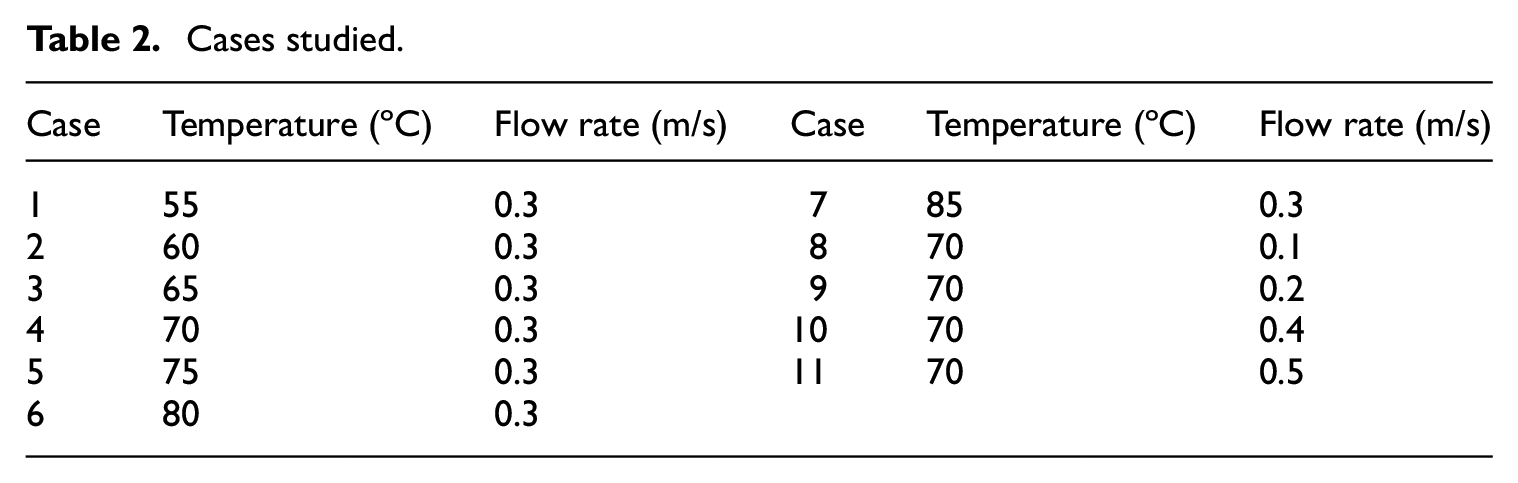
In Table 2, the values of the water temperature and flow rate which are used in the simulations are listed for easy reference. The thermal behavior and heat transfer characteristics of the wax during the melting process are investigated for case 4. Figure 7 shows the liquid fraction and liquid fraction rate of wax, which the liquid fraction is the melt fraction of wax. It is observed that the time required for the complete melting is 152 s, while half of the wax melts in the 50 s. For the melting time of 80 s, the wax melts 73%. The wax melts quickly before the liquid fraction reaches 80%, while the remaining 20% melts very slowly. The figure also shows that the liquid fraction rate increases sharply in the initial state and then rapidly decreases with increasing time and finally gently decreases to zero. The liquid fraction rate reaches a maximum value of 0.01317% per second at about 40 s.
Cases studied.

Liquid fraction and liquid fraction rate during the melting process.
Figure 8 shows the liquid fraction contours of the wax in the middle section along the length of pipeline. It is worth noting that the wax melts non-uniformity, the wax in the lower part of the pipeline melts fastest, follows by the left and right parts, and finally the wax in the upper part of the pipeline melts. At 90 s, the wax in the lower part melts completely, leaving only a small portion of solid wax in the upper part of the pipeline. However, the time required for this part of wax to completely melt as long as 40 s. The wax in the upper part of the pipeline is the most difficult part to remove during the melting process as shown in the figure.

Liquid fraction contours during the melting process.
Figure 9 shows the liquid fraction contour and velocity field of a section of pipeline along the axial direction from the inlet at 50 s. In Figure 9(a), the wax at the lower part of the pipeline almost completely melts, only a small portion of wax below the entrance not melts. Initially, the hot water flows into the pipeline from the inlet, the solid wax absorbs thermal energy and begins to melt when the temperature reaches the melting point. The liquid wax with lower density moves upward due to the buoyancy force, whereas the water with higher density flow downward due to the effect of gravity. The liquid wax is drained around under the effect of sinking of hot water, and then flows out of the pipeline with water. This process makes the hot water and solid wax in close contact, and accelerates the melting process of the wax in the lower part of the pipeline. In Figure 9(b), the velocity of hot water in the lower part of the pipeline is large, but the velocity of hot water near the wax in the upper part is very small, which weakens the convective heat transfer between the hot water and wax, further reducing the melting rate of wax. In addition, a reverse flow area can be found near the inlet of the pipeline. This is because with the decrease of wax in the lower part of the pipeline, the hot water flow from the inlet tend to flow down, the flow direction of some water is changed under the constraints of the pipeline, so a reverse flow zone is formed under the inlet. The flow rate of hot water in the reverse flow area is small, which leads to lower rate of heat transfer. As can be seen from the Figure 9(a), the wax in this area not melts completely.

At 50 s in the middle section: (a) liquid fraction contour and (b) velocity field.
Figure 10 shows the time evolution of the liquid fraction at different positions. As can be seen, the liquid fraction decreases as the distance increases at the same time. This is due to the heat is transferred from hot water to wax, the thermal potential of hot water decreases as it flow, thus the temperature difference between the wax and hot water decreases along the pipeline. Therefore, the wax which away from the inlet melts slowly at a small temperature difference. As the melting process proceeds, the change of the liquid fraction rate decreases at the same position. The figure shows that by increasing the time from 30 s to 60 s, 90 s and then 120 s, the average value of the change in liquid fraction is decreased from 0.281 to 0.154 and 0.111, respectively. As the process advances, the temperature of the wax increases, and the temperature difference diminishes which slows down the heat transfer rate. Therefore, the growth rate of the liquid fraction of the wax is weakened.

Liquid fraction during the melting process at different positions.
The effect of temperature of water for cases (1-7)
For the flow rate of 0.3 m/s of the water, the different temperatures from 55°C to 85°C are considered to investigate the effect on the melting process. The cases (1-7) of Table 2 represent these seven cases. Figure 11 shows the effect of water temperature on liquid fraction of the wax. As can be seen through the figure, increasing the inlet temperature substantially reduces the total melting time. By increasing the water temperature, the temperature difference between the wax and water increase, the temperature difference is the driving force for the heat transfer process. Therefore, increasing the water temperature leads to less melting time of wax. The time of complete melting decreases non-linearly with water temperature. By increasing the water temperature from 55°C to 65°C, the melting time is reduced from 449 s to 189 s, and is decreased by 57.9%. By increasing the water temperature from 65°C to 75°C, the melting time is reduced to 127 s, and is decreased by 32.8%. Increasing the water temperature can significantly expedite the melting rate when the temperature difference between the wax phase transition point and water temperature is small. However, the effect of increasing the water temperature on the melting rate weakens with the temperature difference ascends.

Liquid fraction versus time at different temperatures.
Figure 12 shows the time evolution of the liquid fraction rate at different temperatures. As shown in figure, the liquid fraction rate increases in the initial state and then decreases with increasing time. As the water temperature decreases, the liquid fraction rate decreases, and the time at which the maximum liquid fraction rate occurs is delayed, but they all appear around the first 1/3 of the total time. When the water temperature is 85°C, the maximum liquid fraction rate is 0.01994% per second, and when the water temperature is 55°C, only 0.00479% per second. Since the driving temperature gradient ascends as the water temperature increases, which enhances the melting rate and the liquid fraction rate also correspondingly increase.

Liquid fraction rate versus time at different temperatures.
The effect of flow rate of water (case-4 and case 8-11)
For the water temperature of 70°C, the different flow rates from 0.1 m/s to 0.5 m/s are considered to investigate the effect on the melting process. The cases (4, 8, 9, 10 and 11) of Table 2 represent these five cases. Figure 13 displays the time history of the simulated outlet temperature and liquid fraction at different flow rates. From the figure it is clear that increasing the flow rate increases the liquid fraction of the wax, and leads to the increase in outlet temperature. The total melting time is decreased by 41.8% and 36.8% as the flow rate is increased from 0.1 m/s to 0.3 m/s and then from 0.3 m/s to 0.5 m/s. It is observed that the outlet temperature initially increases rapidly and then begins to decrease and reaches its least value, and finally begins to increase towards the inlet temperature. At the beginning of the melting process, the hot water flows through the pipeline, the outlet temperature increases rapidly. As the melting progress processes, the wax absorbs the thermal potential of water due to the high temperature difference, the outlet temperature begins to decrease and reaches its minimum value. The time required for the outlet temperature drops is found to increase as the flow rate decreases. With the reduction of solid wax, the potential of the wax absorbs heat decreases which in turn increases the outlet temperature. The outlet temperature increases toward the inlet temperature and reaches water temperature when the wax is completely melted.

The outlet temperature and liquid fraction versus time at different flow rates.
Conclusions
In this paper, numerical simulations were carried out to investigate the melting process of the wax in the pipeline by the enthalpy-porosity and VOF methods. The effects of water temperature and flow rate on the melting process were analyzed. The results show that the wax in the lower part of the pipeline melts first while the upper part melts slowly, which is the weakness of the wax removal process. With the increase of water temperature, the liquid fraction and liquid fraction rate are increasing progressively. The effect on shortening the melting time of wax goes down as the water temperature increases. By increasing the water temperature from 55°C to 65°C, the melting time is decreased by 57.9%. By increasing the water temperature from 65°C to 75°C, the melting time is decreased by 32.8%. Increasing the flow rate can accelerate the melting process, but the effect of acceleration gradually decreases. The change in flow rate also affects the outlet temperature of the pipeline, the outlet temperature initially increases rapidly and then decreases to a minimum value and finally begins to increase toward the inlet temperature and remains nearly constant.
Footnotes
Declaration of conflicting interests
The author(s) declared no potential conflicts of interest with respect to the research, authorship, and/or publication of this article.
Funding
The author(s) disclosed receipt of the following financial support for the research, authorship, and/or publication of this article: This research was supported by the National Natural Science Foundation of China (No. 51534004), National Natural Science Foundation Key Incubation Project of Northeast Petroleum University (No. 2018GPZD-01), and the Graduate Education and Teaching Reform Research Project of Northeast Petroleum University (No. JYCX_CX05_2018).