
Abstract
This study aims to address the detection and classification of floating objects on water surfaces, including items such as bottles, plastic bags, aquatic plants, and dead fish, which pose significant threats to water quality and ecosystems. Traditional detection methods rely on manual observation and cleanup, which are inefficient, costly, and risky. To tackle this challenge, this paper proposes a solution based on an improved YOLOv5 s model by collecting floating object image data and constructing and processing the dataset using manual photography and SAGAN data augmentation techniques. We optimized the YOLOv5 s model by integrating the EfficientNetv2 lightweight network, the content-aware reassembly of features lightweight upsampling module, the bidirectional feature pyramid network structure, and by introducing attention modules such as squeeze-and-excitation and efficient multi-scale attention, along with the scylla intersection over union (SIoU) loss function. Additionally, transfer learning techniques were employed to enhance the model's performance in detecting floating objects on water surfaces, and ablation experiments were conducted to validate the effectiveness of each improvement. The results show that the improved YOLOv5 s model exhibits better performance and generalization ability on the test set, with a 5.27 percentage point increase in model accuracy. The model's parameter count, computational load, and weight size are 53.9%, 21.3%, and 54% of the original YOLOv5 s model, respectively, providing an efficient, accurate, and real-time solution for detecting floating objects on water surfaces. The methodology presented in this paper holds significant importance for the monitoring of aquatic ecological environments and the management of floating debris, offering valuable insights for achieving precise and efficient detection and classification of floating objects on water surfaces.
Introduction
With the advancement of industry and agriculture and the continuous development of society, an increasing amount of waste enters water bodies through various pathways, leading to a growing number of floating objects in the water. These floating objects are not limited to common items such as bottles, plastic bags, water plants, and dead fish. The decomposition of organic matter in floating debris can severely endanger water quality safety, while plastic waste can cause entanglement or ingestion by aquatic organisms, leading to death or reproductive issues in these organisms and subsequently affecting the entire food chain.1–4 Moreover, plastic waste can break down into microplastics, which can adsorb toxic substances, polluting the entire water body and further threatening drinking water safety.5–7 If these floating debris are not detected and dealt with in a timely manner, may they settle to the bottom of the water body, occupying the habitats and breeding grounds of aquatic organisms, leading to an imbalance in the ecosystem.
For water bodies such as fish ponds, lakes, and rivers that are under human supervision, the survival of fish and other aquatic organisms is an important indicator in the water management system. After fish die, if their carcasses are not promptly removed, they will undergo ammonification under the action of microorganisms and various enzymes. The pathogens carried by dead fish can spread throughout the water body along with the fats, posing a serious threat to the related organisms in the water, water quality, and drinking water safety in the surrounding areas. In addition, under certain conditions, the abnormal proliferation of water plants or algae in the water can not only lead to the death of aquatic organisms due to oxygen depletion but also reflect the abnormality of water quality to some extent, which helps managers to formulate timely countermeasures.
At present, research on the detection and identification of floating objects on the water surface is mainly divided into two directions. One is based on traditional object detection algorithms, which usually require manual design of feature extractors and classifiers and do not rely on large amounts of data, making it relatively easy to implement.8,9 However, this method is more sensitive to environmental disturbances such as lighting, occlusion, and noise, and has poor robustness. The other is based on deep learning object detection algorithms, which is one of the most advanced and effective object detection methods currently available, with the main advantages of high precision, high efficiency, and strong robustness. The protection and management of water resources is one of the significant challenges facing society today, and the threat posed by floating objects to water quality and ecosystems is becoming increasingly serious.10–12 Therefore, to effectively address this issue, it is necessary to conduct efficient and accurate detection and identification of floating objects.
The traditional method of floater detection often relies on human observation and cleaning, which has issues such as low efficiency, high cost, and high risk. Therefore, the introduction of artificial intelligence and deep learning models becomes a potential solution.13–16 Traditional machine learning-based object detection algorithms include three main steps: Region selection, feature extraction, and classifier classification. Feature extractors like HOG, 17 LBP, 18 and SIFT 19 are used to extract target features, while support vector machines (SVMs) 20 and Adaboost 21 algorithms are used for classification. Finally, the non-maximum suppression 22 algorithm is used to remove redundant frames and output the results. For example, Zhang et al. 23 used interpolation fitting to reconstruct the data and extract features to overcome the noise generated by the battery during data acquisition. Subsequently, the Swin Transformer network processed the learned features to achieve accurate state-of-charge prediction for lithium-ion batteries. Xu and Jin 24 proposed a method for detecting small sea surface targets based on multidimensional features and SVM. Features were extracted from radar echoes, and a tunable SVM classifier was designed to detect small targets against complex sea backgrounds. However, this method relies on radar equipment and is not suitable for freshwater areas. Yang 25 used the Mean Shift algorithm to segment images, estimate pollution information, and extract color moment features (in RGB and HIS spaces) and texture features (using wavelet transform) of floating objects. An SVM classifier was then employed for classification. Yu et al 26 converted images from the RGB to the HSV space to enhance the contrast between reflections and the water surface. Target contours were extracted through morphological calculations, and target detection was performed based on the aspect ratio of the contours.
The superiority and convenience of deep learning methods have led to their increasingly widespread application in more fields.27,28 Deep learning-based object detection algorithms are among the most advanced and effective methods, offering high precision, efficiency, and robustness. They have been widely used in fields such as face recognition, 29 vehicle detection 30 and automatic driving. 31 YOLO series algorithms32–34 have better real-time performance compared to two-stage detection algorithms like R-CNN 35 and Faster R-CNN. 36 Among them, YOLOv5 s37–39 has gained attention for its fast detection speed and high accuracy. For example, Wang et al. 40 proposed a lightweight MSCCR module integrated into the YOLOv5 s backbone network, reducing model parameters and improving accuracy. Liu and Liu 41 proposed an improved method for real-time apple detection based on YOLOv5 s, incorporating coordinate attention blocks and a bidirectional feature pyramid network to enhance small target detection.
However, YOLOv5 s needs to be improved to enhance its performance and applicability in detecting floating objects in water. At the same time, transfer learning, as an important machine learning technology, has unique advantages in addressing issues like sample scarcity and domain transfer. Through transfer learning, existing data and knowledge can be transferred from the source domain to the target domain, improving the model's generalization ability and performance on the target task. In the task of floating objects detection, transfer learning can effectively utilize existing data and models to quickly locate and identify floating objects in waters, thus improving detection accuracy and efficiency. In summary, this study aims to combine the improved YOLOv5 s model and transfer learning technology to propose a new method for detecting floating objects in waters. By optimizing the network structure and training strategy of the YOLOv5 s algorithm and applying the concept of transfer learning, the goal is to improve the accuracy, stability, and adaptability of floating objects detection, providing more efficient and reliable technical support for water environment monitoring and protection. Through the implementation of this study, it is expected to promote the development of intelligent water management and floating matter monitoring technology, and provide stronger guarantees for environmental protection and water resources management.
Test data
Image data acquisition
The main data involved in this paper is about floating objects on the surface of the water. It mainly detects and classifies floating objects on the surface of the water. According to floating objects that frequently appear on the surface of the water, the floating objects are divided into four categories, including bottles, plastic bags, aquatic plants, and dead fish. These categories basically include the types of garbage that often appear on the water surface and can pose a threat to the ecological environment of the water. The detection of floating objects on the water surface is different from conventional target detection, the water surface environment is relatively complex, the reflection of the water surface, reflection, ripples, etc., will interfere with the detection, and the volume of these floating objects is relatively small, in the practical application detection, the floating objects are in the surveillance camera screen. Secondly, another research object of this paper is the pollutants on the water surface of rivers, such as naturally shed branches, eutrophic algae and other pollutants.
According to the characteristics of floating objects on the surface, the collection of relevant data sets is carried out. Since there is no official data set about the surface target, this paper collects the data set by manual shooting means, selects the environment such as river, lake and pond, and shoots the above four types of floating objects from different angles and in different weather. The collected data is filtered to remove images with high similarity and poor sharpness. The filtered image is shown in Figure 1. In this paper, 3000 images of floating objects on the water surface are uniformly cut to 640 × 640 size.
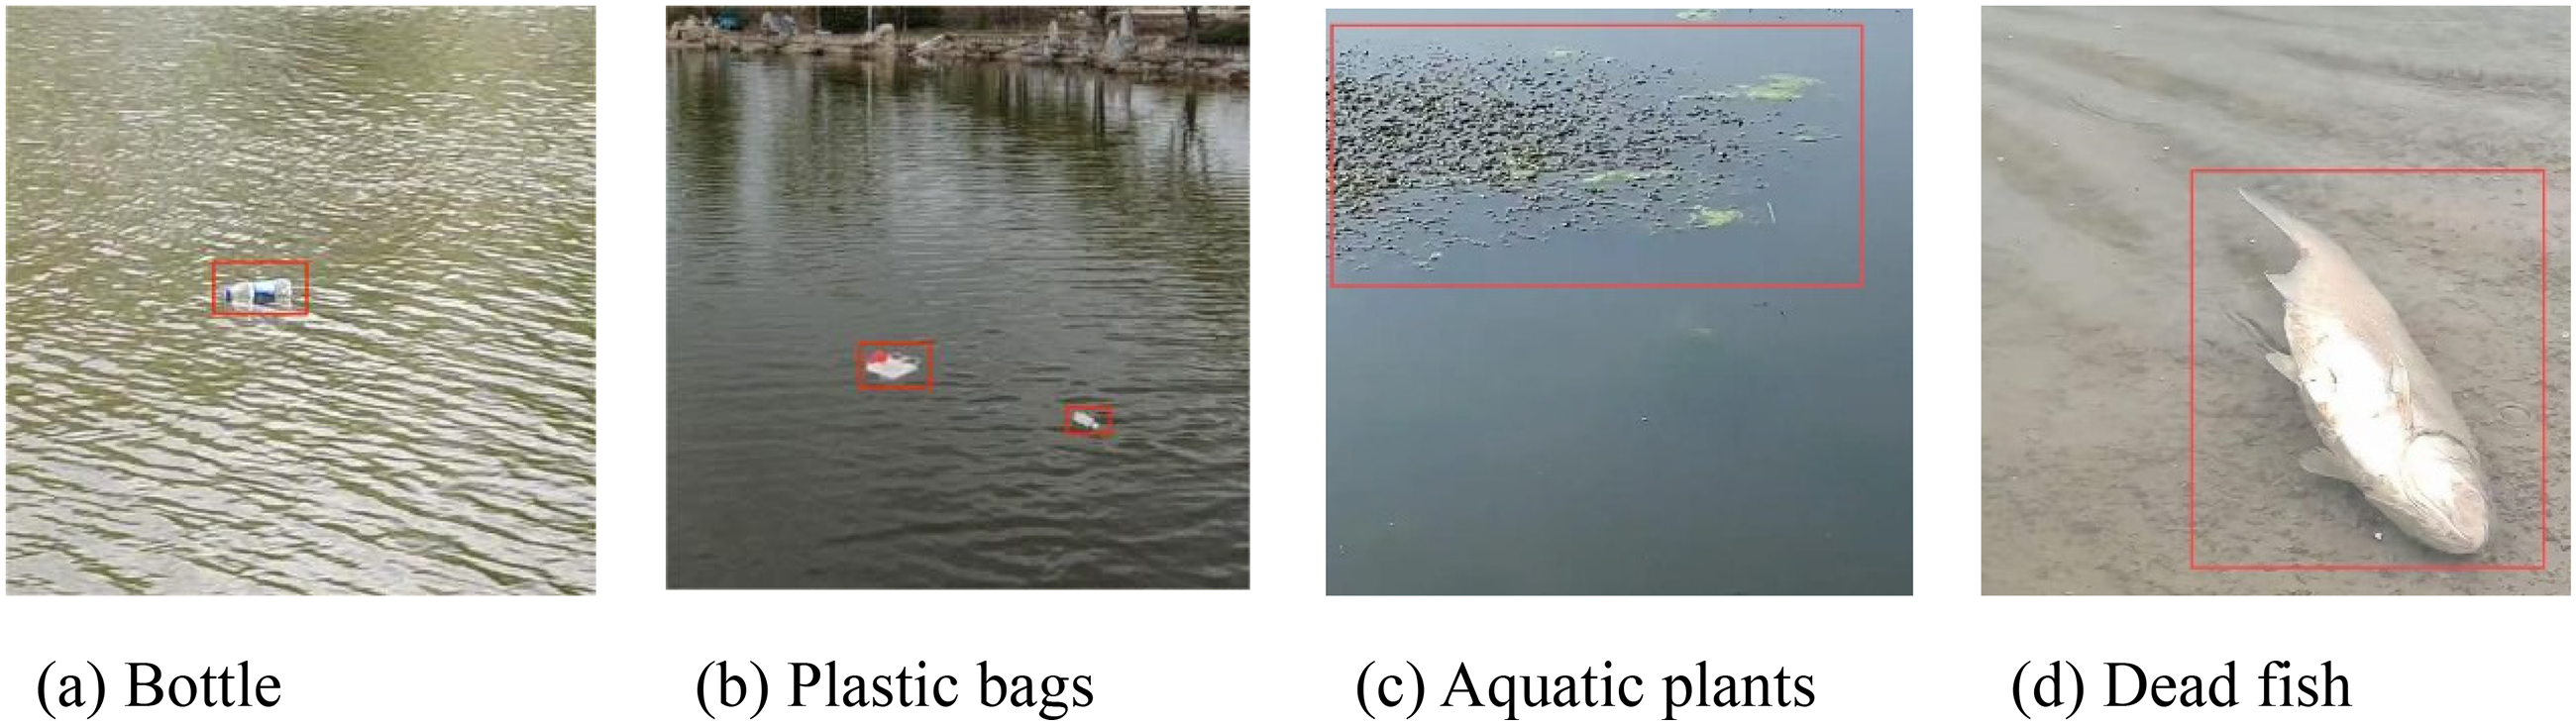
Image of floating objects on the surface.
Image data enhancement
From 3000 images of floating objects obtained, the clearer images were selected as the original data set, and the training set and test set were divided by 9:1 ratio. Image data enhancement is performed using SAGAN, 42 in which a non-local model is adopted, allowing the generator and discriminator to effectively construct the relationship between various regions and directly calculate the relationship between two pixels. The self-attention mechanism simply calculates the response of a single location in the feature-weighted sum of all locations. This mechanism allows the network to focus on regions that are scattered in different locations but are structurally related. 43
The principle is that in the generation network, the prior input noise and condition information are combined to form a multi-mode vector, which is sent into the generation network as input representation information. The category label is introduced into the discrimination network to judge not only the truth or falsity of the picture, but also whether the generated category matches the category of the input picture. Finally, a total of 28,366 images were generated, the original image size was uniformly adjusted to 640 × 640, and then the graphics were normalized
Method
YOLOv5 s object detection model
YOLOv5 is based on the previous YOLO series of algorithms to improve the detection performance. In particular, in the PASCALVOC and COCO target detection tasks, YOLOv5 s demonstrated excellent results, striking a good balance between detection accuracy and speed. Compared with YOLOv4, YOLOv5 model adopts CSP structure not only in Backbone, but also in Neck to retain richer feature information, thus enhancing the feature fusion capability of the network. The YOLOv5 series includes four network models of different sizes: YOLOv5 s, YOLOv5 m, YOLOv5 l and YOLOv5x. Among them, YOLOv5 s is the network with the shallowest depth and the smallest width of feature map, and other versions are further deepened and widened on the basis of it.
YOLOv5 s consists of four parts: Input, backbone, neck and output. The input terminal consists of Mosaic data enhancement, 44 adaptive picture scaling and adaptive anchor frame calculation. The backbone network is responsible for extracting target features, which is mainly composed of slice structure, 45 cross-stage local network unit 46 and spatial pyramid pool. 47 The Focus slice structure slices the input horizontally and horizontally and then splices it. The W and H dimension information is gathered in the channel space, which improves the receptive field and reduces the computation amount. The CSP1_X unit is a Bottleneck module consisting of several classical residual structure modules. After convolution, the input is merged with the original value to enrich the gradient features, and the feature transfer is completed while the output depth is guaranteed. The SPP module uses the maximum pooling method to assemble three different scale feature maps for the input to achieve multi-scale fusion. The neck network is mainly responsible for feature fusion. Through the top-down and bottom-up feature transfer methods, the features at all levels are effectively fused, 48 then passed into the detection layer, and the final detection result is obtained through post-processing operations such as non-maximum suppression.
Compared to the currently widely adopted YOLOv8, 49 YOLOv5 s is simpler and more structured, striking a balance between model reasoning speed and detection accuracy. Especially for the need to quickly obtain the characteristics of floating objects, YOLOv5 s is a good choice. However, the original YOLOv5 s algorithm has the problems of low precision and slow reasoning speed on the floating object data set. Therefore, this study began to improve the YOLOv5 s model to achieve rapid and accurate identification of floating objects.
Model improvement
EfficientNetv2 lightweight network
EfficientNetv2, proposed by Shi et al., 50 is a lightweight CNN network improved upon EfficientNet. Compared to EfficientNet, EfficientNetv2 achieves faster training and inference speeds while maintaining comparable accuracy and parameter counts. Although EfficientNet extensively employs depthwise convolutions—which reduce parameters and computations compared to standard convolutions—the use of DW convolutions in shallow network layers leads to slower processing and underutilization of GPU capabilities. To address this issue, EfficientNetv2 replaces the shallow MBConv structures in EfficientNet with Fused-MBConv structures. Specifically, the 1 × 1 expansion convolution and 3 × 3 DW convolution in the main branch are replaced with a single 3 × 3 standard convolution. The squeeze-and-excitation module 51 is embedded to enhance channel-wise feature extraction.
EfficientNetv2 utilizes neural architecture search technology to explore the optimal combination of MBConv and Fused-MBConv modules, balancing speed and performance to derive the EfficientNetv2-B0 architecture as outlined in Table 1. In the table, the numbers following MBConv and Fused-MBConv indicate the feature channel expansion ratios. Notably, during the actual implementation of EfficientNetv2-B0, the squeeze-and-excitation (SE) module is omitted in the shallow Fused-MBConv structures.
EfficientNetv2-B0 structure.

Layers denotes the number of times the MBConv or Fused-MBConv structure is repeated in that stage; Stem contains a 3 × 3 normal convolution with a step size of 2 and BN layer and a Swish activation function; SE stands for using the SE module and 0.25 is the SE_ratio.
In the specific implementation, the input image is first subjected to preliminary feature extraction through a stem layer composed of a 3 × 3 convolution with a stride of 2. Subsequently, Fused-MBConv and MBConv modules are sequentially stacked. For shallow layers, the Fused-MBConv structure is adopted (replacing the original depthwise convolution with a standard 3 × 3 convolution), while the deep layers retain MBConv and embed squeeze-and-excitation modules to enhance channel-wise feature responses. To align with the feature map dimensions of YOLOv5 s, the number of output channels at each stage is adjusted to ensure compatibility with the neck network. During training, a dynamic learning rate decay strategy is employed, with an initial learning rate set to 0.01. This is combined with the cosine annealing algorithm to optimize gradient update directions, alongside the introduction of label smoothing techniques to mitigate class imbalance issues.
Content-aware reassembly of features (CARAFE) lightweight upsampling module
The upsampling operation can be interpreted as feature recombination through the dot product between the upsampling kernel at each position and the corresponding neighborhood pixels in the input feature map. The most commonly used upsampling methods, such as nearest-neighbor and bilinear interpolation, determine the upsampling kernel solely based on the local neighborhood of pixels. These methods fail to leverage the global semantic information of the feature map and exhibit limited receptive fields, hindering effective extraction of global image features. To better utilize the global features around pixels during upsampling, this study replaces the original upsampling module in the YOLOv5 s model with the lightweight CARAFE upsampling module, 52 as illustrated in Figure 2.

CARAFE lightweight upsampling module. Note: CBS denotes the convolutional layer consisting of convolution, BN, and SiLU activation functions; Kup is prediction of the upsampling kernel size; σW is the width of the feature map after upsampling; and σH is the height of the feature map after upsampling; Cm is the number of feature channels after dimensionality reduction; ke is the convolution kernel size of the convolutional layer.
In the implementation, the input feature map is first reduced to Cm dimensions via a 1 × 1 convolution. A dynamic upsampling kernel with a size of Kup =5 is then predicted through a convolutional layer with ke =3. The predicted kernel is normalized using Softmax and applied to the nearest-neighbor upsampled feature map through position-wise dot products, enabling content-aware feature recombination. During training, the He initialization method is employed to optimize convolutional layer parameters, and a feature map reconstruction constraint term is added to the loss function to ensure kernel stability. Experimental results demonstrate that the CARAFE module effectively enhances the recovery capability of small target features while introducing only 1.3 × 10⁵ additional parameters.
CARAFE lightweight up-sampling module consists of up-sampling kernel prediction module and feature recombination module. The feature map is first passed into the up-sampled kernel prediction module, and the channel number of the feature layer C is reduced to Cm after passing through a CBS convolutional layer with convolution kernel of 1 × 1, as shown in the formula:
where σ is the up-sampling multiple and Kup is the up-sampling kernel size.
For the input feature graph after channel compression, a convolution layer with the convolution kernel size of ke × ke is used to predict the upper convolution kernel, and the number of output channels is σ2K2up. Then PixelShuffle method is used to expand the channel dimensions in spatial dimension to obtain the upper sampling kernel with the shape of σH·σW·K2up. Use the Softmax activation function to normalize processing. For the feature map of the input feature recombination module, the up-sampling result is obtained by the dot product of the nearest up-sampling and the predicted up-sampling. Because CARAFE lightweight up-sampling module has a large receptor field during recombination, it can generate corresponding up-sampling kernel according to input features, which has content perception ability and improves the weight of the target of concern. Compared with the nearest neighbor up-sampling method, it improves the feature extraction ability of up-sampling operation under the premise of introducing few parameters and calculation amount.
PANet was replaced with bidirectional feature pyramid network (BiFPN) structure
In the water surface floating object dataset, some floating objects are inherently small or captured from long distances, resulting in limited target areas. Although YOLOv5 s employs the PANet structure for feature extraction, it still suffers from missed detections and false positives. To improve detection accuracy for small targets, the original PANet structure is replaced with BiFPN.
53
In PANet, only a single top-down path and a single bottom-up path are utilized. In contrast, BiFPN treats each bidirectional path as a feature network layer and repeatedly stacks them to achieve higher-level feature fusion. Additionally, BiFPN introduces an extra path between the original input and output nodes, enabling the fusion of more features without significantly increasing computational costs. PANet's feature fusion relies on simple feature map addition without distinguishing contributions from input feature maps. However, input feature maps with varying resolutions contribute unequally to fusion, making naive addition suboptimal. To address this, BiFPN incorporates a weighted feature fusion mechanism, as expressed by the equation:
In the formula, the value of ε is 0.0001, its function is to ensure that the denominator is not 0 to ensure the stability of the value, Wi is the weight range between,0,1 Ii is the input feature map.
In the implementation, BiFPN constructs a multi-level feature pyramid through bidirectional cross-node connections and introduces learnable weight coefficients wi during feature fusion. During training, group normalization and L2 regularization strategies are applied to prevent weight overfitting. Additionally, skip connections are incorporated into the cross-node paths to preserve original feature information. This method aligns with the global multiscale feature fusion module (GMFFM) proposed by Liu et al., 54 which leverages multiscale receptive fields and attention mechanisms to capture both local and global contextual information.
Introduction attention module
To enhance feature selectivity, SE, efficient channel attention (ECA), and efficient multi-scale attention (EMA) attention modules are embedded at critical positions in the backbone network. Specifically: The SE module generates channel-wise weights through global average pooling (GAP) and fully connected layers, embedded at the end of MBConv modules. The ECA module replaces the fully connected layers in SE with 1D convolutions, reducing parameter count while capturing cross-channel interactions. The EMA module employs a multi-branch architecture for multi-scale feature aggregation. Its 1 × 1 branch encodes spatial information via 2D global pooling, while the 3 × 3 branch extracts local detail features. The two attention maps are fused through matrix multiplication. During training, the group number (G) for the EMA module is set to 8, and the initial learning rate is reduced to 0.001 to prevent gradient explosion.
SE
SENet 55 is a channel attention mechanism whose main operations are squeeze and excitation. Before the input image passes through the attention mechanism module, each channel of the feature map has the same importance, and after passing SENet, the importance of each feature channel is different. For the neural network, the channel with a large weight value will be focused. The implementation process of SE attention mechanism in neural network is as follows: (1) Squeeze: Global pooling is adopted, that is, H and W are compressed to 1 × 1, and a weight value is used to represent a channel to achieve low-dimensional embedding, with input H × W × C and output 1 × 1×C. The compressed feature is essentially a vector, with no spatial dimension, only channel dimension. (2) Excitation: Generate a weight value for each feature channel. The correlation between the channels is constructed through two fully connected layers. The number of output weights is the same as the number of channels in the input feature map. The input is 1 × 1×C and the output is 1 × 1×C. (3) Scale: Multiply the normalized weights with corresponding channels and apply them to the features of each channel. The input is H × W × C and 1 × 1×C, and the output is H × W × C.
ECA
ECA 56 attention mechanism and SE attention mechanism are both channel attention mechanisms. By weighting different feature maps, the model pays more attention to features that contribute to target detection. However, since dimensionality reduction operations in SENet have side effects on the channel attention mechanism, capturing the dependencies between all channels is inefficient and unnecessary. ECA improves on the SE attention mechanism by using a 1 × 1 convolution layer directly after the GAP layer, eliminating the fully connected layer, avoiding dimensional reduction, and effectively capturing cross-channel interactions, with only a few parameters involved to achieve good results. ECA module first performs GAP on the last convolution output, adopts one-dimensional convolution to rapidly capture the cross-channel information interaction between each channel and its nearly K adjacent channels, and obtains the learnable weight coefficient of each channel through Sigmoid activation function. Then the weights are applied to each channel of each original feature map to generate the weighted feature map.
EMA
In this paper, EMA
57
mechanisms were introduced in the Backbone of YOLOv5 s to improve the weight of important features and reduce the weight of irrelevant features such as matrix and cavity disk edge, thereby improving the accuracy of model detection. The structure of EMA's attention mechanism is shown in Figure 3. The EMA attention mechanism consists of a 1 × 1 branch, a 3 × 3 branch and a cross-spatial learning module. For any given input feature map, we assume:

Efficient multi-scale attention (EMA) attention mechanism. Note: Re-weight is the adaptive feature variable selection module; Groupnormalization denotes group normalization; Matmul denotes matrixmultiplication.
where, C, H and W are the number of channels, height and width of the input feature map respectively.
EMA divides X into G sub-features according to the cross-channel dimension direction for learning different semantics, where the group style can be defined as:
In the formula, G≪C.
To capture the dependencies between all channels and reduce the computational overhead, EMA uses two one-dimensional global averaging pooling operations to encode channels in both spatial directions in the 1 × 1 branch, stacking only one 3 × 3 kernel in the 3 × 3 branch to capture multi-scale feature representations. In EMA, a cross-spatial information aggregation method with different spatial dimensions can achieve richer feature aggregation. First of all, two tensors where one is the output of the 1 × 1 branch and the other is the output of the 3 × 3 branch. Then, the output of the 1 × 1 branch is encoded with global spatial information using two-dimensional GAP, and the output of the smallest branch is directly transformed into the corresponding dimensional shape before the joint activation mechanism of channel features, namely:
The two-dimensional global pooling operation formula is: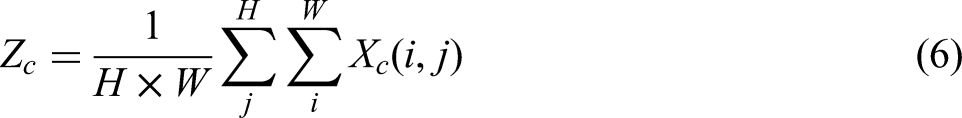
where Xc represents the input feature of the C channel
In order to improve the computational efficiency of the model, Softmax is used to fit the above linear transformation at the output of two-dimensional global averaging pooling. The first spatial attention diagram is obtained by multiplying the output of the above parallel processing with the matrix dot product operation. Similarly, two-dimensional global averaging pooling is used to encode global spatial information for 3 × 3 branches, and 1 × 1 branches are directly transformed into corresponding dimensional shapes before the joint activation mechanism of channel features, namely:
On this basis, we derive the second spatial attention diagram which retains the exact spatial position information. Finally, the output feature plots within each group are computed as a set of two generated spatial attention weight values, and then the Sigmoid function is used to capture pixel-level pair relationships and highlight the global context of all pixels.
Replace complete intersection over union (CIoU) with scylla intersection over union (SIoU) loss function
The CIoU loss function adopted in YOLOv5 s incorporates the aspect ratio of bounding boxes as a scale-related penalty term but neglects the directional mismatch between predicted and ground-truth boxes, leading to slower convergence and reduced efficiency. To address this limitation, this study employs the SIoU loss function proposed by GEVORGYAN. 58 The SIoU loss consists of four cost functions: Angular, distance, shape, and intersection over union. The angular cost function first predicts alignment along the X or Y axis and then prioritizes minimization of the angle α (if α≤π/4) or β (otherwise) during convergence. A progressive weighting strategy is applied during training, emphasizing angular and distance optimization in early stages and strengthening shape constraints in later phases. Experimental results demonstrate that SIoU improves model convergence speed by 18% and increases average precision by 0.49 percentage points. A schematic diagram of the angular cost calculation is illustrated in Figure 4. The improved YOLOv5 s model structure is shown in Figure 5.

Schematic diagram of angular costing. Note: (bcx,bcy) is the center point of the prediction frame; (
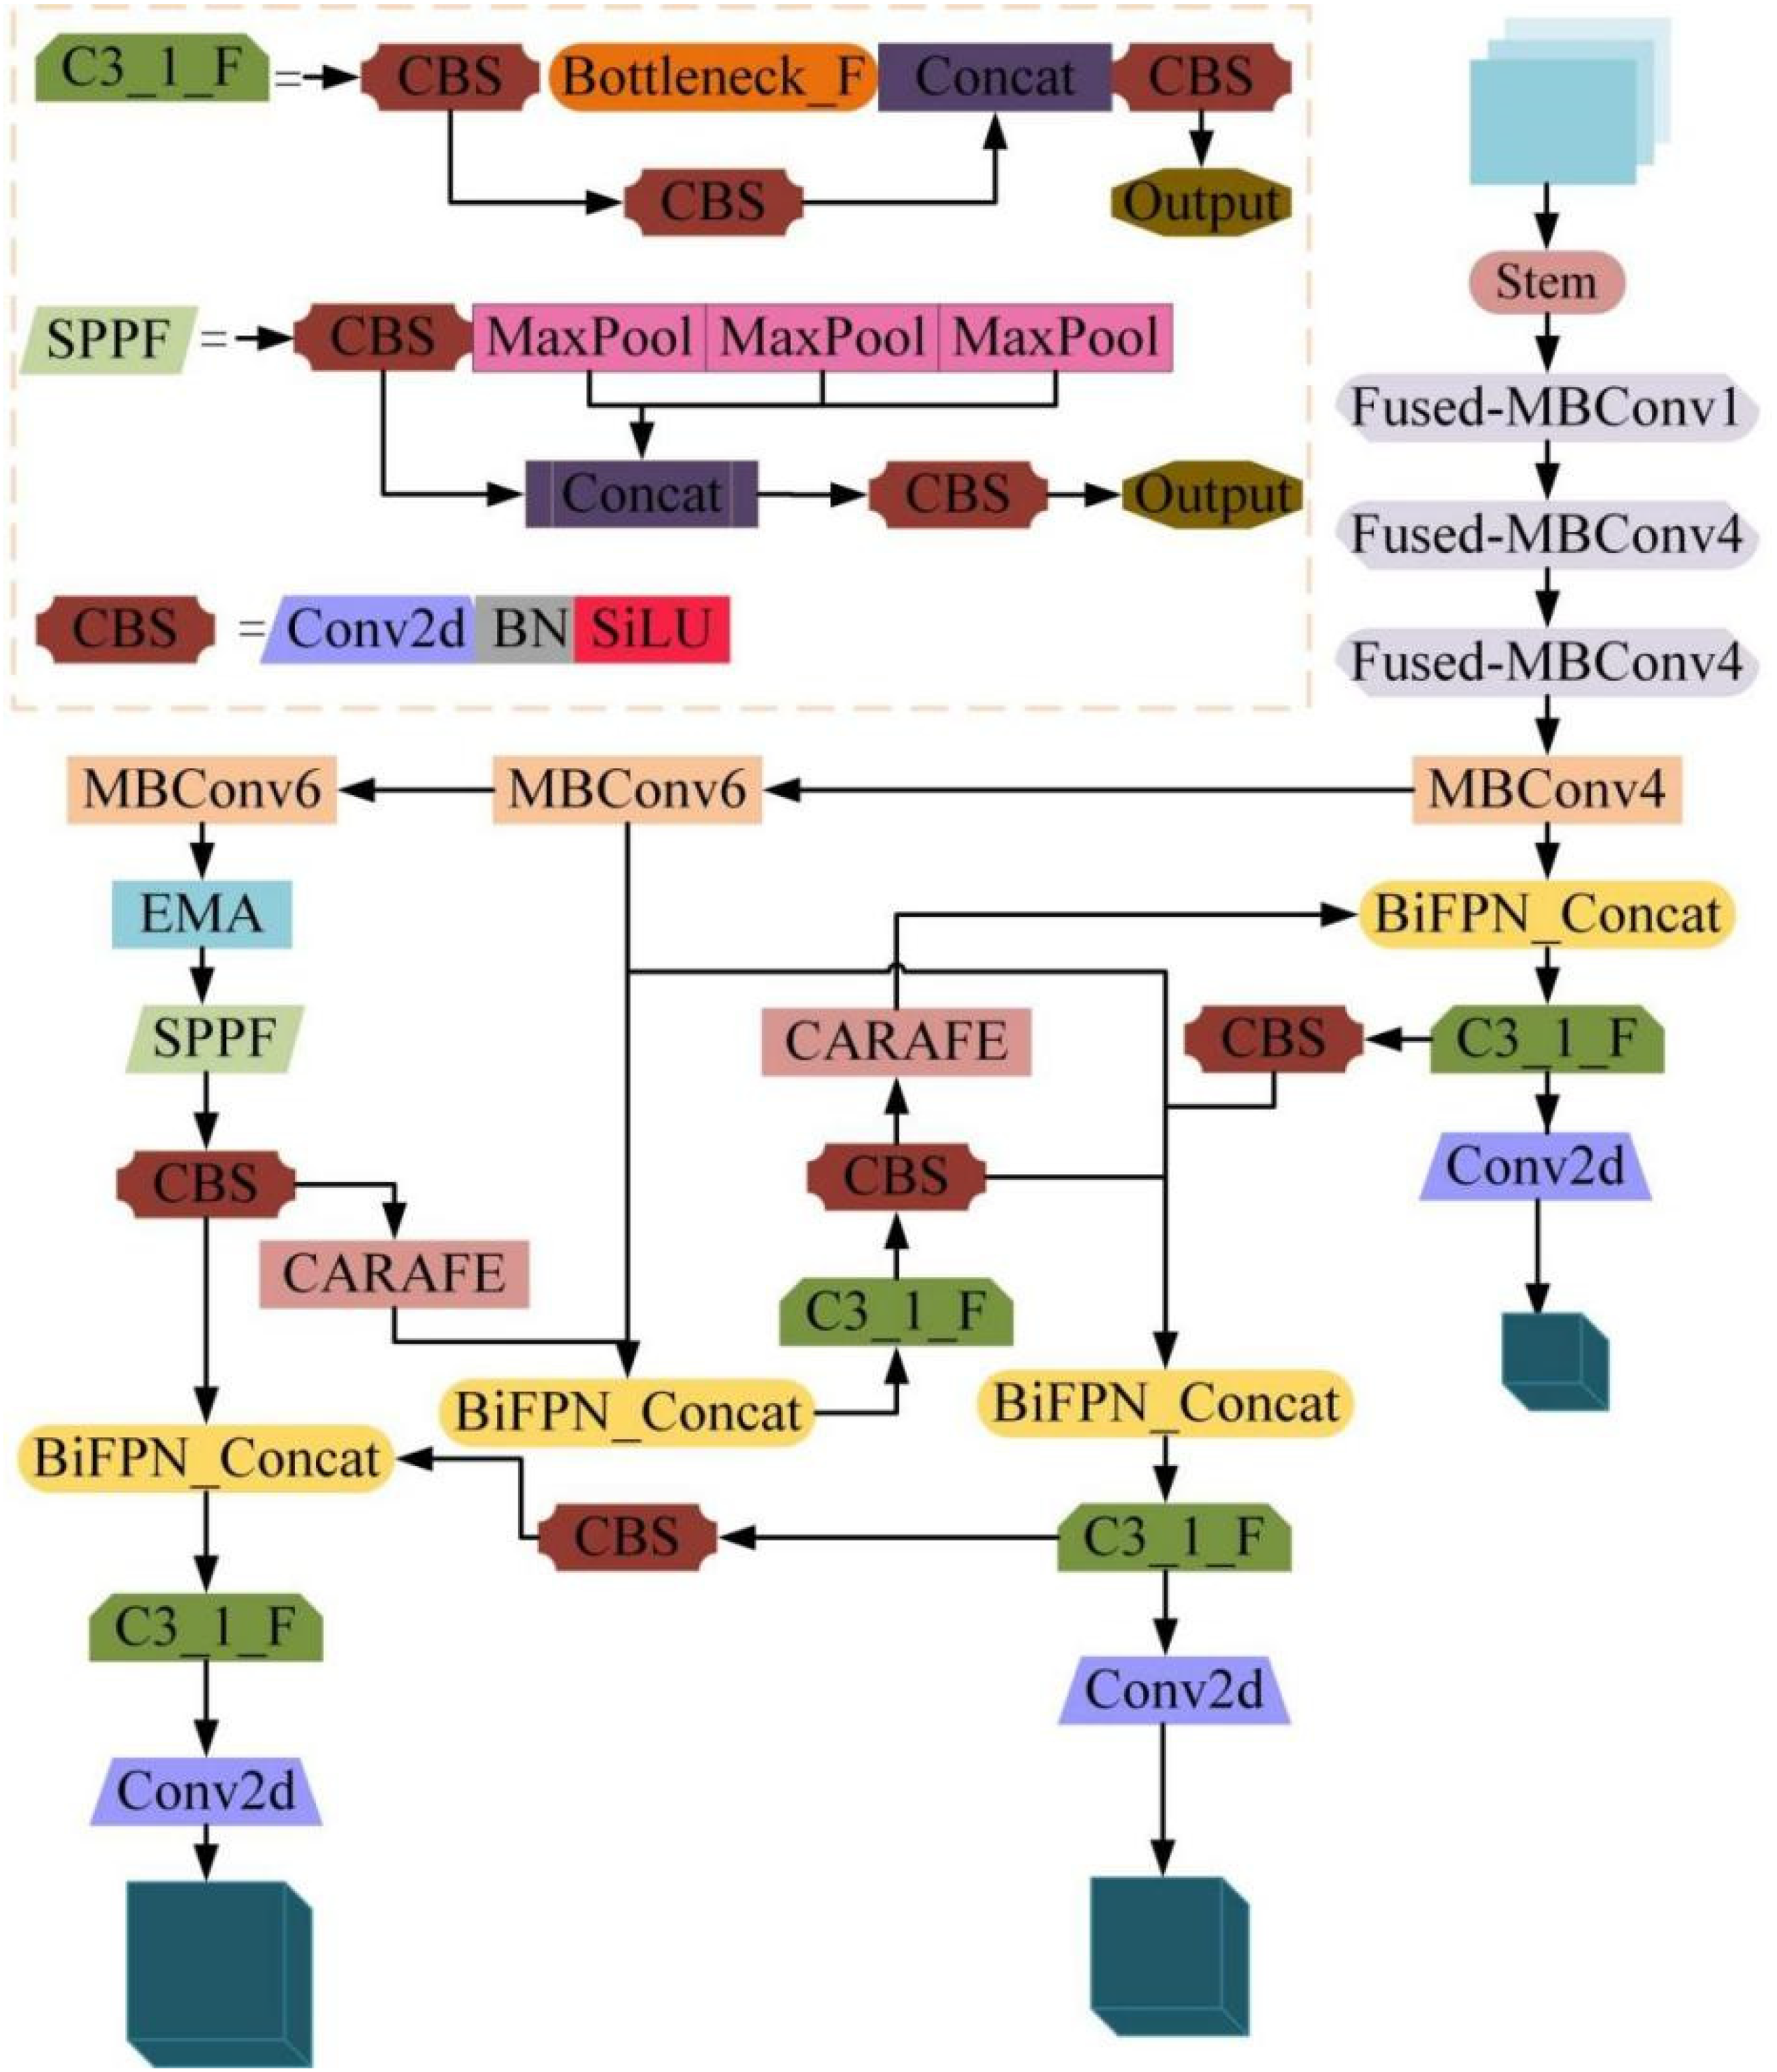
Improve the network structure of YOLOv5 s algorithm. Note: EMA denotes the EMA attention mechanism module; SPPF is the spatial pyramid pooling module; CARAFE is a lightweight upsampling module; BiFPN_concatis a feature fusion module using the BiFPN structure; C3_1_F is a C3 module using a shortcut-free branching bottleneck structure.
The angular cost function Λ is as follows:

The distance cost function Δ is shown in the equation:

where, (bcx, bcy) is the central point of the prediction box,
As can be seen from the above formula, when α approaches 0, distance cost contribution decreases. As α approaches π/4, the distance cost function Δ increases. As the Angle increases, gamma is given time priority.
The shape cost function Ω is as follows:

where wgt and hgt are the width and height of the true box
The θ value defines the shape cost, with the θ value approaching 4 in the test, and the SIoU loss function defines the θ value range.2,6 The frame loss function Lbox is:
The total loss function L consists of classification loss Lcls and frame loss Lbox, as follows:
where Lcls is the focus loss, Wbox and Wcls are the frame and classification loss weights, respectively.
Transfer learning
The object detection task in deep learning requires a large number of samples with completed data annotation to train the model, improve the model fitting effect, and accelerate the model convergence speed. However, due to the small number of samples in the floating objects data set, overfitting is easy to occur during training. To solve this problem, transfer learning method is adopted to solve the problem of easy overfitting under the condition of small samples.59–61
By fully training the network on a large data set, transfer learning 62 enables the network to learn a large number of features required for image classification and recognition, and then applies the learned features to new learning tasks, so that the network can achieve better recognition and classification after simple training. The convolutional layer weights and parameters trained by YOLOv5 s network on ImageNet were transferred to the improved YOLOv5 s floating object detection model as the initial weight parameters of the model, so as to solve the problem of small sample data and improve the generalization ability of the model and the network training speed. The collected data set of pollutants along river banks is selected as an auxiliary domain, and the weight transfer of the model is realized through pre-training. The data in the auxiliary domain is used to help the model better learn the characteristics of floating objects, improve the performance of the model in the task of recognizing floating objects, and improve the recognition effect of floating objects. The pollutants along river banks are shown in Figure 6.
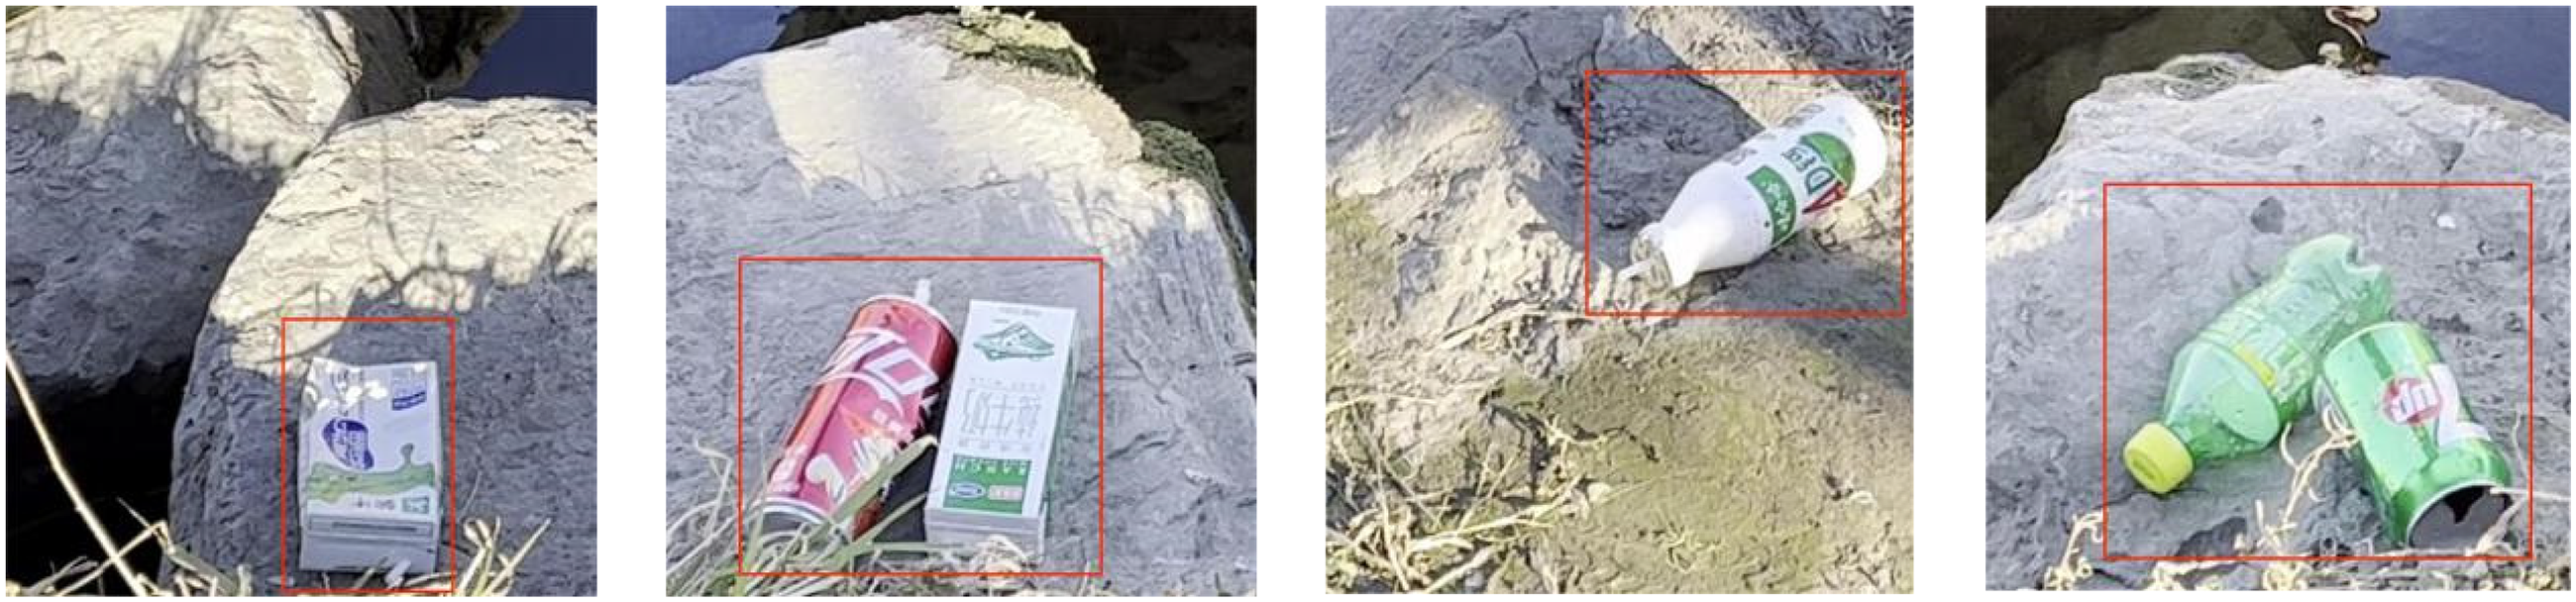
River bank pollutant map.
It is reasonable to analyze and select the river bank pollutant data set as an auxiliary domain to assist the detection of floating objects on the water surface. Considering the co-existence of river bank pollutants and surface floaters in the natural environment, they may be similar in shape, color, texture, etc., which makes the features learned in the pre-training data set of river bank pollutants transferable and help improve the performance of the surface floaters detection task. Pollutant data sets along river banks are usually easier to obtain and label, so they can provide rich training samples, which is crucial for deep learning models. More training data can help models learn more comprehensive and robust features, thus improving the generalization ability and stability of models. Pre-training can also help the model learn general visual features and knowledge on the river bank pollutant data set, such as edge detection, shape recognition, etc. These features and knowledge may still be valid in the subsequent floaters detection task, thus enhancing the model's migration ability and performance. In addition, river bank pollutant data sets usually contain a variety of different environmental conditions and scenarios, and such diverse data sets help the model better adapt to the various complex environments that may occur in the actual surface floaters detection task. Figure 7 shows the transfer learning diagram of floater detection.

Floating object detection transfer learning diagram.
Evaluation index
The deepening and widening of the network can usually improve the performance of the model, but it also increases the calculation amount and volume of the model,
63
which is not conducive to combining the equipment such as monitoring around the water area, surface garbage fishing vessels, and drones after the deployment of the model. Therefore, in order to verify the performance of the recognition method proposed in this paper, P (Precision) and F1 values are used to evaluate the recognition performance of the network,
64
and the frames per second (FPS) representation model is used to detect the performance in real time.
65
Calculation formula:


where TP is the positive sample predicted as the positive sample; FP: negative sample predicted to be positive sample; FN: positive sample predicted to be negative sample; TN is predicted to be the negative sample of the negative sample; P is the accuracy rate; R (recall) is the recall rate; F1 value is the harmonic average of accuracy rate and recall rate; ACC (accuracy) indicates the accuracy of the model. By comparing the Loss curve of the disease recognition model on the test set and the standard deviation value of the curve after the accuracy curve convergence, the overfitting of the model was evaluated.
Test environment configuration and parameter setting
This study utilizes an experimental platform based on an Intel Xeon Gold 5118 processor, 16GB RAM, and an NVIDIA GeForce RTX 2080 SUPER GPU (8GB VRAM), running on the Windows 10 operating system. The software environment is managed via Anaconda with Python 3.7, and incorporates the CUDA 11.0 programming platform along with the cuDNN 8.0 acceleration library to support the TensorFlow 2.4 deep learning framework. CUDA, as NVIDIA's GPU parallel computing architecture, efficiently accelerates large-scale numerical computations, while cuDNN optimizes low-level operations commonly used in deep neural networks (such as convolution and pooling). Together, they significantly enhance computational efficiency in model training and inference.
Parameter setting: In the training process, the size of the network input image of the target detection model is 640 × 640, the batch size is set to 16, and the number of training rounds is set to 300.The initial learning rate is set to 0.01, the momentum to 0.9, and the attenuation learning rate to 0.0005. The warm up strategy is adopted for training. The learning rate climbs linearly to the initial learning rate in the first three rounds of training and then slowly decreases. The default configurations of other hyperparameters are adopted in the hyp.scratch.yaml configuration file of YOLOv5 s.
Result analysis
Ablation experiment results
Abstraction experiments are a method of evaluating the impact of specific components on model performance by incrementally removing or adding them. Through these experiments, authors can clearly demonstrate the specific contributions of each improvement to model performance, thereby validating their effectiveness and necessity. This not only helps readers better understand the model optimization process but also enhances the scientific rigor and persuasiveness of the research. The results are shown in Table 2.
Results of ablation test with improved mechanics.

Through six experiments optimizing the YOLOv5 s model, significant performance improvements were achieved. Replacing the loss function with SIoU increased model accuracy by 0.49 percentage points without adding parameters. Substituting the original feature extraction network with EfficientNetv2's Backbone resulted in a 1.21 percentage point increase in accuracy, halving the parameters and weights while reducing computation by 80%. Introducing BiFPN boosted accuracy by 1.63 percentage points with a slight increase in parameters. Using CARAFE upsampling enhanced accuracy by 0.91 percentage points, adding 1.3 × 10⁵M parameters and 0.29MB to the weights. Adding the EMA attention mechanism further increased accuracy by 1.03 percentage points with a slight weight increase. Based on the results, the optimized YOLOv5 s model has 53.9% of the original parameters, 21.3% of the original computation, and 54% of the original weight size.
The effect of training mode and learning rate on the model
On the extended data set, when new learning and transfer learning were adopted, the initial learning rate was set as 0.01, 0.001, 0.0001, the training times were 300, and the attention module was EMA, the Loss curve of the model on the test set was shown in Figure 8. As shown in Figure 8, the transfer learning model tends to converge after 50 rounds of training on the expanded data set, while the newly learned model tends to converge after 150 rounds of training. The model converges faster under transfer learning, becomes more stable after convergence, and has stronger generalization ability.

Loss and accuracy curves under different initial learning rates.
When the learning rate is 0.001, the model accuracy is the highest, but the standard deviation of Loss curve and accuracy curve are also large, and the stability of the model after convergence is weaker than that when the learning rate is 0.0001. Therefore, when the learning rate is 0.0001, combined with transfer learning, the model accuracy rate increases by 7–12 percentage points, the Loss curve and the accuracy curve are smoother, the standard deviation of the model accuracy curve is reduced by 80% at most, and the model stability is better.
The effect of data augmentation on the model
For extended and unextended data sets, combined with transfer learning and new learning training methods, the learning rate is 0.0001, other hyperparameters are the same, the number of training rounds is 300, and the attention module is EMA, the accuracy curve of the model on the test set is shown in Figure 9(b).As can be seen from Figure 9, under the two different learning methods, the accuracy curve of the expanded data set is more stable, the curve gradually increases, the fluctuation amplitude gradually decreases, and no obvious overfitting phenomenon occurs. When the learning rate is 0.0001, the recognition performance of the model on the test set on different data sets. When transfer learning is adopted, on the expanded data set, the accuracy curve of the model has a better convergence effect, and the standard deviation after convergence is smaller, which alleviates the overfitting phenomenon of the model and enhances the generalization ability of the model. Compared with the unexpanded data set, the recognition accuracy rate of floating objects is increased by 17.16 percentage points on average, and the loss value is decreased by 0.19 on average.
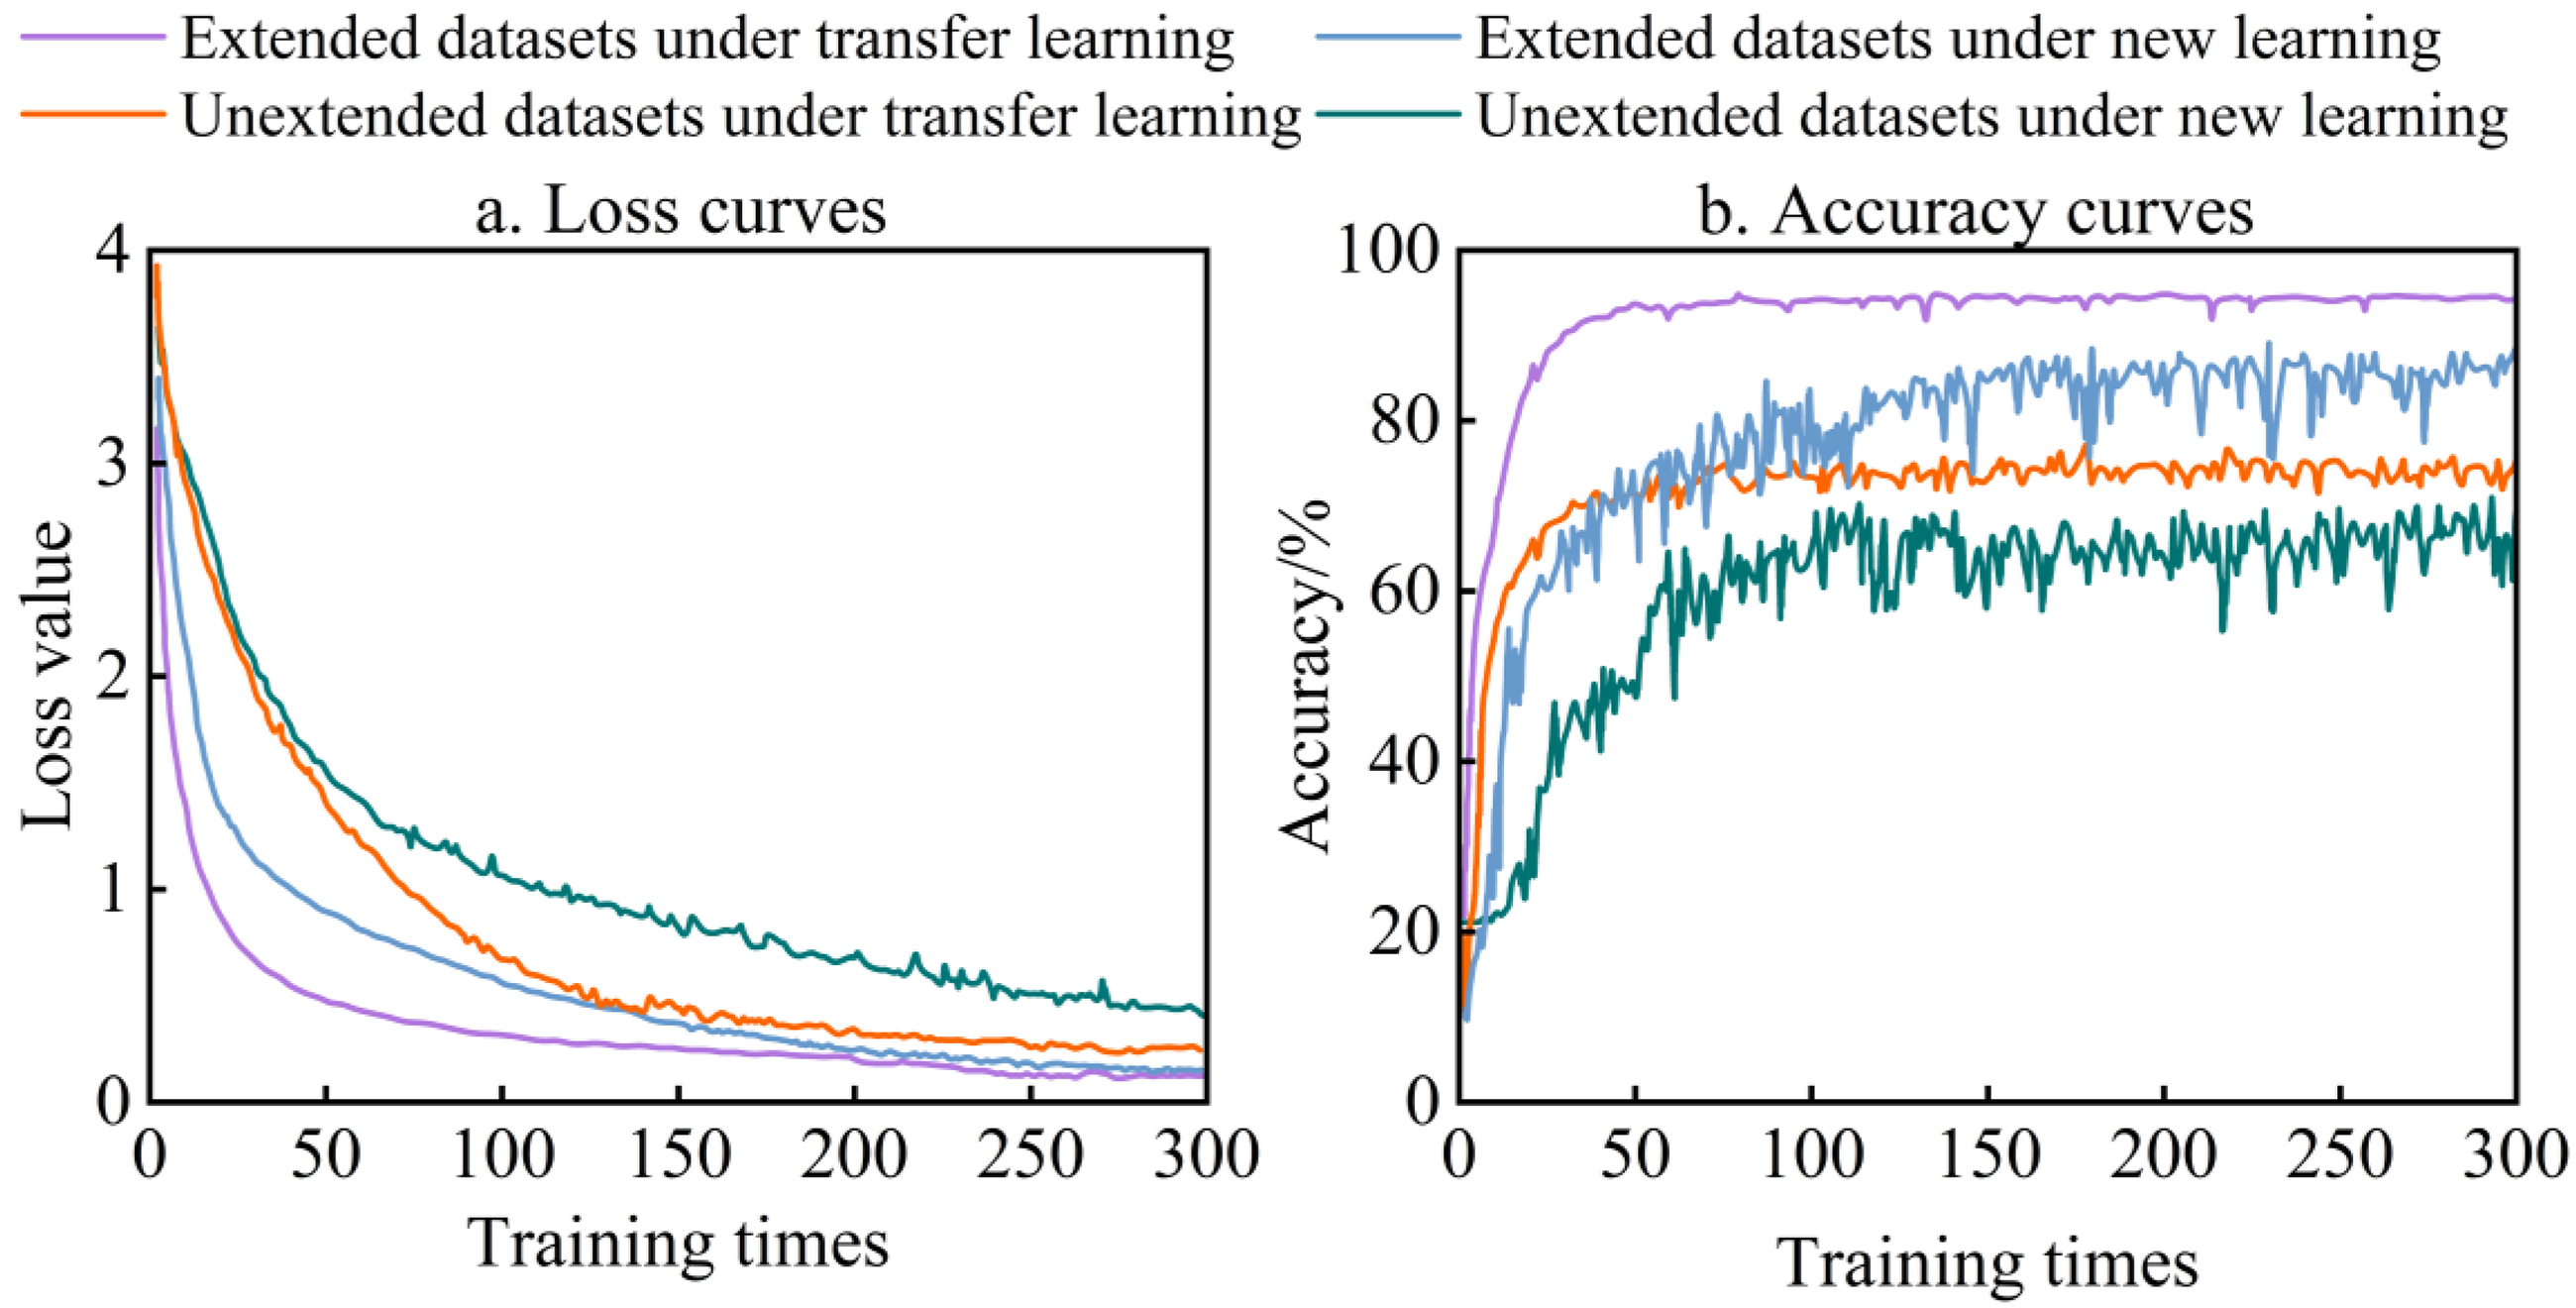
The impact of data augmentation and training methods on the model.
Effect of attention mechanism on model performance
On the augmented dataset, using a transfer learning approach with a learning rate of 0.0001 and incorporating SE, ECA, and EMA attention modules (while keeping other hyperparameters identical), the model's loss curve and accuracy curve on the test set are shown in Figure 8. The comparative analysis among SE, ECA, and EMA attention mechanisms employs standard deviation, F1-score, and accuracy as the evaluation metrics for model performance.
As shown in Figure 10, comparing the Loss curve and accuracy curve under the three attention mechanisms, the curves all tend to converge completely after 100 rounds. During the training process, the model overfits the noise and details of the data, which will cause serious oscillation or obvious upward trend of the Loss curve after convergence. In the figure, SE-YOLOv5 s converges faster, but the Loss curve has an obvious upward trend. After the convergence of ECA-YOLOv5 s model, the Loss curve has serious oscillation, and overfitting phenomenon occurs in both models. EMA-YOLOv5 s has the best convergence effect, and the curve after convergence is smooth and smooth, with a better fitting effect and strong generalization ability. The recognition results of the models under the three attention mechanisms have little difference, but the EMA-YOLOv5 s and ECA-YOLOv5 s models have smaller size, fewer parameters and shorter running time, and are superior to SE-YOLOv5 s in recognition speed. Compared with the ECA-YOLOv5 s model, the loss curve standard deviation of the EMA-YOLOv5 s model is smaller, and the F1 value and accuracy rate are higher, which can reach 92.69% and 95.8%.
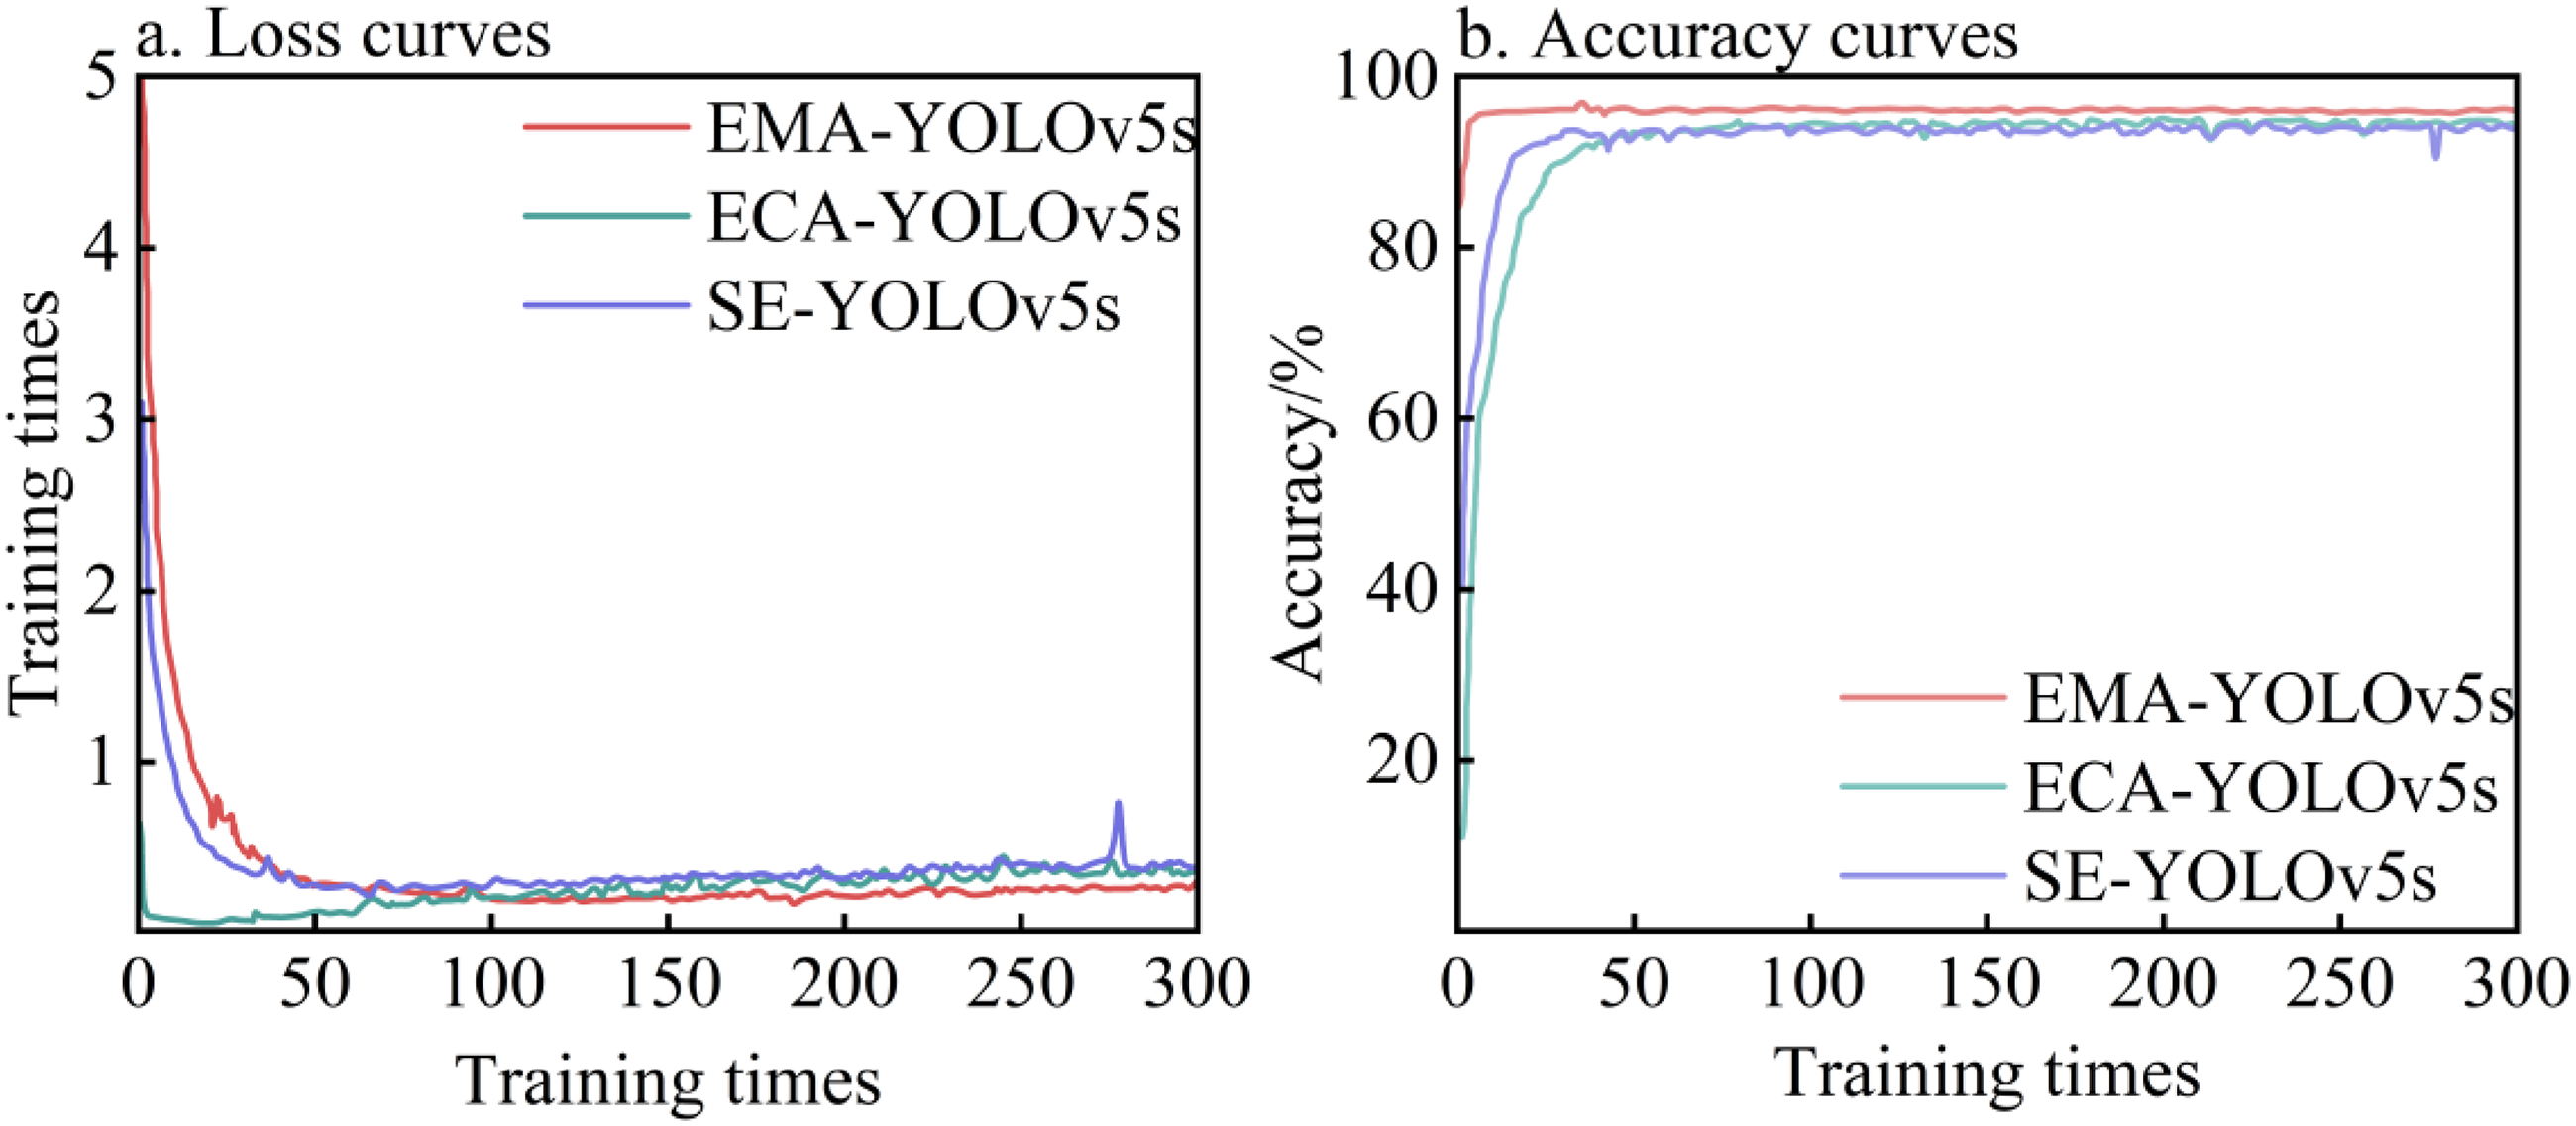
Loss and accuracy curves under different attention mechanisms.
Comparison of different models
In order to further evaluate the performance level of the model, the initial learning rate was set to 0.01, the number of training rounds was set to 300 epoch, and each object detection algorithm was tested on the test set of floating objects on the water surface. The final results are shown in Table 3.
Test results of different algorithm test sets.

According to the results in Table 3, the average accuracy of the improved YOLOv5 s model is 5.27 percentage points higher than that of the original YOLOv5 s model in terms of average accuracy. In terms of frame rate, the improved YOLOv5 s model is significantly better than Faster-RCNN, CenterNet and YOLOv3 models, and slightly better than YOLOv8 s. Compared with other mainstream target detection models, the improved YOLOv5 s model has obvious advantages in performance. The accuracy rate and frame rate are significantly improved, and the average accuracy is the highest, which meets the accuracy and real-time requirements of the classification detection of floating objects on the water surface while realizing the model's lightweight.
Conclusion
This study proposes an enhanced YOLOv5 s model incorporating EfficientNetv2, CARAFE, BiFPN, and attention modules (SE/ECA/EMA), optimized via SIoU loss, transfer learning, and data augmentation. Key findings include:
The improved model outperforms the original YOLOv5 s, achieving a 4.53% accuracy gain in water surface floater detection. Lightweight architecture and attention mechanisms enhance detection performance and real-time capability while maintaining computational efficiency. Data augmentation combined with transfer learning improves convergence and generalization on expanded datasets. The model surpasses traditional approaches in accuracy and frame rate, demonstrating practicality for aquatic environmental monitoring.
This work provides a robust framework for floater detection, contributing to water quality management and ecosystem protection.
Footnotes
Acknowledgments
This work was supported by the Science and Technology Innovation Leading Talent Support Program of Henan Province (Grant No. 254000510037) and the Key R&D Special Project of Henan Province (Grant No. 251111210700). The financial support is highly appreciated.
Author contributions
The experiments and data curation in this study were conducted by Yiqing Zhang. Lei Guo, Qingqing Tian, and Yunlong Ran provided overall guidance and critical suggestions for the manuscript. We thank Pengbo Yin for his assistance in sample collection. All authors have read and approved the final version of the manuscript for publication.
Funding
The author(s) disclosed receipt of the following financial support for the research, authorship, and/or publication of this article: This work was supported by the Research on key technologies of operation and maintenance of long-distance, multi-type and complex terrain water supply projects.
Declaration of conflicting interests
The author(s) declared no potential conflicts of interest with respect to the research, authorship, and/or publication of this article.
Data availability statement
The investigated dataset is available from the corresponding author on a reasonable request.