
Abstract
As a vital component of road transportation, the condition of concrete pavement has a significant impact on the quality of road access, with direct implications for traffic safety and ride comfort. Remarkable efforts have been made to develop pavement disease detection. However, the horizontal box algorithm, which is currently used in intelligent quantification of pavement diseases, has inherent limitations. It is unable to accurately quantify the dimensions of the diseases and is prone to repeatedly detecting the same disease in successive frames of images. To address these issues, an unmanned aerial vehicle-based concrete pavement disease dataset with rotated-box annotations has been established. Subsequently, the impact of the dataset split and network architecture on the accuracy of model detection was validated. Comparative experiments were conducted to assess the quantification of disease dimensions by model detection and manual detection. The results demonstrate that the relative error of disease size quantification is less than 5.42%. Furthermore, impact of the target detection model on the tracking outcome is evaluated using the enhanced model. The findings demonstrate that the precision of the disease enumeration reaches 90%, representing a 44% improvement over the baseline model. The model exhibits robust performance, providing a dependable foundation for subsequent quantification of concrete pavement diseases.
Introduction
With the continuous growth of highway mileage and longer service life, road surface cracks, potholes, rutting, and other pavement diseases arise from traffic loads, natural conditions, and infrastructure performance deterioration, and directly affect traffic safety and driving comfort.1–3 At the same time, the highway network is expanding, and traffic volume continues to increase,4,5 placing higher demands on road maintenance and management levels. 6 The detection results of pavement disease provide an important basis for the implementation of timely highway repair and maintenance strategies.7,8
Roadways are primarily classified into two categories: asphalt concrete pavements and cement concrete pavements. This study primarily focuses on the latter category. Surface distresses of concrete pavements can be observed on the surface and measured manually or automatically by optical and digital means. Cement concrete pavements exhibit a wide range of damage types and shapes. The shape and scale of a given damage type can vary considerably depending on the degree of damage, making it challenging to accurately detect such damage through traditional inspection methods. In recent years, deep learning techniques such as image classification, target detection, and image segmentation have yielded significant research outcomes in diverse fields.9–11 These techniques enhance efficiency and accuracy, address the limitations of traditional machine vision methods,12,13 and offer a novel approach to road damage detection. However, achieving a balance between detection speed and accuracy remains a challenge.14–16 Consequently, studying the application of deep learning techniques in pavement detection is a crucial endeavor.
In the extant research on the quantification of pavement damage, two methods of quantification are principally employed. The first entails the detection and extraction of pavement damage, followed by the quantification of said damage through the application of traditional digital image processing techniques. The second method is to extract each pixel point belonging to the damage by deep learning methods, so as to obtain the appearance characteristics of the damage. However, the appearance characteristics of the damage obtained by this kind of method often cannot be directly used to evaluate the pavement damage. The results must also be converted.
Highway pavement disease detection methods based on traditional digital image processing mainly include grayscale threshold segmentation,17,18 edge detection, and so on. 19 Banharnsakun 20 proposed a pavement damage detection and classification system using a hybrid of artificial bee colony algorithm and artificial neural network (ANN). In the proposed method, after capturing the pavement image, it is segmented into damaged and non-damaged regions based on a thresholding method. Features are extracted from the damaged areas as ANN inputs and the accuracy is improved. Gharehbaghi et al. 21 developed an algorithm that combines wavelet-based feature extraction, feature reduction, and a fast classifier based on deep learning, improving speed, and performance.
Machine learning-based detection methods mainly include support vector machine (SVM), backpropagation (BP) neural networks, and multi-layer perceptron networks. SVM, K-nearest neighbors, adaptive boosting, and Naive Bayes are used in the experiments. 22 The SVM algorithm gave successful result with 98.68% accuracy values. Sun et al. 23 used a SVM model as a binary classifier to detect cracks.
In the field of deep learning-based pavement disease detection, Redmon et al. 24 proposed the You Only Look Once (YOLO) algorithm in 2016. YOLO is a method that treats the target detection task as a regression problem, which can directly predict the location and category of the target from the original image without intermediate steps such as candidate box generation. This greatly reduces the complexity of the network computation. However, the target localization accuracy is relatively low due to the direct prediction of the target location and size. In the period between 2017 and 2018, Redmon and Farhadi25,26 introduced the YOLOv2 and YOLOv3 algorithms, which represented an improvement on the YOLO algorithm. This was achieved by introducing convolutional neural network (CNN) structures, such as ResNet and Darknet-19, as well as improving the feature information through the use of feature pyramid networks, such as feature pyramid network (FPN). These algorithms build upon the YOLO algorithm, incorporating CNN structures such as ResNet and Darknet-19, as well as feature pyramid networks such as FPN, thereby enhancing the multi-scale fusion capability of feature information. Furthermore, the enhanced algorithms incorporate a multi-scale training strategy, which trains the model on images of varying sizes. This approach aims to improve the precision of small target detection and to increase detection speed, accuracy, and generalizability. The YOLOv4 algorithm, as proposed by Bochkovskiy et al., 27 incorporates modules such as spatial pyramid pooling (SPP) 28 into the YOLOv3 algorithm, thereby further enhancing the model's performance. In contrast, the single shot multibox detector (SSD) algorithm 29 reduces the number of regions to be detected by generating a set of pre-defined anchors in the image as the input to the detection network. This approach can avoid detecting the entire image, which may be more computationally expensive than necessary when compared to the sliding window method. A transfer learning approach based on CNNs was developed. 30 This work employs the transfer learning strategy by leveraging four existing deep learning models with pre-trained weights. A semi-supervised learning method based on a deep convolutional neural network (DCNN) was proposed to achieve anomaly crack detection. 31 The trained model has strong robustness under the conditions of uneven illumination and obvious crack difference.
Furthermore, target detection algorithms can be combined or modified with a variety of algorithms to align with the specific requirements of different projects. A maintaining the original dimension-YOLO (MOD-YOLO) algorithm was designed and applied to crack detection in civil infrastructure. 32 For real-time crack detection in tile pavements, the YOLO algorithm was integrated with an unmanned aerial vehicle (UAV) to capture and analyze images. 33 An enhanced “Just One Look” version 7 (YOLOv7) and simple online real-time tracking with a deep association metric (DeepSORT) algorithm were presented. 34 In addition, rotated object detection techniques have already been applied to tasks such as ship and vehicle detection. 35 However, applying them to the fine-grained detection and quantification of pavement distresses presents unique challenges: (1) pavement cracks exhibit narrow and elongated linear structures, whereas ships and vehicles are typically compact object; (2) pavement surfaces contain complex textures and numerous interferences, unlike relatively simple backgrounds such as water surfaces or open areas; and (3) the ultimate goal of pavement distress detection is to support maintenance decision-making, which imposes stricter requirements on the localization accuracy of bounding boxes.
A review of the current state of research in this field reveals that the existing detection methods have inherent limitations. (1) First, methods based on digital image processing lack universality, with poor classification abilities, and limited adaptability to the transformed environment encountered in highway pavement disease detection. Second, the classification abilities of disease detection methods based on machine learning are also limited. (2) Detection methods based on traditional machine learning are difficult to train large data samples, and are less effective for the detection of multi-classification problems. Furthermore, there is currently no unified method for addressing the challenge of non-linear problems, and the generalization of these methods is often limited in different scenarios. (3) The application of neural network models for the detection of pavement damage is also beset with numerous challenges. The majority of existing methods are designed to identify either cracks or a single disease, and are less effective when confronted with multi-classification problems. The majority of the datasets utilized were obtained from CarLogs, exhibiting considerable variability in image quality and notable discrepancies between roads in disparate countries. Consequently, the datasets possess limited practical utility. Deep learning detection algorithms for road disease are currently categorized into three types, namely image classification, target detection, and image segmentation. Image classification algorithms are capable of classifying images, but are unable to locate the disease within the image. Target detection algorithms are able to accurately mark the location of the disease within the image using a prediction box, and are capable of multi-classification. The target detection algorithm is capable of accurately marking the location of the disease in the image using the prediction box and can address the multi-classification problem. However, achieving an optimal balance between accuracy and detection speed remains a challenge when employing either the single-stage or two-stage algorithms. Image segmentation is a technique that enables the detection of diseases at the pixel level, facilitating the accurate extraction of their shape. However, several challenges persist. These include inaccurate segmentation of disease edges, the high cost of annotation, the difficulty in ensuring the quality of annotation, the slow speed of processing, and the difficulty in distinguishing the correlation between pixel points when the disease is densely distributed.
In our study, a methodology for the detection and quantification of cement concrete pavement disease is proposed, based on rotating box calibration. Compared to other YOLO series, YOLOv5 offers advantages such as lower resource consumption, flexible deployment, and suitability for engineering applications. To address the limitations of the horizontal box algorithm in quantifying the dimensions of disease and the tendency for repeated detection of the same area in consecutive box images, a new approach to quantifying highway pavement disease based on YOLOv5 was investigated. The core results of this paper are summarized as follows:
The principal concepts of rotating box detection algorithms are analyzed, a method for the detection of pavement diseases based on rotating boxes is established, and a dataset for UAVs based on rotating box annotation is constructed. The impact of dataset segmentation type and attention mechanism on the accuracy of the model detection is investigated through comparative experiments. The relative error in quantifying disease size is verified through a comparison of the model detection results with those obtained through manual detection. A YOLOv5-DeepSORT model was established to facilitate the calculation of disease quantities. The accuracy of the model in estimating disease quantities was verified by comparing its results with those obtained through manual counting.
Methods
Rotating box calibration
It is widely acknowledged that the calibration and establishment of a dataset is a fundamental aspect of any model training process. The conventional approach to calibrating a dataset model is primarily through the use of a horizontal bounding box (HBB). However, in the context of detecting rotational damage in UAV aerial images, instances of detection box overlap are frequently observed. This phenomenon can lead to the calculation of a significant number of non-diseased areas within the quantitative detection of the disease. As illustrated in Figure 1, the horizontal labeling box depicted in the figure will generate a portion of the overlap area, as indicated by the blue shading in the figure. In the case of densely distributed small potholes, the distribution of these potholes will result in a larger overlap area of the detection box being deleted, which will in turn lead to a greater number of instances of leakage occurring. The yellow-shaded portion is off-road region existing in the detection box. Consequently, in the subsequent stage of quantifying the area of influence of the disease, the horizontal detection box will impact the accuracy of the disease quantification, thereby preventing the achievement of the desired outcome. To overcome the limitations of the horizontal calibration box and the directional variability of UAV images, rotating bounding boxes were employed to accommodate road uncertainty in aerial datasets.

Labeling effect of horizontal detection box.
The most commonly used method of rotating box calibration comprises two main types: a long-edge representation and an eight-parameter representation. The former has a relatively small number of parameters, while the open-source annotation tool rolabelImg is capable of exporting the eight-parameter representation of the labeling data format. During the training process, the label information is input into the model, and a data conversion step is applied to transform the bounding box format into the long-side representation. The long-side representation expresses the rotating box by introducing a new parameter θ, which represents the rotation angle. This allows for the representation of the rotating box by

Long-side representation.
In order to achieve flexible rotating box calibration, it is first necessary to determine the labeling method of the rotating box. Once this is established, the next step is to predict the value of θ within it. This will require an improvement to the structure of the network. The network structure employed in this study is YOLOv5, and the enhanced network detection header is primarily illustrated in Figure 3. The image produced after the output layer of the YOLOv5 network contains prediction information with a dimension of 3 × (C + 5) channels, where the value of “3” indicates the preset three anchor boxes, C is the category confidence of each anchor box prediction, and “5” is the border position information, that is,

YOLOv5 detection head structure. YOLO: You Only Look Once.
In order to predict the rotation angle, a new prediction channel for the rotation angle


Structure of the R-YOLOv5 detection head. YOLO: You Only Look Once.
Specifically, the loss function consists of four components: classification loss

Both the confidence loss and the classification loss are computed using the binary cross-entropy loss, as defined in equation (3):


The bounding box regression loss combines the advantages of IoU loss, center point distance loss, and aspect ratio loss, offering improved stability and fitting performance. Its computation is defined in equations (5) to (7), and the underlying principle is illustrated in Figure 5.


Schematic diagram of CIOU loss function principle.
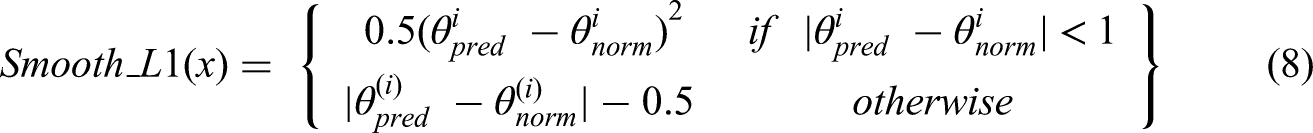
The SmoothL1 loss function is a regression loss commonly used in regression tasks. In this work, it is applied to the angle regression task. This loss function can maintain training stability while mitigating sensitivity to outliers. The angle regression

Dataset
The majority of publicly accessible aerial image datasets comprise common objects within natural scenes. However, there is a notable absence of datasets containing rotated boxes that depict pavement disease. The DOTA dataset is a large-scale target detection dataset for aerial images, developed by Wuhan University and other organizations. The dataset comprises 2806 images encompassing 46 distinct target categories, including vehicles, ships, aircraft, bridges, and so forth. The targets exhibit variability in size and rotation angle across images with substantial view angle alterations and occlusion. The DOTA dataset is challenging in terms of target scale, view angle changes, and target categories. It is one of the most important datasets for researching the target detection and recognition in aerial images.
Given that DOTA is unable to meet the demand for road disease detection tasks, a concrete pavement disease dataset with rotated boxes has been established based on an eight-parameter representation. This is in the format of a DOTA dataset. In this paper, we construct a concrete pavement disease dataset comprising 837 photos collected by UAVs, accompanied by comprehensive disease information. The labels in the rotated-box dataset are classified into the following categories: road, edge spalling (corner_peel), transverse crack (w_crack), longitudinal crack (h_crack), pothole, broken_board, and corner_break. The labeling process employs the open-source tool rolabelImg for fine-grained labeling, which has been enhanced from labelImg for the purpose of rotated-box labeling. As illustrated in Figure 6, the initial step is to establish a horizontal box. This is achieved by rotating the HBB until the angle of rotation and the angle of the road surface are aligned, ensuring that the box fully covers the road surface and disease. This process generates a more appropriate rotated box.

RolabelImg annotation process and rotated-box annotation effect.
The constructed dataset comprises three principal features. Primarily, it encompasses six major diseases afflicting cement concrete pavements and labels the extent of the road area. Figure 7(a) depicts a histogram of the number of instances of each category in the training set, representing the count of each disease instance. It can be observed that the number of pavement and crushed slab labels is higher, while the number of slab corner breaks and exposed bones is lower. Second, the images were captured by UAVs at varying heights and under diverse lighting conditions. The images were labeled using rotated boxes, which contain comprehensive disease information. However, as the viewpoint expands, the images display increasingly complex backgrounds that extend beyond the road domain. Figure 7(b) shows the length and width of each bounding box in the training data, with the center point of all the boxes fixed at the center of the picture. Figure 7(d) depicts the histogram of the short- and long-edge variables, which demonstrates the distribution of the short and long edges of the labeling box. Figure 7(c) depicts the histogram of the centroid variable for the labeling box, which illustrates the distribution of the dataset. Furthermore, the labels of the training set data were summarized, and the relationship between the centroid coordinates of the labels and the four variables representing the length of the long and short edges was examined, as illustrated in Figure 8. The training samples were augmented using the mosaic method. Four randomly selected images were subjected to various augmentation techniques, such as random adjustments in hue, saturation, and translation, among others, and were then concatenated into a single image for network training. This process allows the model to learn richer distress features, thereby improving its performance in detecting small-scale targets.

Analysis of rotated-box dataset: (a) number of instances, (b) label box shape distribution, (c) the histogram of the centroid variable for the labeling box, and (d) dimensional distribution of labeling box.

Relationship analysis of the labels.
As illustrated in the above figure, there is no discernible linear relationship between the variables, which will present a challenge in training the model and simultaneously enhance its learning capacity.
Experiments and results
Evaluation metrics
Based on the DOTA evaluation approach, this section evaluates the model using two different average accuracy metrics in target detection: rotated-box average detection accuracy (mAP_OBB) and horizontal-box average detection accuracy (mAP_HBB). Specifically, mAP_OBB trains the detector with OBB-labeled files and then directly calculates the average accuracy of the detection results using the OBB scoring method. While mAP_HBB calculates the average accuracy of the detection results using the HBB evaluation method. This involves converting the OBB-labeled files from the training results and the validation set into a minimum outer horizontal rectangular box. The evaluation metrics for model complexity and speed are GFLOPs and FPS. GFLOPs is the number of billion floating point operations per second, and is used to measure the computational complexity during the training phase. FPS is the number of frames per second inferred by the model, and is used to measure the speed of the model. Comparisons are made between different evaluation methods to provide a more comprehensive accuracy assessment.
Model training
The benchmark model presented in this section has been modified based on the rotation detection model. 36 To ensure the comparability of training results, all models were trained without using pre-trained weights under the same hyperparameter settings. In the training phase, this paper initially adjusts the image size of the input model to 1024 × 1024. The base structure is YOLOv5s, the number of unfrozen training epochs is 3, the batch size is 32, and the total number of training epochs is 400. The remaining training parameters are maintained at their default values, and the weight file with the highest accuracy is retained following the completion of training.
Analysis of dataset split effect
In order to ascertain the impact of the dataset division method on the rotated-box detection of pavement disease, the training results of the split dataset and the original dataset model are compared in order to determine the final dataset for the actual disease quantification experiment. The DOTA_devkit tool, provided by the DOTA dataset, is used to split the dataset. Through analysis of the experimental data, it is found that a significant amount of labeling information in the split image would be deleted if the split size was too small. Therefore, the image of size 8192 × 5460 is divided into multiple 2048 × 2048 images with a 20% overlap. In the event that the labeling box is truncated during the splitting process, if the truncated portion of the truncated instance is less than 30%, the labeling information of the instance is retained. Furthermore, the positional information of the split image in the original image is stored in the file name, which is responsible for the subsequent merging of the detection results. To illustrate, the designation “0001__1__0__1848.png” signifies that the image identified as “0001.png” is cropped at width 0 and height 1848 with the original ratio. In consideration of the memory requirements of the training device, the total size of the split dataset is essentially equivalent to that of the original, wherein the split training set comprises 1304 images and the validation set contains 156 images. The performance of the YOLOv5 rotated-box detection algorithm in the two datasets is illustrated in Table 1. In the split dataset, the mAP50_HBB is 0.428, and the mAP50_OBB is 0.247. In the original dataset, the mAP50_HBB reaches 0.69, and the mAP50_OBB reaches 0.608.
Split versus unsplit dataset.

HBB: horizontal bounding box; OBB: oriented bounding box; FPS: number of frames per second; GFLOP: number of billion floating point operations per second.
The analysis of dataset labeling and detection effect reveals that the primary reason for the poor detection effect of the split dataset is the relatively smaller number of disease instances present in the same-sized split dataset. In comparison to the target in the natural environment, the disease instances tend to occupy a larger proportion of the image. During the process of splitting, some of the disease instances on the division line are partitioned, resulting in the loss of labeling information. This has a significant impact on the model's performance. Accordingly, in the actual detection process, if the split training set is employed to train the model, it is essential to split the images to be detected and subsequently merge the detection results. The practical engineering applications of this approach are limited, and the detection efficacy is suboptimal. Consequently, unsplit dataset is selected for training in subsequent experiments.
Experiments and results analysis based on YOLOv5 network modeling
In this section, the RC-YOLOv5 model is constructed by incorporating the channel attention (CA) attention layer into the final layer of the backbone and neck networks of the YOLOv5 rotating box algorithm. This is done to ascertain whether the attention algorithm can enhance efficacy of detection. The structure of the enhanced model is illustrated in Figure 9. The backbone of the model is a lightweight design based on CSPDarknet, primarily composed of three core modules—Conv, C3, and Spatial Pyramid Pooling-Fast (SPPF)—connected in series to efficiently extract multi-scale feature information from the input image. The Conv module corresponds to the standard convolutional layer in the YOLOv5 network. The C3 module consists of three convolutional layers and a bottleneck, which effectively reduces the number of parameters. The SPPF module transforms parallel multi-scale pooling operations into a sequential process by stacking three 5 × 5 max-pooling layers. This design addresses the limitation of CNNs with respect to input image size, enables the fusion of features at different resolutions, and further reduces computational cost.

Structure of rotating box YOLOv5 based on attention mechanism. YOLO: You Only Look Once.
The detailed metrics results of the two algorithms for the detection of three types of lesions are as in Table 2: broken_board, longitudinal crack (h_crack), and edge spalling (corner_peel), respectively. It can be observed that the attention mechanism has a notable impact on the detection of all three types of diseases, with an overall improvement of 2.4% in accuracy for the three diseases when compared to the baseline model. Among these improvements, the greatest is observed in the detection of broken_board, with an increase of 9.8%. The accuracy of the detection of longitudinal cracks and edge spalling also shows notable improvement, with an increase of 6.3% and 2.1%, respectively.
Effects of attention mechanism on major diseases.

mAP: mean average precision; YOLO: You Only Look Once.
Subsequently, the experimental results of the model with the CA attention structure and the original model in the validation set are presented in Table 3. The incorporation of the CA attention mechanism resulted in an mAP50_HBB of 71.7% and an mAP50_OBB of 63.2% in Experiment 2, representing a 2.7% and 2.4% enhancement over the baseline model, respectively. However, this did result in a 2.5 frames/s reduction in inference speed, which may not meet the real-time detection requirements.
Comparison of effects of attention mechanism.

HBB: horizontal bounding box; OBB: oriented bounding box; mAP: mean average precision; FPS: number of frames per second; GFLOP: number of billion floating point operations per second; YOLO: You Only Look Once.
In conclusion, the CA attention mechanism is not only applicable to horizontal detection in YOLOv5, but also to rotating box YOLOv5 model (RC-YOLOv5). RC-YOLOv5 demonstrates an aptitude for discerning pivotal information within a given image, while maintaining a higher detection accuracy in complex scenes. The detection efficacy of the attention mechanism is presented in Figure 10.
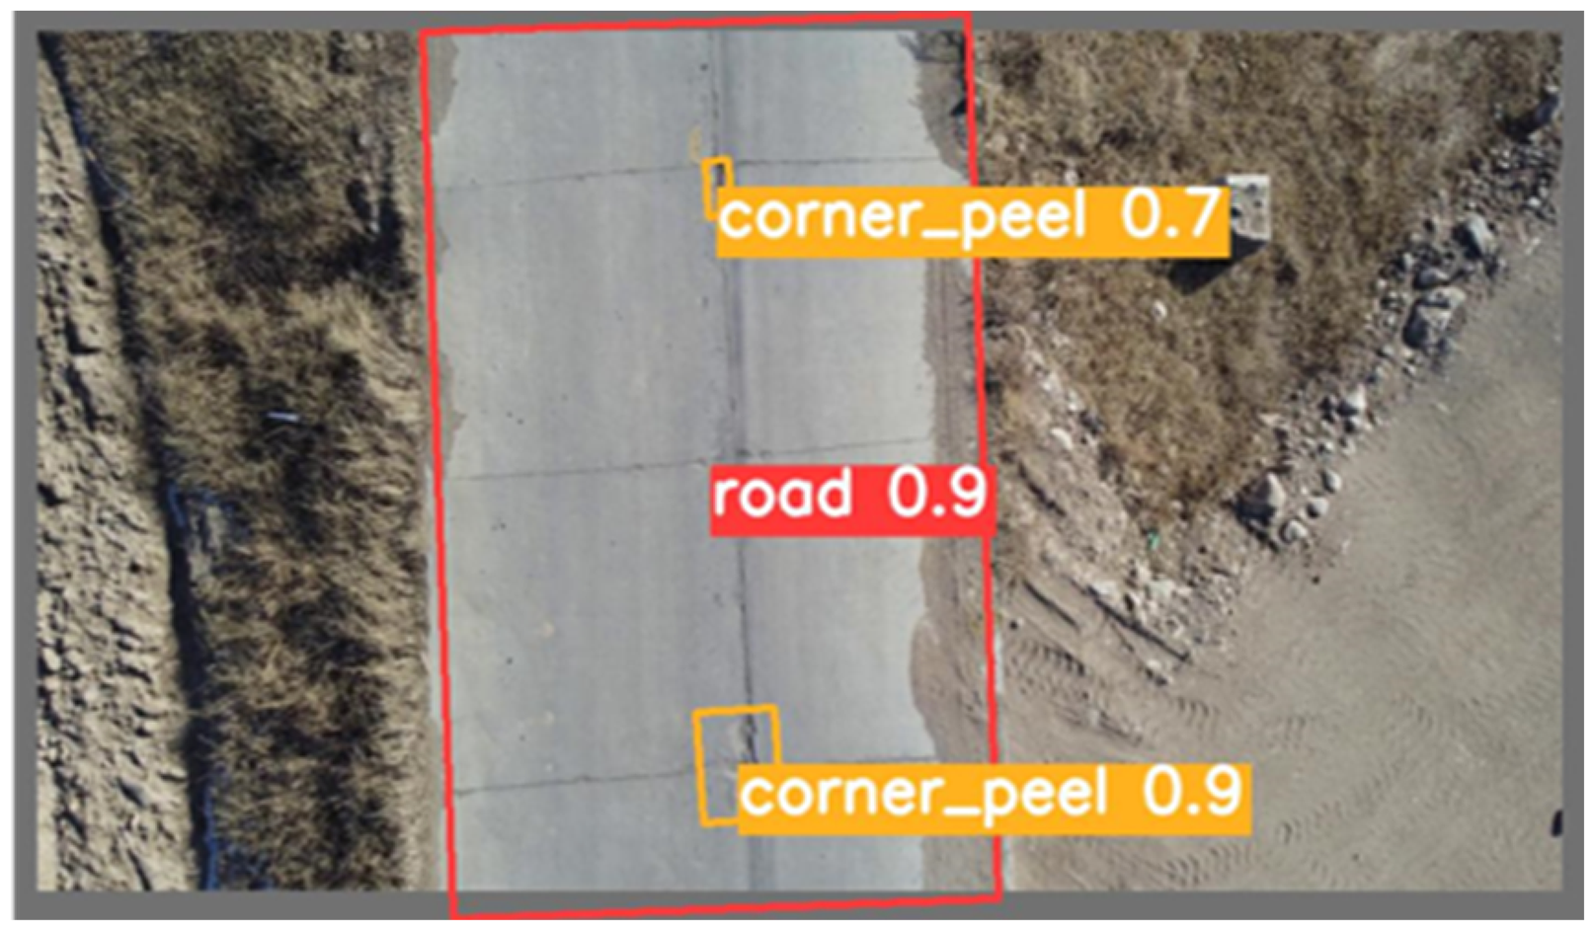
Effect of attention mechanism detection.
To evaluate the effectiveness of the proposed RC-YOLOv5 network compared with mainstream object detection algorithms, mean average precision (mAP) and inference speed, measured in FPS, were used as evaluation metrics. The models were trained with an image size of 1024 × 1024, a batch size of 32 and 400 epochs. The results are summarized in Table 4. The proposed RC-YOLOv5 achieved an mAP of 71.70 ± 0.19%, representing an improvement of 13.49% over YOLOv8 (58.21 ± 0.002) and 2.00% over MobileNetV4 (69.70 ± 2.02). In terms of FPS, RC-YOLOv5 reached 112.40 ± 2.10, which is 32.56 and 26.07 higher than those of YOLOv8 (79.84 ± 5.68) and MobileNetV4 (86.33 ± 2.42), respectively. Considering both mAP and FPS, the proposed model outperforms the baseline models in terms of detection accuracy and inference speed, with relatively small standard deviations, indicating stable and reliable performance suitable for practical pavement distress detection applications.
Comparison of target detection algorithms.

mAP: mean average precision; FPS: number of frames per second; YOLO: You Only Look Once.
Measurements based on disease parameters with rotating box
The method of quantifying the size of the disease based on the rotating box begins by establishing the lower left corner of the digital image as the origin. Two edges are then designated as the coordinate axes of the coordinate system, with the length of the coordinate axes representing the size of the pixel value of the image. The quantification of the disease size is achieved by calculating the area occupied by the rotating box within the image. In the case of diseases such as broken_board distress, the degree of damage is assessed according to the damaged area. In order to determine the number of pixel points occupied by the disease in the image, it is necessary to obtain the coordinates of the four vertices of the detection box. This process is illustrated in Figure 11. As the detection box undergoes a rotation, the rectangle's dimensions remain constant. Therefore, it is sufficient to ascertain the length of the two neighboring edges (m, n) in order to calculate the area of the shaded portion. The length of m can be calculated using the following formula:

Schematic diagram of disease measurement methods.
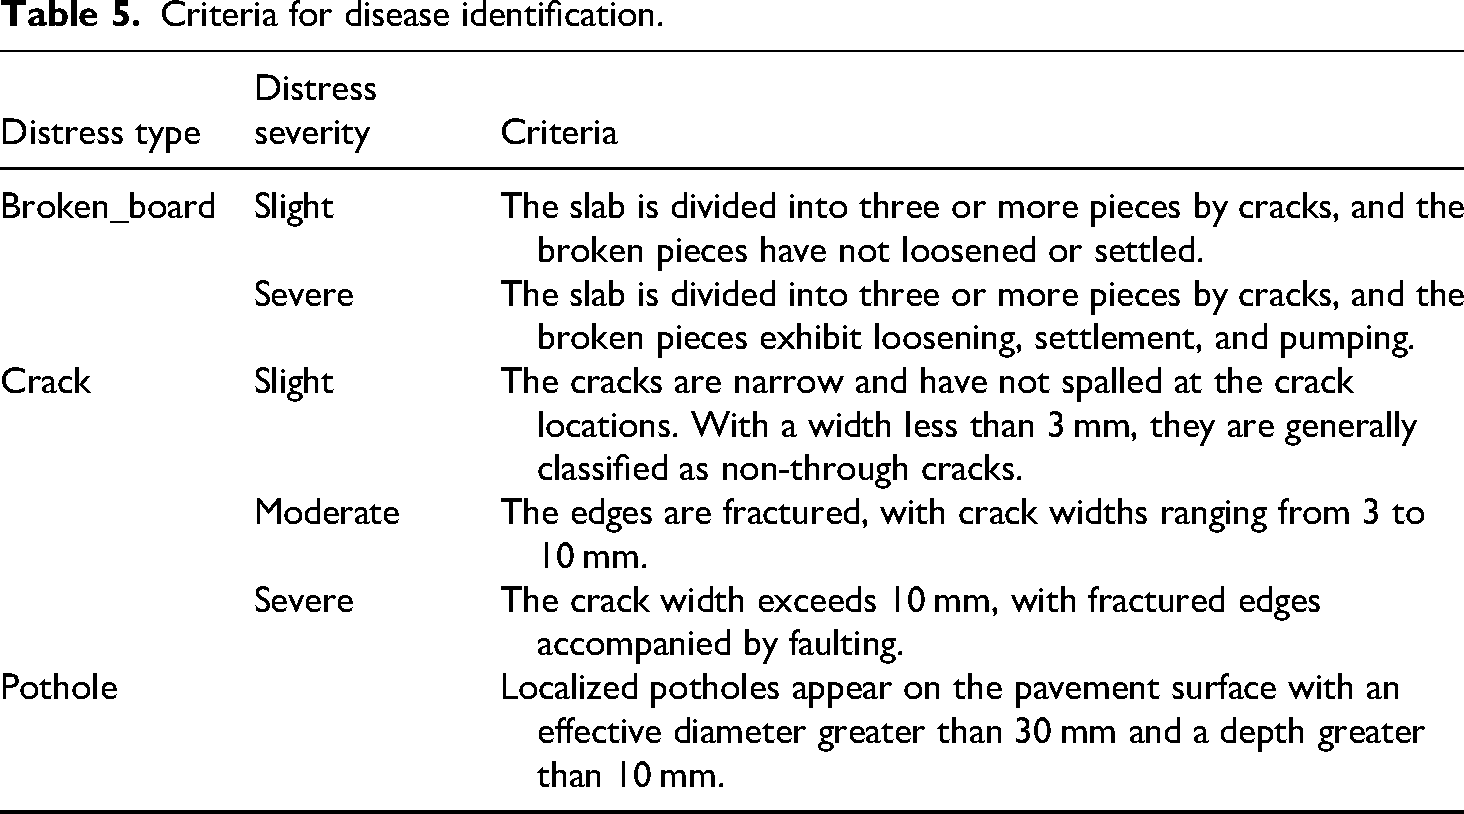
According to the Highway Technical Condition Evaluation Standard (JTG 5210-2018), the evaluation criteria for certain types of distresses in cement concrete pavement are shown in Table 5.
Criteria for disease identification.
To validate the precision of the algorithm used in this study to quantify pavement distress dimensions, the pavement diseases were photographed by a hovering UAV. The algorithm results for detection box area were then compared with manual measurements. The test site was cement concrete pavement in the Inner Mongolia Autonomous Region. Images were acquired using a DJI M300-RTK drone equipped with a DJI P1 camera, flying at a height of 50 m. The UAV is equipped with a built-in RTK positioning module, which can achieve centimeter-level horizontal positioning accuracy. The flight paths during data acquisition were maintained with consistent overlap. The drone's latitude, longitude, and altitude at the time of image capture were recorded via its integrated positioning system. rolabelImg calibration software was employed to determine the distress dimensions during manual measurement. The test results are presented in Table 6, and the detection efficacy of the algorithm is illustrated in Figure 12. The sizes of the distresses identified by the UAV method and the manual method were largely comparable, with a relative error of less than 5.34% for broken_board distress size.

Quantitative validation experiment.
UAV versus manual measurements.

B-B: broken-board; UAV: unmanned aerial vehicle.
Disease statistics network based on YOLOv5-DeepSORT algorithm
Once the parameters of the disease have been identified, the objective is to achieve global detection and re-identification of the disease. To this end, an UAV is employed to obtain pavement information, and the YOLOv5-DeepSORT algorithm is utilized to extract feature information for each disease, to which a unique number is assigned. In light of the aforementioned effects, a secondary detector structure is constructed based on the YOLOv5-DeepSORT algorithm. In light of the aforementioned effects, a secondary detector structure is constructed based on the YOLOv5-DeepSORT algorithm. First, the coordinates of the lower left corner of the detection box output from the disease detector are used as the marker point. Second, two detection bands are set up at the bottom of the UAV detection screen. As the UAV flies forward, the marker point is sensed by the blue detection band above, which stores the numbered disease in the cache space. If the detection point is caught by the second detection band, the numbered disease is recorded and categorized according to the type of disease and its number. The total number of diseases is displayed in the upper left corner of the screen, as illustrated in Figure 13.

Disease counting process.
The test dataset for distress counting was created by stitching together five UAV-captured pavement videos, containing 50 instances (13 cracks and 37 potholes). Manual counting of the collected pavement distress videos was conducted and compared with the model detection results, as summarized in Table 7. The original model detected 23 instances, missing 31, while the improved model detected 45 instances with only 5 misses. The improved algorithm achieved 90% counting accuracy, a 44% improvement over the original model, demonstrating its effectiveness in reducing missed detections and its suitability for pavement distress detection.
Results of disease detection.

YOLO: You Only Look Once.
In practical detection scenarios, distress instances may be temporarily occluded by vehicles and later reappear, leading to ID changes that cause duplicate detections or missed instances. Visualization in real-world scenes indicates that the improved model exhibits stronger robustness. Figure 14 shows the frame immediately before occlusion: in Figure 14(a), the original model detects only one pothole, whereas in Figure 14(b), the improved algorithm detects two potholes with IDs 7 and 6. Figure 15 shows the reappearance of the distress instance seven frames later. In Figure 15(a), the original algorithm completely loses the distress and its ID after vehicle occlusion, while in Figure 15(b), the IDs 7 and 6 are successfully restored, demonstrating successful object re-identification.

Comparison of detection performance before disease occlusion. (a) The baseline YOLOv5 model fails to detect the pothole (ID 7). (b) The proposed algorithm correctly detects both potholes (ID 6 and ID 7). YOLO: You Only Look Once.

Comparison of tracking consistency after occlusion. (a) The YOLOv5 model loses the track of both potholes. (b) The proposed algorithm correctly re-assigns the original IDs (ID 6 and ID 7), demonstrating robust tracking. YOLO: You Only Look Once.
Conclusions
This study proposed a methodology for quantifying distresses in cement concrete pavement based on rotating box annotation. A rotating box cement concrete pavement dataset was established, which addressed the issues of overlapping regions and missed detection in rotating box annotation. Furthermore, this dataset can be flexibly adapted to align with the direction of the road in the aerial photography. Besides, the impact of dataset split and network architecture on detection accuracy was evaluated, and the efficacy of the enhanced methodology was substantiated. Additionally, the margin of error associated with disease dimensions quantification was determined to be less than 5.42%, based on the detection outcome.
Furthermore, an improved YOLOv5-DeepSORT methodology for quantifying the number of diseases was constructed. To address the issue of repeated disease counting, two detection bands were established, with the coordinates of the lower left corner of the detection box serving as the marking point. The counting results of the improved network were also compared with those of the manual approach, YOLOv5-DeepSORT. The findings demonstrated that the accuracy of the improved network architecture was 90%, which was 44% higher than that of the traditional counting network. The method offers a more effective approach to implementation in practice. In future work, the detection and quantitative evaluation of three-dimensional indicators, such as pothole depth and volume, will be further investigated to enhance the comprehensiveness of pavement distress analysis.
Footnotes
Author contributions
Conceptualization: DL and MG; methodology: DL, XG, and MG; software: DL and XG; data curation: DL and XG; writing—original draft preparation: DL and XG; writing—review and editing: DL and XJ; supervision: MG. All authors have read and agreed to the published version of the manuscript.
Funding
The authors disclosed receipt of the following financial support for the research, authorship, and/or publication of this article: This research was supported and funded by Central Guidance Local Science and Technology Development Fund Projects (grant numbers 2024ZY0042 and 2024ZY0111), and the Key Technology Research Plan Project of Inner Mongolia Autonomous Region (grant number 2021GG0178).
Declaration of conflicting interests
The authors declared no potential conflicts of interest with respect to the research, authorship, and/or publication of this article.
Data availability statement
Data are available on request from the authors.