
Abstract
Objectives
Global Leadership Initiative on Malnutrition (GLIM) criteria have gradually accounted for the mainstay evaluating nutritional status. We sought to establish GLIM-dictated nomograms with other prognostic factors influencing long-term mortality and externally validate their predictive performance in decompensated cirrhosis.
Methods
The derivation cohort comprised 301 patients presenting with cirrhosis-associated acute insults, while the validation cohort encompassed 101 subjects from another tertiary hospital. Two nomograms were constructed to predict the 1-year all-cause mortality by integrating the GLIM criteria. The study population was stratified into low-, moderate- and high-risk mortality groups according to aforesaid proposed models.
Results
Adjusting Child-Turcotte-Pugh classification (Nomo#1) or Model for End-stage Liver Disease-Sodium score (Nomo#2) separately, the GLIM criteria were independently associated with 1-year mortality in the multivariate Cox regression analysis (Nomo#1 hazard ratio (HR) = 3.139, p < 0.001; Nomo#2 HR = 3.456, p < 0.001). The C-index and time AUC for Nomo#1 and Nomo#2 performed significantly better than those of the GLIM criteria or conventional scoring systems alone. The survival rate of the low-risk group was significantly higher than those of the moderate- or high-risk groups (Nomo#1: 95% vs 65.8% vs 33.3%, p < 0.001; Nomo#2: 94.3% vs 64.5% vs 25%, p < 0.001). Furthermore, our proposed models exhibited moderate prediction accuracy and may identify malnourished patients with poor survival conditions in the external validation cohort.
Conclusion
GLIM criteria-defined malnutrition negatively impacted long-term mortality in the context of decompensated cirrhosis. Our established nomograms may predict survival status with sufficient discriminatory ability, alongside good consistency and clinical benefits, supporting their effectiveness in daily practice.
Introduction
It is well recognized that poor nutritional status may lead to a wealth of deleterious health consequences and detrimental outcomes such as disability, frailty, impaired quality of life, morbidity, and mortality. In this regard, the liver constitutes the major organ responsible for processing and metabolizing various nutrients, and there is closely connected to nutritional status.1,2 Patients with decompensated cirrhosis are predisposed to significant hepatic dysfunction, incurring complications, and disordered therapeutics (e.g. repeated band ligation or paracentesis), all of which may serve as precipitating factors/contributory causes pertaining to the development and deterioration of malnutrition. 3 Although there is an increasing awareness and research interest regarding the pivotal role of malnutrition to determine unfavorable outcomes among patients with cirrhosis who experience acute decompensating episodes, the predominant appraisals or widely implemented tools, such as the Child-Turcotte-Pugh (CTP) classification and Model for End-stage Liver Disease (MELD)-based scoring systems, do not take metrics indicative of nutritional status into account. 4
Most recently, a panel consensus designated as the Global Leadership Initiative on Malnutrition (GLIM) has been launched and recommended to standardize and harmonize the malnutrition diagnosis across diverse populations and different clinical scenarios. 5 Upon its release, extensive attentions have been paid to this diagnostic toolkit with rapid and broad adoption in the medical field.6–8 Accordingly, a body of evidence has implicated the predictive value and prognostic role of GLIM-defined malnutrition in the context of cirrhosis.9–12 However, those published works have shortcomings pertinent to lacking confirmative data with independently external validation or constructive ease-to-implementation modality given labor-intensive daily practice. In this regard, a nomogram represents one of the most accurate modalities for decision-making available in clinical medicine. As a pictorial device and visual diagram, this tool can synthesize clinical features and biological metrics into a graphical instrument facilitating complicated calculations and providing finer risk stratification. Considering its advantages to provide estimated probability pertinent to a clinical event insulting a given patient, rapid propagation and wide adoption have been observed across distinct scenarios by employing clinical, radiography, and molecular biological indicator to predict prognostic outcome/diagnostic endpoint.13–15 Notably, GLIM-defined malnutrition has already been incorporated into some predictive nomograms among patients with diverse malignancies or undergoing interventive treatment.16–19 Therefore, the current study explored the impact of GLIM-defined malnutrition on 1-year all-cause mortality in a tertiary hospital with consecutively enrolled patients experiencing decompensated cirrhosis-associated acute insults. It further aimed to construct and validate resulting nomograms in terms of combined data from our and another tertiary center by integrating GLIM and other independent prognostic predictors.
Materials and methods
Study population
This retrospective study analyzing data of consecutively recruited patients with decompensated cirrhosis on account of acute insults at the Department of Gastroenterology and Hepatology, Tianjin Medical University General Hospital from 2020 to 2022. Patients aged ≥18 years with typical features conforming to the cirrhosis diagnosis based on clinical manifestations, laboratory results, imaging findings, pathological examinations, or their combination were included. The definitions concerning cirrhosis-associated acute insults cover ascites in terms of the International Ascites Club (clinically evident addressed on the physical examination or ultrasonic test: grade 1/2/3 indicative of mild/moderate/bulky magnitude), hepatic encephalopathy (HE) classification in terms of the West Haven Criteria (I–IV), and gastroesophageal varices on endoscopic assessment.20–22 The exclusion criteria comprised concomitant acute-on-chronic liver failure (ACLF) upon initial appraisal, suspected, or confirmed diagnosis of hepatocellular/extra-hepatic cancers, incomplete data regarding comprehensive nutritional status, and refusal to regular post-discharge follow-up. Determining ACLF corresponds to the Asian Pacific Association for the Study of the Liver-dictated guideline, that is, jaundice with total bilirubin (TBIL) ≥ 85μmol/L and coagulation abnormalities with prothrombin time-international normalized ratio (PT-INR) ≥ 1.5 alongside ascites on physical examination and/or HE within 4 weeks in subjects experiencing cirrhosis or chronic liver disease. In this regard, after ruling out 33 patients presented with liver failure, 28 patients susceptible or confirmative to have cancers, and 38 patients without complete data or refusing to follow-up, a total of 301 cirrhotic patients finally served as our derivation cohort, which was used for developing the prediction model (nomograms) with internal validation. Additionally, an independent cohort enrolling 101 patients from the Department of Gastroenterology, The Third People's Hospital of Chengdu served as the external validation cohort between 2021 and 2022. All subjects for external validation were adherent to the inclusion and exclusion criteria aligning with those of the derivation cohort. A study flowchart can be found in Figure S1. The current study has been approved by the ethical committee of Tianjin Medical University General Hospital (IRB-KY-181, November 2022) as well as that of the Third People's Hospital of Chengdu (2022-S-121, December 2022). Written informed consent was provided by all patients, and the investigation procedures were conducted in accordance with the Declaration of Helsinki (1975, revised 2013). Moreover, we used the de-identified patient data to ensure privacy and confidentiality. The reporting of current study adheres to the STrengthening the Reporting of OBservational studies in Epidemiology – Nutritional Epidemiology statement. 23
Data acquisition and follow-up
Data in relation to the patient demographic information (age, sex), clinical characteristics (body mass index (BMI), waist circumference, etiologies, cirrhosis-related complications), and laboratory tests were acquired from electronic medical records. Laboratory tests consisted of white blood cell count (WBC), red blood cell count, platelet, hemoglobin, neutrophil-to-lymphocyte ratio (NLR), platelet-to-lymphocyte ratio (PLR), serum albumin, TBIL, alanine aminotransferase, alkaline phosphatase (ALP), sodium, creatinine and PT-INR. Two conventional scorning systems specific to liver disease severity, designated as CTP classification and MELD-Sodium (MELD-Na) score were calculated on the basis of relevant indicators. Given proportional subjects with cirrhosis at the decompensating stage always suffered from fluid retention, dry weight was extracted across the entire investigation. In particular, 5% of the subject's weight was subtracted in the case of mild degree of ascites, 10% for moderate degree of ascites, 15% for massive degree of ascites in addition to another 5% for peripheral edema. 24 Correspondingly, BMI was also calculated in terms of the dry weight.
The primary outcome of current study was 1-year all-cause mortality. All patients underwent regular follow-up at 1-month, 3-month, half one year, and 1 year (365-day) after discharge via telephone interviews or at the clinics of the two tertiary hospitals. Final follow-up was completed in December 2023. The dates and causes of death were recorded upon inquiries.
Nutritional status assessment
The assessing process pertinent to GLIM criteria has been depicted in detail. 10 In summary, the GLIM working group recommends a two-step approach combining risk screening and diagnosis. 25 The initially screening step in the current study was carried out with a validated tool: the Royal Free Hospital Nutritional Prioritizing Tool (RFH-NPT). Patients with RFH-NPT score ≥1 were classified as malnutrition risk. Subsequently, subjects fulfilling at least one of the three phenotypic criteria (i.e. involuntary weight loss, low BMI, and muscle mass reduction) in combination with at least one of the two etiologic criteria (i.e. food intake or assimilation reduction and inflammation) were regarded as malnutrition.
Regarding phenotypic criteria, involuntary weight loss was assessed in terms of comparison between the historical weight within 6 months and the measured weight upon hospitalization
Statistical analysis
All analyses were carried out using R version 4.0.4 (https://www.rproject.org/) based on packages including but not limited to rms, readxl, ggplot2, survival ggDCA, pROC, timeROC, glmnet and DynNom. Quantitative variables were shown as median (interquartile range, IQR), and differences were compared using the non-parametric Mann–Whitney U test. Qualitative variables were expressed as number (proportion), and differences were analyzed using the χ2 or Fisher's exact test as appropriate. In addition, we applied the X-tile project to calculate the diagnostic threshold pertaining to the low-, moderate-, and high-risk points for all patients, in terms of the optimal values generated from the Kaplan–Meier survival curve upon the log-rank test. Prognostic predictors for 1-year all-cause mortality were identified using multivariate Cox regression models and demonstrated in the forest plots. To avoid redundancy and collinearity, any covariate constituting the CTP classification or the MELD-Na score was not entered into further multivariate analyses simultaneously. 31 Independent variables were presented with hazard ratios (HRs) alongside 95% confidence intervals (CIs). The nomograms to predict survival status were constructed using resultant variables and internally validated upon 1000 bootstraps. Notably, two models integrating respective CTP classification (Nomo#1) or MELD-Na score (Nomo#2) were separately built with the purpose of facilitating feasibility and maximizing generalizability. The discriminatory ability regarding the nomograms was evaluated according to the C-index, area under the receiver operating characteristics curve (AUC), time-dependent area under the ROC (time AUC). The model consistency and clinical benefits were evaluated using the calibration curve and decision curve analysis, respectively. A two-sided p-value <0.05 was regarded as statistical significance.
Results
Clinical features in the GLIM criteria
Totally, 301 patients with decompensated cirrhosis were recruited as the derivation cohort and 101 as the external validation cohort. Applying the GLIM criteria, 121 (40.2%) and 57 (56.4%) patients were identified with malnutrition in the derivation cohort and the validation cohort, respectively. Across the entire cohorts, low BMI represented the most common phenotypic criterion. The frequency of involuntary weight loss, low BMI and muscle mass reduction-defined malnutrition was present in 59, 84 and 35 subjects, respectively. The clinical features of the study population are shown in Table 1, along with a comparison between the normally nourished group and malnutrition group. Notably, patients with malnutrition were prone to be older and male predominance, had lower BMI, albumin, sodium, less frequencies of CTP classification A, while higher WBC, NLR, PLR, TBIL, ALP, creatinine, PT-INR, MELD-Na score, alcohol causes, and more frequencies of ascites.
The clinical features of the study population classified by the Global Leadership Initiative on Malnutrition criteria.

GLIM: Global Leadership Initiative on Malnutrition; IQR: interquartile range; CTP: Child-Turcotte-Pugh; MELD-Na: Model for End-stage Liver Disease-Sodium; HBV: hepatitis B virus; HCV: hepatitis C virus; AILD: autoimmune liver disease; BMI: body mass index; WBC: white blood cell count; RBC: red blood cell count; PLT: platelet; HGB: hemoglobin; NLR: neutrophil-to-lymphocyte ratio; PLR: platelet-to-lymphocyte ratio; TBIL: total bilirubin; ALT: alanine aminotransferase; ALP: alkaline phosphatase; PT-INR: prothrombin time-international normalized ratio.
Kaplan–Meier survival curve
In terms of the Kaplan–Meier survival curve, patients exhibiting normally nourished had obviously better survival conditions than those exhibiting malnourished (log-rank test, p < 0.0001, Figure 1). Furthermore, 14 and 43 deaths were recorded from the normally nourished group and malnutrition group during the follow-up period, respectively, conveying a survival rate of 92.2% and 64.5%. Overall, the deceased reasons were attributed to organ failure in 26 patients, sepsis in 10 patients, severe variceal hemorrhage in 9 patients, deteriorated HE in 6 patients and uncertainty in 6 patients (nourished vs malnutrition group: 3/2/6/1/2 vs 23/8/3/5/4, p = 0.021).
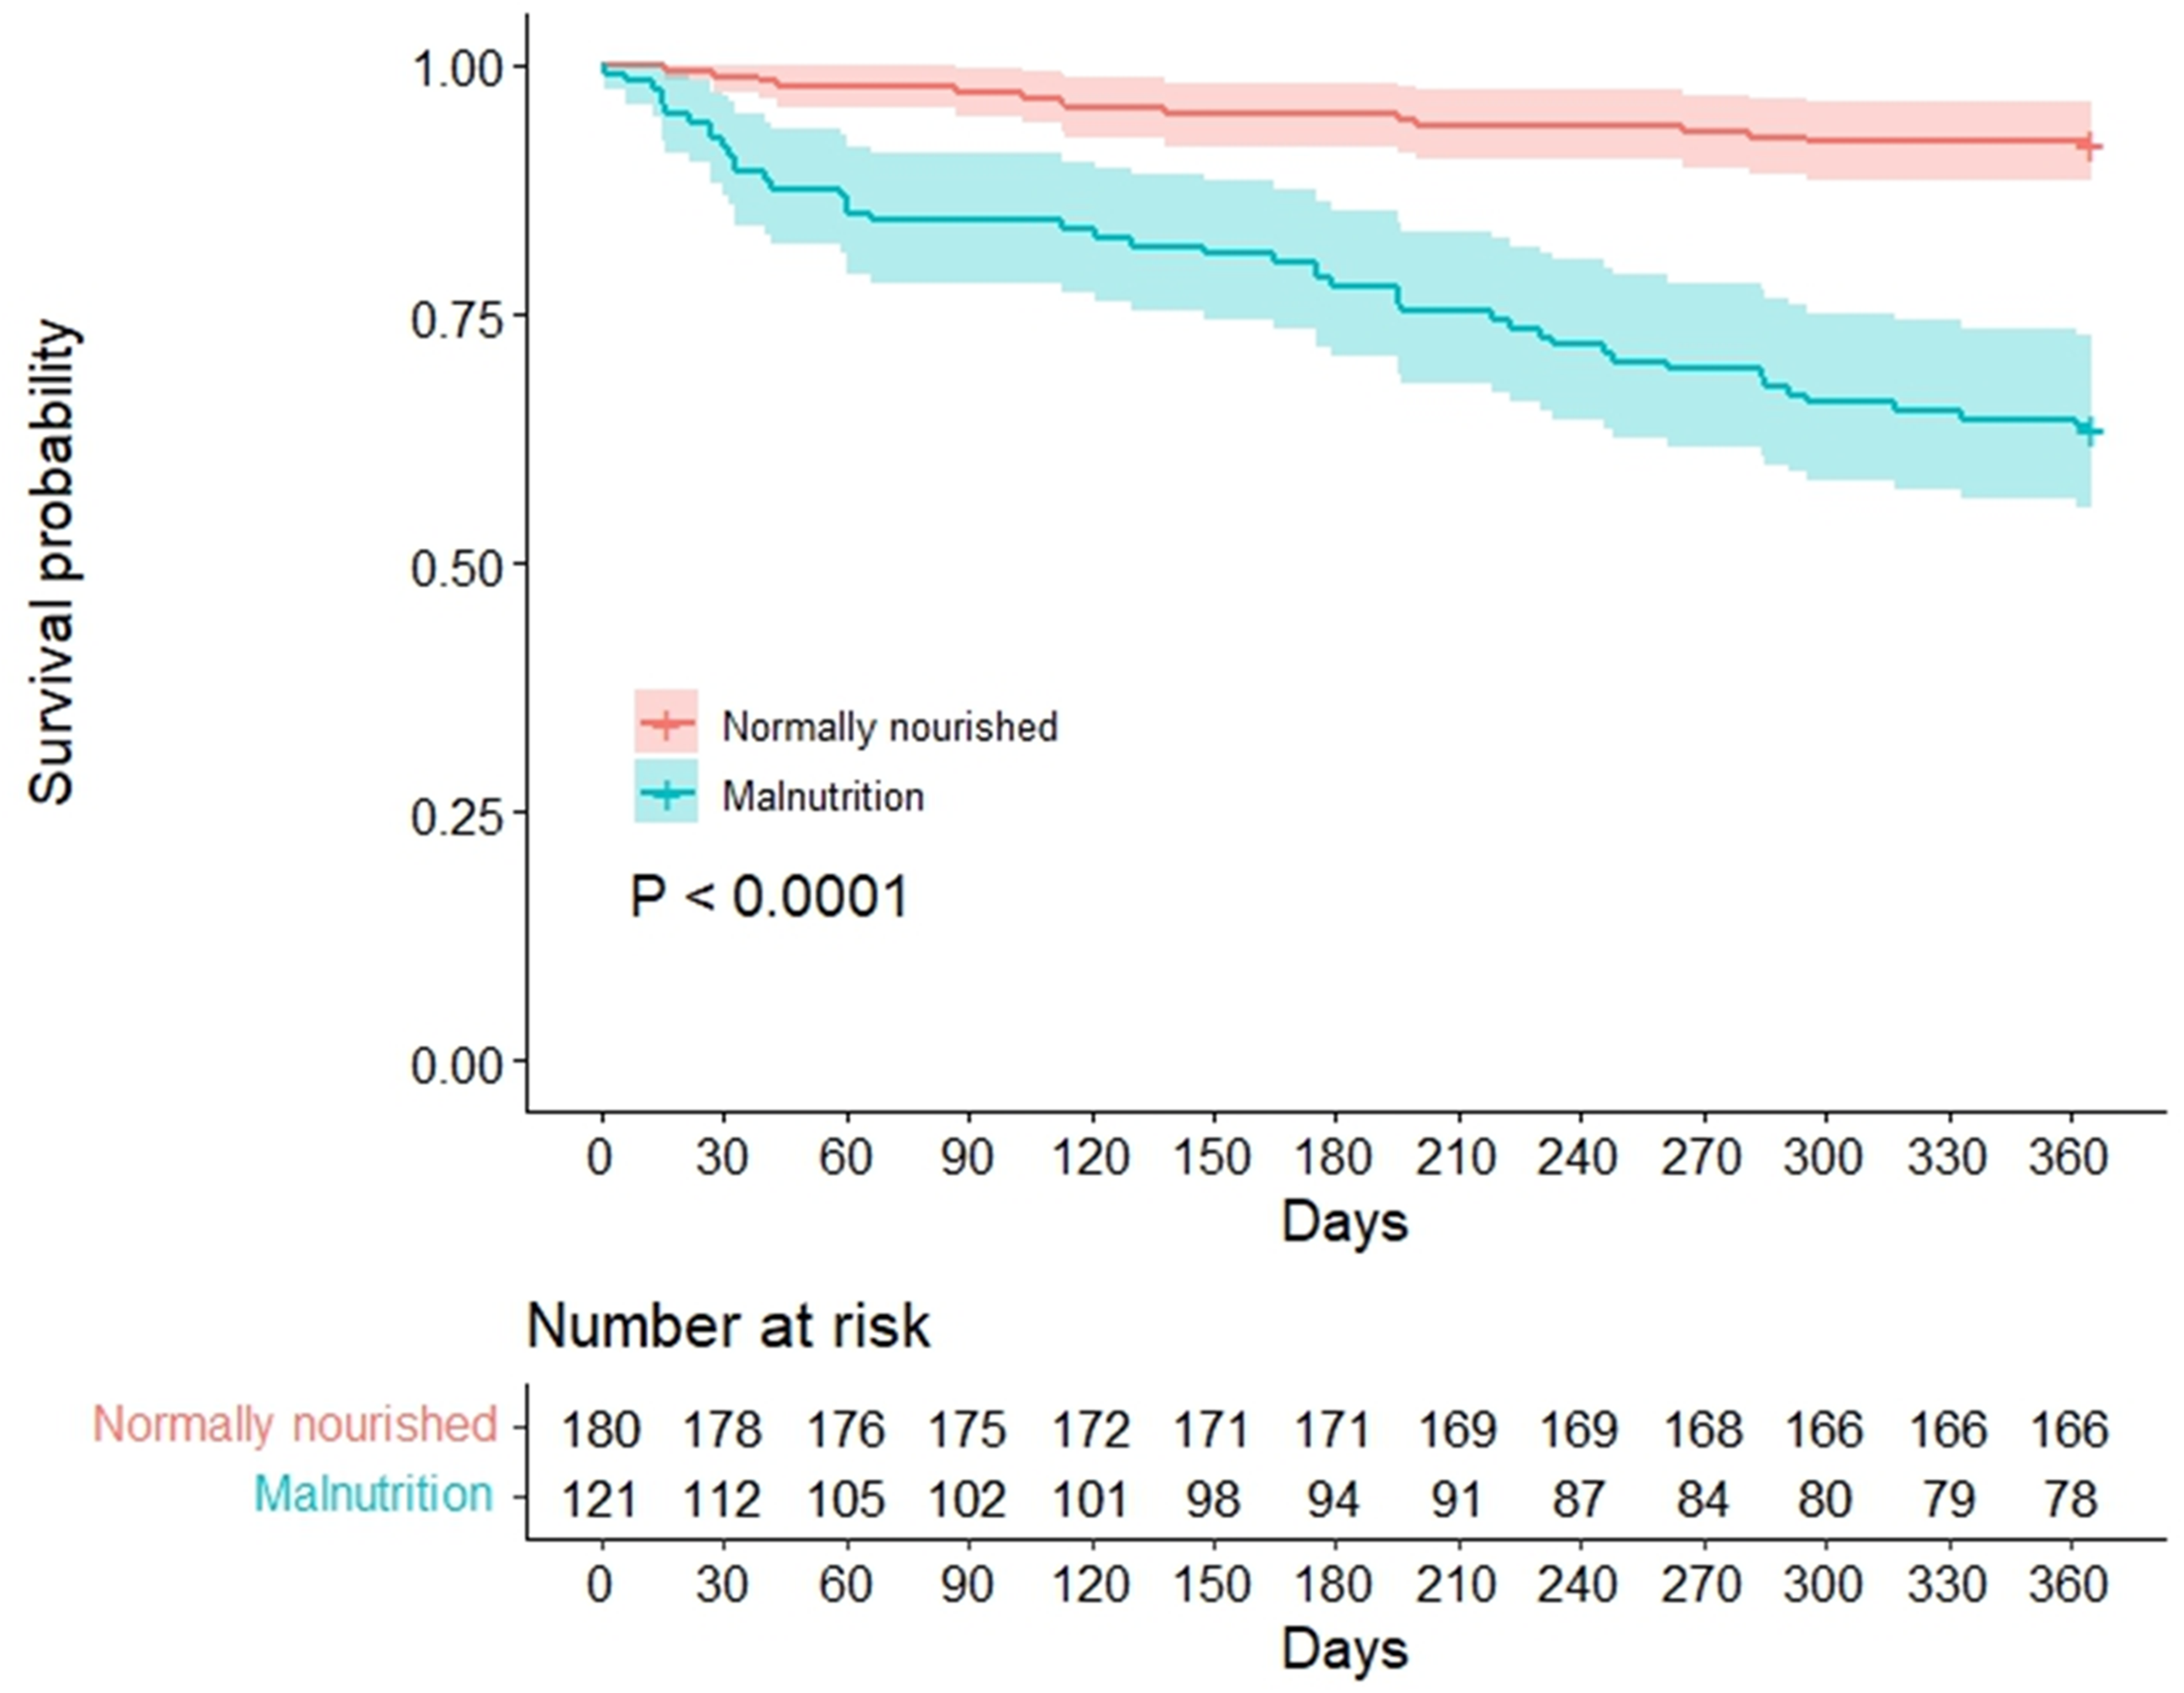
Kaplan–Meier survival curve of 1-year all-cause mortality classified by the GLIM criteria.
Prognostic predictors associated with mortality
Looking at initial screening upon the univariate Cox regression analysis, 25 baseline characteristics were reduced to 16 variables (Table S1). Next, we further took redundancy and collinearity into account. In particular, NLR and PLR were more pronounced metrics concerning systemic inflammation in the context of cirrhosis relative to WBC; CTP classification encompassed ascites, HE, albumin, TBIL, and PT-INR; MELD-Na was calculated on the basis of TBIL, creatinine, PT-INR, and sodium. In this regard, liver disease severity was reflected by the CTP classification or MELD-Na score, since two models were constructed for each scoring system in isolation.
Figure 2(A) shows the results of CTP-dictated model in a forest plot. The multivariate Cox regression adjusting NLR, PLR, ALP, creatinine, and alcohol indicated that GLIM-defined malnutrition (HR = 3.139, 95% CI: 1.670–5.901, p < 0.001), sodium, and advanced CTP classification were independent prognostic predictors for all-cause mortality. On the other hand, Figure 2(B) shows the results of MELD-Na-dictated model in a forest plot. After multivariable adjustment for NLR, PLR, ascites and HE, GLIM-defined malnutrition ((HR = 3.456, 95% CI: 1.809–6.602, p < 0.001)), albumin, alcohol, and MELD-Na score remained independent prognostic predictors.

Multivariate Cox regression analysis concerning the association between the GLIM-defined malnutrition and 1-year all-cause mortality in the CTP-dictated model (A) and MELD-Na-dictated model (B).
Nomograms and their performance
Two nomograms integrating respective CTP classification (Nomo#1) or MELD-Na score (Nomo#2) were built based on the independent variables outlined above (Figure 3(A) and (F)). The points scale pertinent to each variable were summed to a total score, subsequently projected on the bottom scale implicating the probability of 1-year survival. The C-index of Nomo#1 was 0.808 (95% CI: 0.769–0.847) in the derivation cohort and 0.741 (95% CI: 0.702–0.780) in the validation cohort. Moreover, Nomo#1 yielded an AUC of 0.847 and 0.786, respectively, in the derivation cohort and validation cohort alongside time AUC showing consistently good discrimination regarding 1-year all-cause mortality (Figures 3(C), 3(D) and 4(B), 4(C)). The calibration curve of Nomo#1 revealed a good correlation between the predicted survival and actual observed survival in both cohorts (Figures 3(B) and 4(A)).

Models integrating respective CTP classification (Nomo#1) or MELD-Na score (Nomo#2) in the derivation cohort predicting 1-year all-cause mortality in patients with decompensated cirrhosis (A, F). To use the nomogram, an individual subject's value is located on each value axis, and a line is drawn upward to identify the number of points retrieved for selective variable value. The total points projected on the bottom scales indicate the probability of 1-year survival. Calibration curves for predicting cirrhosis survival at 1-year in Nomo#1 (B) and Nomo#2 (G). Nomogram-predicted probability of overall survival is plotted on the x-axis, and actual observed overall survival (estimated by Kaplan–Meier analysis) is plotted on the y-axis. AUC curves concerning Nomo#1 (C) and Nomo#2 (H). Time AUC concerning Nomo#1 (D) and Nomo#2 (I). Decision curves implicating the net benefit with respect to the use of the nomogram for predicting 1-year all-cause mortality in Nomo#1 (E) and Nomo#2 (J).

Calibration curves integrating respective CTP classification (Nomo#1) or MELD-Na score (Nomo#2) in the validation cohort (A, E). AUC curves concerning Nomo#1 (B) and Nomo#2 (F). Time AUC concerning Nomo#1 (C) and Nomo#2 (G). Decision curves implicating the net benefit with respect to the use of the nomogram for predicting 1-year all-cause mortality in Nomo#1 (D) and Nomo#2 (H).
Similarly, the C-index of Nomo#2 was 0.837 (95% CI: 0.798–0.876) in the derivation cohort and 0.719 (95% CI: 0.680–0.758) in the validation cohort. Resultant AUC were 0.873 and 0.749 in the derivation cohort and the validation cohort, respectively (Figures 3(H) and 4(F)). A constant prediction capability and close correspondence between the predicted 1-year survival probability and actual survival probability was demonstrated by the time AUC and calibration curve of Nomo#2 (Figures 3(G), 3(I) and 4(E), 4(G)).
Clinical application of the nomograms
The decision curve analysis for Nomo#1 and Nomo#2 is presented in Figures 3(E), 3(J) and 4(D), 4(H), respectively, in the derivation cohort and validation cohort. The decision curve clearly implicated that our proposed models had better benefits in comparison to sole GLIM criteria or conventional score, that is, CTP classification or MELD-Na score.
Based on Nomo#1, we obtained the total prognostic score from each patient and further categorized the derivation cohort into three mortality risk groups in terms of threshold determined by the X-tile: low-risk (<7.6 points), moderate-risk (7.6–10 points) and high-risk (>10 points) to assess the subgroups that were positively affected by the model (Figure S2A). Kaplan–Meier survival curves unveiled that Nomo#1 had a good prognostication concerning 1-year all-cause mortality among patients with decompensated cirrhosis in both cohorts (Figure 5(A) and (C)).

Kaplan–Meier survival curve of the two nomograms in the derivation cohort (A, B) and validation cohort (C, D).
Based on Nomo#2, patients in the derivation cohort were also classified into the low-risk (<10.7 points), moderate-risk (10.7–14.2 points), and high mortality risk (>14.2 points) groups (Figure S2B). Accordingly, Kaplan–Meier survival curves unraveled that the model was suitable to forecast the probability of 1-year survival in both cohorts (Figure 5(B) and (D)).
Discussion
To the best of our knowledge, this is the first study to construct and validate nomograms by combining the GLIM criteria and other significant predictors in relation to 1-year all-cause mortality in cirrhotic patients experiencing acute decompensating insults. GLIM-defined malnutrition was associated with approximately three times the likelihood of death, even if adjusted for underlying disease severity. Upon the results from C-index, calibration curve and decision curve analyses, the proposed models exhibited good discrimination, high agreement as well as clinical benefits. Moreover, a well-performed stratification regarding mortality risk was observed within the generated nomograms. Notably, the clinical efficacy and practical usefulness of these predictive models were further affirmed in an independent external cohort.
The pathogenesis of malnutrition in the context of cirrhosis seems complicated and multifactorial, which is still under intensive investigations. Generally speaking, these precipitating factors and contributory causes comprise reduced oral intake due to anorexia or early satiety, malabsorption, increased resting energy expenditure, dysregulated macronutrient metabolism, intestinal dysbiosis, and sedentary lifestyle. 3 Furthermore, incurring events due to decompensation and repetitive therapeutic approaches may also aggravate this debilitating status. In this direction, a large body of publications has elucidated the close connection between malnutrition and versatile unfavorable outcomes, including mortality, unplanned re-hospitalization, increased healthcare costs in addition to declined quality of life. The cornerstone to instigate and guide prompt and efficient nutrition treatment considerably relies on accurate identification of patients at malnutrition risk or experiencing malnutrition. Several reputable academic societies have highlighted the clinical implication regarding nutritional screening and assessment in the context of cirrhosis.26,32,33 However, estimation of malnutrition among patients with cirrhosis appears to be challenging and difficult, since this population is predisposing to fluid fluctuations and pathophysiological shifts. To eliminate aforesaid obstacles and refine malnutrition diagnosis, some specific modalities have been developed and addressed such as RFH-NPT and CT-determined skeletal muscle quantity. More recently, the GLIM criteria have been launched, which is regarded as a universal toolkit covering the majority of predominant nutrition indicators. 34 Therefore, our study concentrated on applying the GLIM criteria to identify patients prone to higher mortality risk and verifying the prognostic impact of GLIM-defined malnutrition by building resultant nomograms. To ascertain validity and generalizability of our proposed models, external validation with independent cohort was carried out.
Some studies have elaborated on the negative effect of malnutrition, as defined by the GLIM, on prolonged length of stay, short-term and long-term overall mortality in addition to waitlist mortality among cirrhosis.35–38 For instance, a large cohort of 1002 adult Chinese patients with cirrhosis reported a prevalence of GLIM-defined malnutrition of 34.3%, and the presence of malnutrition was in close relation to adverse outcomes such as ascites, spontaneous bacterial peritonitis, and in-hospital death. 12 The variation concerning estimated prevalence between aforesaid investigation and our study may be attributable to distinct nutritional screening instrument, different diagnostic cut-off pertaining to low muscle quantity and divergent setting of etiologic criteria. In the current study, patients in the malnutrition group exhibited remarkably higher odds of death. Multivariate Cox analyses demonstrated that GLIM-defined malnutrition, serum albumin, sodium, alcohol, and both indicators of underlying disease severity, that is, CTP classification and MELD-Na score, remained independently prognostic predictors of 1-year all-cause mortality. Actually, single laboratory metric such as hypoalbuminemia or hyponatremia is referring to renal dysfunction, hyperdynamic circulation, and systemic inflammation.39,40 Moreover, patients with alcohol-related cirrhosis in more deleterious or severe manner were suffering from poor prognosis. 41 Thus, two separately nomograms integrating CTP classification or MELD-Na were developed in combination with all other prognostic predictors.
MELD-based scores (e.g. MELD-Na) and CTP classification are serving as hallmarks to evaluate prognosis in the context of end-stage liver disease.42,43 However, the clinical effectiveness and practical usefulness of those systems rely on specific scenario and target population with heterogeneous findings. 44 Furthermore, the prediction of original MELD score continues to fade year by year, and there exist controversies pertaining to performance concerning the future development of complications. 45 In this regard, amendments have been addressed to improve prognostic values, but an unmet need should be acknowledged to predict mortality among decompensated cirrhosis, in particular, the setting of hospitalized subjects. 46 Most recently, an updated version of the MELD score, designated as the MELD 3.0, has been endorsed by adding female sex and serum albumin with robustly improved prediction.47,48 However, the inclusion of albumin levels in aforesaid iteration as well as our established Nomo#2 should be interpretated with caution. It is of concern that hypoalbuminemia is pinpointing impaired liver reserved function which can be temporarily unregulated upon external administration, leading to passive usage of albumin infusion and subsequently adverse healthcare outcomes. 49 As such, access to comprehensive aspects covering pathophysiological perturbations in cirrhosis could lead to earlier intervention and effective management. Herein, two GLIM-dictated models demonstrated good discrimination, close correlation, and clinical benefits in terms of the C-index/time AUC, calibration curve, and decision curve analysis, which were further corroborated in the validation cohort. These nomograms are not only convenient to implement, but may also provide clinician/patient-friendly interface as a practical advantage.
The main limitation of the current study is that all enrolled subjects were patients with decompensated cirrhosis experiencing acute insults, and this setting automatically met the GLIM etiologic criteria. Correspondingly, other indicator such as inflammatory biomarker (e.g. CRP) was not included in the framework of applied GLIM. This may lead to the relatively high estimation of malnutrition prevalence. Notably, a 2024 guidance from the GLIM-constituted working group argues that “The occurrence of acute or chronic disease, infection, or injury that is often/usually associated with inflammatory activity may fulfill the GLIM disease burden/inflammation criterion; that is, confirmation by laboratory markers is not always necessary. 50 ” Additionally, the magnitude of malnutrition was not clarified due to the absence of validated cut-offs for muscle mass reduction. Last, the implication pertaining to our predictive model should be further corroborated in regions suffering a relatively less organ shortage such as Western countries. 51 However, one strength of the current investigation is that it was a two-center study to reduce variations on account of the admission cause and in-hospital therapeutic regimen, fostering the generalizability of our proposed nomograms.
Conclusions
In summary, GLIM criteria-defined malnutrition negatively affected long-term mortality in the context of decompensated cirrhosis.
Supplemental Material
sj-docx-1-sci-10.1177_00368504251320157 - Supplemental material for Development and external validation of Global Leadership Initiative on Malnutrition-dictated nomograms predicting long-term mortality in hospitalized patients with cirrhosis
Supplemental material, sj-docx-1-sci-10.1177_00368504251320157 for Development and external validation of Global Leadership Initiative on Malnutrition-dictated nomograms predicting long-term mortality in hospitalized patients with cirrhosis by Qing Liu, Yumei He, Fang Yang, Gaoyue Guo, Wanting Yang, Liping Wu and Chao Sun in Science Progress
Supplemental Material
sj-docx-2-sci-10.1177_00368504251320157 - Supplemental material for Development and external validation of Global Leadership Initiative on Malnutrition-dictated nomograms predicting long-term mortality in hospitalized patients with cirrhosis
Supplemental material, sj-docx-2-sci-10.1177_00368504251320157 for Development and external validation of Global Leadership Initiative on Malnutrition-dictated nomograms predicting long-term mortality in hospitalized patients with cirrhosis by Qing Liu, Yumei He, Fang Yang, Gaoyue Guo, Wanting Yang, Liping Wu and Chao Sun in Science Progress
Supplemental Material
sj-pdf-3-sci-10.1177_00368504251320157 - Supplemental material for Development and external validation of Global Leadership Initiative on Malnutrition-dictated nomograms predicting long-term mortality in hospitalized patients with cirrhosis
Supplemental material, sj-pdf-3-sci-10.1177_00368504251320157 for Development and external validation of Global Leadership Initiative on Malnutrition-dictated nomograms predicting long-term mortality in hospitalized patients with cirrhosis by Qing Liu, Yumei He, Fang Yang, Gaoyue Guo, Wanting Yang, Liping Wu and Chao Sun in Science Progress
Supplemental Material
sj-pdf-4-sci-10.1177_00368504251320157 - Supplemental material for Development and external validation of Global Leadership Initiative on Malnutrition-dictated nomograms predicting long-term mortality in hospitalized patients with cirrhosis
Supplemental material, sj-pdf-4-sci-10.1177_00368504251320157 for Development and external validation of Global Leadership Initiative on Malnutrition-dictated nomograms predicting long-term mortality in hospitalized patients with cirrhosis by Qing Liu, Yumei He, Fang Yang, Gaoyue Guo, Wanting Yang, Liping Wu and Chao Sun in Science Progress
Footnotes
Acknowledgements
We thank all nurses who participated in this study.
Author contributions
Qing Liu: conceptualization, data curation, formal analysis; Yumei He: methodology, investigation, data curation; Fang Yang: methodology, investigation, data curation; Gaoyue Guo: software, resources; Wanting Yang: resources; Liping Wu: conceptualization, supervision; Chao Sun: conceptualization, writing the original draft, writing – review & editing. All authors read and approved the final manuscript.
Consent to participate
The current study has been approved by the ethical committee of Tianjin Medical University General Hospital (IRB-KY-181) as well as that of the Third People's Hospital of Chengdu (2022-S-121). Written informed consent was provided by all patients.
Data availability
Data are available on reasonable request to the corresponding author.
Declaration of conflicting interests
The authors declared no potential conflicts of interest with respect to the research, authorship, and/or publication of this article.
Funding
The authors received no financial support for the research, authorship, and/or publication of this article.
Supplemental material
Supplemental material for this article is available online.
References
Supplementary Material
Please find the following supplemental material available below.
For Open Access articles published under a Creative Commons License, all supplemental material carries the same license as the article it is associated with.
For non-Open Access articles published, all supplemental material carries a non-exclusive license, and permission requests for re-use of supplemental material or any part of supplemental material shall be sent directly to the copyright owner as specified in the copyright notice associated with the article.