
Abstract
Background
Liver cirrhosis represents a significant challenge to global public health. However, reliable biological markers for diagnosing liver cirrhosis are lacking in clinical practice.
Methods
Transcriptome data from liver cirrhosis patients were acquired from the Gene Expression Omnibus database to identify coexpressed differentially expressed genes (DEGs). Mitochondria-related and ferroptosis-related genes were obtained from MitoCarta3.0 and FerrDB V2, respectively. Immune-related module genes were examined through Weighted Gene Co-Expression Network Analysis (WGCNA). By using WGCNA combined with machine learning methods, we identified immune-related biomarkers for liver cirrhosis. The immune cell infiltration was evaluated using CIBERSORTx, with core immune cell types further refined through LASSO regression and random forest. Hub biomarkers were validated using single-cell sequencing, with additional confirmation provided by histological staining and immunohistochemistry (IHC).
Results
This study identified 2474 DEGs between liver cirrhosis and control groups. Intersection analysis with ferroptosis-related genes and mitochondria-related genes narrowed to 13 hub genes, from which machine learning selected 8 biomarkers. CIBERSORT and Wilcoxon tests revealed notable variations in the 12 immune cell types across the different groups. The WGCNA identified immune-related genes, with four immune-related biomarkers (DHODH, FXN, CS, and ISCU) identified as hub biomarkers. Integrated LASSO regression, random forest, and immune infiltration analyses pinpointed the core cells influencing disease progression. The relationship between the hub biomarkers and immune cells was validated by single-cell data analysis. ISCU expression was verified through IHC, consistent with our bioinformatics findings. Molecular docking identified three small molecules with potential effectiveness.
Conclusion
Our study identified mitochondrial ferroptosis-related genes (DHODH, FXN, CS, and ISCU) as pivotal biomarkers in liver cirrhosis progression and demonstrated a close connection with the immune microenvironment. These genes may serve as diagnostic indicators and therapeutic targets, thereby providing novel perspectives on the pathogenesis of liver cirrhosis.
Introduction
Liver cirrhosis, a chronic liver condition that arises from various hepatotoxic factors and excessive alcohol consumption, poses a significant threat to global health. 1 It may progress to critical stages, such as liver failure or the development of hepatocellular carcinoma, resulting in over 1 million deaths worldwide per year. 2 Although, the most effective treatment for end-stage liver disease is to perform liver transplantation on patients, it encounters several significant challenges, such as the scarcity of donors, risk of immune rejection, surgical complexity, and high costs. Previous research has identified potential biomarkers for liver cirrhosis, including serum markers such as liver enzymes and fibrosis indicators, as well as imaging techniques. However, these methods often lack specificity and sensitivity for early diagnosis.3–5 Notably, there remains a paucity of reliable biological markers for diagnosing liver cirrhosis in clinical practice. 6 As sequencing technologies have advanced rapidly, the investigation of disease biomarkers has emerged as a potentially viable alternative approach. 7 Thus, obtaining a deeper and more comprehensive understanding of the specific molecular and cellular pathways involved in liver cirrhosis is critical for halting its progression and for promoting the development of more effective diagnostic tools and therapeutic methodologies.
Oxidative stress occurs when the production of oxidants surpasses the body's capacity to neutralize the detrimental effects of antioxidants. This imbalance results in the accumulation of reactive oxygen species (ROS) within cells, overwhelming their natural defenses and causing cellular and tissue damage. 8 Previous studies have identified oxidative stress and mitochondrial dysfunction as key drivers of hepatic cell mortality and structural damage.9,10 In summary, mitochondria-related factors, including the overproduction of ROS, cellular damage induced by oxidative stress, and inflammation-driven cascades, contribute significantly to the development and advancement of cirrhosis. This finding highlights the critical need for further research on the interplay between cirrhosis and mitochondrial dysfunction.
First characterized by Stockwell, ferroptosis is a form of iron-dependent programmed cell death that differs mechanistically from necrosis, apoptosis, and autophagy. 11 This unique cell death pathway is marked by dysregulated iron homeostasis and excessive accumulation of ROS.12,13 Emerging evidence has established ferroptosis as a critical pathological mechanism underlying various diseases, including malignancies and ischemia–reperfusion injury. 13 The liver, being the primary iron storage organ, is particularly susceptible to iron overload-induced damage.13–15 Uncontrolled free iron can mediate hepatotoxicity through ferroptotic pathways, thereby contributing to the pathogenesis of various hepatic disorder.14,15 Recent advances have highlighted the therapeutic potential of small-molecule compounds in targeting ferroptosis.16,17 The pharmacological modulation of this cellular death pathway has emerged as a novel strategy for disease intervention, representing a significant focus in both mechanistic studies and therapeutic development for iron-related pathologies.
Recent studies have also indicated that both ferroptosis and mitochondrial dysfunction exert profound effects on the hepatic immune microenvironment.18,19 The accumulation of ROS and release of damage-associated molecular patterns from ferroptotic hepatocytes can activate hepatic macrophages and dendritic cells, contributing to chronic inflammation and immune dysregulation. Meanwhile, impaired mitochondrial metabolism alters immune cell energy homeostasis, affecting differentiation and function of immune cells such as regulatory T cells, natural killer (NK) cells, and monocytes. These immune changes, in turn, exacerbate hepatic fibrosis and promote cirrhosis progression. These reciprocal interactions between mitochondrial stress, ferroptotic cell death, and immune dysregulation create a self-reinforcing pathological circuit that perpetuates cirrhosis progression. Therefore, the crosstalk between mitochondrial dysfunction, ferroptosis, and the immune microenvironment plays a pivotal role in the pathogenesis of liver cirrhosis. Understanding this interaction may reveal novel diagnostic biomarkers and therapeutic targets.
In this study, gene matrices related to liver cirrhosis were obtained from NCBI Gene Expression Omnibus (GEO) database, mitochondria-related genes were collected from MitoCarta3.0, and ferroptosis-related genes were obtained from FerrDB V2. Two cirrhosis datasets were integrated to identify the differentially expressed genes (DEGs). We utilized machine learning models to pinpoint significant biomarkers associated with mitochondrial ferroptosis-related cirrhosis. Weighted Gene Co-Expression Network Analysis (WGCNA) was used to identify immune-related module genes that were intersected with liver cirrhosis biomarkers. Through the use of CIBERSORT and machine learning, we systematically investigated immune microenvironment, identified key immune cells, and correlated them with specific genes. Four hub biomarkers (FXN, CS, DHODH, and ISCU) were identified, and a diagnostic model was constructed. Single-cell analysis of these genes was performed, and molecular docking suggested potential drug targets. This research aims to investigate novel insights into the fundamental molecular processes and to propose innovative strategies for disease identification and treatment.
Materials and methods
Data source
The expression matrices of GSE36411, GSE14363, GSE25097, GSE139602, and GSE89377 datasets were sourced through the GEO database (https://www.ncbi.nlm.nih.gov/geo/). The GSE36411 dataset (GPL10558 platform) included 21 liver cirrhosis samples and 21 control samples. The GSE14363 dataset (GPL570 platform) included 41 liver cirrhosis samples and 19 control samples. Datasets GSE36411 and GSE14363 underwent logarithmic normalization, and the batch effects were removed by utilizing the “combat” function from Sangerbox 2, a web-based tool for generating information (http://sangerbox.com/home.html). 20 The refined data collections were designated as the screening set, which comprised of 102 specimens with 62 liver cirrhosis and 40 normal samples. Mitochondria-related genes were acquired from the MitoCarta3.0 databases (Supplementary Material Table S1). Ferroptosis-related genes were acquired from the FerrDB V2 database (Supplemental Material Table S2). The identical methodology was employed to validate the results through the application of validation sets GSE25097, GSE139602, and GSE89377. For single-cell data analysis, the dataset was sourced from GSE136103, which included five healthy livers samples and five cirrhotic livers samples. 21
The mitochondrial-related genes used in this study were derived from the MitoCarta3.0 database, a manually curated and experimentally validated repository that comprehensively catalogs 1136 human mitochondrial proteins based on high-confidence proteomic evidence, subcellular localization, and functional annotations. MitoCarta3.0 has been widely adopted in mitochondrial research due to its reliability and scope, making it suitable for studies focused on mitochondrial dysfunction.
Ferroptosis-related genes were retrieved from the FerrDB V2 database, which is a dedicated and up-to-date knowledgebase for ferroptosis regulators, markers, and associated diseases. FerrDB V2 integrates experimental evidence and literature mining to provide categorized gene lists including drivers, suppressors, and markers of ferroptosis.
These databases were selected for their domain-specific focus and curated reliability. However, it is acknowledged that FerrDB V2 may not capture all recently discovered or condition-specific ferroptosis-related genes, especially those identified in noncanonical pathways or less-studied tissues. Likewise, MitoCarta3.0, although extensive, may lack certain tissue-specific mitochondrial gene annotations. Future research could benefit from integrating additional databases or performing de novo pathway inference to address such limitations.
A detailed breakdown of each dataset and sample grouping is provided in Table 1 to clarify the cohort composition:
Summary of GEO datasets and sample counts.

The final integrated screening set consisted of 102 total samples (62 cirrhosis and 40 controls), which were used for DEG identification, machine learning, and WGCNA. Independent validation was performed on three additional datasets (GSE89377, GSE25097, and GSE139602), and GSE136103 was used for single-cell level analysis. This breakdown ensures transparency in data usage and group composition.
It should be noted that the single-cell RNA sequencing dataset (GSE136103) and the bulk RNA transcriptome datasets (GSE36411, GSE14363, etc.) were obtained from independent cohorts and not from the same individuals. While all datasets included samples from patients with histologically confirmed liver cirrhosis and matched healthy controls, direct patient-level correspondence is not available. Therefore, cross-validation between bulk and single-cell data is performed at the population level rather than within the same subjects.
Screening of differentially expressed genes
The DEGs associated with cirrhosis were identified by utilizing Sangerbox 2 with the criteria of |log2(fold change) | (log2FC) > 0.263 and FDR < 0.05 in the screening set. The results were visualized with a volcano plot and heatmap, which were generated using the ggplot2 and pheatmap R packages, respectively. The intersection among DEGs, mitochondria-related genes, and ferroptosis-related genes was systematically identified using VennDetail (http://hurlab.med.und.edu:3838/VennDetail/), a web-based tool designed for generating and analyzing Venn diagrams.
Functional enrichment analysis
Gene Ontology (GO) enrichment analysis is a broadly applied bioinformatics methodology that provides comprehensive insights into gene datasets by categorizing them into three main aspects: Biological Process, Cellular Component, and Molecular Function. Kyoto Encyclopedia of Genes and Genomes (KEGG) pathway enrichment analysis is frequently employed to elucidate underlying biological mechanisms and functions. Disease Ontology (DO) enrichment analysis, conversely, facilitates the identification of diseases that are predominantly associated with the relevant genes. The outcomes of these analyses GO, KEGG, and DO were effectively visualized using the ggplot2 package. 22
Screening of biomarkers using machine learning
The samples were randomly partitioned into a training cohort comprising 70% of the data and a test cohort comprising 30% of the data, and the DALEX (Descriptive Machine Learning Explanations) package was employed for preliminary machine learning analyses. 23 The DALEX is a model-agnostic framework designed to explain, validate, and visualize any predictive model—no matter whether it is a random forest, gradient-boosted tree, neural network, or other black-box algorithm. 23 By plotting the model residuals, ultimately, four machine learning algorithms, namely Random Forest (RF), Support Vector Machine (SVM), eXtreme Gradient Boosting (XGB), and Gradient Boosting Machine (GBM), were employed to identify biomarkers associated with liver cirrhosis. Additionally, we used receiver operating characteristic (ROC) curves for evaluating the optimal models in this analysis.
Immune infiltration analysis
To investigate the disease immune microenvironment and quantify immune cell infiltration, the web-based tool CIBERSORTx (https://cibersortx.stanford.edu/) was employed. The set of 22 immune cell genes (LM22) was utilized as the reference standard with the number of permutations set to 1000. The infiltration profiles illustrated by utilizing the ggplot2 and pheatmap R packages. 22 Additionally, the correlation between distinct immune cell types was evaluated by means of Spearman's rank correlation coefficient. Subsequently, the resultant correlation matrix was visualized utilizing the corrplot package in R Programming Language (R).
Identification of immune-related biomarkers via WGCNA
The WGCNA R package was employed to perform WGCNA using the expression data from the screening set. 24 Initially, a sample clustering tree was generated to identify and remove outlier samples based on a specified cut off height threshold. Subsequently, a soft-thresholding power β was selected to ensure that the network adhered to a scale-free topology. Thereafter, a dynamic pruning method was used to identify coexpression modules. Through WGCNA, modules that were significantly associated with differentially infiltrating immune cell populations were systematically identified. Finally, the intersection of genes within these key modules and disease biomarkers was determined to identify immune-related biomarkers, which were considered as hub biomarkers.
While WGCNA is a powerful method for detecting gene coexpression modules, we recognize that the relatively small sample size in the screening dataset (62 cirrhosis and 40 control samples) may introduce statistical instability or bias in module detection. To mitigate this concern, we conducted a sensitivity analysis to assess the robustness of module preservation and hub gene identification. Specifically, we performed subsampling by randomly excluding 10–20% of the samples and rerunning WGCNA across five iterations. The resulting module eigengenes and hub genes were compared with those from the full dataset. The key modules (darkred and turquoise) identified in the original analysis remained preserved across all iterations with high module preservation statistics (Z-summary > 10), and high overlap of hub genes (average gene overlap ratio > 75%) (Supplemental Material Table S4, Figure S2), confirming the stability of coexpression patterns. This suggests that our findings are not overly sensitive to small variations in sample composition but the identified immune-related modules are robust despite the limited sample size.
Correlation analysis
The relationships between infiltrating immune cells and the expression of hub biomarkers, as well as the relationships among different hub genes themselves, were comprehensively analyzed. The associations among various hub genes were visualized using the GGally R package, whereas the relationships between different infiltrating immune cells and hub biomarkers were illustrated using the linkET R package.
Receiver operating characteristic curve-based analysis
We assessed the diagnostic performance of the identified hub biomarkers by constructing ROC curves using the pROC package. 25 Hub biomarkers were deemed to have high specificity and sensitivity in distinguishing liver cirrhosis from controls when the area under the curve (AUC) value exceeded 0.7. Additionally, a boxplot was used to illustrate the expression levels of hub biomarkers in the screening set, comparing the control group with the liver cirrhosis group.
Construction and verification of the dynamic nomogram
For forecasting the incidence of liver cirrhosis, the “rms” package was employed to create a dynamic nomogram based on the four hub biomarkers. We demonstrated the accuracy of the nomogram's predictive capability using calibration curves, decision curve analysis (DCA) curves, and the clinical impact curve. 26
Gene set enrichment analysis
Using the clusterProfiler and gene set enrichment analysis (GSEA), the important signaling pathways linked to the four hub biomarkers were further examined. The clusterProfile package was utilized to conduct GSEA of the hub biomarkers. Additionally, the c2.cp.kegg.symbols.gmt dataset was employed for the reference gene set in the GSEA. 27
Screening of core immune cells
Wilson's test was used to examine variations in immune cell composition among different tissues. Additionally, the RF package was employed to construct RF models for immune cells, thereby identifying the points with the minimum error rate. Following a ranking of the immune cells based on their significance, the top 10 crucial immune cells were determined. A LASSO regression-based predictive model was subsequently developed using the “cv. glmnet” function from the glmnet package in R. In the LASSO analysis, the parameters were set with alpha fixed at 1, and the optimal lambda value was determined using the lambda min criterion. The core immune cells were determined by intersecting the differential immune cells derived from both the RF analysis and the LASSO regression-based predictive model. Subsequently, these overlapping immune cells were comprehensively evaluated to pinpoint the core immune cells that could potentially affect the development of liver cirrhosis.
Analysis of single-cell RNA sequencing data
To accurately detect cell subpopulations from single-cell RNA sequencing data, we utilized the “Seurat” package for data analysis. 28 With the Seurat R package, essential steps including data normalization, clustering, dimensionality reduction, and visualization were carried out on the single-cell RNA sequencing dataset. A threshold was set such that each gene had to be expressed in at least three cells. In our single-cell RNA sequencing analysis, we applied a filtering threshold requiring that each gene be expressed in at least three cells. This threshold is a commonly adopted standard in single-cell analysis to minimize the inclusion of low-abundance transcripts that may arise from background noise or technical artifacts, especially in droplet-based scRNA-seq platforms. Genes detected in only one or two cells are often considered unreliable due to stochastic dropout events and limited transcript capture efficiency. By using this threshold, we aimed to retain biologically meaningful genes while reducing computational noise and spurious gene–gene correlations.29–31
Additionally, the proportion of mitochondrial genes was determined using the Percentage FeatureSet function, ensuring that each cell contained over 50 genes and less than 20% mitochondrial content per cell. The gene expression matrices underwent normalization and scaling to perform a linear transformation for the remaining high-quality cells, utilizing the “NormalizeData” function and the “ScaleData” function. To address batch effects, principal component analysis for dimensionality reduction and the RunHarmony function from the harmony R package were employed to facilitate sample integration. 32 To detect DEGs and ascertain cellular identity, we utilized the FindAllMarkers function. A two-step approach was implemented, which included automated cell annotation followed by manual refinement. More specifically, the SingleR package was employed for the automatic annotation process. 33 Marker genes were selected based on previously published studies, and these cells were then characterized according to their unique gene expression patterns. 34 In the analysis of each cell type, any clusters showing multiple markers associated with different cell types were excluded from further consideration. The trajectory of Monocyte subtypes was examined using the “CytoTRACE” and “Monocle3” package. Ultimately, various R packages were employed to visualize the outcomes of single-cell data analysis, such as plot1cell, Nebulosa, scRNAtoolVis, and ggplot2.
Histological analysis and immunohistochemistry analysis
The experimental protocol was established, according to the ethical guidelines of the Helsinki Declaration (1975, as revised in 2024). Paraffin-embedded normal liver tissue samples adjacent to hepatic hemangioma (HH), as well as liver cirrhosis tissue samples were collected from the Second Affiliated Hospital of Harbin Medical University. All procedures were conducted with the informed consent of the participants and the approval of the Ethics Review Board of the Second Affiliated Hospital of Harbin Medical University (ID: YJSKY2024-208), specimens were obtained from five individuals with liver cirrhosis and five individuals with HH for immunohistochemical analysis, with the latter group serving as the control. We provide detailed sample information in Supplemental Material Table S3. A total of 10 liver samples were included:
Cirrhosis group (n = 5): Derived from patients diagnosed with advanced liver cirrhosis during partial hepatectomy.
Healthy control group (n = 5): Collected from patients who underwent liver resection for benign liver lesions (e.g. HH) and had no clinical or histological evidence of chronic liver disease.
All specimens were formalin-fixed and paraffin-embedded, anonymized before use, and processed following standard histopathological protocols. The paraffin-embedded sections from patients with liver cirrhosis and HH were dewaxed using xylene and dehydrated using ethanol. For morphological assessment, one paraffin section from each of the liver cirrhosis and HH patients was randomly selected. These sections were subsequently subjected to deparaffinization, rehydration, and staining with hematoxylin and eosin (H&E) as well as Masson's trichrome. The remaining sections were thoroughly rinsed with distilled water and pretreated with EDTA. They were then immersed in a 3.0% H₂O₂ solution to suppress endogenous peroxidase activity and subsequently washed with phosphate-buffered saline (PBS). Overnight incubation was performed at 4°C with a polyclonal antibody targeting ISCU (Proteintech, catalog number: 14812-1-AP, immunogen catalog number: AG6562, concentration: 700 µg/mL). After the incubation period, the sections were rinsed with PBS and stained with diaminobenzidine for color development. Finally, the sections were counterstained with hematoxylin and analyzed under a light microscope.
Prediction of therapeutic drug candidates through molecular docking
Molecular docking experiments were performed to systematically investigate the interactions between potential therapeutic agents and the identified hub biomarkers. Initially, the Drug Signatures Database (DSigDB), available via the Enrichr platform (https://maayanlab.cloud/Enrichr/), was used to screen for potential drugs capable of targeting the hub biomarkers.35,36 Subsequently, the protein structures of the hub biomarkers were retrieved from the UniProt (https://www.uniprot.org/), while the structures of the small molecular drugs were obtained from the PubChem (https://pubchem.ncbi.nlm.nih.gov/). Finally, the binding interactions between the target proteins and small molecules were simulated using AutoDock (version 1.5.6) in the MGLTools package (version 1.5.7) and PyMOL software (version 3.1.0a0).
Results
This section presents the results of our integrated multiomics and bioinformatics analysis. First, we identified DEGs and narrowed them down to candidate hub genes using mitochondrial and ferroptosis-related databases. We then applied machine learning methods to select optimal biomarkers. Next, we examined immune cell infiltration and coexpression modules to identify immune-related biomarkers and assessed their diagnostic performance using ROC analysis. Leveraging an ensemble of pivotal biomarkers, we constructed a diagnostic model. The relationships between hub biomarkers and immune cells were validated using single-cell RNA sequencing. Finally, we performed histological and immunohistochemical validation and explored drug–target interactions through molecular docking. The findings are presented thematically in the following order: (1) identification and validation of biomarkers; (2) immune cell landscape and interactions; (3) single-cell validation; and (4) drug–target exploration.
Screening of hub genes
To initiate our investigation, we first identified DEGs between liver cirrhosis and normal samples.
To investigate the differences in gene expression between liver cirrhosis and normal conditions, we identified DEGs. A total of 2474 DEGs were detected between the liver cirrhosis and control groups, including 1432 upregulated genes and 1042 downregulated genes (Figure 1(a)). The top 50 upregulated and downregulated DEGs are visualized in the heatmap (Figure 1(b)). By intersecting these DEGs with 484 ferroptosis-related genes and 1136 mitochondria-related genes, 13 hub genes were identified for further analysis (Figure 1(c)).
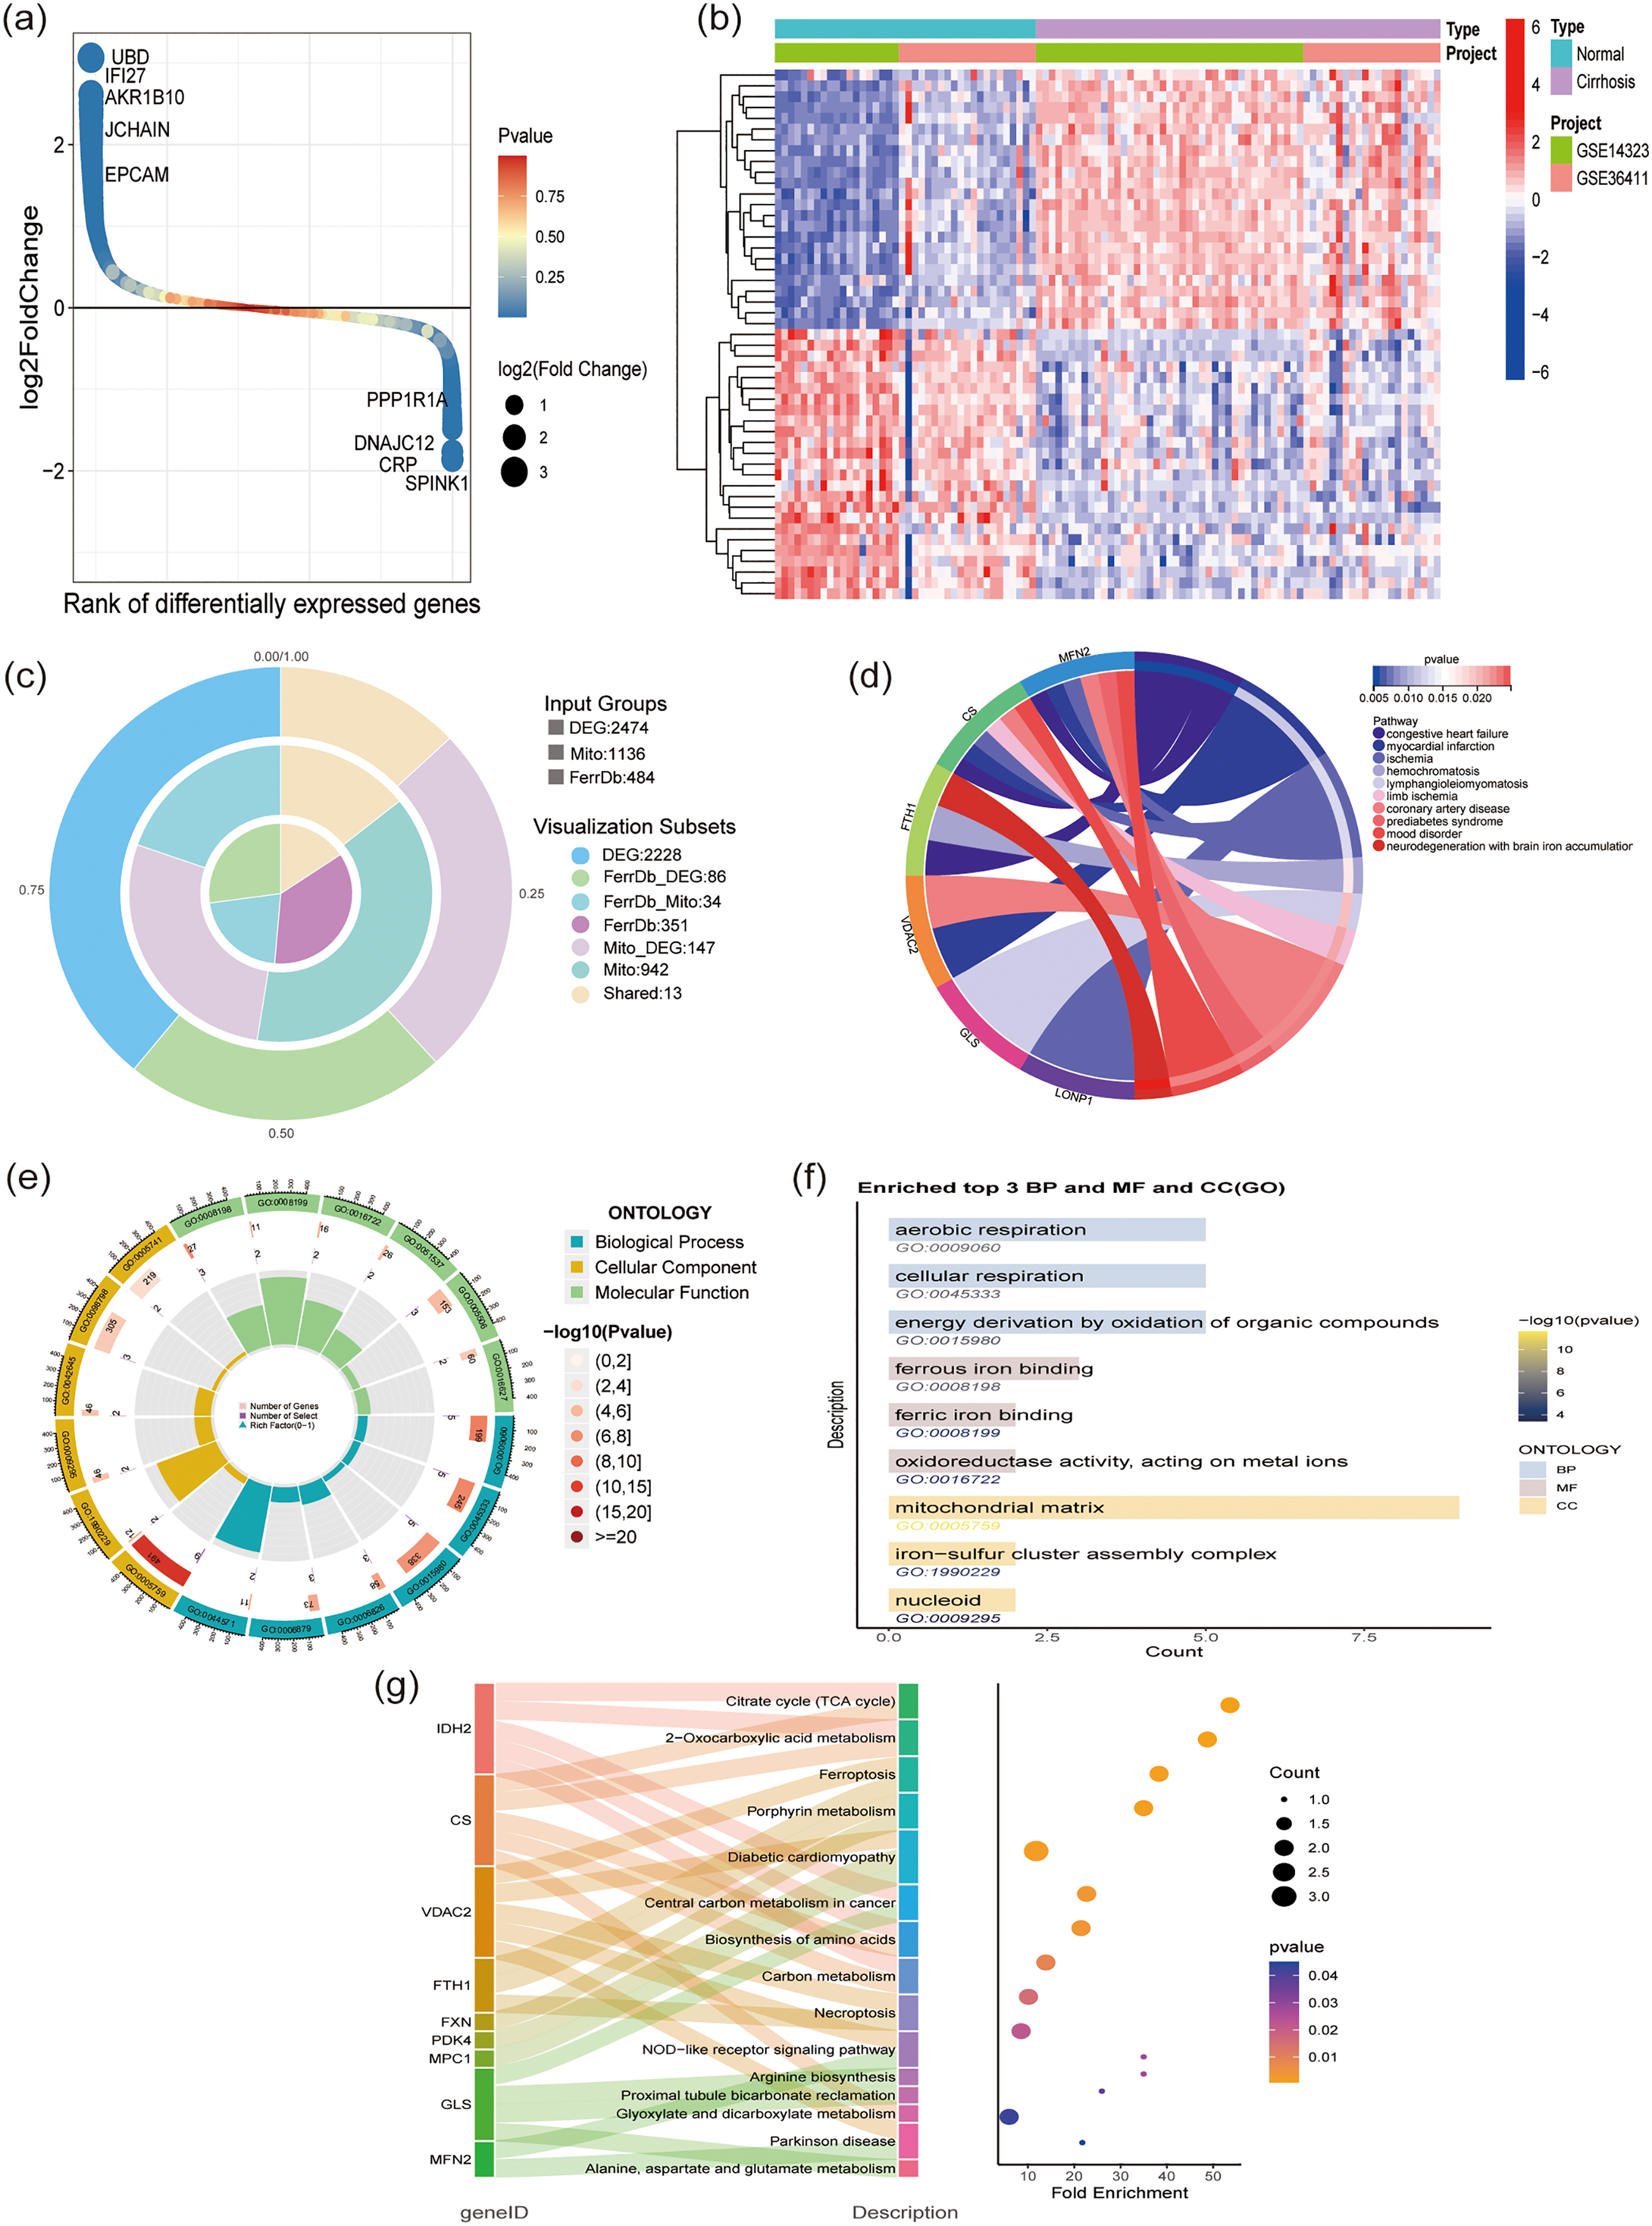
Identification of potential hub genes of liver cirrhosis. (a) Volcano map of DEGs. (b) Heatmap of DEGs between normal and liver cirrhosis samples. (c) Venn diagram of the intersection of DEGs, mitochondria-related genes, and ferroptosis-related genes. (d) Pie chart showing DO analysis of intersection genes. (e and f) Circle chart and bar chart showing GO analysis of intersection genes. (g) Sankey diagram combined with bubble chart showing KEGG analysis of intersection genes. DEG: differentially expressed genes; DO: Disease Ontology; GO: Gene Ontology; KEGG: Kyoto Encyclopedia of Genes and Genomes.
Analysis of enrichment in overlapping genes
To elucidate the underlying biological mechanisms that drive the development of liver cirrhosis, DO, GO, and KEGG analyses were conducted. Disease Ontology analysis identified several disease categories that share common pathogenic mechanisms with liver cirrhosis, including congestive heart failure, myocardial infarction, ischemia, hemochromatosis, and lymphangioleiomyomatosis (Figure 1(d)). Additionally, GO analysis revealed significant enrichment in biological functions, such as energy derivation through the oxidation of organic compounds, ferrous iron binding, and the assembly of iron−sulfur cluster complexes (Figure 1(e) and (f)). Moreover, KEGG pathway analysis highlighted specific pathways implicated in the progression of liver cirrhosis, including the citrate cycle (tricarboxylic acid [TCA] cycle), 2-oxocarboxylic acid metabolism, porphyrin metabolism, and diabetic cardiomyopathy (Figure 1(g)). Collectively, these findings emphasize the vital role of ferroptosis and mitochondrial dysfunction in the progression of cirrhosis.
Machine learning of biomarkers
To further prioritize candidate genes with diagnostic potential, we selected four machine learning models to evaluate their classification performance.
Initially, 13 hub genes were identified and 8 different machine-learning algorithms were subsequently employed to select biomarkers for predicting the incidence of liver cirrhosis. Analyses of the “Reverse Cumulative Distribution of Residual” (Figure 2(a)) and “Boxplots of Residual” (Figure 2(b)) revealed that the SVM, GBM, RF, and XGB models exhibited minimal residuals. A significant portion of samples in these models had relatively small residuals, indicating a superior model performance. Hence, the SVM, GBM, RF, and XGB models were considered the most effective in predicting the occurrence of liver cirrhosis.

Machine learning in screening candidate diagnostic biomarkers for liver cirrhosis and analysis of differences in immune microenvironment. (a) Reverse cumulative distribution of residual. (b) Boxplots of residual. (c) Feature importance created by eight models. (d) ROC for eight models. (e) Venn network of the four selected machine learning models to identify liver cirrhosis biomarkers. (f) Relative content of various immune cells between normal and liver cirrhosis groups shown in the histograms and (g) heatmap. (h) The correlation heatmap of immune cell concentrations. (i) The violin diagrams illustrated the difference in immune cell infiltration between the liver cirrhosis patient group and the normal control group. ROC: receiver operating characteristic.
Subsequently, hub genes were visualized based on their importance rankings (Figure 2(c)). According to the SVM results, the top six feature-important biomarkers in liver cirrhosis were DHODH, CS, ACADSB, FXN, MFN2, and ISCU. The GBM results identified DHODH, FXN, ISCU, CS, IDH2, and VDAC2 as the top six feature-important biomarkers in liver cirrhosis. The RF results highlighted DHODH, CS, ISCU, FXN, IDH2, and MFN2 as the top six feature-important biomarkers in liver cirrhosis. Finally, the XGB results indicated that DHODH, ISCU, FXN, CS, ACADSB, and IDH2 were the top six feature-important biomarkers in liver cirrhosis.
Ultimately, the models were evaluated using the ROC curve, with AUC values demonstrating that these four models achieved higher accuracy than the other models (Figure 2(d)). In total, eight biomarkers were identified through the above analyses (Figure 2(e)).
Immune infiltration analysis results
Given the immune-related nature of liver cirrhosis progression, we next assessed the immune cell infiltration patterns across disease and control groups.
The infiltration of immune cells in the liver cirrhosis was investigated by utilizing CIBERSORT analysis on the screening set. This analysis estimated the relative abundances of various immune cell types within the mixed-cell population. 21 major immune cell types were identified (Figure 2(f) and (G)). Further analysis revealed the correlation patterns among these immune cells in liver cirrhosis samples (Figure 2(h)). Notably, T cells regulatory (Tregs) and M2 macrophages exhibited the highest positive correlation, whereas CD8 T cells and gamma delta T cells demonstrated the most significant negative correlation (Figure 2(h)). Subsequently, to detect differentially abundant immune cell types between the liver cirrhosis and control groups, we utilized Wilson's test on the integrated dataset. Our analysis revealed 12 types of immune cells with significant differences between the two groups (Figure 2(i)). For instance, the liver cirrhosis group demonstrated markedly lower percentages of naïve B cells and M2 macrophages than the control group. Conversely, the control group presented considerably fewer resting CD4 memory T cells and gamma delta T cells in comparison to the liver cirrhosis group (Figure 2(i)).
Construction of coexpression networks
To identify immune-related genes (IRGs) using differentially abundant immune cells as clinical features, we employed WGCNA. Initially, we clustered the screening set using the Euclidean distance to detect outliers (Figure 3(a)). The figure revealed one abnormal sample that was subsequently removed. The remaining samples were reclustered (Figure 3(b)). Next, we established the soft threshold (power) required for constructing the network. By setting the power to 4, the scale-free topology fitting index (R2) achieved a value of 0.9, suggesting that the network connectivity tended toward zero (Figure 3(c) and (d)). The dynamic tree cutting algorithm was then applied to the coexpression network (Figure 3(e)), leading to the detection of 16 modules (Figure 3(f)). Based on the module–trait relationships illustrated in the figure, two modules (darkred and turquoise) with correlation coefficients greater than 0.6 were selected for further investigation (Figure 3(f) and (g)). A total of 5935 IRGs were identified from these modules and were proceeded to subsequent analyses.

Development of coexpression networks. (a) Detection of outlier sample and (b) clustering tree of samples. (c and d) Calculation of the best soft-thresholding power. (e) Identification of modules based on the coexpression network, and (f) relevance of modules and differential immune cells. (g) Module–trait relationships, the numbers in the cell represent the correlation coefficient and corresponding p-value. The correlation coefficient is between −1 and +1, the larger the absolute value, the stronger the association. (h) Petal diagram of immune-related biomarkers. (i) The interaction results among hub biomarkers, and (j) between genes and immune cells.
Identification of biomarkers associated with liver cirrhosis
To explore the immune relevance of the candidate genes, we performed WGCNA and integrated immune cell traits to identify immune-related hub biomarkers.
To identify key immune-related biomarkers, we intersected the biomarkers with a set of 5935 IRGs from the previously mentioned modules. This analysis resulted in the identification of four immune-related biomarkers (DHODH, FXN, CS, and ISCU), which are considered as hub biomarkers in our study (Figure 3(h)). Correlation analysis revealed that FXN and DHODH exhibited the strongest positive correlation, whereas ISCU and DHODH had the strongest negative correlation (Figure 3(i)). Furthermore, the analysis preliminarily confirmed that the hub biomarkers are associated with various immune cells types. Specifically, a positive correlation was observed between CS and M1 macrophages. DHODH was found to be positively correlated with resting NK cells and negatively correlated with gamma delta T cells. ISCU demonstrated a positive relationship with gamma delta T cells but was negatively linked to CD8 T cells, regulatory T cells (Tregs), and resting NK cells (Figure 3(j)). Taken together, these results indicate that changes in the expression of CS, DHODH, and ISCU could modulate immune activities related to liver cirrhosis and these genes might represent potential targets for further exploration into the connection between immune dysfunction and liver cirrhosis.
Validation of hub biomarkers
Further analysis of the four hub biomarkers in the screening set using ROC and differential expression analyses revealed distinct expression patterns in liver cirrhosis samples. Specifically, CS and ISCU showed significant upregulation, whereas DHODH and FXN exhibited notable reduction in liver cirrhosis samples (Figure 4(a)). These biomarkers also demonstrated a strong predictive performance in the screening set, with AUC values of 0.831 for CS, 0.910 for DHODH, 0.788 for FXN, and 0.876 for ISCU (Figure 4(b)). External validation utilizing the GSE89377 dataset confirmed consistent expression patterns of these hub biomarkers in cirrhotic liver tissues (Figure 4(c)). Their diagnostic performance remained robust, with AUC values of 0.929, 0.827, 0.821, and 0.910 for CS, DHODH, FXN, and ISCU, respectively (Figure 4(d)). To further consolidate our findings, the GSE25097 and GSE139602 datasets were combined and batch effects were removed to construct an additional validation datasets. The results from this set were highly consistent with those from the training set, thereby reinforcing the reliability of our findings (Figure 4(e) and (f)).
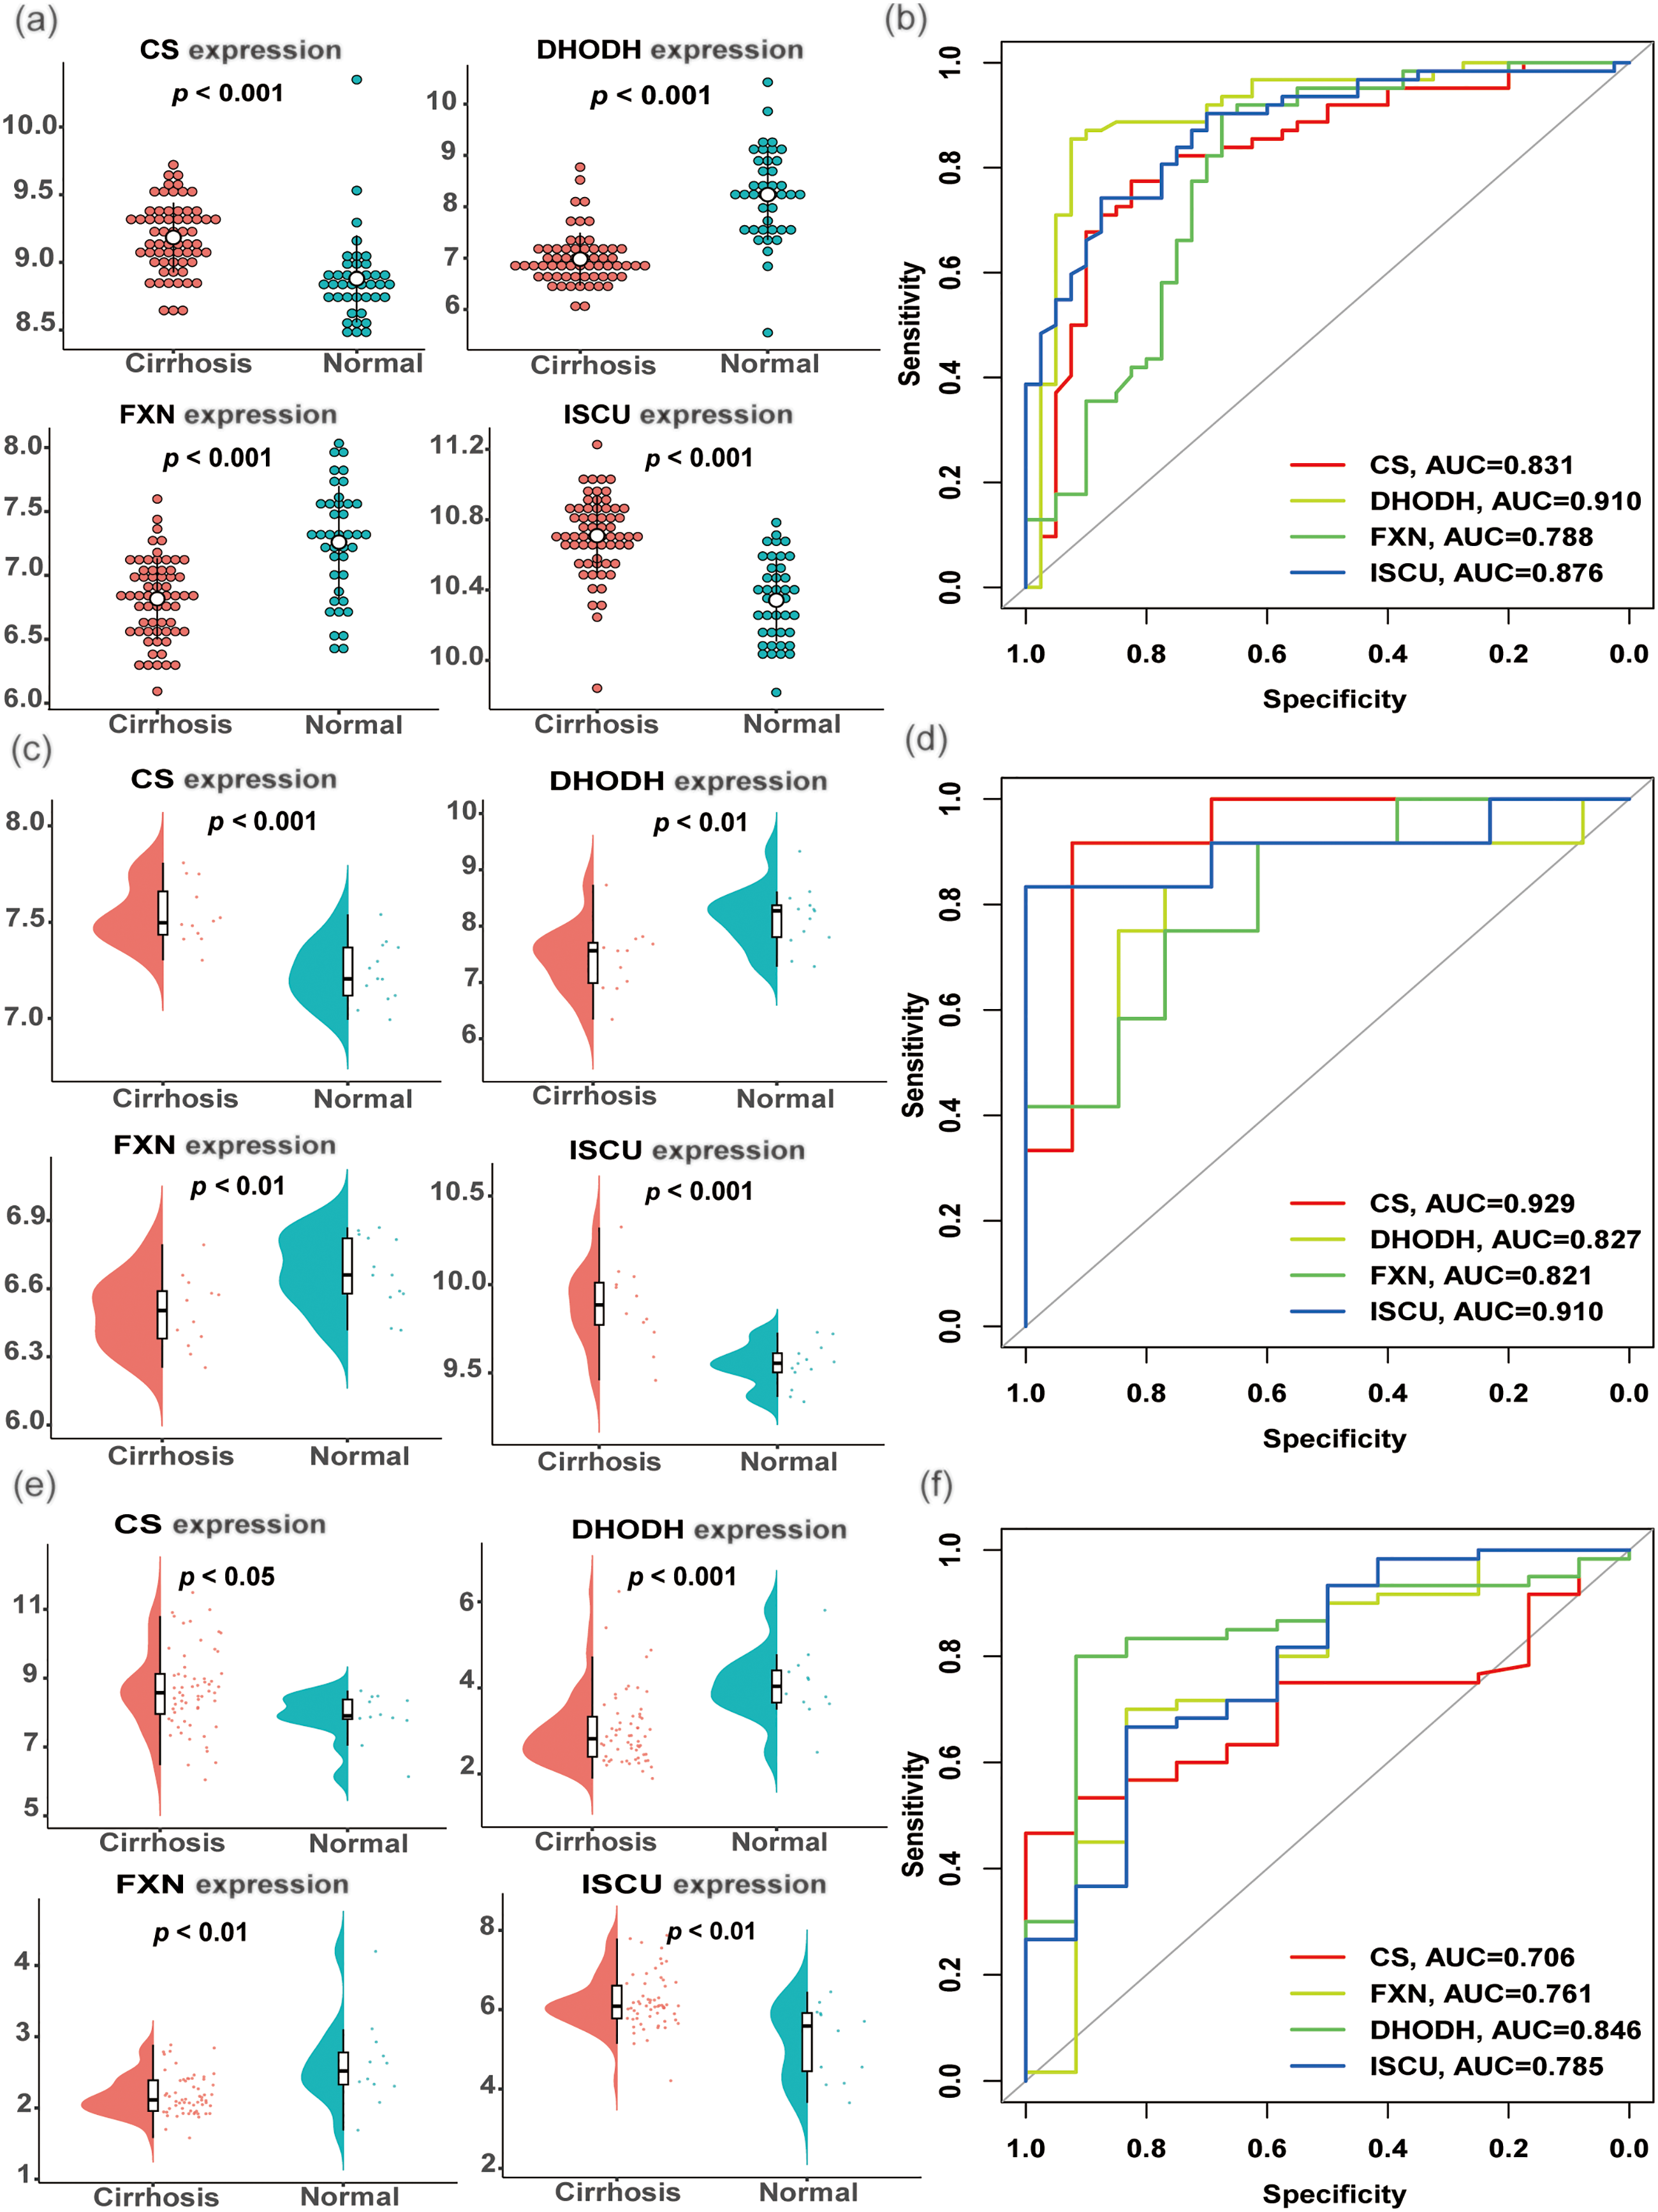
The genes have good predictive performance in the training cohort and validation cohort. (a) Differential expression analysis of the four hub biomarkers (CS, DHODH, FXN, ISCU) in the training cohort. (b) ROC analysis of the four hub biomarkers (CS, DHODH, FXN, ISCU) in the training cohort. External validation was performed on the GSE89377 dataset and the merged set (GSE25097 and GSE139602), and (c, e) the differential expression analysis of the four hub biomarkers and (d, f) ROC analysis of the hub biomarkers shown, respectively. CS: citrate synthase; ROC: receiver operating characteristic.
Development and validation of the nomogram
A nomogram was constructed using the “rms” package, centered around the four hub biomarkers, to predict liver cirrhosis incidence in patients (Figure 5(a)). Its predictive accuracy was validated through the use of calibration curves (Figure 5(b)). In the DCA plot, the lines extended from 0 to 1 and each model are consistently maintained above the gray and black lines of 0–0.8, indicating that the nomogram could provide clinically beneficial predictions for liver cirrhosis patients (Figure 5(c)). Additionally, the clinical impact curve highlighted the remarkable predictive potential of the nomogram (Figure 5(d)).

Nomogram construction and diagnostic performance validation and gene set enrichment analysis (GSEA) results. (a) The nomogram was visualized using 4 hub biomarkers to predict the risk of liver cirrhosis. (b) The accuracy of the nomogram predictions is confirmed by the results of the calibration curve. (c) The DCA curve suggests that decision-making based on the nomogram may benefit patients with liver cirrhosis because the decision curves for each model are consistently maintained above the gray and black lines of 0–0.8. Notably, the nomogram curve, which integrates information from all biomarkers, is at the highest level. (d) The significant predictive ability of the nomogram is demonstrated by the clinical impact curves. (e–h) The significant predictive ability of the nomogram is demonstrated by the clinical impact curves. The GSEA results related to the function of hub genes: (e) CS; (f) DHODH; (g) FXN; (h) ISCU. CS: citrate synthase; DCA: decision curve analysis.
Immune-related pathway enrichment of four hub biomarkers in liver cirrhosis revealed by GSEA
To further elucidate the biological roles of the hub biomarkers, we performed GSEA focusing on immune-related pathways.
Gene set enrichment analysis was utilized to delve into the functions of four hub biomarkers in the progression and pathogenesis of liver cirrhosis. The high-expression cohorts of CS and ISCU exhibited significant enrichment in antigen processing and presentation, as well as cell adhesion molecules (CAMs) (Figure 5(e) and (h)). Conversely, the low-expression cohorts of DHODH and FXN showed predominant enrichment in antigen processing and presentation, CAMs, and focal adhesion (Figure 5(h) and (g)). Additionally, the high-expression cohorts of CS were highly enriched in the intestinal immune network for IgA production and systemic lupus erythematosus (Figure 5(e)), while those of ISCU were highly enriched in the toll-like receptor signaling pathway (Figure 5(h)). In the groups with low expression of FXN, genes displayed a significant association with NK cell-mediated cytotoxicity (Figure 5(g)). In summary, a compelling chain of evidence points to the potential involvement of immune mechanisms and pathways associated with immunity in the evolution and advancement of liver cirrhosis.
Identification of core immune cells and their interactions with biomarkers in liver cirrhosis
We then sought to identify the most critical immune cell subsets contributing to cirrhosis progression and analyzed their interactions with the hub genes.
Principal component analysis demonstrated a distinct separation between the liver cirrhosis and normal groups in terms of immune cell infiltration, highlighting substantial differences in infiltration patterns (Figure 6(a)). To gain a more detailed understanding of the key immune cells that might influence the immune microenvironment in cirrhosis, we utilized LASSO regression and RF algorithms to pinpoint critical cell types linked to the disease. Through the application of LASSO regression, 11 immune cell types associated with liver cirrhosis were detected (Figure 6(b) and (c)). In the RF analysis, the top 10 immune cells were determined to be the primary factors contributing to disease advancement (Figure 6(d) and (e)). By combining findings from LASSO regression, RF methods, and aforementioned immune cell infiltration analysis, we finally pinpointed 9 core immune cells that could potentially affect the progression of liver cirrhosis (Figure 6(f)). These consist of plasma cells, CD8 T cells, resting CD4 memory T cells, follicular helper T cells, gamma delta T cells, resting NK cells, monocytes, M1 macrophages, and M2 macrophages.
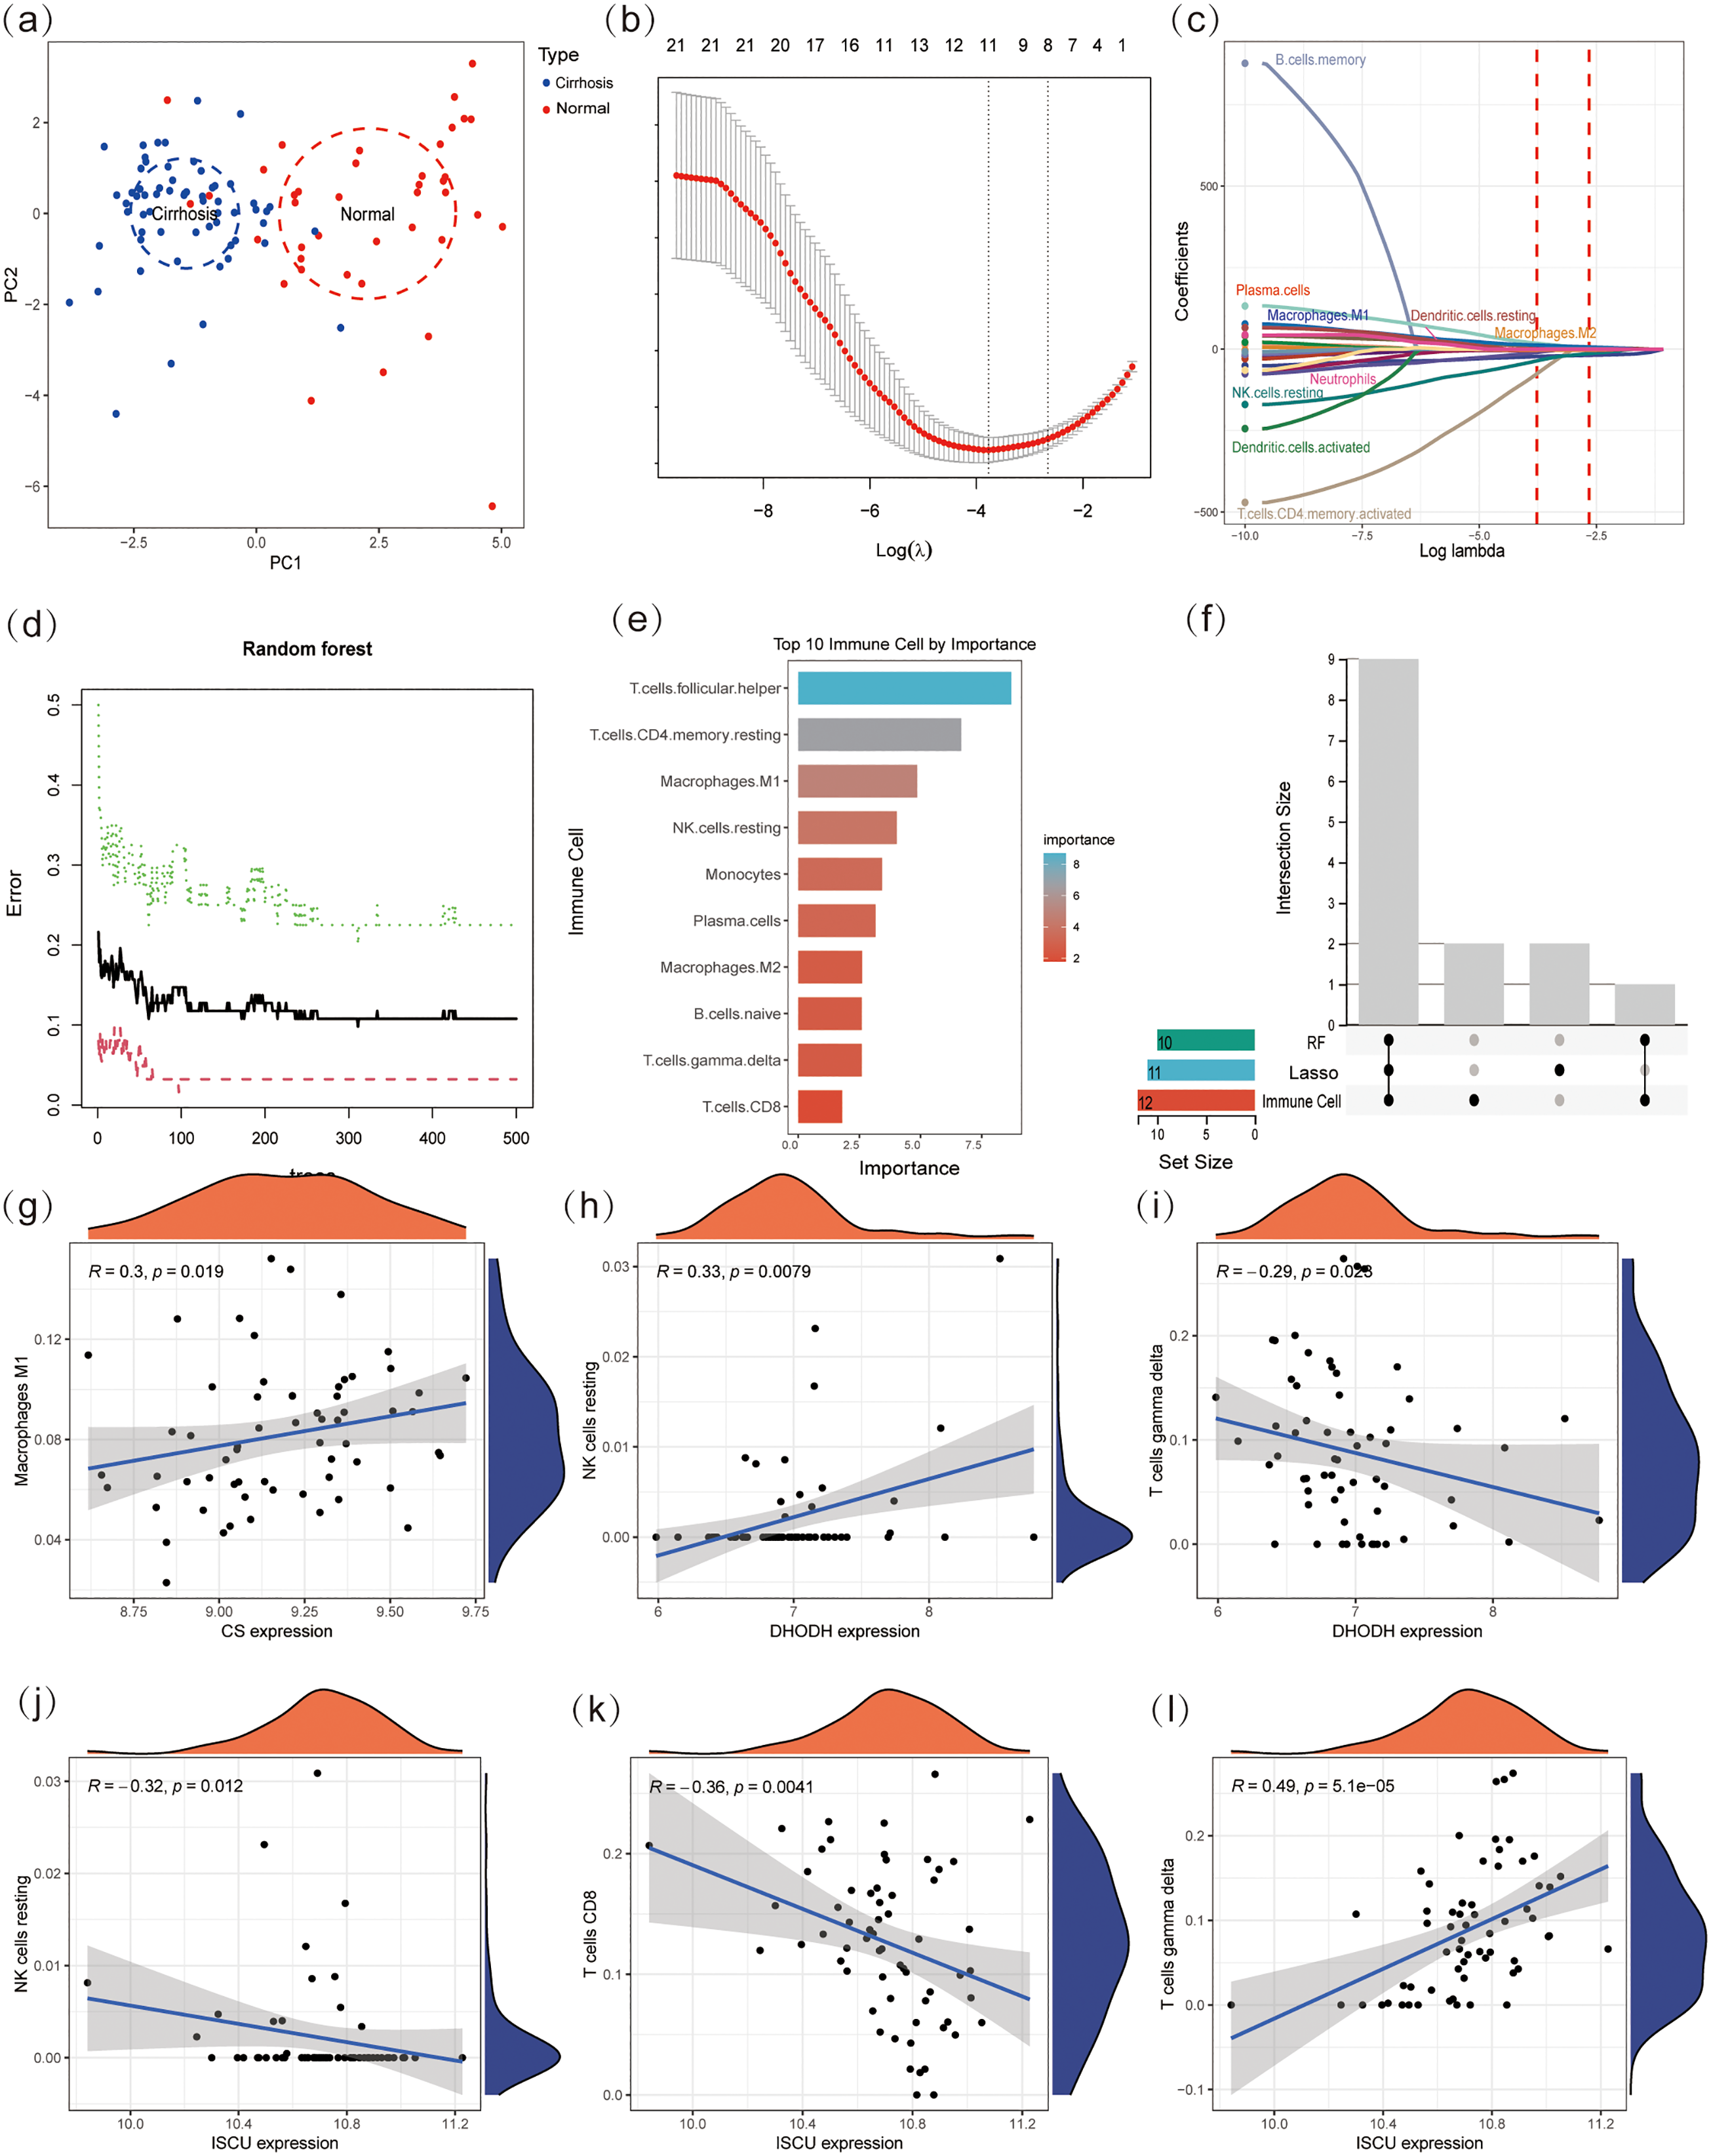
Identification of core immune cell types. (a) Principal component analysis visualization of immune cell Infiltration. (b, c) LASSO regression conducted to analyze the different infiltrates of immune cells in liver cirrhosis and normal. (d, e) Random Forest conducted to analyze the different infiltrates of immune cells in liver cirrhosis and normal. (f) UpSet plot of RF, LASSO, and immune cell infiltration. (g–l) Correlation analysis between the core immune cells and the four hub biomarkers. RF: Random Forest.
In liver cirrhosis, correlation analyses were conducted to investigate the associations between core immune cells and hub biomarkers. The results demonstrated that several hub biomarkers exhibited significant associations with specific immune cells. For instance, the biomarker CS showed a strong positive correlation with M1 macrophages. In contrast, DHODH was found to be significantly negatively correlated with resting NK cells, and a comparable negative correlation was also observed between gamma delta T cells and DHODH. Additionally, resting NK cells, CD8 T cells, and the gene ISCU were significantly negatively correlated, whereas ISCU and gamma delta T cells were significantly positively correlated (Figure 6(g) to (i)). These results collectively suggest that immune cells may interact with these hub biomarkers to influence the progression and characteristics of liver cirrhosis.
Construction of liver cirrhosis cell atlas
In order to further investigate the expression of our hub biomarkers in key immune cells, we conducted in-depth single-cell data analysis using the GSE136103 dataset. Through single-cell analysis with singleR annotation, eight distinct cell types were identified (Figure 7(a) and (b)). Our results demonstrated that ISCU was expressed across the majority of immune cells (Figure 7(c)), with particularly high expression levels observed in T cells, NK cells, and monocytes (Figure 7(d)). To identify the cell clusters that exhibited altered expression of key DE-DRGs in individuals suffering from liver cirrhosis compared to healthy controls, we conducted a differential state analysis (Figure 7(d)). Notably, our results revealed that ISCU was significantly differentially expressed in the T cell cluster, NK cell cluster, Monocyte cluster, and Macrophage cluster (Figure 7(d)).

Liver cirrhosis cell atlas (a and b) UMAP projection showing the single-cell atlas of liver cirrhosis and normal. (c) UMAP plot showing the expression in cells for ISCU. (d) The violin plot shows that the expression levels of ISCU in different cells vary between individuals with liver cirrhosis and normal. (e and f) The heatmap and network plot show the alterations in cell communication between the different cells in liver cirrhosis and normal. (g) UMAP plot showing two distinct clusters in Monocyte. (h–j) The differentiation origin of Mono-CD14 was confirmed through CytoTRACE. (k) UMAP plot showing the expression of ISCU in different cell subpopulations. (l and m) trajectories showing the progression of Mono-CD14 and Mono-1416. (n) Heatmap along the pseudo-time trajectory showing the expression changes of the ISCU gene.
In our analysis of cell communication, we observed that after the onset of liver cirrhosis, the intensity of signal interactions between monocytes and other monocytes, as well as between monocytes and macrophages, was significantly increased (Figure 7(e) and (f)). Additionally, key cell signaling pathways such as significant upregulation was observed in MK, TNF, and MIF, while MHC-I and CCL showed significant downregulation (Supplemental Material Figure S1). To further investigate these changes, we manually annotated and reclustered monocytes into two distinct clusters: Mono-CD14 and Mono-CD14CD16 (Figure 7(g)). We also employed CytoTRACE analysis, using default parameters, to predict the differentiation states of these clusters. CytoTRACE is an algorithm designed to estimate the differentiation status of cells from single-cell RNA sequencing data. 37 This estimation is based on the observation that transcriptional diversity tends to decrease during the process of cellular differentiation. CytoTRACE scores are normalized between 0 and 1, where higher scores reflect greater stemness (less differentiated states), while lower scores indicate more differentiated states. We combined CytoTRACE analysis with Monocle3 to predict the origins of this distinct monocyte clusters. 38 A boxplot was generated to compare the CytoTRACE scores among different monocyte subsets, providing insights into their differentiation states (Figure 7(h)). Our analysis using CytoTRACE identified Mono-CD14 as the origin of differentiation (Figure 7(i) and (j)), a finding that aligns with previous studies and further validates the accuracy of our manual annotation. 39 To elucidate the differentiation trajectory, we combined CytoTRACE and Monocle3 analyses to reconstruct a linear pseudotime process (Figure 7(j) to (m)). The process was initiated with Mono-CD14 and culminated with Mono-CD14CD16 as the final stage of the trajectory (Figure 7(i) to (m)). During this differentiation process, we observed changes in the ISCU gene expression (Figure 7(k) and (n)). Specifically, ISCU expression gradually decreased as Mono-CD14 differentiated into Mono-CD14CD16 (Figure 7(n)). These results indicate that the ISCU gene could have an important function in the differentiation and development of monocytes.
Validation of expression levels of hub biomarkers in cirrhosis patients through experiments
To additionally confirm the elevated expression of key biomarkers in fibrotic liver tissue, pathological verification was carried out. The H&E staining revealed the existence of inflammatory cell infiltration and fibrotic characteristics in the livers of patients within the cirrhosis group (Figure 8(a)). Additionally, Masson staining further confirmed significant fibrosis in cases of liver cirrhosis (Figure 8(b)). In liver cirrhosis, a complex network of collagen deposition can be observed within the lesion tissue. This network is predominantly composed of Type I and III collagen, which delineates the regions where fibrosis occurs. In Masson's trichrome staining, areas rich in collagen are highlighted in a vivid blue tone, providing a precise and thorough depiction of fibrotic zones in liver cirrhosis, whereas the control group lacks significant blue-stained fibrotic regions (Figure 8(b)). This method effectively delineates the fibrotic areas within the liver, showcasing collagen deposits with remarkable clarity. To determine the expression levels of the key hub biomarker ISCU, immunohistochemistry staining was performed on pathological specimens from patients with liver cirrhosis and controls (HH). Paraffin-embedded sections were prepared and stained. Images of three representative areas from each section were acquired at 10× magnification using a Motic DSAssistant microscope. Immunohistochemical analysis revealed a notable increase in the expression of ISCU in cirrhosis samples, in comparison with HH samples (Figure 8(c) and (d)).

Histological analysis and molecular docking (a and b) representing H&E staining, and masson staining of liver tissues in the HH group and the lc group. Each section was acquired at 10 magnification. (c and d) Protein levels of ISCU in HH and LC liver tissues were assessed by immunohistochemistry using a polyclonal anti-ISCU antibody (Proteintech; catalog no. 14812-1-AP; immunogen AG6562; 700 µg/mL). Each section was acquired at 10e magnification and 40× magnification. Molecular docking patterns of (e) CS complexed with 3′-Azido-3′-deoxythymidine, (f) DHODH complexed with 2fpv-leflunomide, and (g) FXN complexed with 1.24-Betamethasone. (h) Mechanism diagram of the involvement of hub biomarkers in mitochondrial metabolism and iron metabolism processes. CS: citrate synthase; H&E: hematoxylin and eosin; HH: hepatic hemangioma.
Potentially effective molecules targeting the hub biomarkers were identified through molecular docking analysis
Using the DSigDB database on Enrichr, drugs that interact with robust hub biomarkers were identified. The drugs were selected based on their p-values, potentially offering new therapeutic options for liver cirrhosis. To identify effective molecules that can target the four biomarkers (FXN, DHODH, CS, and ISCU), protein structures were retrieved from UniProt using these gene symbols as keywords. The results were screened to select structures specific to the human species and the complete AlphaFold-predicted structures of FRDA_HUMAN (UniProt ID: Q16595), PYRD_HUMAN (UniProt ID: Q02127), CS025_HUMAN (UniProt ID: Q9UFG5), and ISCU_HUMAN (UniProt ID: Q9H1K1) were chosen to serve as our protein structure files. Concurrently, we retrieved the structures of small molecules from PubChem. Among them, three potential small molecular drugs—2fpv-leflunomide, 1.24-Betamethasone, and 3′-Azido-3′-deoxythymidine—were identified with binding energies of−5.43 kcal/mol, −5.11 kcal/mol, and−4.68 kcal/mol, respectively (Figure 8(e) to (g)). Unfortunately, small molecules associated with ISCU were discarded due to their excessively high binding energies. The binding poses and sites are illustrated in the figure, with yellow dotted lines representing hydrogen bonds, numerical values indicating hydrogen bond lengths, and green and red colors used to emphasize small-molecule drugs.
Discussion
Liver cirrhosis is a complex and chronic condition characterized by extensive fibrosis and architectural distortions of the liver. Early diagnosis and accurate assessment of disease severity are crucial for effective management and improved patient outcomes. Several studies have previously identified potential biomarkers for liver cirrhosis, including serum markers such as liver enzymes, fibrosis markers, and imaging techniques. However, these methods often lack specificity and sensitivity for early diagnosis.4–6 The use of molecular markers, such as the mitochondrial ferroptosis-related genes explored in this study, offers a more precise and objective approach. Compared to traditional biomarkers, these genes may offer a more comprehensive comprehension of the disease mechanisms and enable the recognition of patients at high risk for disease progression.40,41 Using invasive liver tissue samples, we conducted biomarker discovery through RNA sequencing, a technique that offers greater efficiency and accuracy. Additionally, this approach is closely linked to disease mechanisms and facilitates the development of novel therapeutic targets.
Liver cirrhosis arises as a result of multifactorial processes, including the combined impacts of sequential inflammatory reactions, immune dysregulation and ROS accumulation. 42 Significantly, the impairment of mitochondrial function significantly contributes to oxidative stress, which is strongly associated with regulation of immune responses, activation of inflammasomes, and apoptotic mechanisms, and the development of cirrhosis.10,11 Ferroptosis, a controlled type of cell death marked by iron-dependent lipid peroxidation, has gained attention for its role in cellular injury. Emerging research has emphasized the connection among mitochondrial dysfunction, ferroptosis, and ROS buildup, highlighting their crucial roles in the progression of liver cirrhosis. 43 Consequently, elucidating the intricate relationship among mitochondria, ferroptosis, and liver cirrhosis provides novel insights into the underlying mechanisms of this disease.43,44 The mRNA microarray datasets (GSE36411 and GSE14323) were analyzed to identify a total of 2474 DEGs, including 1042 downregulated and 1432 upregulated genes. By intersecting mitochondria-associated genes and ferroptosis-related genes, a final set of 13 hub genes was obtained. Through functional enrichment analysis, it was revealed that these co-DEGs are mainly involved in necroptosis, NOD-like receptor signaling pathways, and porphyrin metabolism, all of which are essential processes in the progression of liver cirrhosis.45–47 To further identify module genes that are highly associated with immunity in liver cirrhosis, we conducted an analysis of the merged dataset using WGCNA. Additionally, we employed four distinct algorithms to further screen for potential biomarkers. The overlapping genes were subsequently identified by intersecting the module genes with the genes obtained from the four algorithms. Finally, DHODH, FXN, CS, and ISCU were identified as potential hub biomarkers.
Our results demonstrated that the expression levels of CS and ISCU were substantially elevated in liver cirrhosis samples, while the expression levels of DHODH and FXN were reduced. These four genes encode the following proteins. DHODH is an enzyme involved in pyrimidine synthesis and is localized to the outer mitochondrial membrane. It has been shown to be a key regulator of ROS production and ferroptosis.48,49 FXN is crucial for the biogenesis of iron–sulfur clusters and contributes to the maintenance of mitochondrial iron balance. 50 Citrate synthase (CS) is a key enzyme in the TCA cycle. ISCU is involved in iron-sulfur cluster biogenesis (Figure 8(h)). 51 The altered expression patterns of these genes in liver cirrhosis suggest that they may contribute to the disease pathogenesis by modulating mitochondrial function and ferroptosis-related pathways. The upregulation of CS and ISCU in cirrhosis reflects compensatory mechanisms that counteract mitochondrial impairment and oxidative damage. Citrate synthase is a key enzyme in the TCA cycle, and its increased expression may indicate enhanced mitochondrial activity to meet the energy demands of stressed hepatocytes. 52 Similarly, ISCU upregulation suggests an attempt to maintain iron-sulfur cluster assembly and mitochondrial function despite ongoing damage.52,53 On the other hand, the downregulation of DHODH and FXN in cirrhosis highlights impaired mitochondrial respiration and iron homeostasis.49,52 DHODH is essential for pyrimidine biosynthesis and mitochondrial function, and its reduced expression may exacerbate mitochondrial dysfunction and ferroptosis. FXN plays a critical role in iron-sulfur cluster biogenesis, and its downregulation likely contributes to iron overload and oxidative stress, further promoting ferroptosis. 52 Previous studies have shown that FXN regulates the function of ISCU by affecting its conformation. 54 In our current study, we observed distinct expression levels of the ISCU and FXN genes in patients with liver cirrhosis. Whether the altered FXN expression affects ISCU requires further investigation. Together, these genes provide a comprehensive view of mitochondrial dysfunction, iron metabolism, and oxidative stress, which are central to the pathogenesis of liver cirrhosis.
To investigate the influence of immune cell infiltration on liver cirrhosis, we applied the CIBERSORT algorithm to examine the proportions of 22 immune cell types. Our study results highlighted the differences in 12 types of immune cells between liver cirrhosis samples and normal samples. This highlights the intricate diversity of cell types implicated in the immune response in cirrhosis. Furthermore, through the application of LASSO analysis and RF trees on immune cells, a set of core immune cells that might participate in the advancement of liver cirrhosis was discovered. Specifically, T cells gamma delta, CD8 T cells, resting NK cells, and M2 macrophages exhibit correlations with the central biomarkers identified in our study. These results align with the findings reported in earlier studies.55–58 For example, a crucial role in promoting liver inflammation and the progression of cirrhosis is played by hepatic macrophages, which include Kupffer cells. Upon liver injury, these macrophages transition from the M0 state to the M1 pro-inflammatory. Our results indicate that the expression of these hub biomarkers serves not only a diagnostic function but also play a role in modulating the immune response. Furthermore, through GSEA, we identified that these four hub biomarkers were significantly enriched in immune-related pathways, which further suggests that they may exert a certain influence on the immune environment in liver cirrhosis. Subsequently, the expression profiles and biological functions of hub biomarkers in the liver were examined at the single-cell resolution. Using single-cell RNA sequencing data, we systematically annotated and identified eight distinct cell subtypes. The results demonstrated that ISCU was predominantly expressed across various immune cell populations within the liver. Furthermore, ISCU exhibited significant differential expression in T cell cluster, NK cell cluster, monocyte cluster, and macrophage cluster. Through cell communication analysis, we also observed that the signaling intensity of Monocytes was increased. Subsequently, further refinement of Monocyte revealed that ISCU was predominantly expressed in Mono-CD14 resident in the livers of patients with liver cirrhosis. Classical monocytes (cMo) are characterized by the expression of CD14 alone (Mono-CD14), while intermediate monocytes (iMo) coexpress CD14 and CD16 (Mono-CD14CD16). 34 Pseudotime trajectory analysis indicates that the ISCU gene might be crucial for the differentiation and development of monocytes. Earlier research has demonstrated that in individuals with liver cirrhosis, there are notable alterations in the distribution of monocyte subsets within peripheral blood. In patients with acute decompensated liver cirrhosis (AD), the proportion of cMo relative to peripheral blood leukocytes is elevated, whereas the absolute number of nonclassical monocytes (ncMo, CD14−/lowCD16+) is decreased. In addition, the more severe the liver cirrhosis, the more pronounced the changes in monocyte subset distribution. For instance, individuals with advanced liver cirrhosis (e.g. those classified under Child–Pugh class C or with a MELD score of ≥20) show an increased percentage of cMo. In contrast, the percentages of iMo and ncMo are reduced. Consequently, we propose that ISCU might play a role in the progression of liver cirrhosis through its effect on monocyte activity. Additional research is necessary to comprehensively understand the influence of ISCUs on the differentiation of monocytes. 59
In this research, we investigated the possible diagnostic significance of four mitochondrial ferroptosis-related genes: DHODH, FXN, CS, and ISCU. Together, these genes could potentially act as valuable biomarkers for detecting liver cirrhosis. Furthermore, through molecular docking analysis of the biomarker proteins, we discovered three candidate drugs that might be effective in treating liver cirrhosis, offering important insights for future clinical approaches. Despite the promising potential of DHODH, FXN, CS, and ISCU for diagnosing liver cirrhosis, several limitations must be addressed. The complexity of ferroptosis regulation complicates the identification of specific diagnostic biomarkers. Additionally, the lack of standardized assays for detecting ferroptosis-related changes in clinical settings limits their immediate application. The heterogeneity of liver cirrhosis, with diverse etiologies and stages, may affect the expression and utility of these genes, necessitating further validation in larger, diverse cohorts. The study focused primarily on gene expression levels, and future research should explore the underlying mechanisms in more detail, such as the specific pathways involved and the interactions between these genes. Longitudinal studies are required to validate the diagnostic and prognostic value of these genes. Exploring therapeutic strategies targeting these genes to modulate ferroptosis and the immune microenvironment could offer new treatment avenues. Integrating multiomics approaches to uncover additional molecular pathways involved in cirrhosis pathogenesis will provide a more comprehensive understanding of this disease.
While our findings strongly implicate DHODH, CS, FXN, and ISCU in liver cirrhosis and link them to ferroptosis and mitochondrial function, it is important to acknowledge that the current evidence is based primarily on transcriptomic associations and literature-based annotations from FerrDB. Direct causality between these genes and ferroptotic cell death in hepatocytes has not been experimentally validated in this study.
Among the four biomarkers, DHODH has the most direct link to ferroptosis, as recent studies have shown that mitochondrial DHODH acts in parallel with GPX4 to suppress lipid peroxidation in mitochondria, thus functioning as a ferroptosis suppressor in various tissues. 60 Citrate synthase, although not classically associated with ferroptosis, may modulate ROS production through TCA cycle flux, indirectly contributing to ferroptotic sensitivity. 61 FXN and ISCU, involved in iron–sulfur cluster assembly, regulate mitochondrial iron homeostasis. 62 Their dysregulation leads to labile iron accumulation, which is a known trigger for ferroptosis, suggesting a pro-ferroptotic upstream role via iron overload. 62 However, these mechanistic links remain inferential, and experimental studies—such as gene knockdown/overexpression, lipid ROS assays, and ferroptosis-specific inhibitors (e.g. ferrostatin-1) in liver models—are necessary to establish causality. Future work should focus on functional validation using in vitro and in vivo ferroptosis models to elucidate whether these genes act as drivers, regulators, or markers of ferroptosis in hepatic fibrosis.
In this study, we identified DHODH, CS, FXN, and ISCU as reliable blood biomarkers in predicting liver cirrhosis. Moreover, the diagnostic model we developed using these four biomarkers may assist in identifying patients with cirrhosis. Beyond their diagnostic value, the identified biomarkers also hold promise for clinical application in prognosis assessment and targeted therapy. For instance, DHODH (dihydroorotate dehydrogenase), involved in mitochondrial pyrimidine biosynthesis, is a known target of the FDA-approved drug leflunomide, which inhibits DHODH activity and suppresses immune activation. 63 The elevated expression of DHODH in cirrhotic tissues suggests its potential as a dual-role therapeutic target—both metabolic and immunomodulatory. Citrate synthase, a key enzyme in the TCA cycle, has been implicated in the metabolic reprogramming of hepatocytes under chronic injury. 64 Its overexpression—primarily documented in HCC and MASLD models—may serve as a potential metabolic intervention node in chronic liver injury. 64 Tricarboxylic acid-cycle inhibitors such as CPI-613 (devimistat) have demonstrated antitumor efficacy by curbing mitochondrial ROS and bioenergetics, 65 but their utility in hepatic fibrosis requires further investigation in future studies. ISCU and FXN, as key regulators of iron-sulfur cluster assembly, offer unique insights into the redox state of hepatocytes. 62 Their dysregulation could potentially be monitored through noninvasive biomarkers (e.g. enzyme activity or plasma metabolite signatures), and modulating their expression may stabilize mitochondrial function and delay fibrogenesis. Gene therapy has already demonstrated promise and holds translational potential for liver disease contexts. 66 Collectively, these insights provide a strong rationale for the integration of biomarker screening with precision medicine strategies, including drug repositioning, immunometabolic modulation, and pathway-specific inhibitors. Future studies should explore their predictive value for treatment response and their potential to guide personalized therapeutic decisions in cirrhosis management.
A limitation of this study is that the bulk transcriptomic data and the single-cell RNA-seq data were derived from separate cohorts, which may introduce intercohort variability due to differences in demographics, disease etiology, or sampling conditions. Nevertheless, consistent expression patterns of key biomarkers (e.g. ISCU, CS) observed in different datasets provide cross-platform support for their disease relevance. Furthermore, the use of multiple datasets and validation across platforms enhances the generalizability of our findings. Future studies using matched bulk and single-cell samples from the same patients will help confirm the cell-type specificity and mechanistic roles of these biomarkers in ferroptosis and cirrhosis.
Conclusions
The mitochondrial ferroptosis-related genes DHODH, FXN, CS, and ISCU show potential as diagnostic markers for liver cirrhosis. These genes provide insights into mitochondrial dysfunction, ferroptosis, and the association of liver cirrhosis and immune microenvironment. Immune cell infiltration and single-cell analysis demonstrated an essential correlation between monocytes and the progression of liver cirrhosis. These findings contribute to an innovative and valuable future prospect for the pathogenesis of liver cirrhosis, thereby supplying new perspectives on the future clinical biological diagnosis and treatment of liver cirrhosis.
Supplemental Material
sj-doc-1-sci-10.1177_00368504251380638 - Supplemental material for Identification and validation of mitochondrial ferroptosis and immune microenvironment-related hub biomarkers in liver cirrhosis by integrated bioinformatics analysis
Supplemental material, sj-doc-1-sci-10.1177_00368504251380638 for Identification and validation of mitochondrial ferroptosis and immune microenvironment-related hub biomarkers in liver cirrhosis by integrated bioinformatics analysis by PengChao Deng, Ram Prasad Chaulagain, Babalola Deborah Oluwaseun, FeiYang Gao, JiaXin Wang, RanYan Gao, XinYu Jiang, FengChun Li, LingYi Xu, HaoXuan Xu and KaiXin Yao, Shizhu Jin in Science Progress
Supplemental Material
sj-doc-2-sci-10.1177_00368504251380638 - Supplemental material for Identification and validation of mitochondrial ferroptosis and immune microenvironment-related hub biomarkers in liver cirrhosis by integrated bioinformatics analysis
Supplemental material, sj-doc-2-sci-10.1177_00368504251380638 for Identification and validation of mitochondrial ferroptosis and immune microenvironment-related hub biomarkers in liver cirrhosis by integrated bioinformatics analysis by PengChao Deng, Ram Prasad Chaulagain, Babalola Deborah Oluwaseun, FeiYang Gao, JiaXin Wang, RanYan Gao, XinYu Jiang, FengChun Li, LingYi Xu, HaoXuan Xu and KaiXin Yao, Shizhu Jin in Science Progress
Supplemental Material
sj-doc-3-sci-10.1177_00368504251380638 - Supplemental material for Identification and validation of mitochondrial ferroptosis and immune microenvironment-related hub biomarkers in liver cirrhosis by integrated bioinformatics analysis
Supplemental material, sj-doc-3-sci-10.1177_00368504251380638 for Identification and validation of mitochondrial ferroptosis and immune microenvironment-related hub biomarkers in liver cirrhosis by integrated bioinformatics analysis by PengChao Deng, Ram Prasad Chaulagain, Babalola Deborah Oluwaseun, FeiYang Gao, JiaXin Wang, RanYan Gao, XinYu Jiang, FengChun Li, LingYi Xu, HaoXuan Xu and KaiXin Yao, Shizhu Jin in Science Progress
Supplemental Material
sj-docx-4-sci-10.1177_00368504251380638 - Supplemental material for Identification and validation of mitochondrial ferroptosis and immune microenvironment-related hub biomarkers in liver cirrhosis by integrated bioinformatics analysis
Supplemental material, sj-docx-4-sci-10.1177_00368504251380638 for Identification and validation of mitochondrial ferroptosis and immune microenvironment-related hub biomarkers in liver cirrhosis by integrated bioinformatics analysis by PengChao Deng, Ram Prasad Chaulagain, Babalola Deborah Oluwaseun, FeiYang Gao, JiaXin Wang, RanYan Gao, XinYu Jiang, FengChun Li, LingYi Xu, HaoXuan Xu and KaiXin Yao, Shizhu Jin in Science Progress
Supplemental Material
sj-doc-5-sci-10.1177_00368504251380638 - Supplemental material for Identification and validation of mitochondrial ferroptosis and immune microenvironment-related hub biomarkers in liver cirrhosis by integrated bioinformatics analysis
Supplemental material, sj-doc-5-sci-10.1177_00368504251380638 for Identification and validation of mitochondrial ferroptosis and immune microenvironment-related hub biomarkers in liver cirrhosis by integrated bioinformatics analysis by PengChao Deng, Ram Prasad Chaulagain, Babalola Deborah Oluwaseun, FeiYang Gao, JiaXin Wang, RanYan Gao, XinYu Jiang, FengChun Li, LingYi Xu, HaoXuan Xu and KaiXin Yao, Shizhu Jin in Science Progress
Supplemental Material
sj-doc-6-sci-10.1177_00368504251380638 - Supplemental material for Identification and validation of mitochondrial ferroptosis and immune microenvironment-related hub biomarkers in liver cirrhosis by integrated bioinformatics analysis
Supplemental material, sj-doc-6-sci-10.1177_00368504251380638 for Identification and validation of mitochondrial ferroptosis and immune microenvironment-related hub biomarkers in liver cirrhosis by integrated bioinformatics analysis by PengChao Deng, Ram Prasad Chaulagain, Babalola Deborah Oluwaseun, FeiYang Gao, JiaXin Wang, RanYan Gao, XinYu Jiang, FengChun Li, LingYi Xu, HaoXuan Xu and KaiXin Yao, Shizhu Jin in Science Progress
Footnotes
Acknowledgements
First, the authors would like to express our sincere gratitude to the Gene Expression Omnibus (GEO) database for providing access to the valuable datasets utilized in this study. Second, the authors are also deeply grateful to the patients who consented to participate in this study. Finally, the authors would also like to thank the permission of Figdraw and Figure 8(h) should be accompanied by the following citation: “Created With Figdraw (![]() ).”
).”
ORCID iDs
Ethics approval and consent to participate
The experimental protocol was established in accordance with the ethical guidelines of the Declaration of Helsinki (1975, as revised in 2024), and was approved by the Ethics Committee of the Second Affiliated Hospital of Harbin Medical University, 246 Xuefu Road, Nangang District, Harbin 150086, China (Approval No.: YJSKY2024-208; Approval Date: 29 May 2024). Written informed consent was obtained from individual or guardian participants.
Author contributions
PengChao Deng contributed to writing–original draft, methodology, and conceptualization. Ram Prasad Chaulagain contributed to writing–review & editing. Babalola Deborah Oluwaseun contributed to writing–review & editing. FeiYang Gao contributed to software and resources. JiaXin Wang contributed to software and resources. RanYan Gao contributed to writing–original draft and data curation. XinYu Jiang contributed to writing–original draft and data curation. FengChun Li contributed to visualization and formal analysis. LingYi Xu contributed to visualization and formal analysis. HaoXuan Xu contributed to validation. KaiXin Yao contributed to validation. Shizhu Jin contributed to writing–review & editing, supervision, and project administration.
Funding
The authors disclosed receipt of the following financial support for the research, authorship, and/or publication of this article: This study was supported by the Natural Science Foundation of Heilongjiang Province (LH2023H036).
Declaration of conflicting interests
The authors declared no potential conflicts of interest with respect to the research, authorship, and/or publication of this article.
Availability of data and materials
The datasets generated and/or analyzed during the current study are available from the corresponding author upon reasonable request.
Supplemental material
Supplemental material for this article is available online.
References
Supplementary Material
Please find the following supplemental material available below.
For Open Access articles published under a Creative Commons License, all supplemental material carries the same license as the article it is associated with.
For non-Open Access articles published, all supplemental material carries a non-exclusive license, and permission requests for re-use of supplemental material or any part of supplemental material shall be sent directly to the copyright owner as specified in the copyright notice associated with the article.