
Abstract
Crushing rate and impurity rate are important quality indicators of mechanically harvested soybeans. Intelligent quality detection of mechanically harvested soybeans based on machine vision is of great significance to evaluate soybean quality accurately and rapidly. This study proposes an improved U-Net method for identifying intact soybean grains, crushing soybean grains, and impurities. Based on the accurate identification of soybean components and using the quantitative model of soybean crushing rate and impurity rate, the quality of soybean samples can be detected in real-time. To this end, a soybean quality inspection system is designed to realize the dynamic collection and detection of soybean samples. The test results show that the comprehensive evaluation index values of the improved U-Net segmentation algorithm in identifying intact soybean grains, crushing soybean grains, and impurities are 93.04%, 89.40%, and 96.49%, respectively. Compared with the traditional U-Net model, the performance of the indicators is improved by 3.23%, 0.17% and 0.72%, respectively. Compared with manual detection, the maximum absolute error of the crushing rate detection of the soybean quality detection system is 0.57%, and the maximum absolute error of the impurity rate detection is 0.69%. The proposed soybean quality inspection system can be used as an effective tool for real-time online inspection of soybean quality.
Introduction
In 2019, China’s soybean planted area was 9.34 million hectares, showing an increase of 920,000 hectares over the previous year. 1 In addition, in 2019, the comprehensive mechanization rate of soybeans in China was 72.30%, and the mechanization rates of farming, planting, and harvesting were 74.10%, 73.1%, and 68.50%, respectively. These rates have been far behind those of the grain crops, such as rice, wheat, and corn. 2 This is because, in the mechanization of soybeans, mechanized harvesting denotes a weak link due to the high crushing rate. In actual production, the crushing rates for mechanized harvesting of wheat and rice are 1.0% and 1.5%, respectively.3,4 However, the mechanical harvesting crushing rate of soybeans reaches more than 10%. 5 The identification and testing of mechanically harvested soybean quality generally rely on manual separation testing, which is cumbersome and has low efficiency. 6 Therefore, how to realize rapid online quality detection of mechanically harvested soybeans has been an urgent technical problem in the field of soybean mechanized harvest
With the development of machine vision and artificial intelligence technology, many studies have used image processing technology to evaluate grain quality. Some of the recent works include the segmentation method of stacked and glued grain images,7,8 the feature information extraction of grain images,9,10 and the grain component recognition model.11,12
At present, there are few studies on the detection of soybean crushing rate and impurity rate, and the relevant technology has still been immature. 13 However, the research on the crushing rate and impurity rate of wheat and rice based on image processing technology can provide technical reference for the research of this paper. Evgenii et al. 14 proposed a method for automated evaluation of phenotypic parameters of grains, which can be used on mobile devices running the Android operational system. Their experimental results showed that this method was efficient and accurate in the large-scale analysis of phenotypic characteristics of wheat grains. Sindhu et al. 15 developed a method for classifying four rice varieties and detecting the purity percentage of rice grains using image processing techniques based on several grain features, such as grain color and shape. Zhang et al. 16 proposed a method for imperfect wheat grains recognition, which combined an attention mechanism and residual network, and verified its recognition accuracy for different depths of the residual network; the average recognition accuracy reached 97.5%. Singh et al. 17 studied the classification of four different varieties of rice grain using four sets of grain features, namely, morphology, color, texture, and wavelet. The results indicated that the morphological feature was more suitable for the classification of rice kernels than the other three features. Archana 18 introduced a low-cost quality assessment method of Sorghum grains for a digital image processing system, which can measure the sorghum grain shape and categorize Sorghum grains according to their quality based on their shape. Pakpoom et al. 19 applied image augmentation, including rotation, brightness adjustment, and horizontal flipping, to generate a larger number of grain images from fewer data and realized image-based grain purity detection. The results indicated that image augmentation improved the performances of the convolutional neural network and bag-of-words model. Chen et al. 3 proposed an online identification method for rice crushing grains and impurities for a combined harvester and developed an image acquisition device to identify and classify the rice according to the color and area characteristics of intact grains, crushing grains, and impurities in the rice. The test results showed that the comprehensive evaluation indexes of the broken kernels, rice stalk impurities, and rice stalk impurities reached 92.92%, 90.65%, and 90.52%, respectively, while the average processing period of a single picture was about 1.86 s. Ju et al. 20 used a hyperspectral imager to scan healthy and scab-infected wheat grains to obtain hyperspectral images and employed different models to identify grains. Their test results showed that the combination of the first-derivative spectrometry, principal component analysis, and backpropagation neural network achieved the highest overall accuracy of 91.67%. Si et al. 21 carry out the high-throughput soybean seeds phenotyping research with convolutional neural networks and transfer learning. Their experimental results show that the proposed method realized the effective segmentation of individual soybean seeds and the efficient calculation of the morphological parameters of each seed and it is practical to use this approach for high-throughput objects instance segmentation and high-throughput seeds phenotyping. Therefore, further research on the online detection of mechanical soybean harvesting in a complex operating environment is necessary.
Image semantic segmentation has been a hot research spot in the field of computer vision. A fully convolutional network (FCN) proposed by Long et al. 22 in 2015 represents a classic semantic segmentation network. Based on the FCN, Ronneberger et al. 23 proposed a U-Net semantic segmentation network. The U-Net network model mainly includes two parts: encoder and decoder. The encoder is the main feature extraction part, which realizes feature information extraction. The decoder restores the feature map size to the original size and realizes the fusion of the feature map extracted by the encoder and the feature layer corresponding to the decoder. Owing to the strong operability, this network model has been widely used in the segmentation of medical images,24,25 road images, 26 bridge crack images,27,28 and remote sensing images, 29 achieving good segmentation results. Therefore, a soybean quality detection model based on the improved U-Net is proposed in this study to achieve rapid online detection of soybean quality.
The online detection system for soybean quality process dynamically an image of a soybean sample using a crushing and impurity detection device and employs an improved U-Net algorithm to realize effective segmentation and identification of each component of the sample. Using the crushing rate and impurity rate quantification model, the crushing rate and impurity rate of a sample were calculated to achieve an online quality inspection of mechanized harvested soybeans.
Materials and methods
Online soybean quality inspection system structure
The online soybean quality inspection system designed in this study mainly included a computer, a crushing and impurity detection device, a storage warehouse for samples to be tested, a collection warehouse for tested samples, and a data bus, as shown in Figure 1. Among them, the computer was used to execute the online soybean quality detection program, control the crushing and impurity detection device to execute the soybean sample collection process, run the sample component identification algorithm, calculate the crushing and impurity rates of a sample, and display and save the result. The brand of the computer used in the experiment was Lenovo, and it was equipped with an Intel(R) Core(TM) i7-6700 processor, a 16-GB memory, and NVIDIA GeForce GTX 1050 Ti graphics card. The crushing and impurity detection device was a grain sample image acquisition device developed by the research group. 30 It realized the dynamic sampling of soybean samples by controlling the expansion and contraction of the sampling plate using a DC steering gear. Real-time images of soybean samples were taken by a built-in camera, which camera was an industrial color camera produced by Medvision Technology Co., Ltd, model 1080P(V5610)_PCBA, having a camera lens with a focal length of 8 mm. The resolution of the images was 1280 × 1024 pixels, and the image format was jpg.

(a) Composition diagram of the online soybean quality inspection system; (b) The structure diagram of the crushing and impurity detection device. The meaning of numbers is as follows: 1 denotes a computer; 2 denotes a sample storage warehouse to be tested; 3 indicates soybeans; 4 represents the sample receiving funnel; 5 denotes an online detection device for crushing and impurity content; 6 denotes a collection warehouse for tested samples; 7 indicates support; 8 represents a data bus; 9 denotes supporting seat; 10 denotes electromotor; 11 denotes deflector rod; 12 denotes industrial camera; 13 denotes optical axis guide; 14 denotes sliding block; 15 denotes dam-board; 16 denotes transparent plexiglass; 17 denotes grain sampling tank; 18 denotes LED illuminant; 19 denotes servo driver board.
Online soybean quality inspection system workflow
The workflow of the online soybean quality inspection system is shown in Figure 2. The operating steps of the systems were as follows:
After the system was powered on, the self-check was performed to complete the initial setting of the system parameters. Then, the working conditions of the 232 bus and industrial camera were checked. If there were certain abnormalities, the prompt information would be output; otherwise, the online soybean quality inspection program would be executed, and the trained U-Net model would be loaded. The computer used the DC servo control command to control the DC servo to drive the retractable plate to retract. Soybean samples were taken from the soybean sample bin. The system delay was 100 ms. The computer also used the DC servo control command to control the DC servo to drive the telescopic plate to extend. Then, soybean samples were loaded into the soybean sample bin. The system delay was 100 ms. Next, the computer sent the industrial camera control instructions, took pictures of a soybean sample, and sent the taken pictures to the U-Net image processing block. The U-Net image processing block divided and recognized the sample’s components and determined the number of pixels of each component. The main program, called the crushing and impurity rate calculation model, calculated the crushing and impurity rate data of the sample image, output the detection result, and wrote it into the data record file. Finally, it was checked whether the system had received a message to stop the detection. If the stop signal had not been received, steps ③ and ④ would be repeated in sequence to perform a new detection task; otherwise, the task would end, and the program would terminate.

System workflow.
Improved U-Net-based soybean sample component recognition algorithm
Dataset construction
Images of soybean samples were collected during the harvesting process of the soy-bean test field in Changgou Town, Jining City, Shandong Province on October 15, 2020. The variety of soybean planted in the test field was Qihuang 34; the moisture content at harvest was 12.6%, and the 100-seed weight was 27.47 g. A total of 120 images were collected. The images contained intact grains (soybean kernels without mechanical damage), crushing grains (cracked and flattened kernels caused by mechanical harvesting), and impurities (e.g. pods and stalks), as shown in Figure 3.

A sample image and recognition objects, where 1 denotes impurity, 2 denotes the intact grain, and 3 denotes the crushing grain.
The open-source labeling software LabelMe (version number 3.16.7) was used to mark the intact grains, crushing grains, and impurities boundaries in a sample image manually. The four categories, including the background, were colored using different colors as follows: green represented intact grain, red represented crushing grain, black denoted the background, and yellow stood for impurities, as shown in Figure 4.

Manually labeled map of a sample image.
From the image data, 110 images were randomly selected as the training set, while 10 images were selected as the test set. Image augmentation, including rotation, brightness adjustment, and horizontal flip, was applied to the training set, and a total of 440 images were obtained. The images in the training set were randomly divided into a training set and a validation set according to the ratio of 10:1; thus, 400 images constituted the training set, and the remaining 40 constituted the validation set.
Improved U-Net algorithm
The U-Net represents a classic fully convolutional network with a U-shaped structure composed of an encoder and a decoder. The main function of the encoder is to extract data features, while the decoder restores the feature image to the original image size. In this study, a skip connection was added between the encoder and the decoder so that the decoder could receive low-level features from the encoder. There were no clear boundaries between the intact grains, crushing grains, and impurities in the soybean sample images. Image semantic information was complex, so more detailed features of each category needed to be extracted. Therefore, the VGG16 network was used as a backbone feature extraction module. 31 This not only increased the network depth but also facilitated the usage of pretrained weights, which was beneficial to decrease the network training time. The upsampling of the nearest neighbor interpolation was used instead of the transposed convolution in the decoder to avoid the checkerboard effect. 32 The improved U-Net network structure is shown in Figure 5.

Structure of the improved U-Net network.
Network training
The training set loss function was based on the multi-class cross-entropy loss, and it was defined as follows:

The verification set used the Dice loss as a loss function. The Dice coefficient represents a set similarity measurement function, which has been generally used to calculate the similarity of two samples, and its value range is [0, 1]. The larger the Dice coefficient value is, the higher the degree of coincidence between the predicted result and the real value is. The Dice coefficient is calculated by

Finally, the loss function of the verification set was defined as follows:

Performance evaluation of the improved U-Net algorithm
Improved U-Net algorithm prediction effect evaluation
The accuracy rate P, recall rate R, and comprehensive evaluation index F1 were used as evaluation indexes of the improved U-Net algorithm, and their values in percentage were respectively calculated as follows:


In this research, we focus on the F1 because it is the harmonic mean of P and R. The highest F1 means the model has an optimal balance of P and R. While R expresses the model’s ability to find all intact grain, crushing grain, and impurity pixels in the input data. P expresses the portion of pixels that a model correctly classifies as intact grain, crushing grain, and impurity. Therefore, the comprehensive evaluation index F1 is used to evaluate the recognition effect of the proposed model.
Performance evaluation tests of soybean quality inspection system
The test site was the East District of Nanjing Institute of Agricultural Mechanization, Ministry of Agriculture and Rural Affairs, and the test was conducted on December 3, 2021. As shown in Figure 6, the test soybean samples were obtained by the field harvesting process of the 4LZ-6 soybean combine harvester, 4LZ-2.5 soybean combine harvester, and 4LZ-2.0 soybean combine harvester. Three batches of soybean samples were randomly selected from the grain box, each of which weighed 30 kg. The soybean variety was Qihuang 34; the average moisture content of soybean grains was 11.9%; and the weight per 100 seeds was 25.58 g.

Sampling experiment of soybean mechanized harvesting. (a) 4LZ-6 soybean combine harvester; (b) 4LZ-2.5 soybean combine harvester; (c) 4LZ-2.0 soybean combine harvester.
As shown in Figure 7, using the three batches of soybean samples collected during the harvesting process, a test experiment was carried out on an indoor test bench to verify the detection performance of the soybean quality inspection system. Tests were numbered according to the sample batch. Test one represented the sample detection test of 4LZ-6 soybean combine harvester, Test two represented the sample detection test of 4LZ-2.5 soybean combine harvester, and Test three represents the sample detection test of 4LZ-2.0 soybean combine harvester.

Performance evaluation test setup of the soybean quality inspection system.
In the test, first, the test bench was prepared, and the power and data cables were connected. The soybean crushing and impurity rate monitoring device was installed under the discharge hopper of the test bench. Three batches of soybean samples were prepared. Three sample points were randomly and evenly selected for each batch of soybeans, and the crushing and impurity rates of the samples were manually checked referencing the NY/T738-2020 “Operation Quality of Soybean Combine Harvester” standard. 33 Then, the samples were poured into the test bench in batches, and automatic detection was performed. After a batch of soybean samples was tested, the soybean samples on the test bench were removed, and the next batch of soybean samples was tested. The test data were recorded and compared with the manual test results to verify the monitoring effect of the soybean quality test system.
Performance evaluation method of soybean quality inspection system
The existing detection methods of soybean crushing and impurity rates are based on the quality of seeds and impurities. However, these methods are not suitable for the calculation of the crushing and impurity rates based on image recognition. According to the existing measurement methods, this study developed a quantitative model of the crushing and impurity rates based on image recognition. In this model, the impurity and crushing rates in percent are respectively calculated as follows:


In this study, the absolute and relative errors of the average results of the proposed detection system and manual detection were used to evaluate the monitoring effect of the soybean quality detection system. The calculation formulas of the errors were as follows:


Results and discussion
Improved U-Net algorithm prediction effect
The traditional U-Net model and improved U-Net model were used to segment and recognize images in the test set, and the prediction results are shown in Figure 8. The improved U-Net mode could realize the online segmentation and recognition of different components of the grain sample. Impurities and intact grains in the detected samples were effectively identified and segmented. However, some of the crushing grains were unrecognized and misrecognized. The main reason was that the in-tact and crushing grains had highly similar characteristics, so the prediction model misidentified part of crushing grains as intact grains.

Prediction and recognition effect diagrams. (a) Original image; (b) Manually annotated map; (c) Prediction renderings by U-Net model; (d) Prediction renderings by improved U-Net model.
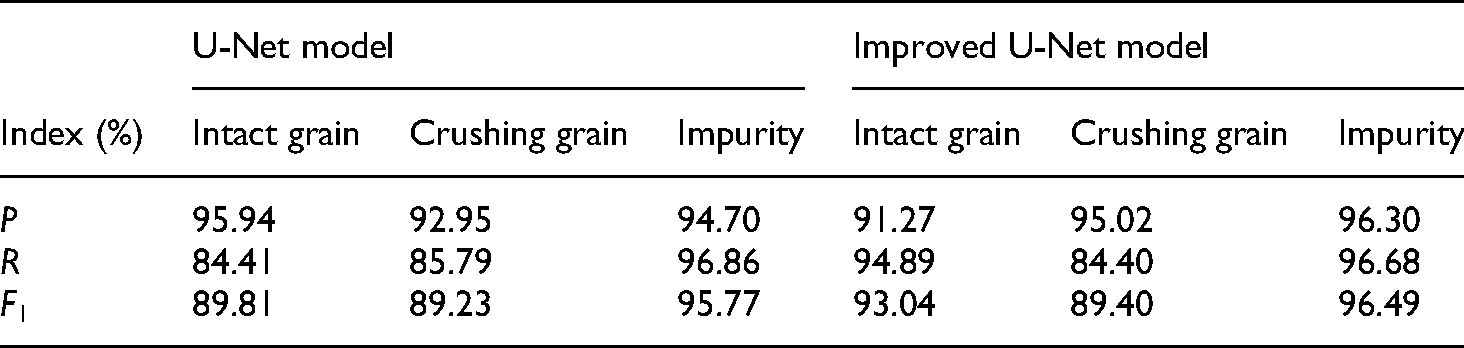
The accuracy rate, recall rate, and comprehensive rating index of the intact grains, crushing grains, and impurities were calculated using the U-Net model and the improved U-Net model’s segmentation results, and the results are shown in Table 1. According to the results, for the intact grains using the U-Net model, the comprehensive rating index F1 was 89.81%; for the crushing grains using the U-Net model, the comprehensive rating index F1 was 89.23%; finally, for the impurities using the U-Net model, the comprehensive rating index F1 was 95.77%. According to the results, for the intact grains using the improved U-Net model, the comprehensive rating index F1 was 93.04%; for the crushing grains using the improved U-Net model, the comprehensive rating index F1 was 89.40%; finally, for the impurities using the improved U-Net model, the comprehensive rating index F1 was 96.49%. In terms of the segmentation and recognition of different components, the effect of impurities was the best, followed by the intact grains, while the recognition effect of the crushing grains was relatively poor. The improved U-Net model in this paper outperforms the original U-Net model in detection performance, especially in the detection and identification of intact grain and impurity.
The segmentation effect of different components of the grain samples.
Performance evaluation test results of soybean quality inspection system
An image was randomly selected from the images collected in the performance evaluation test of the soybean quality inspection system, and it was manually labeled by the LabelMe tool to analyze the prediction segmentation effect of the improved U-Net. The prediction results are shown in Figure 9. The evaluation indicator values showed that for the intact grains, the accuracy rate was 94.28%, the recall rate was 93.76%, and the comprehensive rating index F1 was 94.02%; for the crushing grains, the accuracy rate was 96.73%, the recall rate was 95.22%, and the comprehensive rating index F1 was 95.97%; for the impurity, the accuracy rate was 97.67%, the recall rate was 91.35%, and the comprehensive rating index F1 was 94.40%.
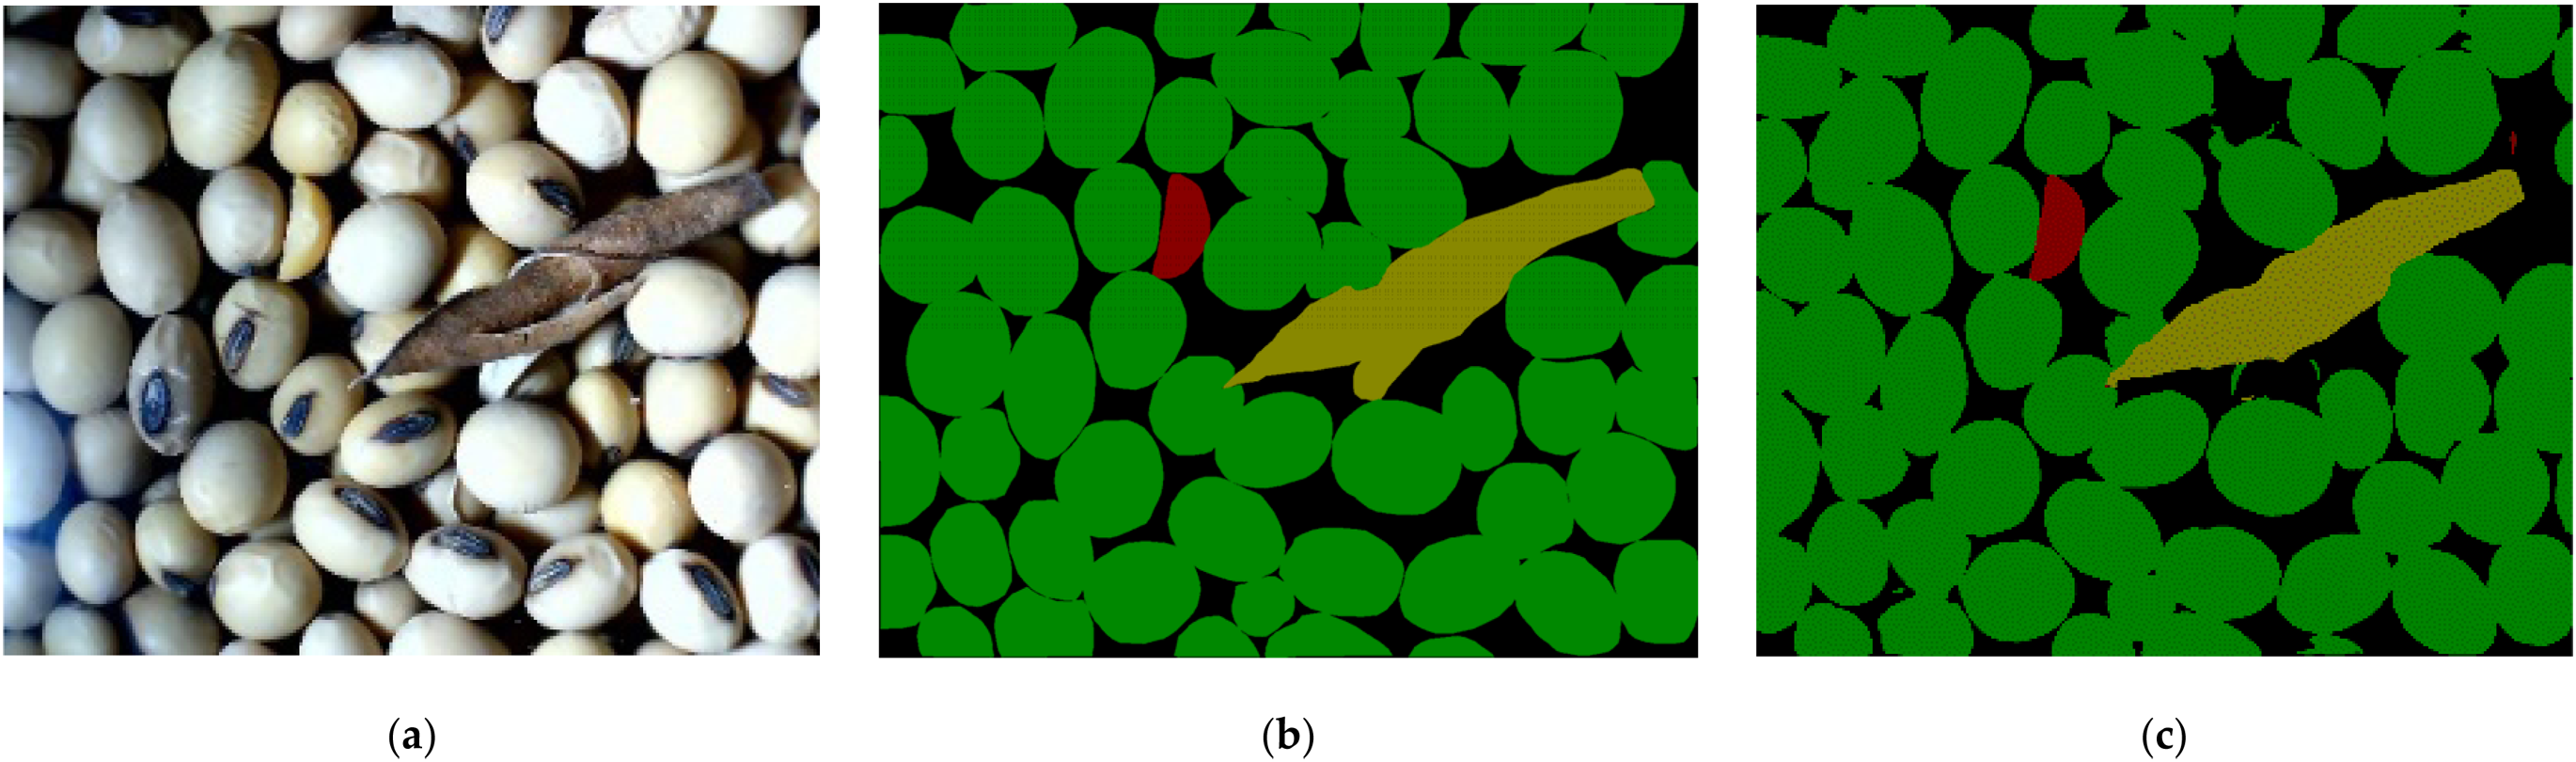
Performance verification test results of the image segmentation recognition. (a) Original image; (b) Manually annotate the map; (c) Prediction renderings.
During the experiment, the soybean quality inspection system operated normally and could realize dynamic online monitoring of soybean samples. The performance verification results of the soybean quality inspection system in test one are shown in Figure 10. The system detected the maximum crushing rate of the soybean sample batch of 12.4%, the minimum crushing rate of zero, and the average crushing rate of 2.72%; the maximum impurity rate was 5.82%, the minimum impurity rate was zero, and the average impurity rate was 0.60%. The manual test results are given in Table 2. In the manual test, the maximum crushing rate of the soybean sample batch was 3.26%, the minimum crushing rate was 1.27%,and the average crushing rate was 2.24%; the maximum impurity rate was 2.26%, the minimum impurity rate was 0.15%, and the average impurity rate was 1.26%.
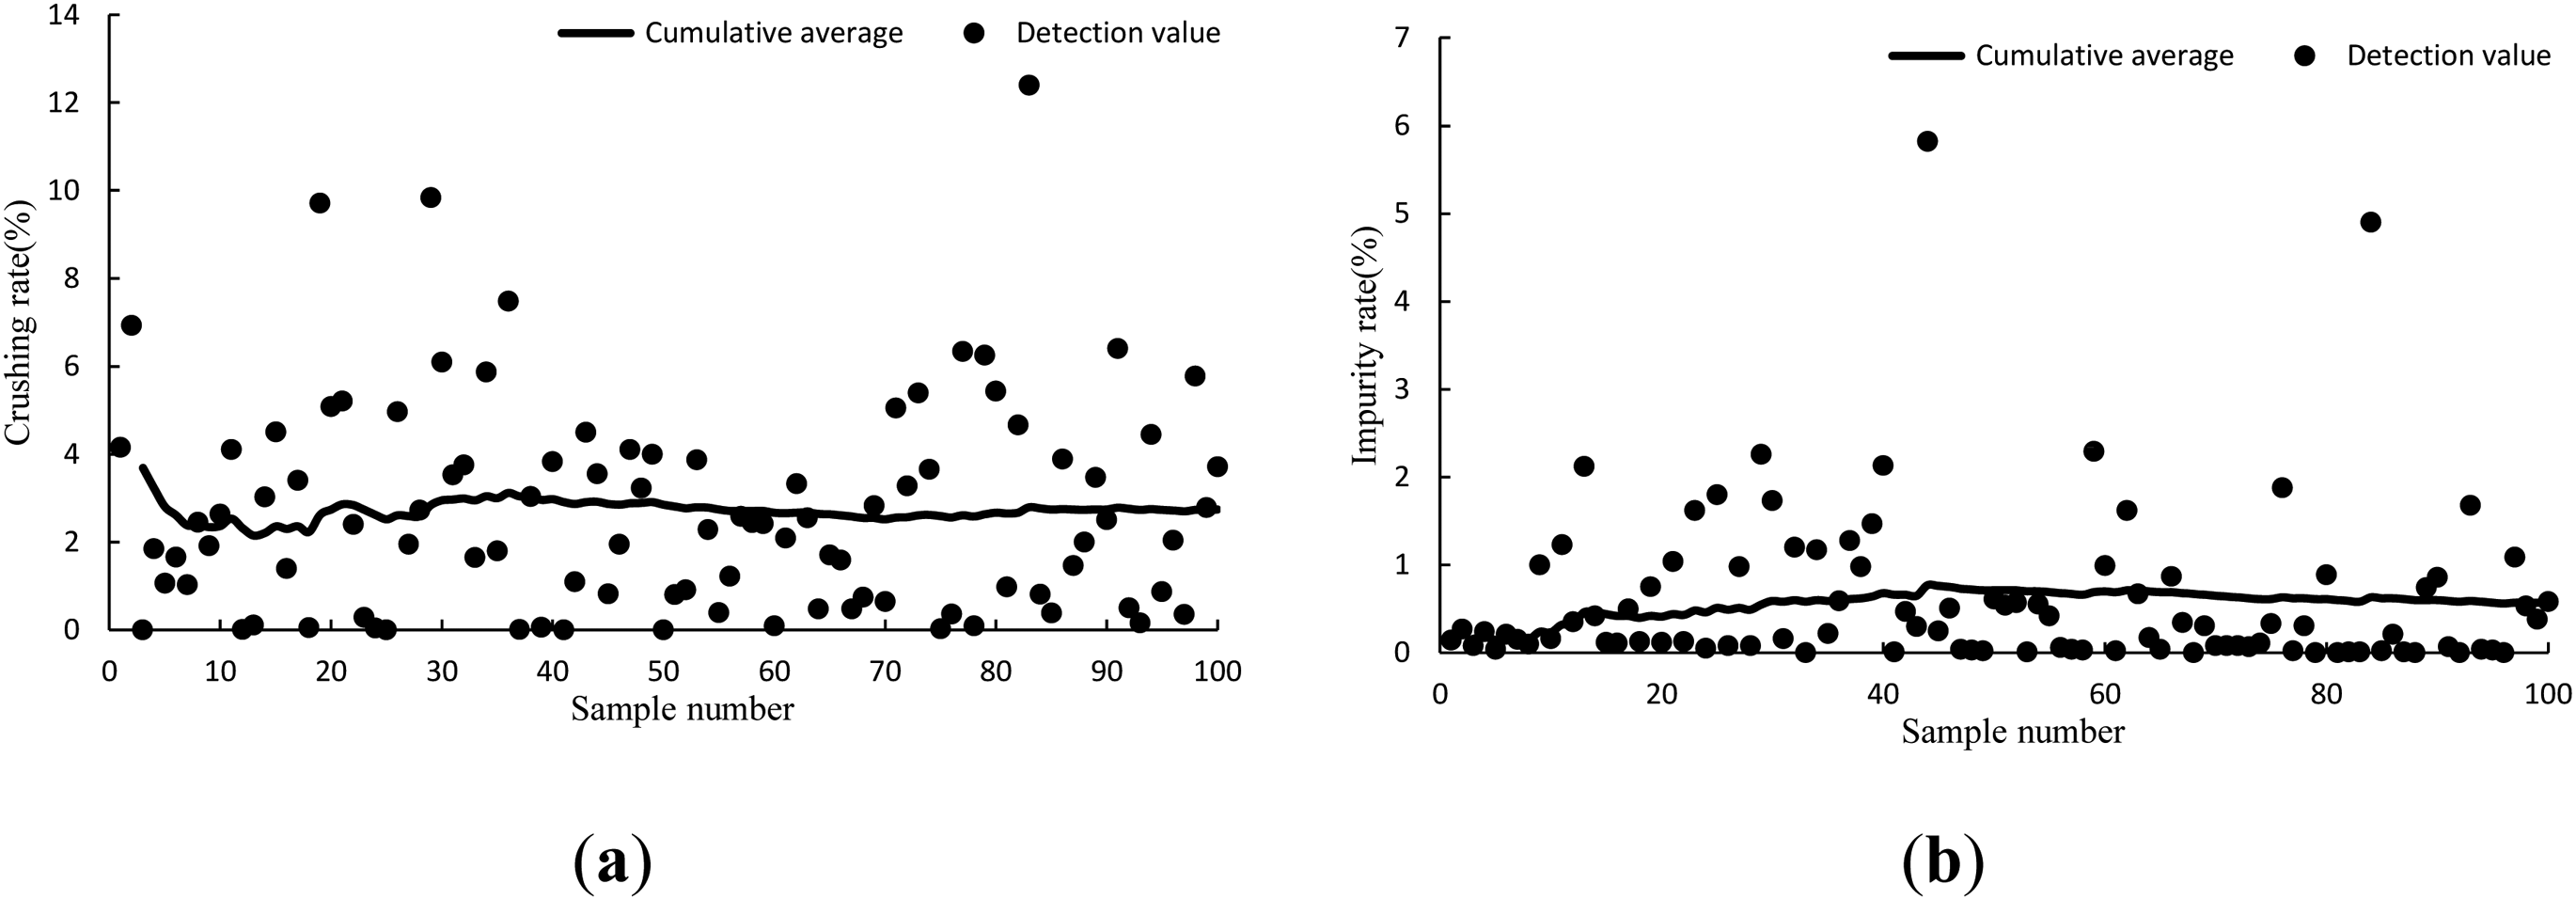
The performance verification results of the soybean quality inspection system in test one. (a) Crushing rate; (b) Impurity rate.
Manual inspection results in the performance verification test.

The performance verification results of the soybean quality inspection system in test two are presented in Figure 11. The system detected the maximum crushing rate of the soybean sample batch of 9.73%, the minimum crushing rate of zero, and the average crushing rate of 2.40%; the maximum impurity rate was 2.75%, the minimum impurity rate was zero, and the average impurity rate was 0.52%. The manual test results are displayed in Table 2. In the manual test, the maximum crushing rate of the soybean sample batch was 4.21%, the minimum crushing rate was 0.89%, and the average crushing rate was 2.14%; the maximum impurity rate was 1.78%, the minimum impurity rate was 0.62%, and the average impurity rate was 1.04%.

The performance verification results of the soybean quality inspection system in test two. (a) Crushing rate; (b) Impurity rate.
The performance verification results of the soybean quality inspection system in test three are shown in Figure 12. The system detected the maximum crushing rate of the soybean sample batch of 12.18%, the minimum crushing rate of zero, and the average crushing rate of 2.82%; the maximum impurity rate was 2.81%, the minimum impurity rate was zero, and the average impurity rate was 0.46%. The manual test results are presented in Table 2. In the manual test, the maximum crushing rate of the soybean sample batch was 3.10%, the minimum crushing rate was 1.52%, and the average crushing rate was 2.25%; the maximum impurity rate was 1.02%, the minimum impurity rate was 0.56%, and the average impurity rate was 0.85%.
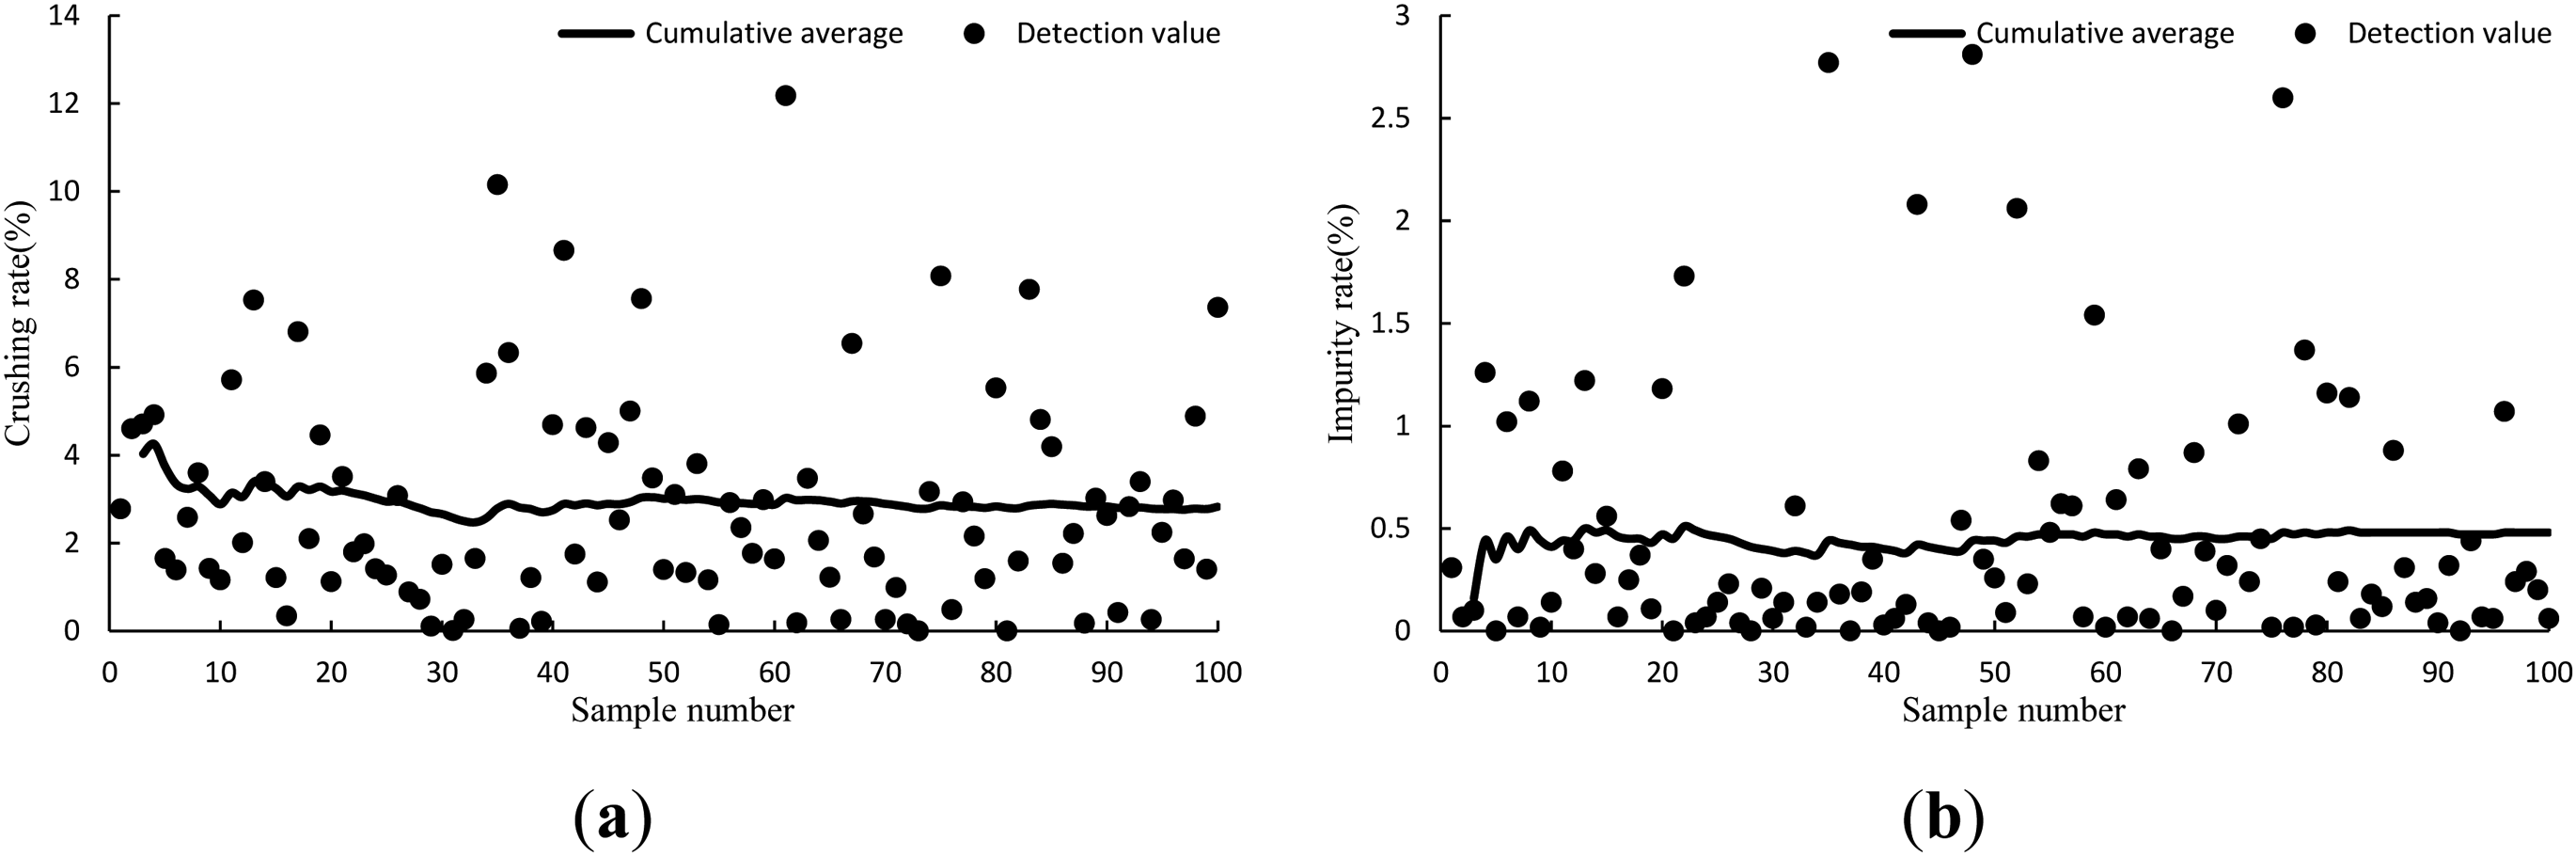
The performance verification results of the soybean quality inspection system in test three. (a) Crushing rate; (b) Impurity rate.
The image of the sample was dynamically obtained by this system, and the crushing rate and impurity rate of the sample were judged by identifying the sample image. However, the detection value of a single sample could not represent the real situation of the sample to be detected. The cumulative average value of the detection value was introduced and indicated the crushing rate and impurity rate of the detected sample. The curves of the cumulative average value of the samples’ crushing rates and impurity rates are presented in Figures 10–12. It could be concluded that the cumulative average value of the crushing rates and impurity rates of the sample batch tended to stabilize after the system had performed 20 sampling tests. After 20 sampling inspections, the cumulative average of the sample crushing rates and impurity rates of the test one was 2.74% and 0.57%, respectively. the cumulative average of the sample crushing rates and impurity rates of the test two was 2.41% and 0.53%, respectively. the cumulative average of the sample crushing rates and impurity rates of the test three was 2.82% and 0.48%, respectively. Therefore, for a single soybean sample batch, the average value of 20 sampling tests of the system could be used as a test value of samples.
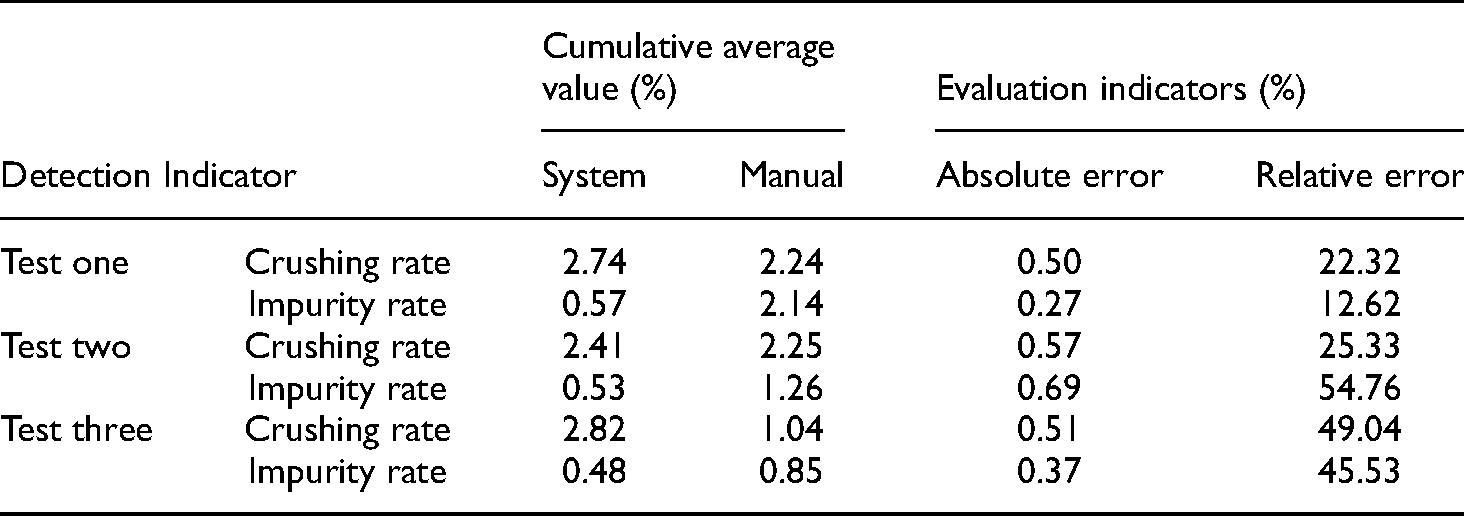
Table 3 shows the comparison of the results of the test of the proposed detection system and manual detection. For these three tests, the cumulative average value of the crushing rate of soybean samples detected by the proposed system were 2.74% and 2.41% and 2.82%, respectively; the cumulative average value of the impurity rate of soybean samples detected by the proposed system were 0.57% and 0.53% and 0.48%, respectively. For manual detection, the cumulative average value of the crushing rate of soybean samples was 2.24% and 2.25% and 1.04%, respectively; the cumulative average value of the impurity rate of soybean samples was 2.14% and 1.26% and 0.85%, respectively. For this experiment, the maximum relative and absolute detection errors of the crushing rate of soybean samples were 0.57% and 49.04%, respectively. The maximum absolute and relative errors of the impurity rate were 0.69% and 54.76%, respectively. The relative detection error of the impurity rate was relatively large because the impurity rate of the samples was low, and even a slight deviation in the detection result could cause the relative error to increase.
Statistical results of the performance verification tests.
Discussion
According to the NY/T738-2020 “Operation Quality of Soybean Combine Harvesters” standard, the quality of mechanically harvested soybeans should satisfy the crushing rate of less than or equal to 5% and the impurity rate of less than or equal to 3%. The detection results of the proposed soybean quality detection system and manual detection were consistent. It should be noted that soybean samples used in the experiment were assumed to meet the harvest standards. Consequently, the proposed soybean quality detection system could be used as an effective tool for real-time online detection of soybean quality.
At this stage, the degree of automation of grain combine harvesters in China is low, and there is a lack of information monitoring system for the operation process of the combine harvester, and the harvest quality is heavily dependent on the driver's experience. The combine harvester driver adjusts the opening of the upper/lower sieve, fan speed, and damper opening of the cleaning components by himself before the operation. However, due to the complex relationship between these parameters, not every driver can master them, and it is difficult to ensure that the combine harvester is in an optimal operating state, which may easily lead to uneven harvesting quality. The online detection method of soybean crushing and impurity content studied in this paper can help the driver to understand the harvesting situation in real-time. Adjust the operating parameters of the machinery and tools to ensure that the machinery and tools are in the optimal state, timely reduce the crushing rate and impurity content of the mechanized harvesting process, and then improve the quality of soybean mechanized harvesting.
Conclusions
The main contributions of this work can be summarized as follows:
An online detection method of the soybean harvesting quality based on an improved U-Net is proposed. This method can identify the intact grains, crushing grains, and impurities in dynamically collected sample images. It uses the quantitative model to calculate the crushing and impurity rates of soybean samples, which can provide technical support for the online detection of soybean mechanized harvesting quality. The improved U-Net network is used to segment identified soybean images. The comprehensive evaluation index F1 values of the intact grains, crushing grains, and impurities are 93.04%, 89.40%, and 96.49%, respectively. The performance verification test of the soybean quality detection system shows that the relative and absolute detection errors of the soybean sample crushing rate are 0.24% and 10.86%, respectively. For impurities, the relative and absolute errors are 37.14% and 0.39%, respectively. According to the NY/T738-2020 “Soybean Combine Harvester Operation Quality” standard, the results of the soybean quality inspection system and manual inspection are consistent, so the proposed soybean quality inspection system could be used as an effective tool for real-time online inspection of soybean quality.
Footnotes
Declaration of conflicting interests
The author(s) declared no potential conflicts of interest with respect to the research, authorship, and/or publication of this article.
Funding
The author(s) disclosed receipt of the following financial support for the research, authorship, and/or publication of this article: This work was supported by the Jiangsu Agriculture Science and Technology Innovation Fund, Basic scientific research business expenses of central-level public welfare scientific research institutes, National Key Research and Development Plan Project of China, Jiangsu Province Modern Agricultural Machinery Equipment and Technology Demonstration Promotion Project, (grant number CX(20)1007, S202217, 2021YFD2000503, NJ2020-25).